| Share Name | Share Symbol | Market | Type |
|---|---|---|---|
| Trans Global Group Inc (CE) | USOTC:TGGI | OTCMarkets | Common Stock |
| Price Change | % Change | Share Price | Bid Price | Offer Price | High Price | Low Price | Open Price | Shares Traded | Last Trade | |
|---|---|---|---|---|---|---|---|---|---|---|
| 0.00 | 0.00% | 0.0001 | 0.0001 | 0.0001 | 0.0001 | 2,105,248 | 01:00:00 |
February 25, 2022 -- InvestorsHub NewsWire -- via Pennymillions.com
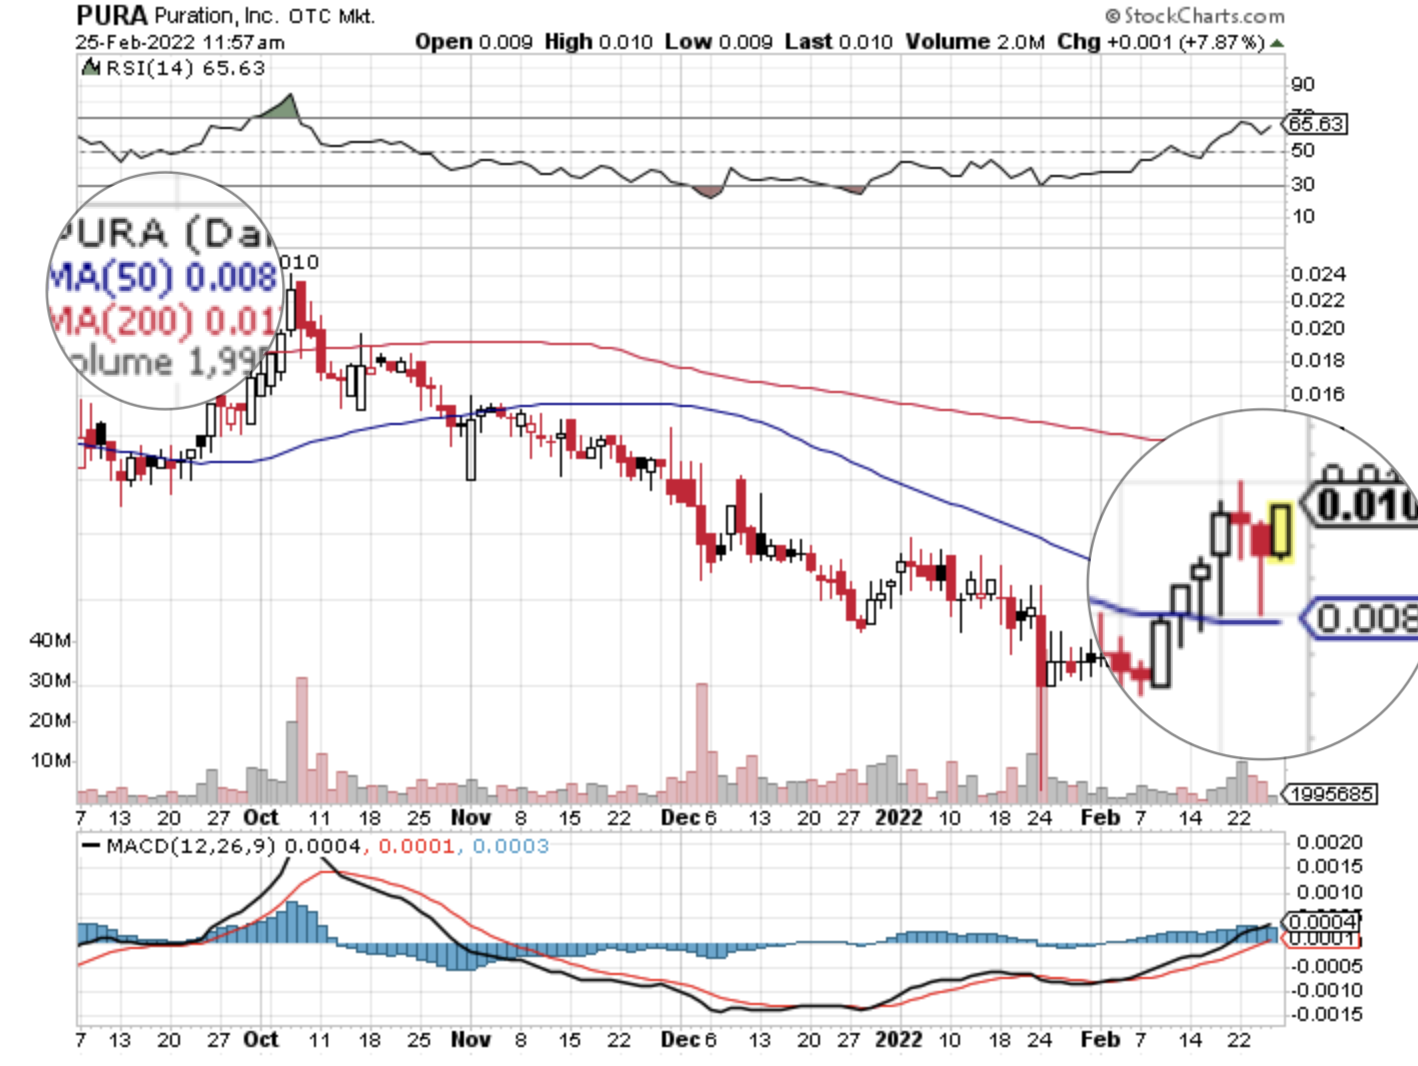
Puration, Inc. has been making steady gains breaking through the $0.008 50 Day Moving Average (MA) and soundly holding its ground even through post gain profit taking. Now the PPS is testing $0.01 advancing on a $0.013 200 Day MA. A retrace back to the 52 Week High of $0.034 could deliver a quick and tidy 3X ROI.
SOURCE: pennymillions
1 Year Trans Global (CE) Chart |
1 Month Trans Global (CE) Chart |

It looks like you are not logged in. Click the button below to log in and keep track of your recent history.
Support: +44 (0) 203 8794 460 | support@advfn.com
By accessing the services available at ADVFN you are agreeing to be bound by ADVFN's Terms & Conditions

 Hot Features


