| Name | Symbol | Market | Type |
|---|---|---|---|
| Nabors Industries Ltd (QB) | USOTC:NBRWF | OTCMarkets | Equity Warrant |
| Price Change | % Change | Price | Bid Price | Offer Price | High Price | Low Price | Open Price | Traded | Last Trade | |
|---|---|---|---|---|---|---|---|---|---|---|
| 0.00 | 0.00% | 1.85 | 1.75 | 1.95 | 34 | 13:30:05 |
UNITED STATES
SECURITIES AND EXCHANGE COMMISSION
Washington, D.C. 20549
Form
CURRENT REPORT
PURSUANT TO SECTION 13 OR 15(d) OF THE
SECURITIES EXCHANGE ACT OF 1934
Date of Report (Date of earliest event reported):
(Exact name of registrant as specified in its charter)
| (State or Other Jurisdiction of Incorporation or Organization) |
(Commission File Number) | (I.R.S. Employer Identification No.) |
| N/A | ||
| (Address of principal executive offices) | (Zip Code) |
(
(Registrant’s telephone number, including area code)
N/A
(Former name or former address, if changed since last report.)
Check the appropriate box below if the Form 8-K filing is intended to simultaneously satisfy the filing obligation of the registrant under any of the following provisions:
| Written communications pursuant to Rule 425 under the Securities Act (17 CFR 230.425) |
| Soliciting material pursuant to Rule 14a-12 under the Exchange Act (17 CFR 240.14a-12) |
| Pre-commencement communications pursuant to Rule 14d-2(b) under the Exchange Act (17 CFR 240.14d-2(b)) |
| Pre-commencement communications pursuant to Rule 13e-4(c) under the Exchange Act (17 CFR 240.13e-4(c)) |
| Title of each class | Trading Symbol(s) | Name of exchange on which registered | ||
Indicate by check mark whether the registrant is an emerging growth company as defined in Rule 405 of the Securities Act of 1933 (§230.405 of this chapter) or Rule 12b-2 of the Securities Exchange Act of 1934 (§240.12b-2 of this chapter).
Emerging growth
company
If an emerging growth company, indicate by check mark if the registrant has elected not to use the extended transition period for complying with any new or revised financial accounting standards provided pursuant to Section 13(a) of the Exchange Act. ¨
Item 2.02 Results of Operations and Financial Condition.
On October 22, 2024, Nabors Industries Ltd. (“Nabors”) issued a press release announcing its results of operations for the three months ended September 30, 2024. A copy of that release is furnished herewith as Exhibit 99.1 and is incorporated herein by reference.
On October 23, 2024, Nabors will hold a conference call at 11:00 a.m. Central Time, regarding the Company’s financial results for the quarter ended September 30, 2024. Information about the call-including dial-in information, recording and replay of the call, and supplemental information-is available on the Investor Relations page of www.nabors.com.
The information in this Item 2.02, including Exhibits 99.1 and 99.2, shall not be deemed “filed” for purposes of Section 18 of the Securities Exchange Act, of 1934 or otherwise subject to liabilities of that Section or Sections 11 and 12(a)(2) of the Securities Act of 1933.
Item 9.01 Financial Statements and Exhibits.
(d) Exhibits.
| Exhibit No. |
Description | |
| 99.1 | Press Release | |
| 99.2 | Investor Information | |
| 104 | Cover Page Interactive Data File (embedded within the Inline XBRL document) |
Cautionary Statement Regarding Forward-Looking Statements
This communication includes forward-looking statements within the meaning of the Securities Act and the Securities Exchange Act of 1934. Words such as “expects,” “believes,” “may,” “should,” “will,” “intends,” “projects,” “plans,” “estimates,” “targets,” “anticipates,” and other similar words or expressions, or the negative thereof, generally can be used to help identify these forward-looking statements. Such forward-looking statements are subject to a number of risks and uncertainties, as disclosed by Nabors from time to time in its filings with the SEC. Risks and uncertainties related to the proposed transaction include, but are not limited to: the failure of Nabors’ shareholders or Parker’s shareholders to approve the proposed transaction; the risk that the conditions to the closing of the proposed transaction are not satisfied; the risk that regulatory approvals required for the proposed transaction are not obtained or are obtained subject to conditions that are not anticipated; potential adverse reactions or changes to business relationships resulting from the announcement or completion of the proposed transaction; uncertainties as to the timing of the proposed transaction; competitive responses to the proposed transaction; costs and difficulties related to the integration of Parker’s businesses and operations with Nabors’ business and operations; the inability to obtain, or delays in obtaining, cost savings and synergies from the proposed transaction; unexpected costs, charges or expenses resulting from the proposed transaction; litigation relating to the proposed transaction; the inability to attract, retain or motivate key personnel; changes in the market value of Nabors common shares as a result of the announcement of the proposed transaction; any changes in general economic and/or industry specific conditions; and other risks and uncertainties described in the Nabors’ periodic reports on Forms 10-K and 10-Q that Nabors files with the SEC. As a result of these factors, Nabors’ actual results may differ materially from those indicated or implied by such forward-looking statements. The forward-looking statements contained in this Form 8-K reflect management’s estimates and beliefs as of the date of this Form 8-K. Nabors does not undertake to update these forward-looking statements except as may be required by law.
No Offer or Solicitation
This communication is not intended to and shall not constitute an offer to sell or the solicitation of an offer to sell or the solicitation of an offer to buy any securities or a solicitation of any vote of approval, nor shall there be any sale of securities in any jurisdiction in which such offer, solicitation or sale would be unlawful prior to registration or qualification under the securities laws of any such jurisdiction. No offering of securities shall be made except by means of a prospectus meeting the requirements of Section 10 of the Securities Act of 1933, as amended.
Important Additional Information and Where to Find It
In connection with the proposed transaction Nabors will file with the SEC a Registration Statement on Form S-4 to register the shares of Nabors capital stock to be issued in connection with the proposed transaction. The Registration Statement will include a joint proxy statement/prospectus of Nabors and Parker. The definitive joint proxy statement/prospectus will be sent to the shareholders of each of Nabors and Parker seeking their approval of the proposed transaction and other related matters.
WE URGE INVESTORS AND SECURITY HOLDERS TO READ THE REGISTRATION STATEMENT ON FORM S-4 AND THE JOINT PROXY STATEMENT/PROSPECTUS INCLUDED WITHIN THE REGISTRATION STATEMENT ON FORM S-4 AND ANY OTHER RELEVANT DOCUMENTS WHEN THEY BECOME AVAILABLE, BECAUSE THEY WILL CONTAIN IMPORTANT INFORMATION ABOUT PARKER, NABORS AND THE PROPOSED TRANSACTION. Investors and security holders will be able to obtain these materials (when they are available) and other documents filed with the SEC by Nabors or Parker free of charge at the SEC’s website, www.sec.gov, or from Nabors at its website, www.nabors.com, or from Parker at its website, www.parkerwellbore.com.
Participants in the Solicitation
Nabors and certain of its directors, executive officers and other employees, and Parker and certain of its directors, executive officers and other employees may be deemed to be participants in the solicitation of proxies for security holder approvals to be obtained for the proposed transaction. A description of participants’ direct or indirect interests, by security holdings or otherwise, will be included in the joint proxy statement/prospectus relating to the proposed transaction when it is filed with the SEC. Information regarding Nabors’ directors and executive officers is available in its proxy statement filed with the SEC on April 25, 2024 in connection with its 2024 annual meeting of shareholders (the “Annual Meeting Proxy Statement”) under “Proposal 1-Election of Directors- Director Nominees,” “Proposal 1-Election of Directors-Other Executive Officers,” “Compensation Discussion and Analysis” and “Share Ownership of Directors and Executive Officers.” To the extent holdings of securities by potential Nabors participants (or the identity of such participants) have changed since the information printed in the Annual Meeting Proxy Statement, such information has been or will be reflected on Nabors’ Statements of Change in Ownership on Forms 3 and 4 filed with the SEC. You may obtain free copies of these documents using the sources indicated above. Information regarding Parker’s directors and executive officers is available on Parker’s website as indicated above.
SIGNATURES
Pursuant to the requirements of the Securities Exchange Act of 1934, the Registrant has duly caused this report to be signed on its behalf by the undersigned hereunto duly authorized.
| NABORS INDUSTRIES LTD. | ||
| Date: October 22, 2024 | By: | /s/ Mark D. Andrews |
| Name: Mark D. Andrews | ||
| Title: Corporate Secretary | ||
Exhibit 99.1
 |
NEWS RELEASE |
Nabors Announces Third Quarter 2024 Results
HAMILTON, Bermuda, October 22, 2024 /PRNewswire/ - Nabors Industries Ltd. (“Nabors” or the “Company”) (NYSE: NBR) today reported third quarter 2024 operating revenues of $732 million, compared to operating revenues of $735 million in the second quarter. The net loss attributable to Nabors shareholders for the quarter was $56 million, compared to a net loss of $32 million in the second quarter. This equates to a loss of $6.86 per diluted share, compared to a loss per diluted share of $4.29 in the second quarter. The third quarter included net charges totaling approximately $25 million, primarily reflecting the redemption premium on the 2026 notes and market adjustments on investments. Third quarter adjusted EBITDA was $222 million, compared to $218 million in the previous quarter.
Highlights
| o | Last week, Nabors announced the signing of an agreement to acquire Parker Wellbore. Parker’s lines of business include the leading franchise in U.S. tubular rentals – Quail Tools – as well as international tubular rentals, well construction services (including casing running), and drilling rigs. Parker expects to generate EBITDA of $180 million this year. Nabors has identified synergies potential at an annualized run-rate of $35 million within 12 months of closing. Nabors will acquire all of Parker’s issued and outstanding common stock in exchange for 4.8 million shares of Nabors common stock, subject to a share price collar. Nabors will also assume approximately $100 million in net debt. |
| o | Nabors Lower 48 rigs once again set notable performance milestones. A major operator in the Delaware Basin drilled three wells each with four-mile laterals, utilizing a Nabors PACE®-X rig equipped with a Canrig® Sigma topdrive. Sigma’s rated torque is the industry’s highest and is ideal for the larger-diameter drill pipe run on these wells. The rig also employed an NDS technology package. |
| o | A large operator in the Eagle Ford drilled its longest well in the basin, incorporating a lateral length of more than four miles. The lateral was drilled in a single run without the use of rotary steerable systems. The rig was a Nabors PACE®-M1000, utilizing larger-diameter drill pipe. |
| o | A large operator in the Bakken completed a four-mile lateral in a single run in under 12 days, utilizing a Nabors PACE®-X rig. This well is the operator’s first four-mile lateral, and the operator believes it is the quickest in the Bakken. The rig was equipped with a comprehensive package of NDS Smart technology. |
Anthony G. Petrello, Nabors Chairman, CEO and President, commented, “We are excited as we move forward with our announced acquisition of Parker Wellbore. Our companies’ portfolios are highly complementary. Parker’s recent track record speaks for itself. Quail Tools, already the leader in its space, plays a key role as operators extend the lengths of their wellbore laterals. The transaction increases our scale, provides incremental growth and improves our leverage metrics.
1
| NEWS RELEASE |
“Our third quarter operating results matched our overall expectations. Higher average daily margins and an improved mix drove growth in our International Drilling segment. International growth also resulted in better performance for our Drilling Solutions segment.
“Daily margins in our International Drilling segment exceeded the $17,000 mark in the third quarter. We reached this milestone earlier than we expected. This result demonstrates the earnings power of our International segment. During the quarter we also started up previously awarded rigs. We have a path to substantial international growth with 13 rigs scheduled to deploy through early 2026 in the Middle East and Latin America. The opportunity set on top of those planned start-ups is also substantial.
“In the Lower 48 market, our leading-edge pricing remained stable, supporting daily rig margins that were essentially in line with our expectations. Our average rig count was just under the prior quarter. Although we have not yet seen the anticipated increases in gas-directed drilling or a recovery from reductions driven by E&P consolidation, we look forward to an improvement in Lower 48 drilling activity in 2025.”
Segment Results
International Drilling adjusted EBITDA totaled $116.0 million, compared to $106.4 million in the second quarter. Average rig count increased to 85 from 84, driven by rig additions in Algeria and Saudi Arabia. Daily adjusted gross margin for the third quarter averaged $17,085, an increase of more than $1,000 compared to the prior quarter.
The U.S. Drilling segment reported third quarter adjusted EBITDA of $108.7 million, compared to $114.0 million in the second quarter. Nabors’ third quarter Lower 48 average rig count totaled 68, versus 69 in the second quarter. Daily adjusted gross margin in the Lower 48 averaged $15,051, versus $15,598 in the prior quarter.
Drilling Solutions adjusted EBITDA increased to $34.3 million, compared to $32.5 million in the second quarter. This growth was driven by higher revenue in international markets of approximately 8% and higher penetration of performance software on Nabors U.S. rigs.
Rig Technologies’ adjusted EBITDA was $6.1 million, versus $7.3 million in the second quarter. The decrease was spread across several business lines in the U.S., mainly capital equipment, spare parts, and energy transition.
Adjusted Free Cash Flow
Adjusted free cash flow was $18 million in the third quarter compared to $57 million in the preceding quarter. Capital expenditures totaled $118 million, including $37 million supporting the newbuilds in Saudi Arabia. This compares to $138 million in the second quarter, including $56 million supporting the newbuilds. The third quarter included two and a half additional months of interest payments for the notes issued late last year, translating into $11.7 million of interest. The first coupon payment for the notes occurred eight months after the notes were issued. Total interest payments for the quarter were $82 million, compared to $31 million in the prior quarter.
2
| NEWS RELEASE |
William Restrepo, Nabors CFO, stated, “Last week we signed an agreement to acquire Parker Wellbore. The transaction is well aligned with our long-term strategy. It grows our capex-light NDS business, expands our international footprint, and helps us delever Nabors. Additionally, Parker is on track to earn meaningful EBITDA this year, totaling $180 million with attractive growth. Finally, Parker comes with low debt and it generates positive cash flow. This is before targeted annual synergies of $35 million. We are excited about the addition of Parker to the Nabors platform.
“Nabors’ third quarter results met our outlook. Daily adjusted gross margin in our International Drilling segment expanded by more than $1,000. We reached the $17,000 daily margin target a quarter ahead of schedule, driven by exceptional performances in Saudi Arabia and Latin America, which both increased daily margins, by $1,200 and $1,300 respectively. We have three rigs scheduled to deploy in the fourth quarter, each with attractive economics. These deployments will be somewhat offset by the 12-month suspension of three lower-margin rigs in the Kingdom.
“Strength in the international markets also led to sequential growth in our Drilling Solutions business. We experienced an increase in international casing running jobs, augmented by greater deployment of performance software products, driving the segment’s gross margin above 53%.
“In our Lower 48 drilling business, pricing discipline and strict expense control maintained our average daily margin above $15,000 and in line with our forecast. We expect relative stability in the fourth quarter in both margin and rig count. Our rig count forecast is dependent on stable oil prices, a similar level of churn, and stability in the overall market.
“Our capital spending target for the fourth quarter is now $230 million, with capital expenditures for SANAD newbuilds forecast at $105 million. The resulting annual capital spending forecast for 2024 is now $600 million, including $230 million related to the SANAD newbuilds. SANAD’s rig supplier has improved its performance in reaching manufacturing milestones. We now expect earlier delivery of our rigs going forward. This has accelerated approximately $40 million of newbuild capital spending into 2024. We are targeting reductions in various markets to offset this increase.
“Given the SANAD newbuild capital expenditures moving forward to 2024, the recent rig suspensions by Saudi Aramco and the slightly lower U.S. activity in the fourth quarter, we now expect our full year free cash flow to close the year between $100 and $130 million.”
Outlook
Nabors expects the following metrics for the fourth quarter of 2024:
U.S. Drilling
| o | Lower 48 average rig count of approximately 68 rigs |
| o | Lower 48 daily adjusted gross margin of $15,000 |
3
| NEWS RELEASE |
| o | Alaska and Gulf of Mexico combined adjusted EBITDA up approximately $1.5 million versus the third quarter, with an additional rig starting work in Alaska |
International
| o | Average rig count of approximately 84 rigs |
| o | Daily adjusted gross margin of approximately $17,000 |
Drilling Solutions
| o | Adjusted EBITDA of $36 to $37 million |
Rig Technologies
| o | Adjusted EBITDA of $9 to $10 million |
Capital Expenditures
| o | Capital expenditures of $230 million, with $105 million for the newbuilds in Saudi Arabia |
| o | Full-year capital expenditures of approximately $600 million, with $230 million for the SANAD newbuilds |
| o | This forecast includes accelerated timelines from SANAD’s rig supplier totaling an estimated $40 million |
Adjusted Free Cash Flow
| o | Full-year adjusted free cash flow of $100 to $130 million |
Mr. Petrello concluded, “The results from our International Drilling segment demonstrate the value we are building in this business. With our pending rig deployments across markets, our path to future growth is well defined. Our success is driven in large part from our advanced technology. We see the global client base increasingly embracing the benefits of our solutions.”
4
| NEWS RELEASE |
About Nabors Industries
Nabors Industries (NYSE: NBR) is a leading provider of advanced technology for the energy industry. With presence in more than 20 countries, Nabors has established a global network of people, technology and equipment to deploy solutions that deliver safe, efficient and responsible energy production. By leveraging its core competencies, particularly in drilling, engineering, automation, data science and manufacturing, Nabors aims to innovate the future of energy and enable the transition to a lower-carbon world. Learn more about Nabors and its energy technology leadership: www.nabors.com.
Forward-looking Statements
The information included in this press release includes forward-looking statements within the meaning of the Securities Act of 1933 and the Securities Exchange Act of 1934. Such forward-looking statements are subject to a number of risks and uncertainties, as disclosed by Nabors from time to time in its filings with the Securities and Exchange Commission. As a result of these factors, Nabors' actual results may differ materially from those indicated or implied by such forward-looking statements. The forward-looking statements contained in this press release reflect management's estimates and beliefs as of the date of this press release. Nabors does not undertake to update these forward-looking statements.
Non-GAAP Disclaimer
This press release presents certain “non-GAAP” financial measures. The components of these non-GAAP measures are computed by using amounts that are determined in accordance with accounting principles generally accepted in the United States of America (“GAAP”). Adjusted operating income (loss) represents income (loss) from continuing operations before income taxes, interest expense, investment income (loss), and other, net. Adjusted EBITDA is computed similarly, but also excludes depreciation and amortization expenses. In addition, adjusted EBITDA and adjusted operating income (loss) exclude certain cash expenses that the Company is obligated to make. Net debt is calculated as total debt minus the sum of cash, cash equivalents and short-term investments.
Adjusted free cash flow represents net cash provided by operating activities less cash used for capital expenditures, net of proceeds from sales of assets. Management believes that adjusted free cash flow is an important liquidity measure for the company and that it is useful to investors and management as a measure of the company’s ability to generate cash flow, after reinvesting in the company for future growth, that could be available for paying down debt or other financing cash flows, such as dividends to shareholders. Management believes that this non-GAAP measure is useful information to investors when comparing our cash flows with the cash flows of other companies.
5
| NEWS RELEASE |
Each of these non-GAAP measures has limitations and therefore should not be used in isolation or as a substitute for the amounts reported in accordance with GAAP. However, management evaluates the performance of its operating segments and the consolidated Company based on several criteria, including Adjusted EBITDA, adjusted operating income (loss), net debt, and adjusted free cash flow, because it believes that these financial measures accurately reflect the Company’s ongoing profitability, performance and liquidity. Securities analysts and investors also use these measures as some of the metrics on which they analyze the Company’s performance. Other companies in this industry may compute these measures differently. Reconciliations of consolidated adjusted EBITDA and adjusted operating income (loss) to income (loss) from continuing operations before income taxes, net debt to total debt, and adjusted free cash flow to net cash provided by operations, which are their nearest comparable GAAP financial measures, are included in the tables at the end of this press release. We do not provide a forward-looking reconciliation of our outlook for Segment Adjusted EBITDA, Segment Gross Margin or Adjusted Free Cash Flow, as the amount and significance of items required to develop meaningful comparable GAAP financial measures cannot be estimated at this time without unreasonable efforts. These special items could be meaningful.
Investor Contacts: William C. Conroy, CFA, Vice President of Corporate Development & Investor Relations, +1 281-775-2423 or via e-mail william.conroy@nabors.com, or Kara Peak, Director of Corporate Development & Investor Relations, +1 281-775-4954 or via email kara.peak@nabors.com. To request investor materials, contact Nabors' corporate headquarters in Hamilton, Bermuda at +441-292-1510 or via e-mail mark.andrews@nabors.com
No Offer or Solicitation
This communication is not intended to and shall not constitute an offer to sell or the solicitation of an offer to sell or the solicitation of an offer to buy any securities or a solicitation of any vote of approval, nor shall there be any sale of securities in any jurisdiction in which such offer, solicitation or sale would be unlawful prior to registration or qualification under the securities laws of any such jurisdiction. No offering of securities shall be made except by means of a prospectus meeting the requirements of Section 10 of the Securities Act of 1933, as amended.
Important Additional Information and Where to Find It
In connection with the proposed transaction with Parker, Nabors will file with the SEC a Registration Statement on Form S-4 to register the shares of Nabors capital stock to be issued in connection with the proposed transaction. The Registration Statement will include a joint proxy statement/prospectus of Nabors and Parker. The definitive joint proxy statement/prospectus will be sent to the shareholders of each of Nabors and Parker seeking their approval of the proposed transaction and other related matters.
6
| NEWS RELEASE |
WE URGE INVESTORS AND SECURITY HOLDERS TO READ THE REGISTRATION STATEMENT ON FORM S-4 AND THE JOINT PROXY STATEMENT/PROSPECTUS INCLUDED WITHIN THE REGISTRATION STATEMENT ON FORM S-4 AND ANY OTHER RELEVANT DOCUMENTS WHEN THEY BECOME AVAILABLE, BECAUSE THEY WILL CONTAIN IMPORTANT INFORMATION ABOUT PARKER, NABORS AND THE PROPOSED TRANSACTION. Investors and security holders will be able to obtain these materials (when they are available) and other documents filed with the SEC by Nabors or Parker free of charge at the SEC’s website, www.sec.gov, or from Nabors at its website, www.nabors.com, or from Parker at its website, www.parkerwellbore.com.
Participants in the Solicitation
Nabors and certain of its directors, executive officers and other employees, and Parker and certain of its directors, executive officers and other employees may be deemed to be participants in the solicitation of proxies for security holder approvals to be obtained for the proposed transaction. A description of participants’ direct or indirect interests, by security holdings or otherwise, will be included in the joint proxy statement/prospectus relating to the proposed transaction when it is filed with the SEC. Information regarding Nabors’ directors and executive officers is available in its proxy statement filed with the SEC on April 25, 2024 in connection with its 2024 annual meeting of shareholders (the “Annual Meeting Proxy Statement”) under “Proposal 1—Election of Directors— Director Nominees,” “Proposal 1—Election of Directors—Other Executive Officers,” “Compensation Discussion and Analysis” and “Share Ownership of Directors and Executive Officers.” To the extent holdings of securities by potential Nabors participants (or the identity of such participants) have changed since the information printed in the Annual Meeting Proxy Statement, such information has been or will be reflected on Nabors’ Statements of Change in Ownership on Forms 3 and 4 filed with the SEC. You may obtain free copies of these documents using the sources indicated above. Information regarding Parker’s directors and executive officers is available on Parker’s website as indicated above.
7
NABORS INDUSTRIES LTD. AND SUBSIDIARIES
CONDENSED CONSOLIDATED STATEMENTS OF INCOME (LOSS)
(Unaudited)
| Three Months Ended | Nine Months Ended | |||||||||||||||||||
| September 30, | June 30, | September 30, | ||||||||||||||||||
| (In thousands, except per share amounts) | 2024 | 2023 | 2024 | 2024 | 2023 | |||||||||||||||
| Revenues and other income: | ||||||||||||||||||||
| Operating revenues | $ | 731,805 | $ | 733,974 | $ | 734,798 | $ | 2,200,307 | $ | 2,280,180 | ||||||||||
| Investment income (loss) | 11,503 | 10,169 | 8,181 | 29,885 | 31,778 | |||||||||||||||
| Total revenues and other income | 743,308 | 744,143 | 742,979 | 2,230,192 | 2,311,958 | |||||||||||||||
| Costs and other deductions: | ||||||||||||||||||||
| Direct costs | 431,705 | 447,751 | 440,225 | 1,309,007 | 1,365,611 | |||||||||||||||
| General and administrative expenses | 63,976 | 62,182 | 62,154 | 187,881 | 187,144 | |||||||||||||||
| Research and engineering | 14,404 | 14,016 | 14,362 | 42,629 | 42,371 | |||||||||||||||
| Depreciation and amortization | 159,234 | 161,337 | 160,141 | 477,060 | 484,066 | |||||||||||||||
| Interest expense | 55,350 | 44,042 | 51,493 | 157,222 | 135,347 | |||||||||||||||
| Other, net | 41,608 | 35,546 | 12,079 | 69,795 | (8,604 | ) | ||||||||||||||
| Total costs and other deductions | 766,277 | 764,874 | 740,454 | 2,243,594 | 2,205,935 | |||||||||||||||
| Income (loss) before income taxes | (22,969 | ) | (20,731 | ) | 2,525 | (13,402 | ) | 106,023 | ||||||||||||
| Income tax expense (benefit) | 10,118 | 10,513 | 15,554 | 41,716 | 59,976 | |||||||||||||||
| Net income (loss) | (33,087 | ) | (31,244 | ) | (13,029 | ) | (55,118 | ) | 46,047 | |||||||||||
| Less: Net (income) loss attributable to noncontrolling interest | (22,738 | ) | (17,672 | ) | (19,226 | ) | (67,295 | ) | (41,128 | ) | ||||||||||
| Net income (loss) attributable to Nabors | $ | (55,825 | ) | $ | (48,916 | ) | $ | (32,255 | ) | $ | (122,413 | ) | $ | 4,919 | ||||||
| Earnings (losses) per share: | ||||||||||||||||||||
| Basic | $ | (6.86 | ) | $ | (6.26 | ) | $ | (4.29 | ) | $ | (15.69 | ) | $ | (2.79 | ) | |||||
| Diluted | $ | (6.86 | ) | $ | (6.26 | ) | $ | (4.29 | ) | $ | (15.69 | ) | $ | (2.79 | ) | |||||
| Weighted-average number of common shares outstanding: | ||||||||||||||||||||
| Basic | 9,213 | 9,148 | 9,207 | 9,199 | 9,168 | |||||||||||||||
| Diluted | 9,213 | 9,148 | 9,207 | 9,199 | 9,168 | |||||||||||||||
| Adjusted EBITDA | $ | 221,720 | $ | 210,025 | $ | 218,057 | $ | 660,790 | $ | 685,054 | ||||||||||
| Adjusted operating income (loss) | $ | 62,486 | $ | 48,688 | $ | 57,916 | $ | 183,730 | $ | 200,988 | ||||||||||
1-1
NABORS INDUSTRIES LTD. AND SUBSIDIARIES
CONDENSED CONSOLIDATED BALANCE SHEETS
(Unaudited)
| September 30, | June 30, | December 31, | ||||||||||
| (In thousands) | 2024 | 2024 | 2023 | |||||||||
| ASSETS | ||||||||||||
| Current assets: | ||||||||||||
| Cash and short-term investments | $ | 459,302 | $ | 473,608 | $ | 1,070,178 | ||||||
| Accounts receivable, net | 384,723 | 368,550 | 347,837 | |||||||||
| Other current assets | 228,300 | 235,632 | 227,663 | |||||||||
| Total current assets | 1,072,325 | 1,077,790 | 1,645,678 | |||||||||
| Property, plant and equipment, net | 2,766,411 | 2,813,148 | 2,898,728 | |||||||||
| Other long-term assets | 714,900 | 724,755 | 733,559 | |||||||||
| Total assets | $ | 4,553,636 | $ | 4,615,693 | $ | 5,277,965 | ||||||
| LIABILITIES AND EQUITY | ||||||||||||
| Current liabilities: | ||||||||||||
| Current debt | $ | - | $ | - | $ | 629,621 | ||||||
| Trade accounts payable | 316,694 | 331,468 | 294,442 | |||||||||
| Other current liabilities | 254,884 | 259,454 | 289,918 | |||||||||
| Total current liabilities | 571,578 | 590,922 | 1,213,981 | |||||||||
| Long-term debt | 2,503,270 | 2,514,169 | 2,511,519 | |||||||||
| Other long-term liabilities | 244,679 | 247,587 | 271,380 | |||||||||
| Total liabilities | 3,319,527 | 3,352,678 | 3,996,880 | |||||||||
| Redeemable noncontrolling interest in subsidiary | 773,525 | 761,415 | 739,075 | |||||||||
| Equity: | ||||||||||||
| Shareholders' equity | 191,363 | 250,371 | 326,614 | |||||||||
| Noncontrolling interest | 269,221 | 251,229 | 215,396 | |||||||||
| Total equity | 460,584 | 501,600 | 542,010 | |||||||||
| Total liabilities and equity | $ | 4,553,636 | $ | 4,615,693 | $ | 5,277,965 | ||||||
1-2
NABORS INDUSTRIES LTD. AND SUBSIDIARIES
SEGMENT REPORTING
(Unaudited)
The following tables set forth certain information with respect to our reportable segments and rig activity:
| Three Months Ended | Nine Months Ended | |||||||||||||||||||
| September 30, | June 30, | September 30, | ||||||||||||||||||
| (In thousands, except rig activity) | 2024 | 2023 | 2024 | 2024 | 2023 | |||||||||||||||
| Operating revenues: | ||||||||||||||||||||
| U.S. Drilling | $ | 254,773 | $ | 276,385 | $ | 259,723 | $ | 786,485 | $ | 941,867 | ||||||||||
| International Drilling | 368,594 | 344,780 | 356,733 | 1,074,686 | 1,002,478 | |||||||||||||||
| Drilling Solutions | 79,544 | 72,831 | 82,961 | 238,079 | 224,729 | |||||||||||||||
| Rig Technologies (1) | 45,809 | 61,437 | 49,546 | 145,511 | 183,481 | |||||||||||||||
| Other reconciling items (2) | (16,915 | ) | (21,459 | ) | (14,165 | ) | (44,454 | ) | (72,375 | ) | ||||||||||
| Total operating revenues | $ | 731,805 | $ | 733,974 | $ | 734,798 | $ | 2,200,307 | $ | 2,280,180 | ||||||||||
| Adjusted EBITDA: (3) | ||||||||||||||||||||
| U.S. Drilling | $ | 108,660 | $ | 117,357 | $ | 114,020 | $ | 343,083 | $ | 415,292 | ||||||||||
| International Drilling | 115,951 | 96,175 | 106,371 | 324,820 | 283,114 | |||||||||||||||
| Drilling Solutions | 34,311 | 30,419 | 32,468 | 98,566 | 95,089 | |||||||||||||||
| Rig Technologies (1) | 6,104 | 7,221 | 7,330 | 20,235 | 18,583 | |||||||||||||||
| Other reconciling items (4) | (43,306 | ) | (41,147 | ) | (42,132 | ) | (125,914 | ) | (127,024 | ) | ||||||||||
| Total adjusted EBITDA | $ | 221,720 | $ | 210,025 | $ | 218,057 | $ | 660,790 | $ | 685,054 | ||||||||||
| Adjusted operating income (loss): (5) | ||||||||||||||||||||
| U.S. Drilling | $ | 41,694 | $ | 49,582 | $ | 45,085 | $ | 137,308 | $ | 210,859 | ||||||||||
| International Drilling | 32,182 | 9,862 | 23,672 | 78,330 | 22,226 | |||||||||||||||
| Drilling Solutions | 29,231 | 25,341 | 27,319 | 83,443 | 80,830 | |||||||||||||||
| Rig Technologies (1) | 2,761 | 4,995 | 4,860 | 11,830 | 13,741 | |||||||||||||||
| Other reconciling items (4) | (43,382 | ) | (41,092 | ) | (43,020 | ) | (127,181 | ) | (126,668 | ) | ||||||||||
| Total adjusted operating income (loss) | $ | 62,486 | $ | 48,688 | $ | 57,916 | $ | 183,730 | $ | 200,988 | ||||||||||
| Rig activity: | ||||||||||||||||||||
| Average Rigs Working: (7) | ||||||||||||||||||||
| Lower 48 | 67.8 | 73.7 | 68.7 | 69.5 | 82.8 | |||||||||||||||
| Other US | 6.2 | 6.7 | 6.3 | 6.4 | 6.9 | |||||||||||||||
| U.S. Drilling | 74.0 | 80.4 | 75.0 | 75.9 | 89.7 | |||||||||||||||
| International Drilling | 84.7 | 77.2 | 84.4 | 83.4 | 76.9 | |||||||||||||||
| Total average rigs working | 158.7 | 157.6 | 159.4 | 159.3 | 166.6 | |||||||||||||||
| Daily Rig Revenue: (6),(8) | ||||||||||||||||||||
| Lower 48 | $ | 34,812 | $ | 35,697 | $ | 35,334 | $ | 35,209 | $ | 36,324 | ||||||||||
| Other US | 66,352 | 56,163 | 68,008 | 66,205 | 64,312 | |||||||||||||||
| U.S. Drilling (10) | 37,441 | 37,397 | 38,076 | 37,831 | 38,474 | |||||||||||||||
| International Drilling | 47,281 | 48,528 | 46,469 | 47,041 | 47,728 | |||||||||||||||
| Daily Adjusted Gross Margin: (6),(9) | ||||||||||||||||||||
| Lower 48 | $ | 15,051 | $ | 15,855 | $ | 15,598 | $ | 15,561 | $ | 16,505 | ||||||||||
| Other US | 37,363 | 27,631 | 38,781 | 37,058 | 33,618 | |||||||||||||||
| U.S. Drilling (10) | 16,911 | 16,833 | 17,544 | 17,379 | 17,820 | |||||||||||||||
| International Drilling | 17,085 | 15,778 | 16,050 | 16,407 | 15,762 | |||||||||||||||
1-3
| (1) | Includes our oilfield equipment manufacturing activities. |
| (2) | Represents the elimination of inter-segment transactions related to our Rig Technologies operating segment. |
| (3) | Adjusted EBITDA represents net income (loss) before income tax expense (benefit), investment income (loss), interest expense, other, net and depreciation and amortization. Adjusted EBITDA is a non-GAAP financial measure and should not be used in isolation or as a substitute for the amounts reported in accordance with GAAP. In addition, adjusted EBITDA excludes certain cash expenses that the Company is obligated to make. However, management evaluates the performance of its operating segments and the consolidated Company based on several criteria, including adjusted EBITDA and adjusted operating income (loss), because it believes that these financial measures accurately reflect the Company’s ongoing profitability and performance. Securities analysts and investors use this measure as one of the metrics on which they analyze the Company’s performance. Other companies in this industry may compute these measures differently. A reconciliation of this non-GAAP measure to net income (loss), which is the most closely comparable GAAP measure, is provided in the table set forth immediately following the heading "Reconciliation of Non-GAAP Financial Measures to Net Income (Loss)". |
| (4) | Represents the elimination of inter-segment transactions and unallocated corporate expenses. |
| (5) | Adjusted operating income (loss) represents net income (loss) before income tax expense (benefit), investment income (loss), interest expense and other, net. Adjusted operating income (loss) is a non-GAAP financial measure and should not be used in isolation or as a substitute for the amounts reported in accordance with GAAP. In addition, adjusted operating income (loss) excludes certain cash expenses that the Company is obligated to make. However, management evaluates the performance of its operating segments and the consolidated Company based on several criteria, including adjusted EBITDA and adjusted operating income (loss), because it believes that these financial measures accurately reflect the Company’s ongoing profitability and performance. Securities analysts and investors use this measure as one of the metrics on which they analyze the Company’s performance. Other companies in this industry may compute these measures differently. A reconciliation of this non-GAAP measure to net income (loss), which is the most closely comparable GAAP measure, is provided in the table set forth immediately following the heading "Reconciliation of Non-GAAP Financial Measures to Net Income (Loss)". |
| (6) | Rig revenue days represents the number of days the Company's rigs are contracted and performing under a contract during the period. These would typically include days in which operating, standby and move revenue is earned. |
| (7) | Average rigs working represents a measure of the average number of rigs operating during a given period. For example, one rig operating 45 days during a quarter represents approximately 0.5 average rigs working for the quarter. On an annual period, one rig operating 182.5 days represents approximately 0.5 average rigs working for the year. Average rigs working can also be calculated as rig revenue days during the period divided by the number of calendar days in the period. |
| (8) | Daily rig revenue represents operating revenue, divided by the total number of revenue days during the quarter. |
| (9) | Daily adjusted gross margin represents operating revenue less direct costs, divided by the total number of rig revenue days during the quarter. |
| (10) | The U.S. Drilling segment includes the Lower 48, Alaska, and Gulf of Mexico operating areas. |
1-4
NABORS INDUSTRIES LTD. AND SUBSIDIARIES
Reconciliation of Earnings per Share
(Unaudited)
| Three Months Ended | Nine Months Ended | |||||||||||||||||||
| September 30, | June 30, | September 30, | ||||||||||||||||||
| (in thousands, except per share amounts) | 2024 | 2023 | 2024 | 2024 | 2023 | |||||||||||||||
| BASIC EPS: | ||||||||||||||||||||
| Net income (loss) (numerator): | ||||||||||||||||||||
| Income (loss), net of tax | $ | (33,087 | ) | $ | (31,244 | ) | $ | (13,029 | ) | $ | (55,118 | ) | $ | 46,047 | ||||||
| Less: net (income) loss attributable to noncontrolling interest | (22,738 | ) | (17,672 | ) | (19,226 | ) | (67,295 | ) | (41,128 | ) | ||||||||||
| Less: deemed dividends to SPAC public shareholders | — | (823 | ) | — | — | (8,180 | ) | |||||||||||||
| Less: accrued distribution on redeemable noncontrolling interest in subsidiary | (7,363 | ) | (7,517 | ) | (7,283 | ) | (21,929 | ) | (22,307 | ) | ||||||||||
| Numerator for basic earnings per share: | ||||||||||||||||||||
| Adjusted income (loss), net of tax - basic | $ | (63,188 | ) | $ | (57,256 | ) | $ | (39,538 | ) | $ | (144,342 | ) | $ | (25,568 | ) | |||||
| Weighted-average number of shares outstanding - basic | 9,213 | 9,148 | 9,207 | 9,199 | 9,168 | |||||||||||||||
| Earnings (losses) per share: | ||||||||||||||||||||
| Total Basic | $ | (6.86 | ) | $ | (6.26 | ) | $ | (4.29 | ) | $ | (15.69 | ) | $ | (2.79 | ) | |||||
| DILUTED EPS: | ||||||||||||||||||||
| Adjusted income (loss), net of tax - diluted | $ | (63,188 | ) | $ | (57,256 | ) | $ | (39,538 | ) | $ | (144,342 | ) | $ | (25,568 | ) | |||||
| Weighted-average number of shares outstanding - diluted | 9,213 | 9,148 | 9,207 | 9,199 | 9,168 | |||||||||||||||
| Earnings (losses) per share: | ||||||||||||||||||||
| Total Diluted | $ | (6.86 | ) | $ | (6.26 | ) | $ | (4.29 | ) | $ | (15.69 | ) | $ | (2.79 | ) | |||||
1-5
NABORS INDUSTRIES LTD. AND SUBSIDIARIES
NON-GAAP FINANCIAL MEASURES
RECONCILIATION OF ADJUSTED EBITDA BY SEGMENT TO ADJUSTED OPERATING INCOME (LOSS) BY SEGMENT
(Unaudited)
(In thousands)
| Three Months Ended September 30, 2024 | ||||||||||||||||||||||||
| U.S. Drilling | International Drilling | Drilling Solutions | Rig Technologies | Other reconciling items | Total | |||||||||||||||||||
| Adjusted operating income (loss) | $ | 41,694 | $ | 32,182 | $ | 29,231 | $ | 2,761 | $ | (43,382 | ) | $ | 62,486 | |||||||||||
| Depreciation and amortization | 66,966 | 83,769 | 5,080 | 3,343 | 76 | 159,234 | ||||||||||||||||||
| Adjusted EBITDA | $ | 108,660 | $ | 115,951 | $ | 34,311 | $ | 6,104 | $ | (43,306 | ) | $ | 221,720 | |||||||||||
| Three Months Ended September 30, 2023 | ||||||||||||||||||||||||
| U.S. Drilling | International Drilling | Drilling Solutions | Rig Technologies | Other reconciling items | Total | |||||||||||||||||||
| Adjusted operating income (loss) | $ | 49,582 | $ | 9,862 | $ | 25,341 | $ | 4,995 | $ | (41,092 | ) | $ | 48,688 | |||||||||||
| Depreciation and amortization | 67,775 | 86,313 | 5,078 | 2,226 | (55 | ) | 161,337 | |||||||||||||||||
| Adjusted EBITDA | $ | 117,357 | $ | 96,175 | $ | 30,419 | $ | 7,221 | $ | (41,147 | ) | $ | 210,025 | |||||||||||
| Three Months Ended June 30, 2024 | ||||||||||||||||||||||||
| U.S. Drilling | International Drilling | Drilling Solutions | Rig Technologies | Other reconciling items | Total | |||||||||||||||||||
| Adjusted operating income (loss) | $ | 45,085 | $ | 23,672 | $ | 27,319 | $ | 4,860 | $ | (43,020 | ) | $ | 57,916 | |||||||||||
| Depreciation and amortization | 68,935 | 82,699 | 5,149 | 2,470 | 888 | 160,141 | ||||||||||||||||||
| Adjusted EBITDA | $ | 114,020 | $ | 106,371 | $ | 32,468 | $ | 7,330 | $ | (42,132 | ) | $ | 218,057 | |||||||||||
| Nine Months Ended September 30, 2024 | ||||||||||||||||||||||||
| U.S. Drilling | International Drilling | Drilling Solutions | Rig Technologies | Other reconciling items | Total | |||||||||||||||||||
| Adjusted operating income (loss) | $ | 137,308 | $ | 78,330 | $ | 83,443 | $ | 11,830 | $ | (127,181 | ) | $ | 183,730 | |||||||||||
| Depreciation and amortization | 205,775 | 246,490 | 15,123 | 8,405 | 1,267 | 477,060 | ||||||||||||||||||
| Adjusted EBITDA | $ | 343,083 | $ | 324,820 | $ | 98,566 | $ | 20,235 | $ | (125,914 | ) | $ | 660,790 | |||||||||||
| Nine Months Ended September 30, 2023 | ||||||||||||||||||||||||
| U.S. Drilling | International Drilling | Drilling Solutions | Rig Technologies | Other reconciling items | Total | |||||||||||||||||||
| Adjusted operating income (loss) | $ | 210,859 | $ | 22,226 | $ | 80,830 | $ | 13,741 | $ | (126,668 | ) | $ | 200,988 | |||||||||||
| Depreciation and amortization | 204,433 | 260,888 | 14,259 | 4,842 | (356 | ) | 484,066 | |||||||||||||||||
| Adjusted EBITDA | $ | 415,292 | $ | 283,114 | $ | 95,089 | $ | 18,583 | $ | (127,024 | ) | $ | 685,054 | |||||||||||
1-6
NABORS INDUSTRIES LTD. AND SUBSIDIARIES
NON-GAAP FINANCIAL MEASURES
RECONCILIATION OF ADJUSTED GROSS MARGIN BY SEGMENT TO ADJUSTED OPERATING INCOME (LOSS) BY SEGMENT
(Unaudited)
| Three Months Ended | Nine Months Ended | |||||||||||||||||||
| September 30, | June 30, | September 30, | ||||||||||||||||||
| (In thousands) | 2024 | 2023 | 2024 | 2024 | 2023 | |||||||||||||||
| Lower 48 - U.S. Drilling | ||||||||||||||||||||
| Adjusted operating income (loss) | $ | 30,353 | $ | 40,366 | $ | 32,841 | $ | 102,458 | $ | 174,933 | ||||||||||
| Plus: General and administrative costs | 5,084 | 5,239 | 4,390 | 14,297 | 15,503 | |||||||||||||||
| Plus: Research and engineering | 972 | 1,389 | 909 | 2,845 | 4,098 | |||||||||||||||
| GAAP Gross Margin | 36,409 | 46,994 | 38,140 | 119,600 | 194,534 | |||||||||||||||
| Plus: Depreciation and amortization | 57,470 | 60,447 | 59,332 | 176,535 | 178,487 | |||||||||||||||
| Adjusted gross margin | $ | 93,879 | $ | 107,441 | $ | 97,472 | $ | 296,135 | $ | 373,021 | ||||||||||
| Other - U.S. Drilling | ||||||||||||||||||||
| Adjusted operating income (loss) | $ | 11,341 | $ | 9,216 | $ | 12,244 | $ | 34,850 | $ | 35,926 | ||||||||||
| Plus: General and administrative costs | 313 | 331 | 306 | 944 | 999 | |||||||||||||||
| Plus: Research and engineering | 42 | 90 | 45 | 134 | 349 | |||||||||||||||
| GAAP Gross Margin | 11,696 | 9,637 | 12,595 | 35,928 | 37,274 | |||||||||||||||
| Plus: Depreciation and amortization | 9,496 | 7,329 | 9,602 | 29,240 | 25,945 | |||||||||||||||
| Adjusted gross margin | $ | 21,192 | $ | 16,966 | $ | 22,197 | $ | 65,168 | $ | 63,219 | ||||||||||
| U.S. Drilling | ||||||||||||||||||||
| Adjusted operating income (loss) | $ | 41,694 | $ | 49,582 | $ | 45,085 | $ | 137,308 | $ | 210,859 | ||||||||||
| Plus: General and administrative costs | 5,397 | 5,570 | 4,696 | 15,241 | 16,502 | |||||||||||||||
| Plus: Research and engineering | 1,014 | 1,479 | 954 | 2,979 | 4,447 | |||||||||||||||
| GAAP Gross Margin | 48,105 | 56,631 | 50,735 | 155,528 | 231,808 | |||||||||||||||
| Plus: Depreciation and amortization | 66,966 | 67,776 | 68,934 | 205,775 | 204,432 | |||||||||||||||
| Adjusted gross margin | $ | 115,071 | $ | 124,407 | $ | 119,669 | $ | 361,303 | $ | 436,240 | ||||||||||
| International Drilling | ||||||||||||||||||||
| Adjusted operating income (loss) | $ | 32,182 | $ | 9,862 | $ | 23,672 | $ | 78,330 | $ | 22,226 | ||||||||||
| Plus: General and administrative costs | 15,699 | 14,300 | 15,434 | 45,548 | 42,725 | |||||||||||||||
| Plus: Research and engineering | 1,543 | 1,622 | 1,404 | 4,454 | 5,229 | |||||||||||||||
| GAAP Gross Margin | 49,424 | 25,784 | 40,510 | 128,332 | 70,180 | |||||||||||||||
| Plus: Depreciation and amortization | 83,768 | 86,313 | 82,700 | 246,491 | 260,887 | |||||||||||||||
| Adjusted gross margin | $ | 133,192 | $ | 112,097 | $ | 123,210 | $ | 374,823 | $ | 331,067 | ||||||||||
Adjusted gross margin by segment represents adjusted operating income (loss) plus general and administrative costs, research and engineering costs and depreciation and amortization.
1-7
NABORS INDUSTRIES LTD. AND SUBSIDIARIES
RECONCILIATION OF NON-GAAP FINANCIAL MEASURES TO NET INCOME (LOSS)
(Unaudited)
| Three Months Ended | Nine Months Ended | |||||||||||||||||||
| September 30, | June 30, | September 30, | ||||||||||||||||||
| (In thousands) | 2024 | 2023 | 2024 | 2024 | 2023 | |||||||||||||||
| Net income (loss) | $ | (33,087 | ) | $ | (31,244 | ) | $ | (13,029 | ) | $ | (55,118 | ) | $ | 46,047 | ||||||
| Income tax expense (benefit) | 10,118 | 10,513 | 15,554 | 41,716 | 59,976 | |||||||||||||||
| Income (loss) from continuing operations before income taxes | (22,969 | ) | (20,731 | ) | 2,525 | (13,402 | ) | 106,023 | ||||||||||||
| Investment (income) loss | (11,503 | ) | (10,169 | ) | (8,181 | ) | (29,885 | ) | (31,778 | ) | ||||||||||
| Interest expense | 55,350 | 44,042 | 51,493 | 157,222 | 135,347 | |||||||||||||||
| Other, net | 41,608 | 35,546 | 12,079 | 69,795 | (8,604 | ) | ||||||||||||||
| Adjusted operating income (loss) (1) | 62,486 | 48,688 | 57,916 | 183,730 | 200,988 | |||||||||||||||
| Depreciation and amortization | 159,234 | 161,337 | 160,141 | 477,060 | 484,066 | |||||||||||||||
| Adjusted EBITDA (2) | $ | 221,720 | $ | 210,025 | $ | 218,057 | $ | 660,790 | $ | 685,054 | ||||||||||
(1) Adjusted operating income (loss) represents net income (loss) before income tax expense (benefit), investment income (loss), interest expense, and other, net. Adjusted operating income (loss) is a non-GAAP financial measure and should not be used in isolation or as a substitute for the amounts reported in accordance with GAAP. In addition, adjusted operating income (loss) excludes certain cash expenses that the Company is obligated to make. However, management evaluates the performance of its operating segments and the consolidated Company based on several criteria, including adjusted EBITDA and adjusted operating income (loss), because it believes that these financial measures accurately reflect the Company’s ongoing profitability and performance. Securities analysts and investors use this measure as one of the metrics on which they analyze the Company’s performance. Other companies in this industry may compute these measures differently.
(2) Adjusted EBITDA represents net income (loss) before income tax expense (benefit), investment income (loss), interest expense, other, net and depreciation and amortization. Adjusted EBITDA is a non-GAAP financial measure and should not be used in isolation or as a substitute for the amounts reported in accordance with GAAP. In addition, adjusted EBITDA excludes certain cash expenses that the Company is obligated to make. However, management evaluates the performance of its operating segments and the consolidated Company based on several criteria, including adjusted EBITDA and adjusted operating income (loss), because it believes that these financial measures accurately reflect the Company’s ongoing profitability and performance. Securities analysts and investors use this measure as one of the metrics on which they analyze the Company’s performance. Other companies in this industry may compute these measures differently.
1-8
NABORS INDUSTRIES LTD. AND SUBSIDIARIES
RECONCILIATION OF NET DEBT TO TOTAL DEBT
(Unaudited)
| September 30, | June 30, | December 31, | ||||||||||
| (In thousands) | 2024 | 2024 | 2023 | |||||||||
| Current debt | $ | - | $ | - | $ | 629,621 | ||||||
| Long-term debt | 2,503,270 | 2,514,169 | 2,511,519 | |||||||||
| Total Debt | 2,503,270 | 2,514,169 | 3,141,140 | |||||||||
| Less: Cash and short-term investments | 459,302 | 473,608 | 1,070,178 | |||||||||
| Net Debt | $ | 2,043,968 | $ | 2,040,561 | $ | 2,070,962 | ||||||
1-9
NABORS INDUSTRIES LTD. AND SUBSIDIARIES
RECONCILIATION OF ADJUSTED FREE CASH FLOW TO
NET CASH PROVIDED BY OPERATING ACTIVITIES
(Unaudited)
| Three Months Ended | Nine
Months Ended | |||||||||||
| September 30, | June 30, | September 30, | ||||||||||
| (In thousands) | 2024 | 2024 | 2024 | |||||||||
| Net cash provided by operating activities | $ | 143,615 | $ | 181,659 | $ | 432,513 | ||||||
| Add: Capital expenditures, net of proceeds from sales of assets | (126,071 | ) | (125,010 | ) | (350,206 | ) | ||||||
| Adjusted free cash flow | $ | 17,544 | $ | 56,649 | $ | 82,307 | ||||||
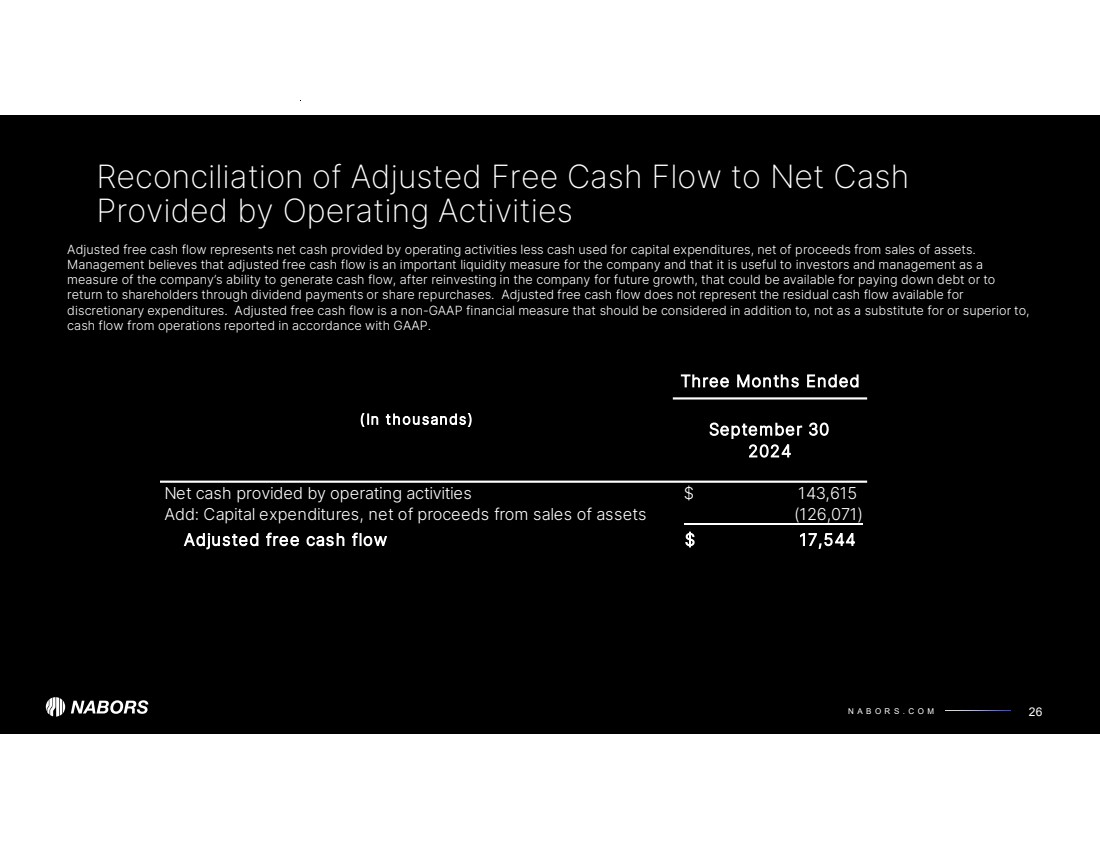
Adjusted free cash flow represents net cash provided by operating activities less cash used for capital expenditures, net of proceeds from sales of assets. Management believes that adjusted free cash flow is an important liquidity measure for the company and that it is useful to investors and management as a measure of the company’s ability to generate cash flow, after reinvesting in the company for future growth, that could be available for paying down debt or other financing cash flows, such as dividends to shareholders. Adjusted free cash flow does not represent the residual cash flow available for discretionary expenditures. Adjusted free cash flow is a non-GAAP financial measure that should be considered in addition to, not as a substitute for or superior to, cash flow from operations reported in accordance with GAAP.
1-10
| NABORS INDUSTRIES LTD. October 22, 2024 3Q 2024 Earnings Presentation |
| N A B O R S . C O M We often discuss expectations regarding our future markets, demand for our products and services, and our performance in our annual, quarterly, and current reports, press releases, and other written and oral statements. Such statements, including statements in this document that relate to matters that are not historical facts, are “forward-looking statements” within the meaning of the safe harbor provisions of Section 27A of the U.S. Securities Act of 1933 and Section 21E of the U.S. Securities Exchange Act of 1934. These “forward-looking statements” are based on our analysis of currently available competitive, financial and economic data and our operating plans. They are inherently uncertain, and investors should recognize that events and actual results could turn out to be significantly different from our expectations. Factors to consider when evaluating these forward-looking statements include, but are not limited to: • geopolitical events, pandemics and other macro-events and their respective and collective impact on our operations as well as oil and gas markets and prices; • fluctuations and volatility in worldwide prices of and demand for oil and natural gas; • fluctuations in levels of oil and natural gas exploration and development activities; • fluctuations in the demand for our services; • competitive and technological changes and other developments in the oil and gas and oilfield services industries; • our ability to renew customer contracts in order to maintain competitiveness; • the existence of operating risks inherent in the oil and gas and oilfield services industries; • the possibility of the loss of one or a number of our large customers; • the amount and nature of our future capital expenditures and how we expect to fund our capital expenditures; • The occurrence of cybersecurity incidents, attacks and other breaches to our information technology systems; • the impact of long-term indebtedness and other financial commitments on our financial and operating flexibility; • our access to and the cost of capital, including the impact of a further downgrade in our credit rating, covenant restrictions, availability under our revolving credit facility, and future issuances of debt or equity securities and the global interest rate environment; • our dependence on our operating subsidiaries and investments to meet our financial obligations; • our ability to retain skilled employees; • our ability to complete, and realize the expected benefits of, strategic transactions; • changes in tax laws and the possibility of changes in other laws and regulation; • the possibility of changes to U.S. trade policies and regulations including the imposition of trade embargoes or sanctions; and • global views on and the regulatory environment related to energy transition and our ability to implement our energy transition initiatives; • Forward Looking Statements NABORS INDUSTRIES 2 • potential long-lived asset impairments • the possibility of changes to U.S. trade policies and regulations including the imposition of trade embargoes, sanctions or tariffs; • general economic conditions, including the capital and credit markets; • uncertainty as to whether the conditions to closing the merger will be satisfied; • our ability to obtain approval of the merger from our shareholders and Parker's ability to obtain approval of the merger from its shareholders; • potential adverse reactions or changes to business relationships resulting from the announcement or completion of the merger; • expectations regarding regulatory approval of the merger; • our ability to retain key personnel of Nabors and Parker; • the diversion of management time on merger-related issues; • the combined company's ability to utilize NOLs; • the significant costs required to complete the merger and to integrate Parker's operations with our own; • whether litigation relating to the merger will occur and, if so, the results of any litigation, settlements and investigations; • our ability to realize the expected benefits of the merger with Parker; and • the effects of the business combination, including the combined company's future financial condition, results of operations, strategy and plans. Our businesses depend, to a large degree, on the level of spending by oil and gas companies for exploration, development and production activities. Therefore, sustained lower oil or natural gas prices that have a material impact on exploration, development or production activities could also materially affect our financial position, results of operations and cash flows. The above description of risks and uncertainties is by no means all-inclusive but is designed to highlight what we believe are important factors to consider. For a discussion of these factors and other risks and uncertainties, please refer to our filings with the Securities and Exchange Commission ("SEC"), including those contained in our Annual Reports on Form 10-K and Quarterly Reports on Form 10-Q, which are available at the SEC's website at www.sec.gov. We undertake no obligation to publicly update or revise any forward-looking statement as a result of new information, future events or otherwise, except as otherwise required by law. Non-GAAP Financial Measures This presentation refers to certain “non-GAAP” financial measures, such as adjusted EBITDA, net debt, adjusted gross margin and adjusted free cash flow. The components of these non-GAAP measures are computed by using amounts that are determined in accordance with accounting principles generally accepted in the United States of America (“GAAP”). |
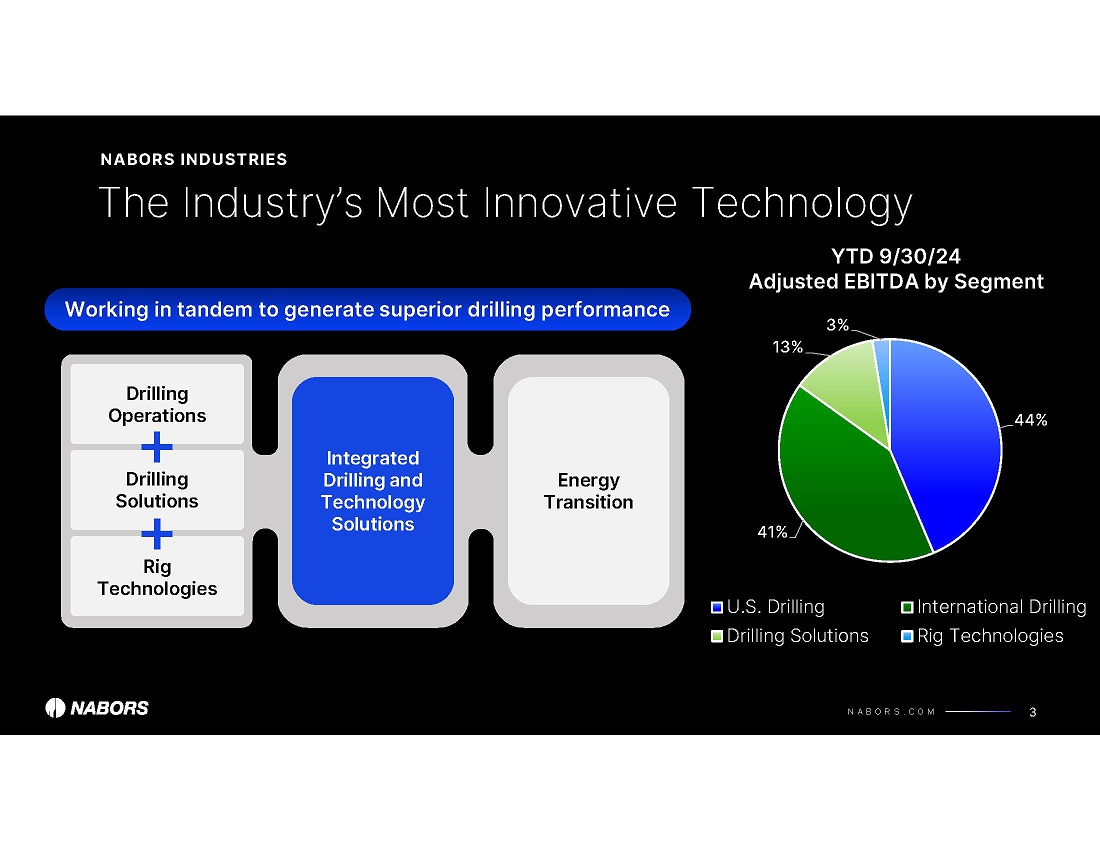
| N A B O R S . C O M 35% 48% 11% 6% YTD 9/30/24 Revenue by Segment U.S. Drilling International Drilling Drilling Solutions Rig Technologies 3 The Industry’s Most Innovative Technology NABORS INDUSTRIES Integrated Drilling and Technology Solutions Drilling Operations Drilling Solutions Rig Technologies Energy Transition Working in tandem to generate superior drilling performance |
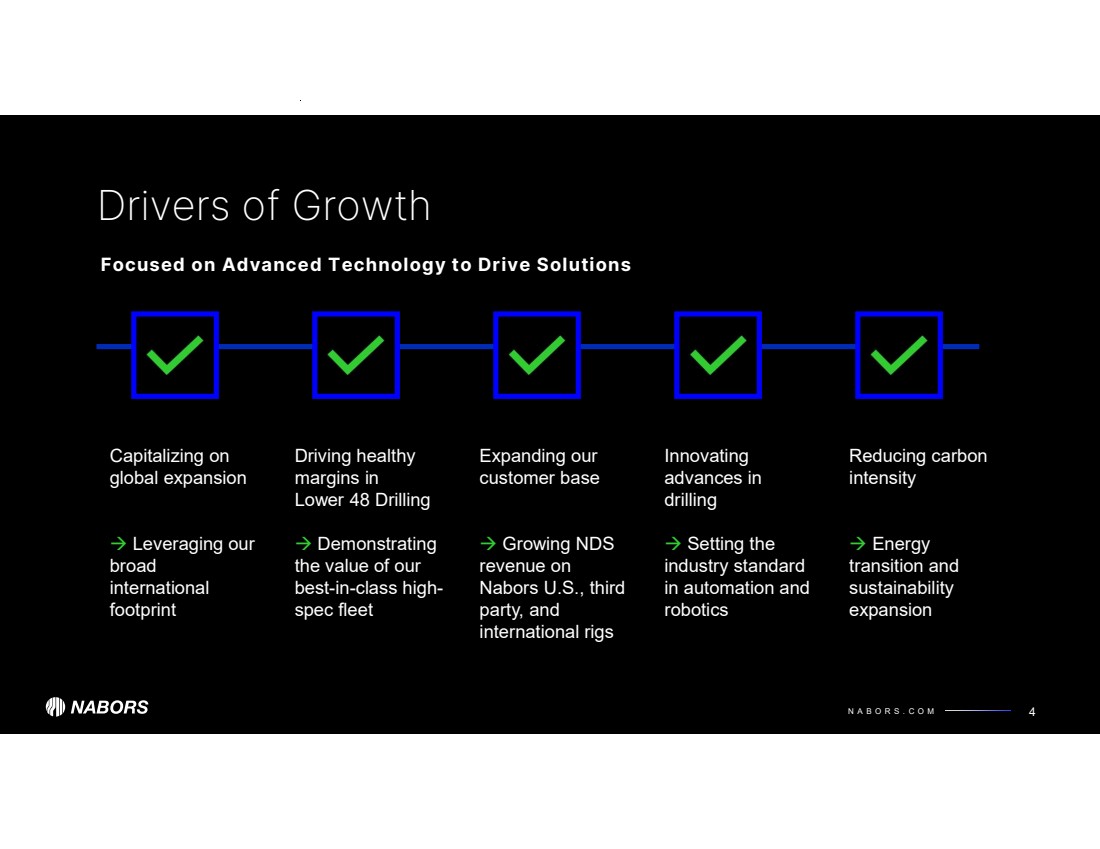
| N A B O R S . C O M 4 Drivers of Growth Capitalizing on global expansion Leveraging our broad international footprint Expanding our customer base Growing NDS revenue on Nabors U.S., third party, and international rigs Driving healthy margins in Lower 48 Drilling Demonstrating the value of our best-in-class high-spec fleet Reducing carbon intensity Energy transition and sustainability expansion Innovating advances in drilling Setting the industry standard in automation and robotics Focused on Advanced Technology to Drive Solutions |
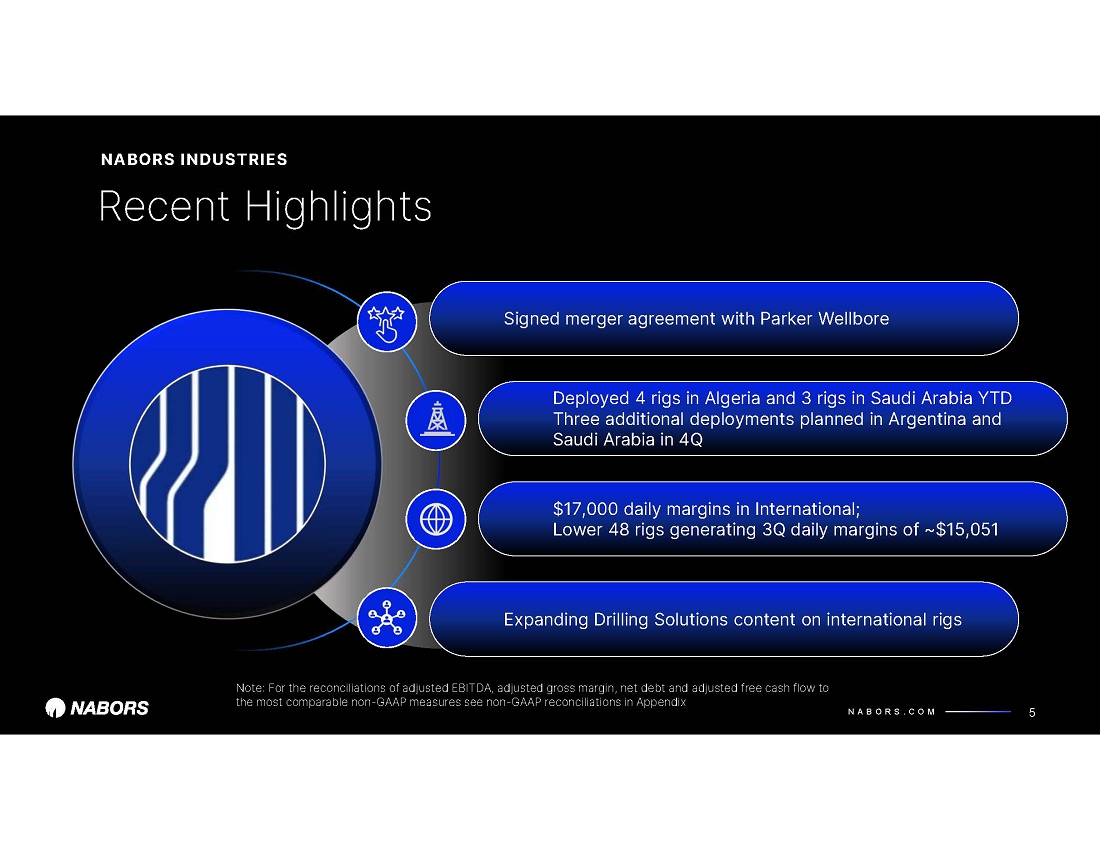
| N A B O R S . C O M Recent Highlights NABORS INDUSTRIES 5 Lower 48 rigs generating 3Q daily margins of ~$15,051, holding above prior market cycle highs Signed merger agreement with Parker Wellbore Deployed 4 rigs in Algeria and 3 rigs in Saudi Arabia YTD Additional deployments planned in Saudi Arabia and Argentina in 4Q Nabors Expanding Drilling Solutions content on international rigs Note: For the reconciliations of adjusted EBITDA, adjusted gross margin, net debt and adjusted free cash flow to the most comparable non-GAAP measures see non-GAAP reconciliations in Appendix |
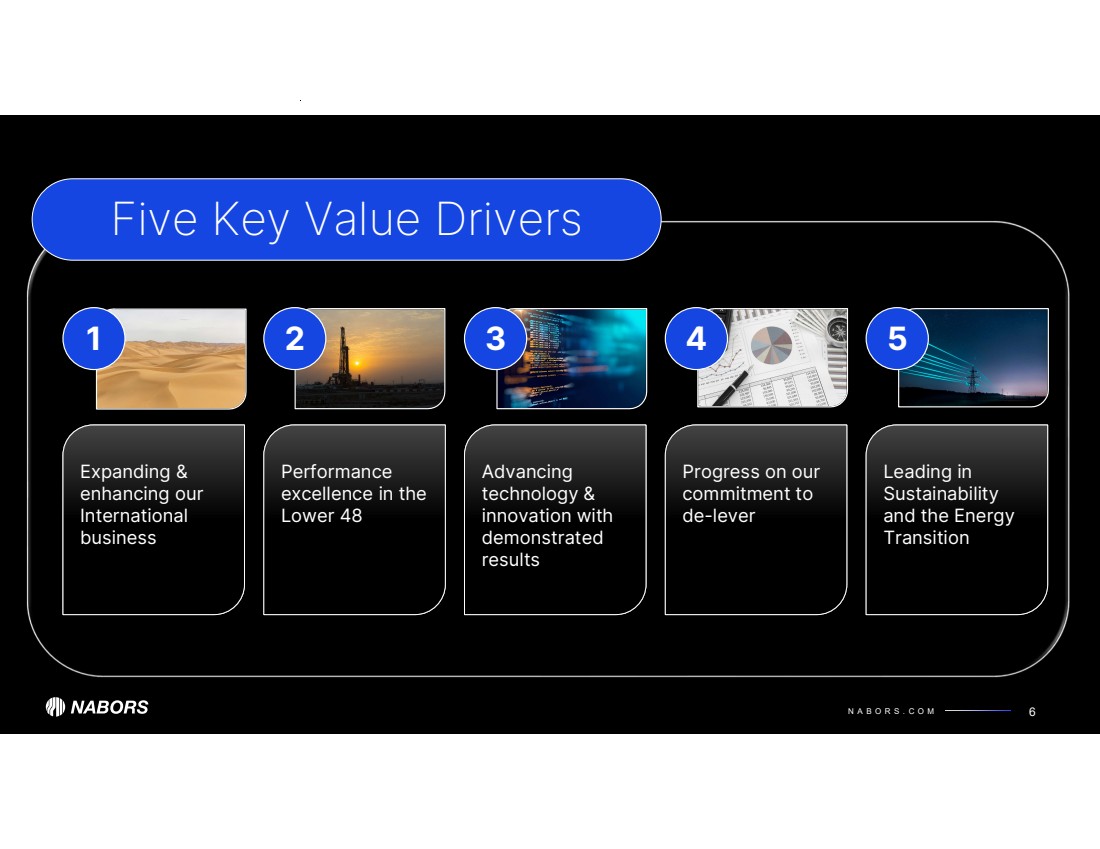
| N A B O R S . C O M Performance excellence in the Lower 48 6 Expanding & enhancing our International business Five Key Value Drivers 1 Advancing technology & innovation with demonstrated results Progress on our commitment to de-lever 2 3 Leading in Sustainability and the Energy Transition 4 5 |
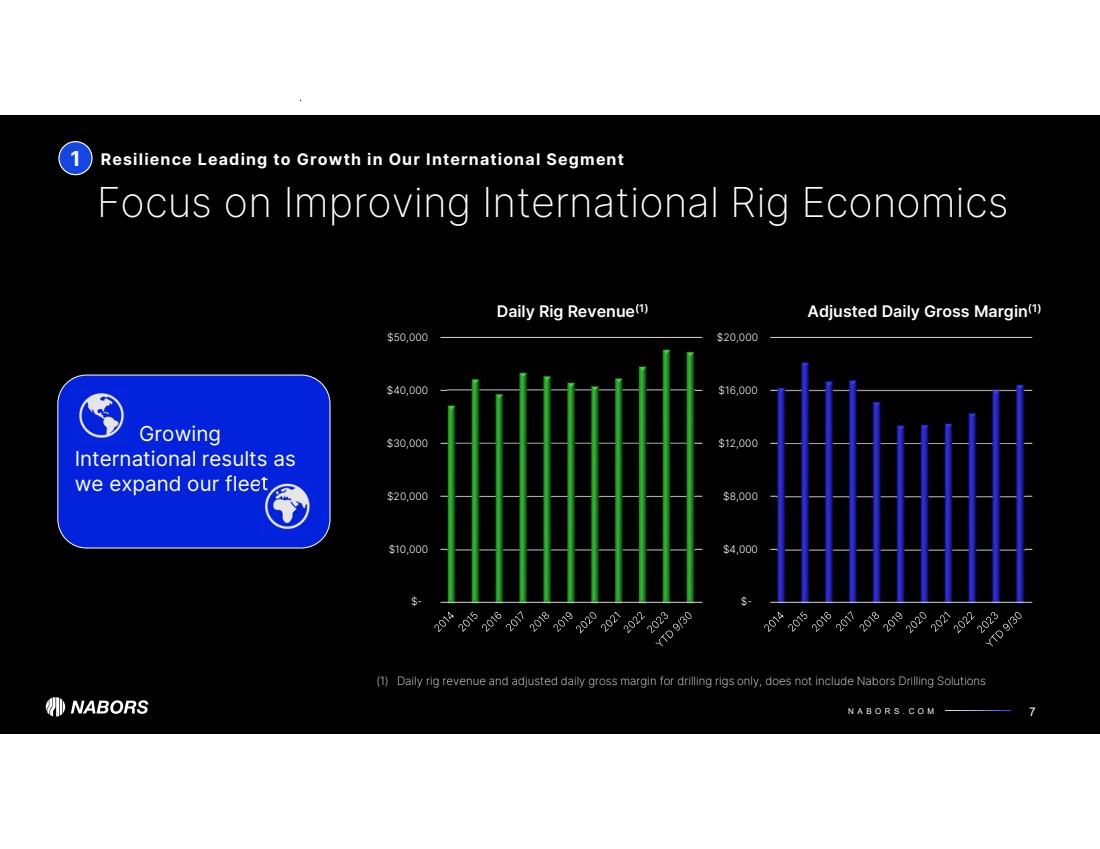
| N A B O R S . C O M $- $4,000 $8,000 $12,000 $16,000 $20,000 Adjusted Daily Gross Margin(1) $- $10,000 $20,000 $30,000 $40,000 $50,000 Daily Rig Revenue(1) 1 Growing International results as we expand our fleet Focus on Improving International Rig Economics Resilience Leading to Growth in Our International Segment 7 (1) Daily rig revenue and adjusted daily gross margin for drilling rigs only, does not include Nabors Drilling Solutions |
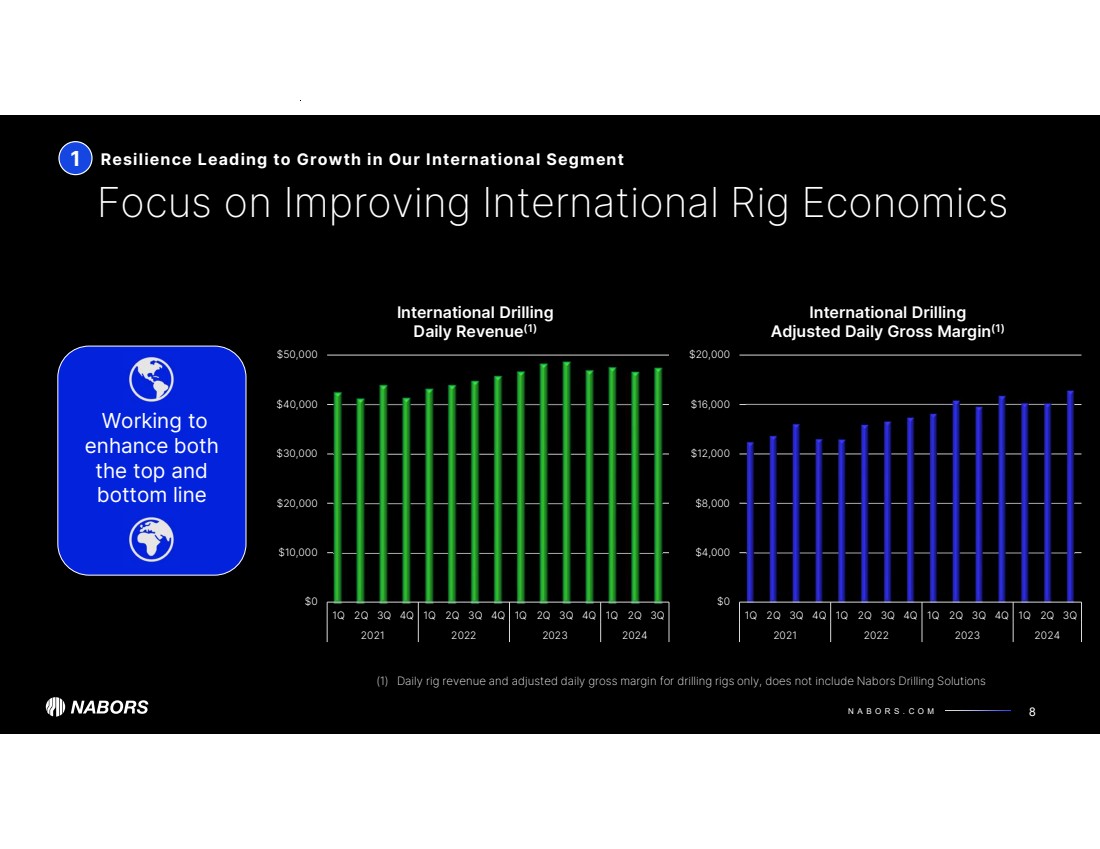
| N A B O R S . C O M $0 $4,000 $8,000 $12,000 $16,000 $20,000 1Q 2Q 3Q 4Q 1Q 2Q 3Q 4Q 1Q 2Q 3Q 4Q 1Q 2Q 3Q 2021 2022 2023 2024 International Drilling Adjusted Daily Gross Margin(1) $0 $10,000 $20,000 $30,000 $40,000 $50,000 1Q 2Q 3Q 4Q 1Q 2Q 3Q 4Q 1Q 2Q 3Q 4Q 1Q 2Q 3Q 2021 2022 2023 2024 International Drilling Daily Revenue(1) 1 Working to enhance both the top and bottom line Focus on Improving International Rig Economics Resilience Leading to Growth in Our International Segment 8 (1) Daily rig revenue and adjusted daily gross margin for drilling rigs only, does not include Nabors Drilling Solutions |
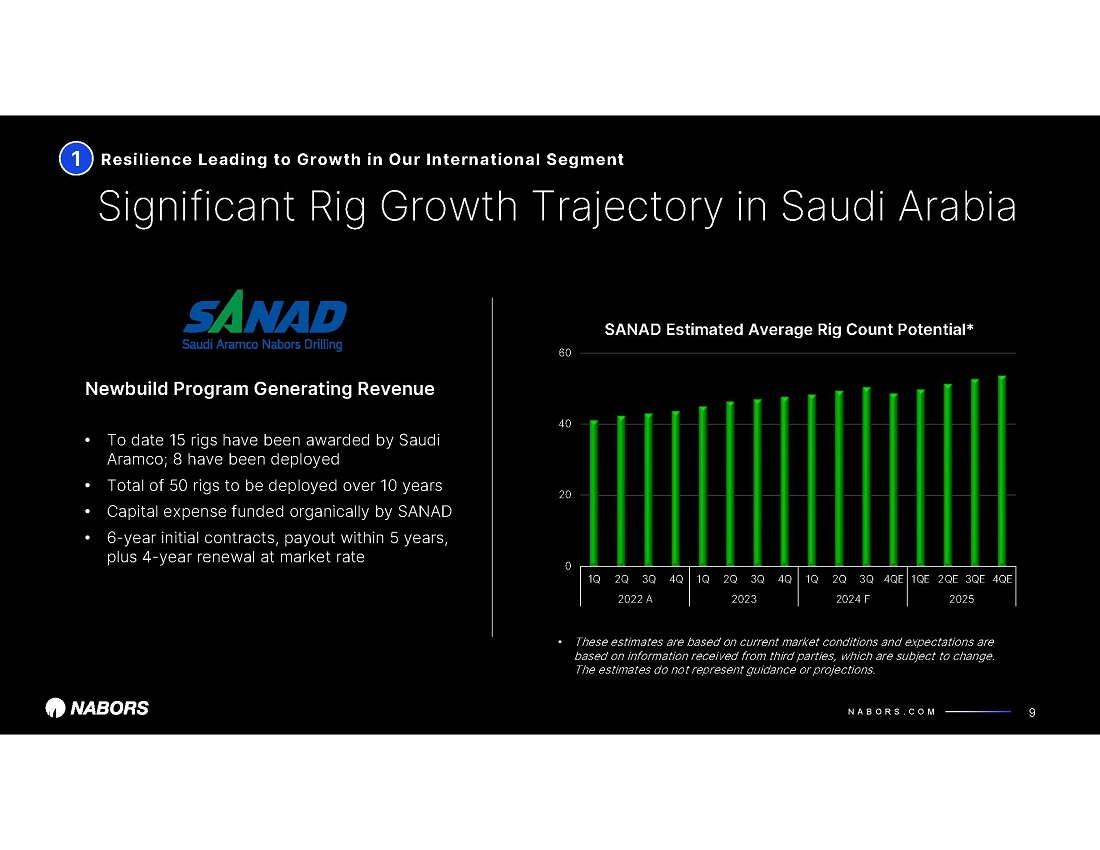
| N A B O R S . C O M 0 20 40 60 1Q 2Q 3Q 4Q 1Q 2Q 3Q 4Q 1Q 2Q 3Q 4QE 1QE 2QE 3QE 4QE 2022 A 2023 2024 F 2025 SANAD Estimated Average Rig Count Potential* 1 Significant Rig Growth Trajectory in Saudi Arabia Resilience Leading to Growth in Our International Segment 9 • Eight operating and one more scheduled in 2024 • To date 15 total rigs scheduled for deployment • Total of 50 rigs to be deployed over 10 years • Capital expense funded organically by SANAD • 6-year initial contracts, payout within 5 years, plus 4-year renewal at market rate Newbuild Program Generating Revenue • These estimates are based on current market conditions and expectations are based on information received from third parties, which are subject to change. The estimates do not represent guidance or projections. |
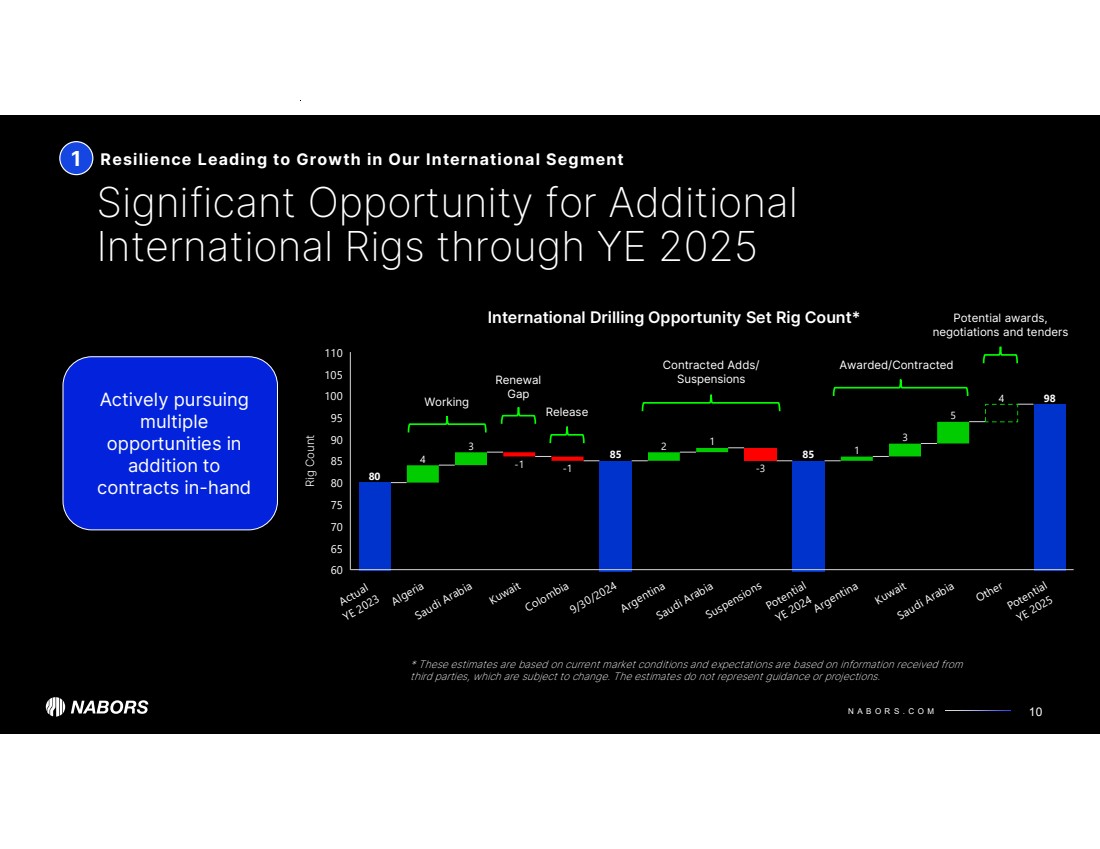
| N A B O R S . C O M 4 3 -1 -1 2 1 -3 1 3 5 4 80 85 85 98 Actual YE 2023 Algeria Saudi Arabia Kuwait Colombia 9/30/2024 Argentina Saudi Arabia Suspensions Potential YE 2024Argentina Kuwait Saudi Arabia Other Potential YE 2025 Rig Count 60 65 70 75 80 85 90 95 100 105 110 1 Significant Opportunity for Additional International Rigs through YE 2025 10 Actively pursuing multiple opportunities in addition to contracts in-hand * These estimates are based on current market conditions and expectations are based on information received from third parties, which are subject to change. The estimates do not represent guidance or projections. Resilience Leading to Growth in Our International Segment Contracted Adds/ Suspensions Potential awards, negotiations and tenders Awarded/Contracted International Drilling Opportunity Set Rig Count* Working Renewal Gap Release |
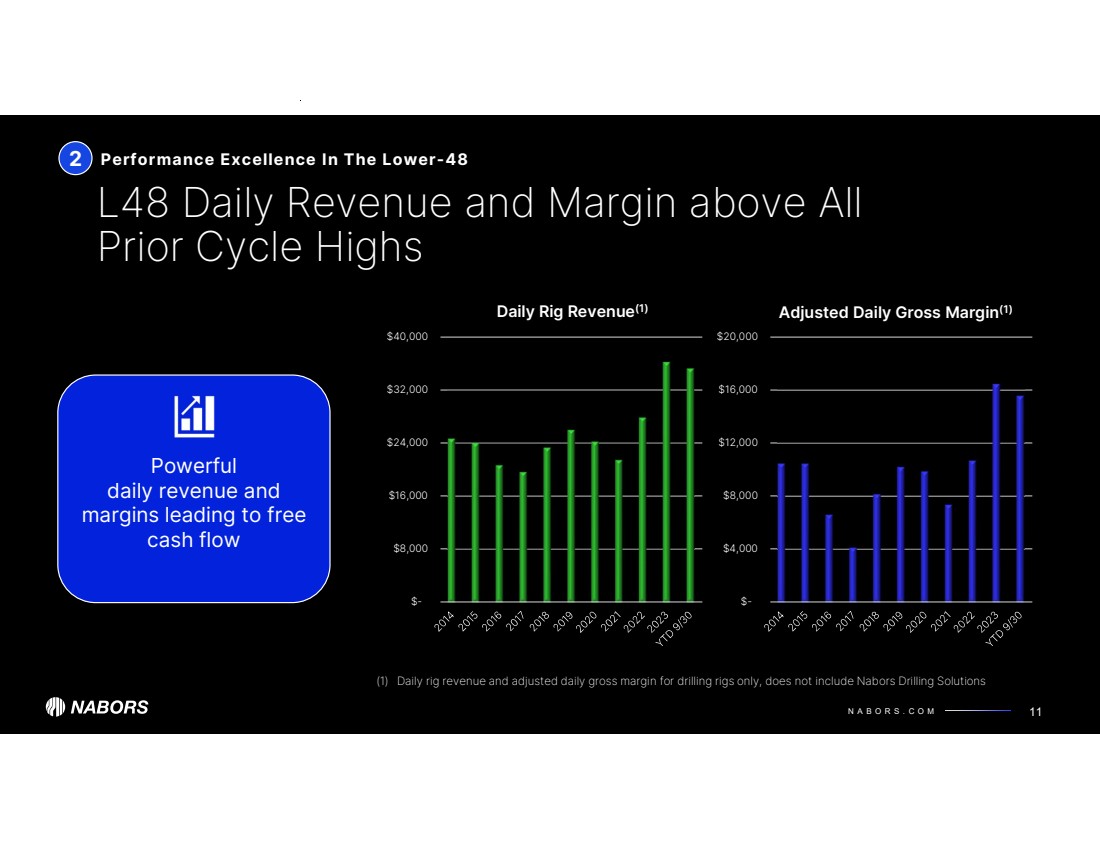
| N A B O R S . C O M $- $8,000 $16,000 $24,000 $32,000 $40,000 Daily Rig Revenue(1) $- $4,000 $8,000 $12,000 $16,000 $20,000 Adjusted Daily Gross Margin(1) 2 L48 Daily Revenue and Margin above All Prior Cycle Highs Performance Excellence In The Lower-48 11 Powerful daily revenue and margins leading to free cash flow (1) Daily rig revenue and adjusted daily gross margin for drilling rigs only, does not include Nabors Drilling Solutions |
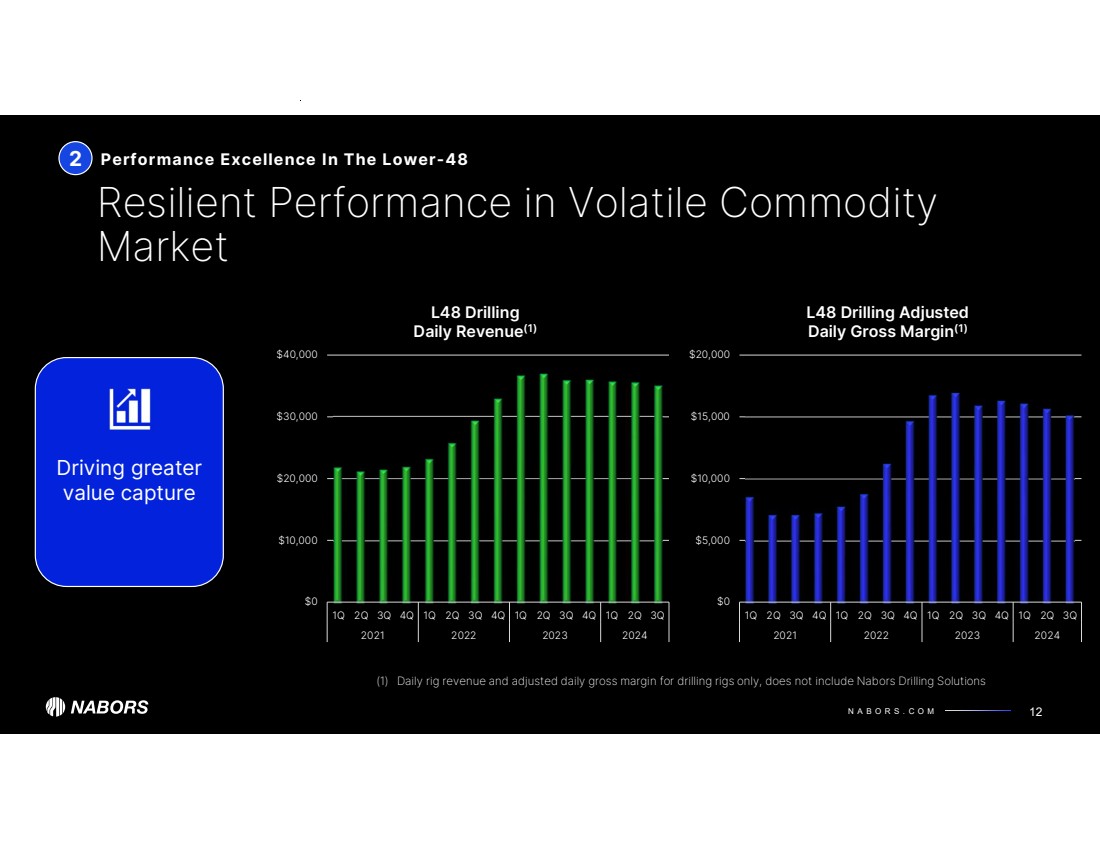
| N A B O R S . C O M $0 $5,000 $10,000 $15,000 $20,000 1Q 2Q 3Q 4Q 1Q 2Q 3Q 4Q 1Q 2Q 3Q 4Q 1Q 2Q 3Q 2021 2022 2023 2024 L48 Drilling Adjusted Daily Gross Margin(1) $0 $10,000 $20,000 $30,000 $40,000 1Q 2Q 3Q 4Q 1Q 2Q 3Q 4Q 1Q 2Q 3Q 4Q 1Q 2Q 3Q 2021 2022 2023 2024 L48 Drilling Daily Revenue(1) 2 Resilient Performance in Volatile Commodity Market Performance Excellence In The Lower-48 12 Driving greater value capture (1) Daily rig revenue and adjusted daily gross margin for drilling rigs only, does not include Nabors Drilling Solutions |
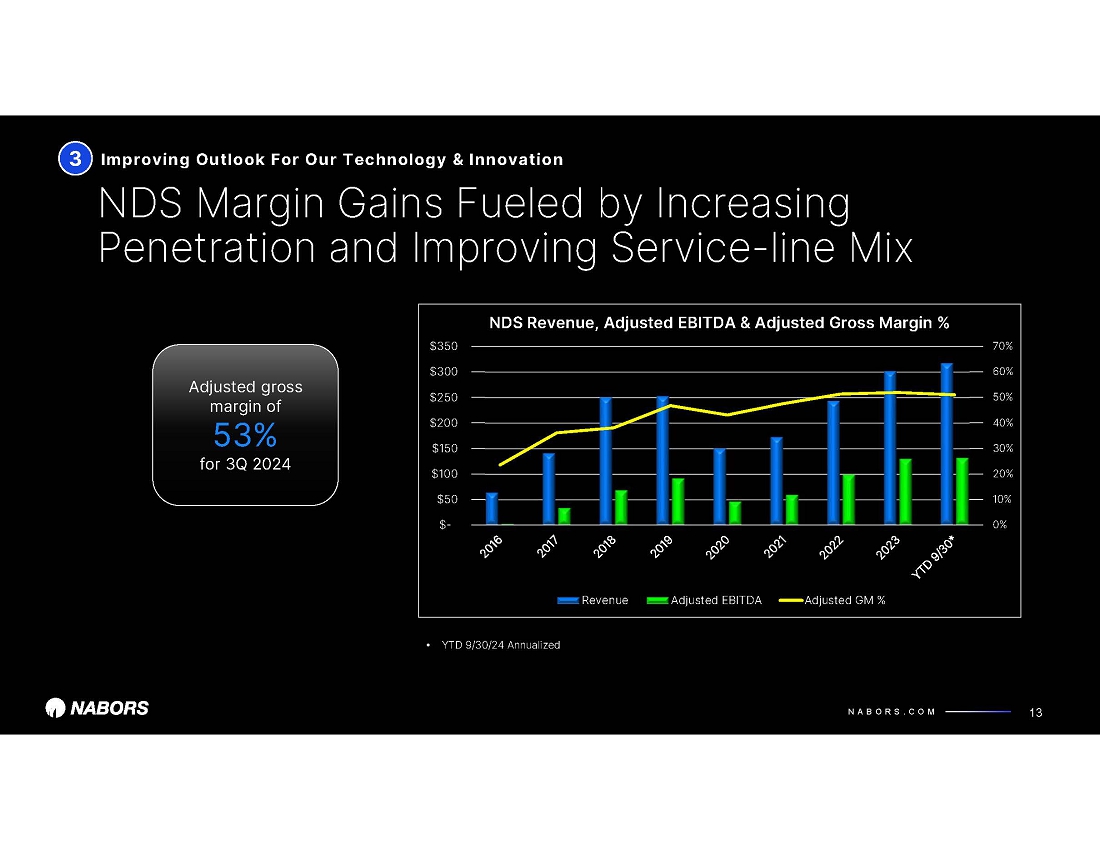
| N A B O R S . C O M 0% 10% 20% 30% 40% 50% 60% 70% $- $50 $100 $150 $200 $250 $300 $350 NDS Revenue, Adjusted EBITDA & Adjusted Gross Margin % Revenue Adjusted EBITDA Adjusted GM % NDS Margin Gains Fueled by Increasing Penetration and Improving Service-line Mix Improving Outlook For Our Technology & Innovation 13 Adjusted gross margin of 51% YTD 9/30/24 3 • YTD 9/30/24 Annualized |
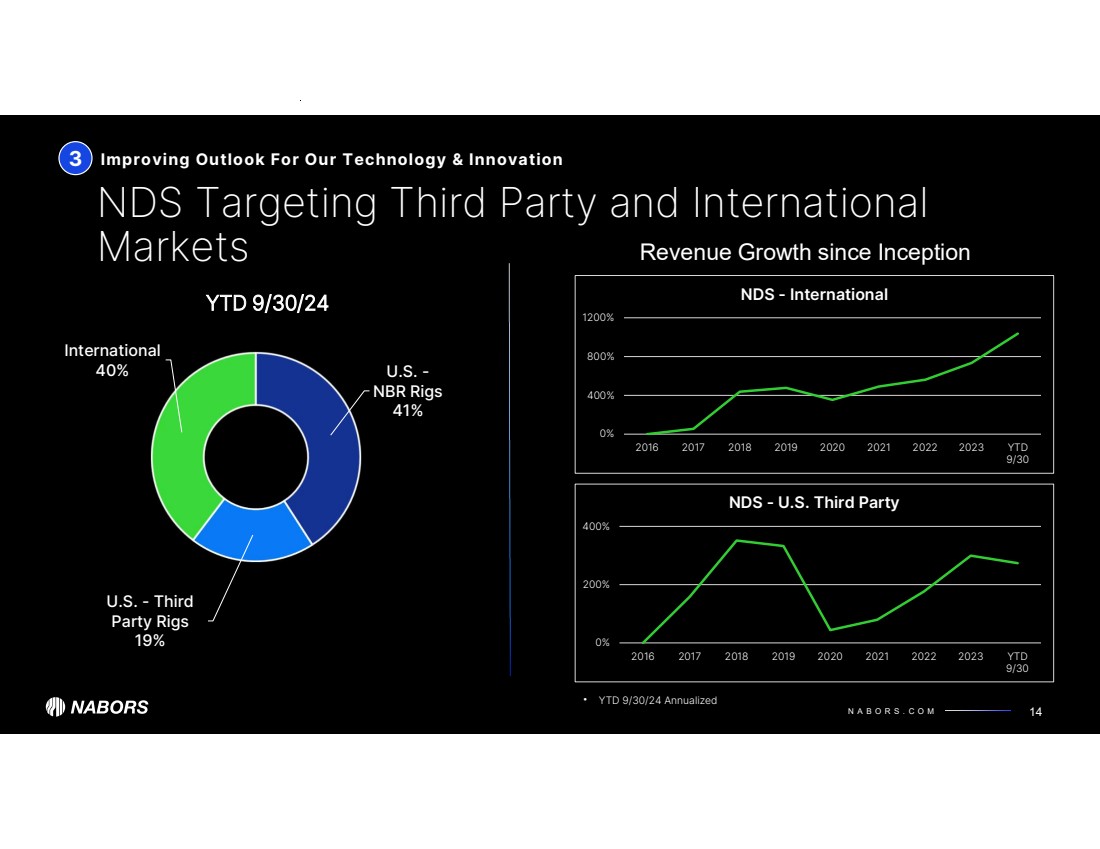
| N A B O R S . C O M 0% 200% 400% 2016 2017 2018 2019 2020 2021 2022 2023 YTD 9/30 NDS - U.S. Third Party 0% 400% 800% 1200% 2016 2017 2018 2019 2020 2021 2022 2023 YTD 9/30 NDS - International NDS Targeting Third Party and International Markets Improving Outlook For Our Technology & Innovation 14 3 • YTD 9/30/24 Annualized U.S. - NBR Rigs 41% U.S. - Third Party Rigs 19% International 40% YTD 9/30/24 Revenue Growth since Inception |
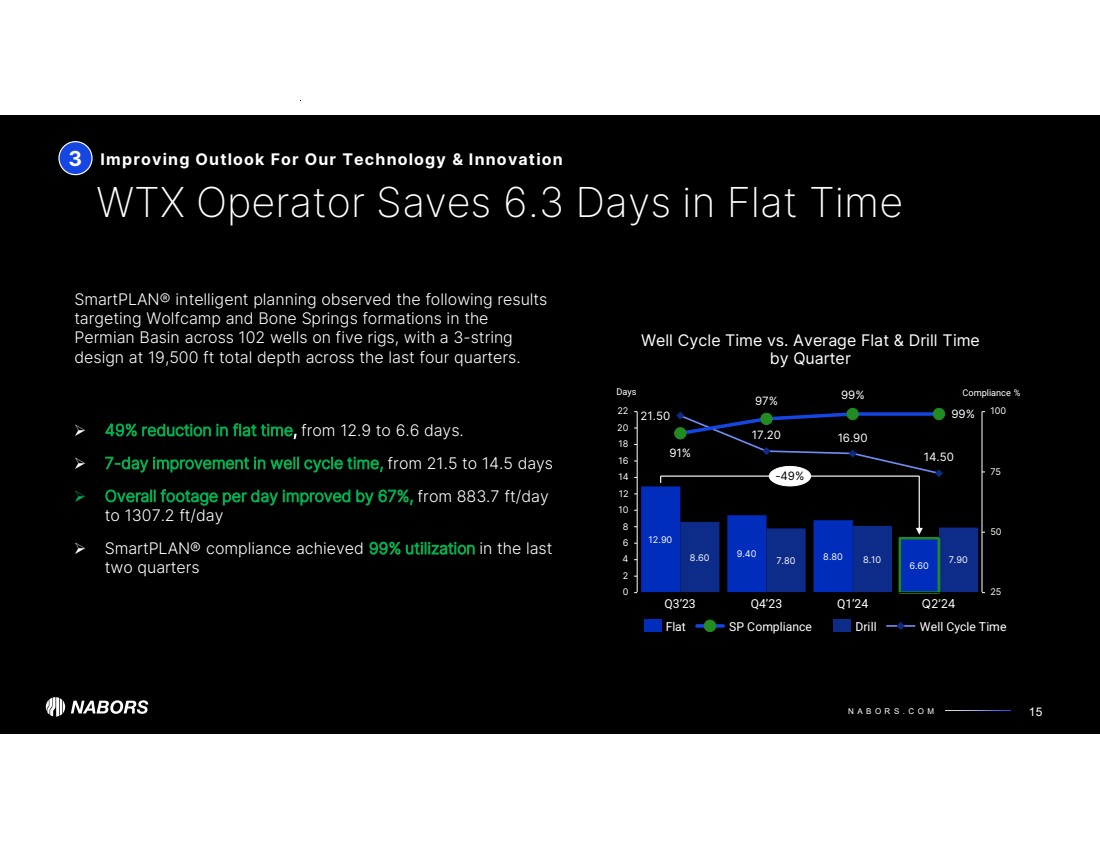
| N A B O R S . C O M WTX Operator Saves 6.3 Days in Flat Time 15 3 Improving Outlook For Our Technology & Innovation 49% reduction in flat time, from 12.9 to 6.6 days. 7-day improvement in well cycle time, from 21.5 to 14.5 days Overall footage per day improved by 67%, from 883.7 ft/day to 1307.2 ft/day SmartPLAN® compliance achieved 99% utilization in the last two quarters Well Cycle Time vs. Average Flat & Drill Time by Quarter 12.90 9.40 8.80 6.60 8.60 7.80 8.10 7.90 21.50 17.20 16.90 14.50 91% 97% 25 50 75 100 0 2 4 6 8 10 12 14 16 18 20 22 Q3’23 Q4’23 99% Q1’24 99% Q2’24 -49% Flat SP Compliance Drill Well Cycle Time Days Compliance % SmartPLAN® intelligent planning observed the following results targeting Wolfcamp and Bone Springs formations in the Permian Basin across 102 wells on five rigs, with a 3-string design at 19,500 ft total depth across the last four quarters. |
| N A B O R S . C O M $- $1.0 $2.0 $3.0 $4.0 1Q 2Q 3Q 4Q 1Q 2Q 3Q 4Q 1Q 2Q 3Q 4Q 1Q 2Q 3Q 4Q 1Q 2Q 3Q 4Q 1Q 2Q 3Q 4Q 1Q 2Q 3Q 2018 2019 2020 2021 2022 2023 2024 Billions Net Debt Significant Headway Improving Leverage Progress on Our Commitment to De-lever 16 $1.8 billion Net Debt(1) reduction since 1Q 2018 $1.8 billion (1) Net Debt is a non-GAAP metric; see reconciliations in the Appendix 4 |
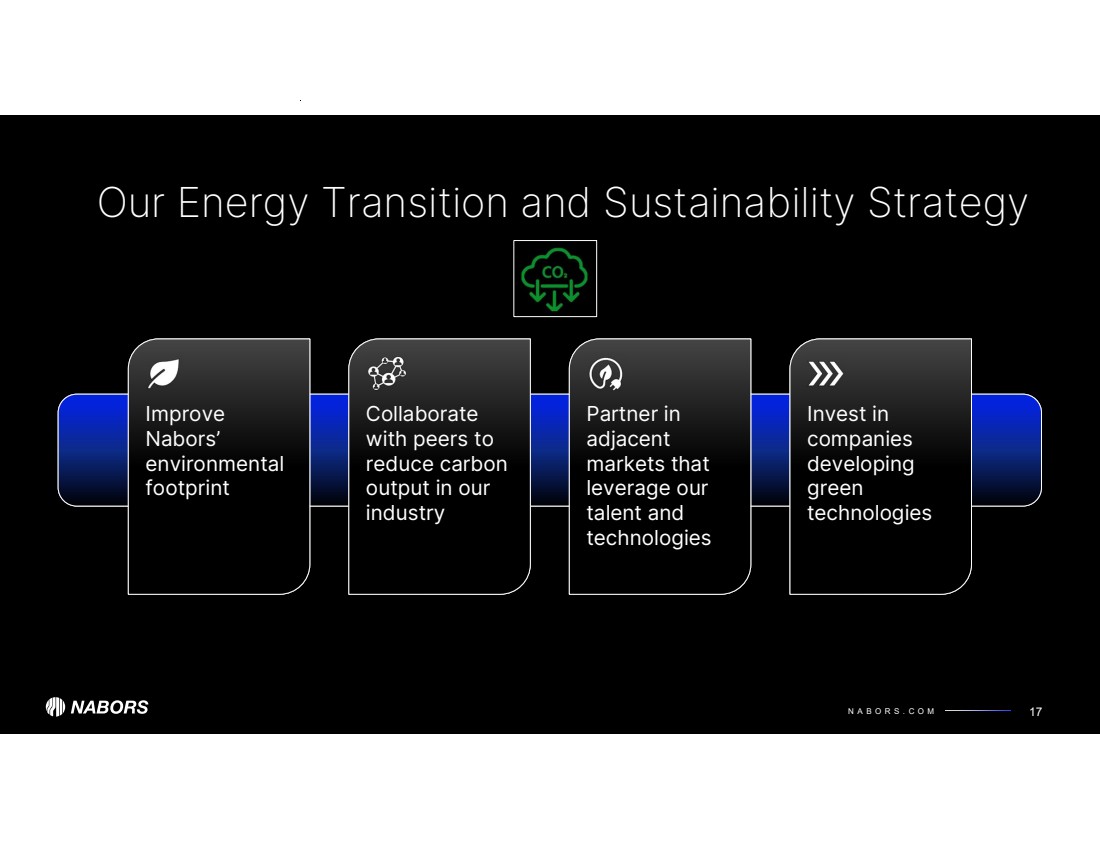
| N A B O R S . C O M Our Energy Transition and Sustainability Strategy 17 Improve Nabors’ environmental footprint Collaborate with peers to reduce carbon output in our industry Partner in adjacent markets that leverage our talent and technologies Invest in companies developing green technologies |
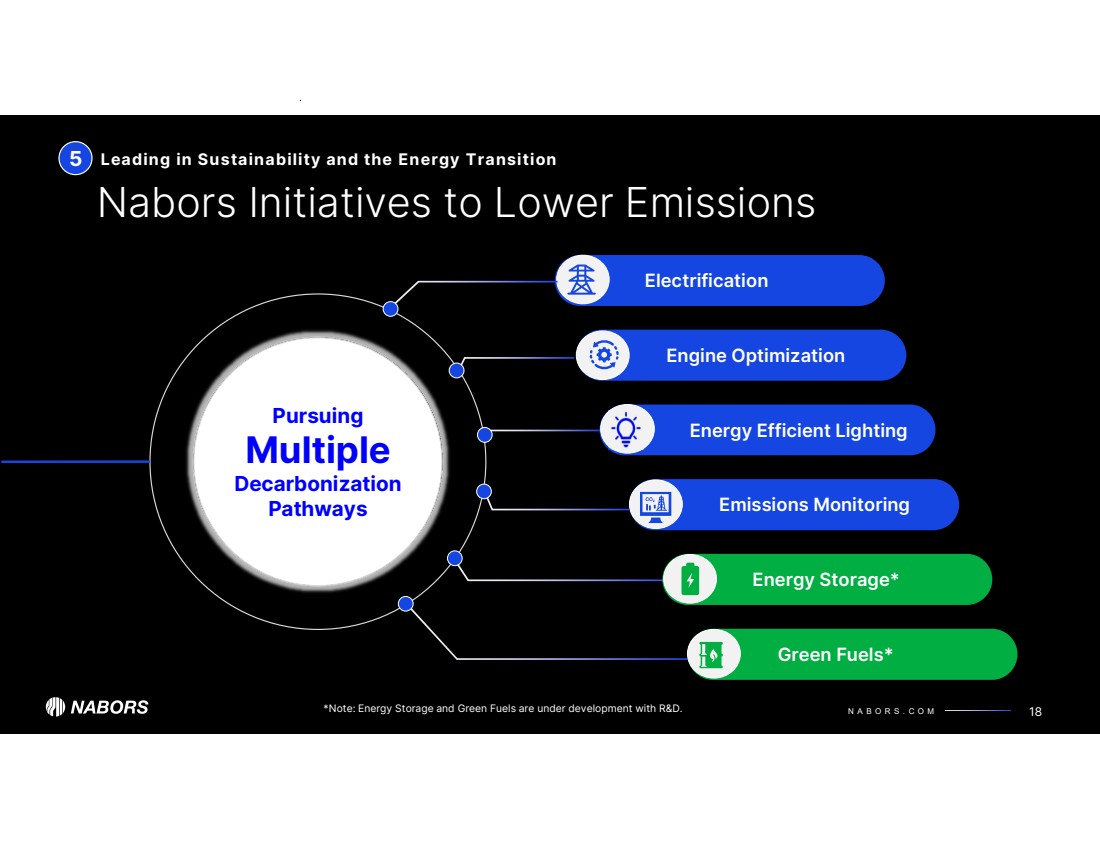
| N A B O R S . C O M Electrification Pursuing Multiple Decarbonization Pathways Green Fuels* Energy Storage* Leading in Sustainability and the Energy Transition Nabors Initiatives to Lower Emissions 18 Emissions Monitoring Engine Optimization 5 Energy Efficient Lighting *Note: Energy Storage and Green Fuels are under development with R&D. |
| Appendix 19 |
| Appendix 20 |
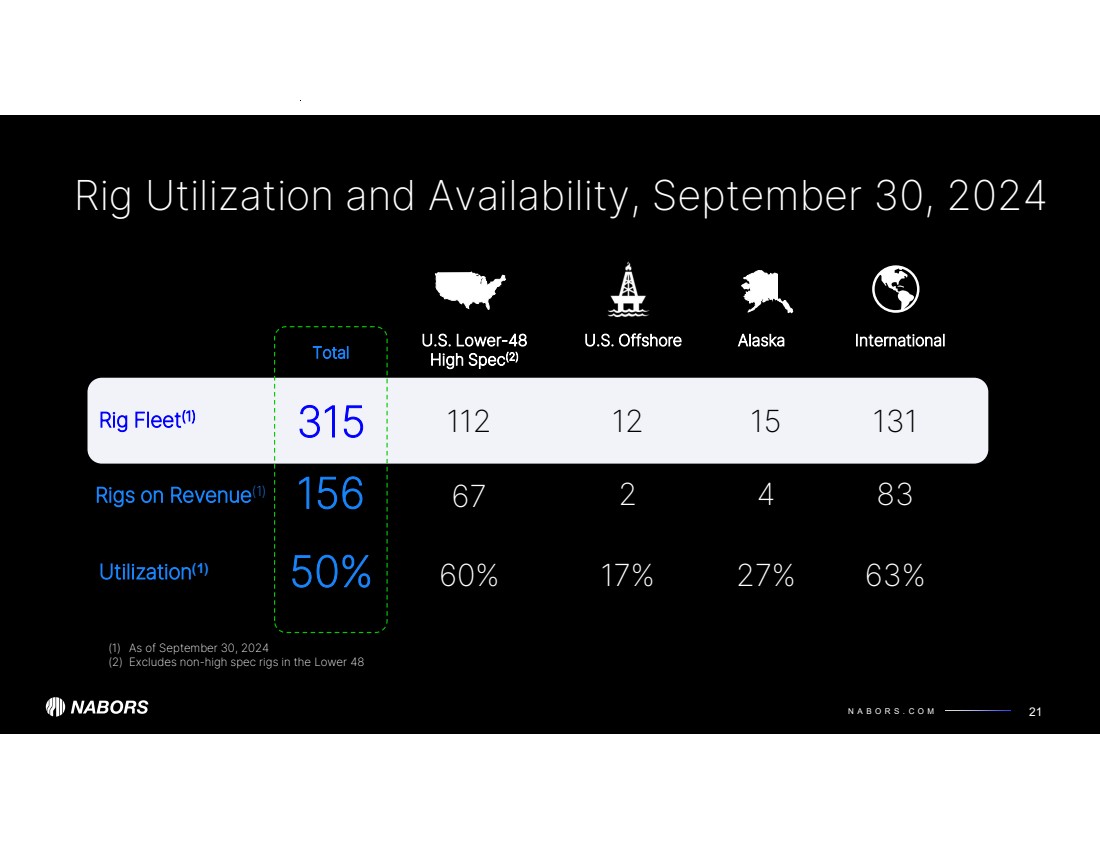
| N A B O R S . C O M Rig Utilization and Availability, September 30, 2024 21 Rig Fleet(1) 315 Rigs on Revenue(1) 156 Utilization(1) 50% Total U.S. Offshore 12 2 17% 15 4 27% Alaska International 131 83 63% 112 67 60% U.S. Lower-48 High Spec(2) (1) As of September 30, 2024 (2) Excludes non-high spec rigs in the Lower 48 |
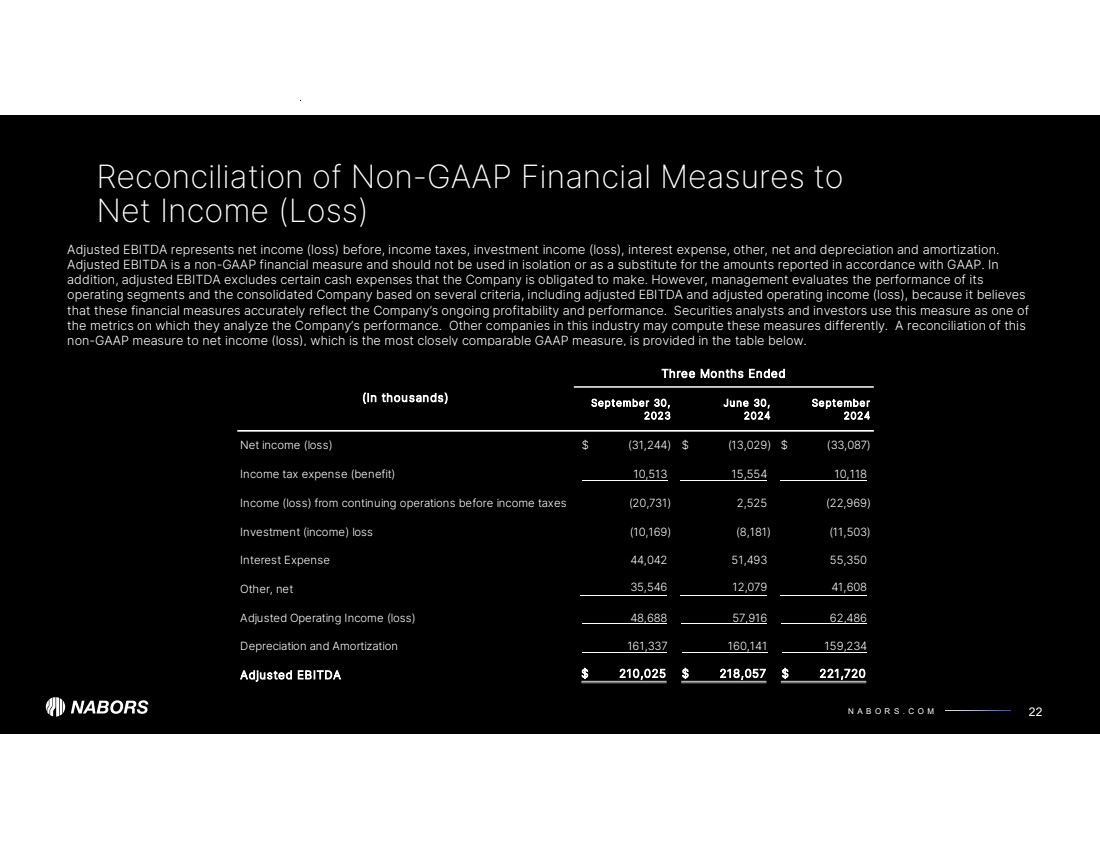
| N A B O R S . C O M Reconciliation of Non-GAAP Financial Measures to Net Income (Loss) 22 Adjusted EBITDA represents net income (loss) before, income taxes, investment income (loss), interest expense, other, net and depreciation and amortization. Adjusted EBITDA is a non-GAAP financial measure and should not be used in isolation or as a substitute for the amounts reported in accordance with GAAP. In addition, adjusted EBITDA excludes certain cash expenses that the Company is obligated to make. However, management evaluates the performance of its operating segments and the consolidated Company based on several criteria, including adjusted EBITDA and adjusted operating income (loss), because it believes that these financial measures accurately reflect the Company’s ongoing profitability and performance. Securities analysts and investors use this measure as one of the metrics on which they analyze the Company’s performance. Other companies in this industry may compute these measures differently. A reconciliation of this non-GAAP measure to net income (loss), which is the most closely comparable GAAP measure, is provided in the table below. (In thousands) September 30, June 30, September 2023 2024 2024 Net income (loss) (31,244) $ (13,029) $ (33,087) $ Income tax expense (benefit) 10,513 15,554 10,118 Income (loss) from continuing operations before income taxes (20,731) 2,525 (22,969) Investment (income) loss (10,169) (8,181) (11,503) Interest Expense 44,042 51,493 55,350 Other, net 35,546 12,079 41,608 Adjusted Operating Income (loss) 48,688 57,916 62,486 Depreciation and Amortization 161,337 160,141 159,234 Adjusted EBITDA $ 210,025 218,057 $ 221,720 $ Three Months Ended |
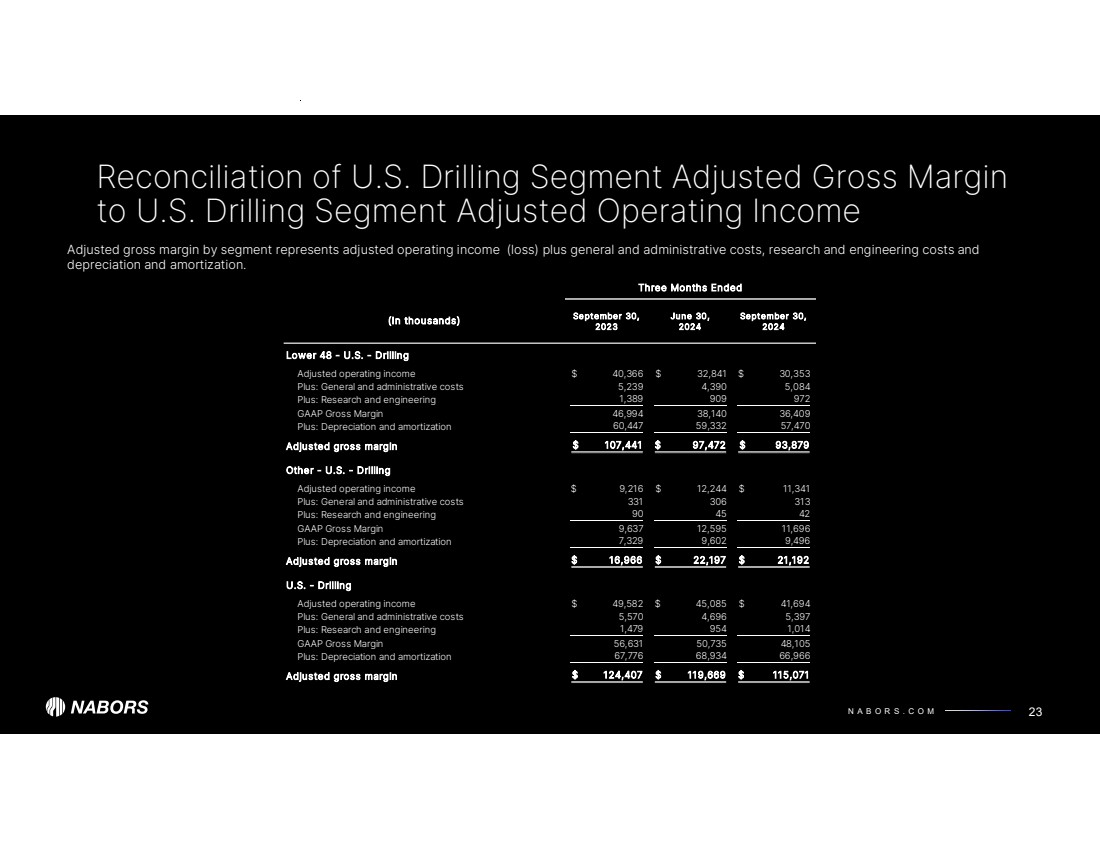
| N A B O R S . C O M Reconciliation of U.S. Drilling Segment Adjusted Gross Margin to U.S. Drilling Segment Adjusted Operating Income 23 Adjusted gross margin by segment represents adjusted operating income (loss) plus general and administrative costs, research and engineering costs and depreciation and amortization. September 30, June 30, September 30, 2023 2024 2024 Lower 48 - U.S. - Drilling Adjusted operating income 40,366 $ 32,841 $ 30,353 $ Plus: General and administrative costs 5,239 4,390 5,084 Plus: Research and engineering 1,389 909 972 GAAP Gross Margin 46,994 38,140 36,409 Plus: Depreciation and amortization 59,332 60,447 57,470 Adjusted gross margin $ 97,472 107,441 $ 93,879 $ Other - U.S. - Drilling Adjusted operating income 9,216 $ 12,244 $ 11,341 $ Plus: General and administrative costs 331 306 313 Plus: Research and engineering 90 45 42 GAAP Gross Margin 9,637 12,595 11,696 Plus: Depreciation and amortization 7,329 9,602 9,496 Adjusted gross margin $ 16,966 22,197 $ 21,192 $ U.S. - Drilling Adjusted operating income 49,582 $ 45,085 $ 41,694 $ Plus: General and administrative costs 5,570 4,696 5,397 Plus: Research and engineering 954 1,479 1,014 GAAP Gross Margin 56,631 50,735 48,105 Plus: Depreciation and amortization 67,776 68,934 66,966 Adjusted gross margin $ 124,407 119,669 $ 115,071 $ (In thousands) Three Months Ended |
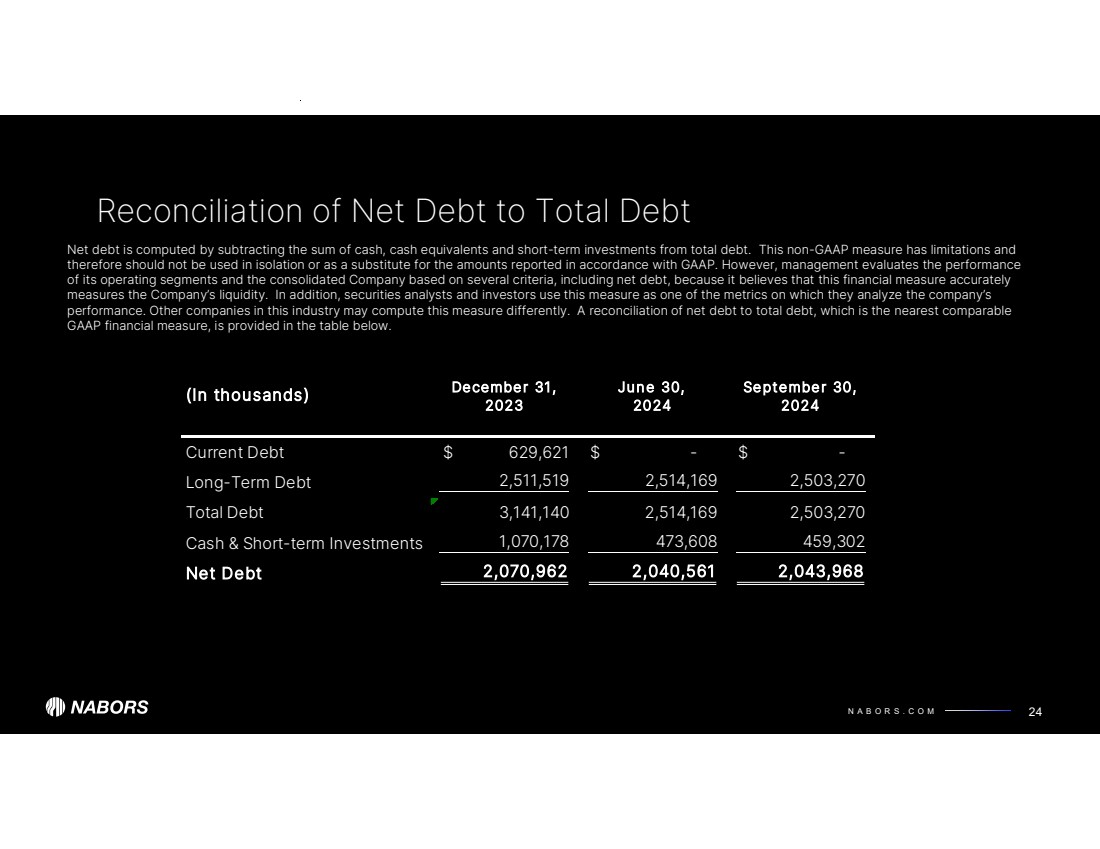
| N A B O R S . C O M Reconciliation of Net Debt to Total Debt 24 Net debt is computed by subtracting the sum of cash, cash equivalents and short-term investments from total debt. This non-GAAP measure has limitations and therefore should not be used in isolation or as a substitute for the amounts reported in accordance with GAAP. However, management evaluates the performance of its operating segments and the consolidated Company based on several criteria, including net debt, because it believes that this financial measure accurately measures the Company’s liquidity. In addition, securities analysts and investors use this measure as one of the metrics on which they analyze the company’s performance. Other companies in this industry may compute this measure differently. A reconciliation of net debt to total debt, which is the nearest comparable GAAP financial measure, is provided in the table below. December 31, June 30, September 30, 2023 2024 2024 Current Debt 629,621 $ - $ - $ Long-Term Debt 2,511,519 2,514,169 2,503,270 Total Debt 3,141,140 2,514,169 2,503,270 Cash & Short-term Investments 1,070,178 473,608 459,302 Net Debt 2,070,962 2,040,561 2,043,968 (In thousands) |
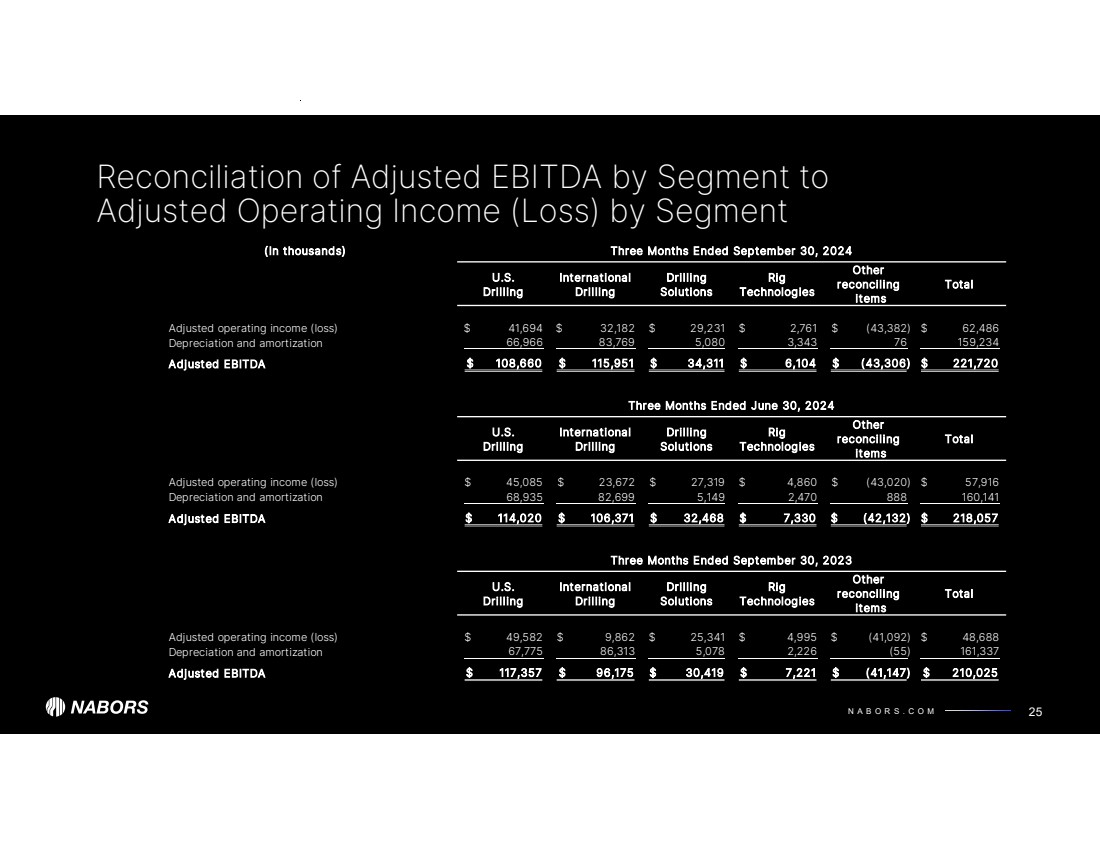
| N A B O R S . C O M Reconciliation of Adjusted EBITDA by Segment to Adjusted Operating Income (Loss) by Segment 25 Adjusted EBITDA by segment represents adjusted income (loss) plus depreciation and amortization. (In thousands) Three Months Ended September 30, 2024 U.S. Drilling International Drilling Drilling Solutions Rig Technologies Other reconciling items Total Adjusted operating income (loss) 41,694 $ 32,182 $ 29,231 $ 2,761 $ (43,382) $ 62,486 $ Depreciation and amortization 83,769 66,966 5,080 3,343 76 159,234 Adjusted EBITDA $ 115,951 108,660 $ 34,311 $ 6,104 $ (43,306) $ 221,720 $ Three Months Ended June 30, 2024 U.S. Drilling International Drilling Drilling Solutions Rig Technologies Other reconciling items Total Adjusted operating income (loss) 45,085 $ 23,672 $ 27,319 $ 4,860 $ (43,020) $ 57,916 $ Depreciation and amortization 82,699 68,935 5,149 2,470 888 160,141 Adjusted EBITDA $ 106,371 114,020 $ 32,468 $ 7,330 $ (42,132) $ 218,057 $ Three Months Ended September 30, 2023 U.S. Drilling International Drilling Drilling Solutions Rig Technologies Other reconciling items Total Adjusted operating income (loss) 49,582 $ 9,862 $ 25,341 $ 4,995 $ (41,092) $ 48,688 $ Depreciation and amortization 67,775 86,313 5,078 2,226 (55) 161,337 Adjusted EBITDA $ 96,175 117,357 $ 30,419 $ 7,221 $ (41,147) $ 210,025 $ |
| N A B O R S . C O M Reconciliation of Adjusted Free Cash Flow to Net Cash Provided by Operating Activities 26 Adjusted free cash flow represents net cash provided by operating activities less cash used for capital expenditures, net of proceeds from sales of assets. Management believes that adjusted free cash flow is an important liquidity measure for the company and that it is useful to investors and management as a measure of the company’s ability to generate cash flow, after reinvesting in the company for future growth, that could be available for paying down debt or to return to shareholders through dividend payments or share repurchases. Adjusted free cash flow does not represent the residual cash flow available for discretionary expenditures. Adjusted free cash flow is a non-GAAP financial measure that should be considered in addition to, not as a substitute for or superior to, cash flow from operations reported in accordance with GAAP. Three Months Ended (In thousands) September 30 2024 Net cash provided by operating activities 143,615 $ Add: Capital expenditures, net of proceeds from sales of assets (126,071) Adjusted free cash flow 17,544 $ |
| N A B O R S . C O M No Offer or Solicitation This communication is not intended to and shall not constitute an offer to sell or the solicitation of an offer to sell or the solicitation of an offer to buy any securities or a solicitation of any vote of approval, nor shall there be any sale of securities in any jurisdiction in which such offer, solicitation or sale would be unlawful prior to registration or qualification under the securities laws of any such jurisdiction. No offering of securities shall be made except by means of a prospectus meeting the requirements of Section 10 of the Securities Act of 1933, as amended. Important Additional Information and Where to Find It This presentation does not constitute an offer to sell or the solicitation of an offer to buy any securities or a solicitation of a vote or proxy. In connection with the proposed transaction Nabors will file with the SEC a Registration Statement on Form S-4 to register the shares of Nabors capital stock to be issued in connection with the proposed transaction. The Registration Statement will include a joint proxy statement/prospectus of Nabors and Parker. The definitive joint proxy statement/prospectus will be sent to the shareholders of each of Nabors and Parker seeking their approval of the proposed transaction and other related matters. WE URGE INVESTORS AND SECURITY HOLDERS TO READ THE REGISTRATION STATEMENT ON FORM S-4 AND THE JOINT PROXY STATEMENT/PROSPECTUS INCLUDED WITHIN THE REGISTRATION STATEMENT ON FORM S-4 AND ANY OTHER RELEVANT DOCUMENTS WHEN THEY BECOME AVAILABLE, BECAUSE THEY WILL CONTAIN IMPORTANT INFORMATION ABOUT PARKER, NABORS AND THE PROPOSED TRANSACTION. Investors and security holders will be able to obtain these materials (when they are available) and other documents filed with the SEC by Nabors or Parker free of charge at the SEC's website, www.sec.gov, or from Nabors at its website, www.nabors.com, or from Parker at its website, www.parkerwellbore.com. Participants in the Solicitation Nabors and certain of its directors, executive officers and other employees, and Parker and certain of its directors, executive officers and other employees may be deemed to be participants in the solicitation of proxies for security holder approvals to be obtained for the proposed transaction. A description of participants' direct or indirect interests, by security holdings or otherwise, will be included in the joint proxy statement/prospectus. Disclaimer NABORS INDUSTRIES 27 |
| NABORS INDUSTRIES LTD. NABORS.COM NABORS CORPORATE SERVICES 515 W. Greens Road Suite 1200 Houston, TX 77067-4525 @ n a b o r s g l o b a l Contact Us: William C. Conroy, CFA VP - Corporate Development and Investor Relations William.Conroy@nabors.com Kara K. Peak Director - Corporate Development and Investor Relations Kara.Peak@nabors.com |
Cover |
Oct. 22, 2024 |
|---|---|
| Cover [Abstract] | |
| Document Type | 8-K |
| Amendment Flag | false |
| Document Period End Date | Oct. 22, 2024 |
| Entity File Number | 001-32657 |
| Entity Registrant Name | NABORS INDUSTRIES LTD. |
| Entity Central Index Key | 0001163739 |
| Entity Tax Identification Number | 98-0363970 |
| Entity Incorporation, State or Country Code | D0 |
| Entity Address, Address Line One | Crown House |
| Entity Address, Address Line Two | 4 Par-la-Ville Road |
| Entity Address, Address Line Three | Second Floor |
| Entity Address, City or Town | Hamilton |
| Entity Address, Country | BM |
| Entity Address, Postal Zip Code | HM08 |
| City Area Code | 441 |
| Local Phone Number | 292-1510 |
| Written Communications | true |
| Soliciting Material | false |
| Pre-commencement Tender Offer | false |
| Pre-commencement Issuer Tender Offer | false |
| Title of 12(b) Security | Common shares |
| Trading Symbol | NBR |
| Security Exchange Name | NYSE |
| Entity Emerging Growth Company | false |
1 Year Nabors Industries (QB) Chart |
1 Month Nabors Industries (QB) Chart |

It looks like you are not logged in. Click the button below to log in and keep track of your recent history.
Support: +44 (0) 203 8794 460 | support@advfn.com
By accessing the services available at ADVFN you are agreeing to be bound by ADVFN's Terms & Conditions

 Hot Features