
We could not find any results for:
Make sure your spelling is correct or try broadening your search.
| Share Name | Share Symbol | Market | Type |
|---|---|---|---|
| Alkame Holdings Inc (CE) | USOTC:ALKM | OTCMarkets | Common Stock |
| Price Change | % Change | Share Price | Bid Price | Offer Price | High Price | Low Price | Open Price | Shares Traded | Last Trade | |
|---|---|---|---|---|---|---|---|---|---|---|
| -0.000099 | -99.00% | 0.000001 | 0.000001 | 0.000001 | 0.000001 | 10,000 | 15:17:03 |
September 3, 2021 -- InvestorsHub NewsWire -- via pennymillions --
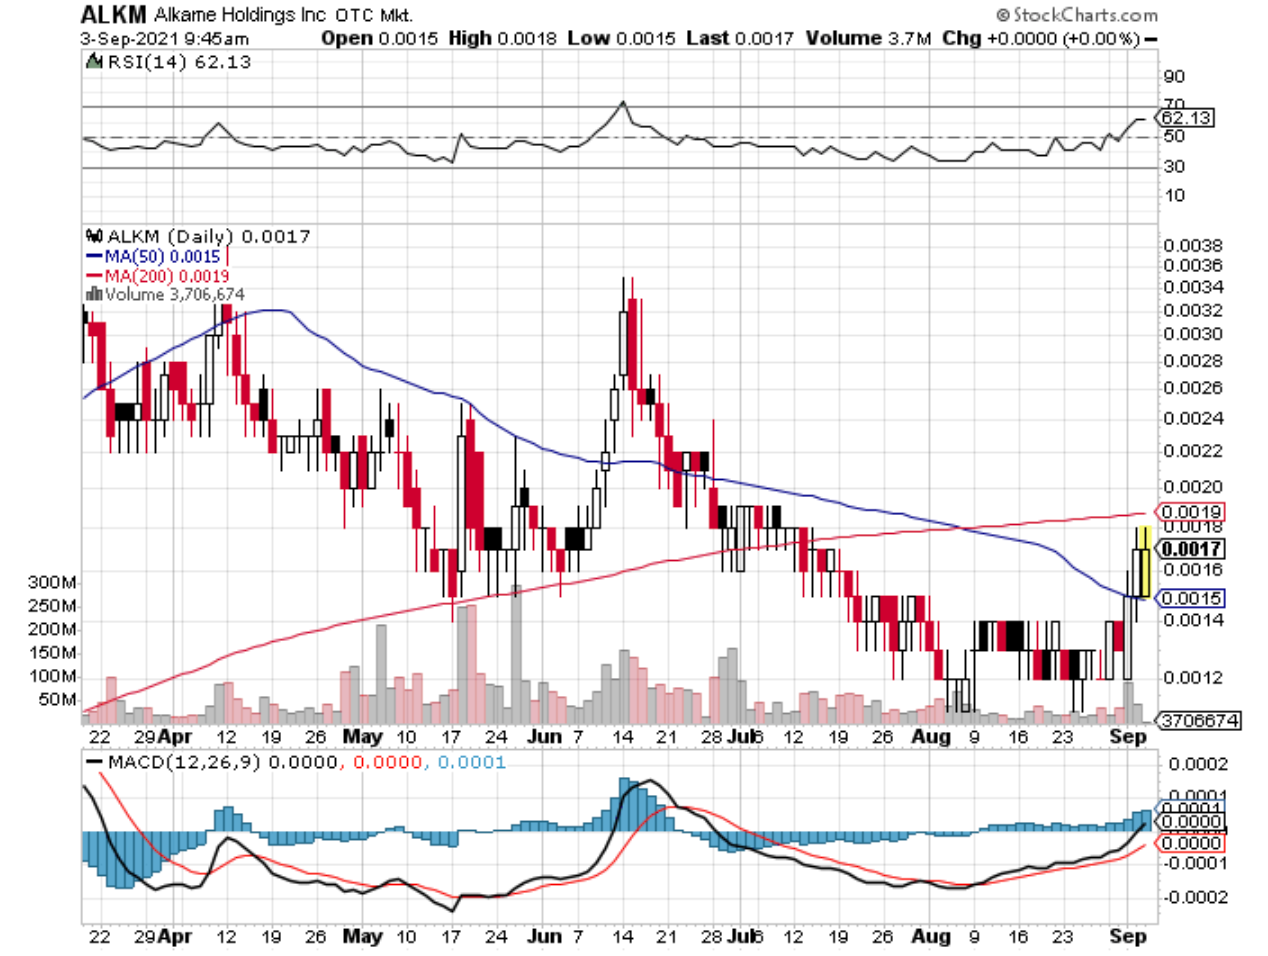
Trading this morning in Alkame Holdings, Inc. (ALKM) is testing the $0.0019 200 Day Moving Average (MA). Earlier this week the PPS broke through the 50 Day MA on balance sheet restructuring news. A 200 Day MA breakthrough could trigger a run back to the $0.009 52 Week High.
Source - https://www.pennymillions.com/blog/alkm-tests-00019-200-day-ma-pennyland-run
Other stocks on the move include CHNC, TGGI and DRNG.
SOURCE: pennymillions
1 Year Alkame (CE) Chart |
1 Month Alkame (CE) Chart |

It looks like you are not logged in. Click the button below to log in and keep track of your recent history.
Support: +44 (0) 203 8794 460 | support@advfn.com
By accessing the services available at ADVFN you are agreeing to be bound by ADVFN's Terms & Conditions
 Hot Features