ADVFN Logo ADVFN

We could not find any results for:
Make sure your spelling is correct or try broadening your search.

Trending Now

Toplists

It looks like you aren't logged in.
Click the button below to log in and view your recent history.

Hot Features

Registration Strip Icon for discussion Register to chat with like-minded investors on our interactive forums.

COF Cofinimmo

55.00
0.05 (0.09%)
09:53:24 - Realtime Data
Share Name Share Symbol Market Type
Cofinimmo TG:COF Tradegate Ordinary Share
  Price Change % Change Share Price Bid Price Offer Price High Price Low Price Open Price Shares Traded Last Trade
  0.05 0.09% 55.00 55.00 55.15 55.00 55.00 55.00 182 09:53:24

Capital One Reports Net Income of $224.2 Million, Excluding the Impact of TARP Preferred Shares Redeemed in the Quarter

23/07/2009 9:05pm

PR Newswire (US)


Cofinimmo (TG:COF)
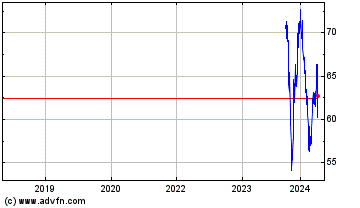
Historical Stock Chart


From Nov 2019 to Nov 2024

Click Here for more Cofinimmo Charts.
Including the impact of TARP, loss per share in the second quarter was $0.65 (diluted) MCLEAN, Va., July 23 /PRNewswire-FirstCall/ -- Second Quarter Highlights -- Managed revenue increased 11.2 percent relative to the first quarter of 2009. -- Lower provision expense relative to the first quarter as an increase in charge-offs was more than offset by an allowance release of $166.2 million. -- The allowance release was due to a $4.5 billion reduction in reported loan balances. -- Allowance as a percentage of reported loans for the company remained stable and strong at 4.84 percent. -- Pre-tax results included an expense of $80.5 million for the FDIC special assessment. -- Repurchased the $3.6 billion of preferred stock issued through Treasury's Capital Purchase Program (CPP) of the Troubled Asset Relief Program (TARP). -- Tangible common equity to tangible managed assets, or "TCE ratio," increased to 5.7 percent, up 90 basis points from the March 31, 2009, ratio of 4.8 percent. Capital One Financial Corporation (NYSE:COF) today announced net income for the second quarter of 2009 of $224.2 million, or $0.53 per common share (diluted) prior to the impact of the government's TARP preferred share investment. After including the $461.7 million impact of the June redemption of the preferred shares and the $38.0 million dividend payment on those shares in the quarter, Capital One posted a net loss available to common shareholders of $0.65 per common share (diluted). "Second quarter results reflect the economic environment and our actions to decisively manage the company through the downturn for the benefit of our shareholders," said Richard D. Fairbank, Capital One's Chairman and Chief Executive Officer. "Despite turbulence in the marketplace, we believe that we remain well positioned to weather the storm, deliver shareholder value over the cycle, and achieve our vision of combining great local banking franchises with a high return credit card business." Total Company Results -- Total managed revenues in the second quarter of 2009 of $4.1 billion increased $418.2 million, or 11.2 percent, relative to the first quarter. Net interest income increased $215.4 million in the second quarter while non-interest income increased $202.8 million. The increase in revenue was driven by a number of factors, including a full quarter of Chevy Chase Bank results and an improvement in both net interest and revenue margins. -- Provision expense was down $228.1 million quarter over quarter as the expected increase in charge-offs in the second quarter was more than offset by the $166.2 million allowance release in the quarter versus an increase in allowance of $124.1 million in the first quarter. -- The allowance release was driven by a reduction in reported loan balances of $4.5 billion. -- Allowance as a percentage of reported loans remained at 4.84 percent in the second quarter and increased 143 basis points from the second quarter of 2008. -- The full quarter effect of Chevy Chase Bank increased average deposits in the quarter by $7.5 billion, while total deposits on June 30, 2009, were $116.7 billion, a decline of $4.4 billion, or 3.6 percent, over the prior quarter, as the company allowed higher cost deposits to run-off as loans contracted in the quarter. -- Deposits represented 65.0 percent of the company's total funding at the end of the second quarter. -- Interest-bearing deposit costs decreased from 2.51 percent in the first quarter to 2.08 percent in the second quarter. -- The weighted average cost of funds decreased by 36 basis points, from 2.76 percent in the first quarter to 2.40 percent in the second quarter. -- Managed loans held for investment decreased by $4.1 billion, or 2.7 percent, from the first quarter of 2009 to $146.3 billion at June 30, 2009, and decreased $996.0 million, or 0.7 percent, from the year ago quarter, primarily as a result of the weak economic environment. -- Non-interest expense increased $176.7 million in the second quarter of 2009 as compared to the first quarter, primarily as a result of an expense of $80.5 million for the FDIC special assessment, which is recorded in the "Other" category, and from a full quarter of Chevy Chase Bank expenses. -- The managed efficiency ratio decreased 103 basis points to 45.28 percent in the second quarter of 2009 from 46.31 percent in the first quarter of 2009. -- The company's TCE ratio was 5.7 percent on June 30, 2009, an improvement of 90 basis points from the first quarter level of 4.8 percent. The Tier 1 risk-based capital ratio of an estimated 9.7 percent reflects impact of the repayment of TARP preferred shares in the second quarter and continues to be well above the regulatory well-capitalized minimum. "Our capital strength was evident in the quarter as we repaid the government's preferred share investment and increased our Tangible Common Equity ratio by 90 basis points to 5.7 percent," said Gary L. Perlin, Capital One's Chief Financial Officer. "In addition, the company's strong deposit franchise helped drive margin expansion through lower funding costs and will continue to serve as a cornerstone of our rock-solid balance sheet." Segment Results Local Banking Segment highlights The Local Banking business posted a net loss of $0.2 million in the second quarter of 2009, an improvement of $36.0 million from the first quarter of 2009. (The results of Chevy Chase Bank are reported in the "Other" category.) The revenue increase in the quarter resulted from favorable loan and deposit pricing, higher average deposit balances, and improving deposit mix. Increases in non-performing loans and charge-offs in the Commercial Lending portfolio were driven primarily by worsening in the Middle Market portfolio, while increases in the Consumer charge-offs and non-performing loans were attributed to falling home prices in the residential mortgage portfolio. -- Local Banking reported a net loss for the second quarter of 2009 of $0.2 million, versus a net loss in the first quarter of 2009 of $36.2 million. -- Revenues improved $43.3 million, or 5.5 percent, primarily due to an increase in deposit margins. Operating expenses increased $11.6 million relative to the first quarter of 2009. -- Local Banking deposits declined $612.5 million, or 0.8 percent, during the second quarter of 2009 to $78.5 billion, while the net interest margin on deposits increased by 21 basis points to 2.08 percent. -- Loans held for investment of $43.7 billion declined $795.7 million, or 1.8 percent, from the first quarter of 2009, primarily driven by the continued run-off of residential mortgage loans, and a decline in small business lending. -- The net charge-off rate increased 34 basis points to 1.10 percent in the second quarter of 2009 from 76 basis points in the first quarter of 2009, primarily as a result of the continuing difficult credit environment. -- Non-performing loans as a percentage of loans held for investment was 2.35 percent, an increase of 58 basis points from 1.77 percent at the end of the first quarter of 2009. The Commercial Loan portfolio's rate increased 47 basis points in the quarter while Consumer Lending's rate increased 78 basis points. National Lending Segment highlights The National Lending segment contains the results of the company's U.S. Card, Auto Finance and International Lending businesses. For details on each of these subsegments' results, please refer to the Financial Supplement. National Lending reported a profit of $270.8 million in the second quarter, up from $75.9 million in the prior quarter, but down relative to $407.6 million in the year ago quarter. Each business within National Lending also reported a profit in the second quarter of 2009 - U.S. Card delivered $168.4 million, the Auto Finance business reported $97.2 million, and International contributed $5.2 million. Performance in the National Lending segment primarily reflects expected continued economic deterioration during the second quarter, although the pace of deterioration was partially offset by seasonal benefits and the company's ongoing efforts to aggressively manage credit risk. -- National Lending segment revenues of $3.1 billion were up $11.5 million in the second quarter of 2009 compared to the first quarter of 2009, but down $253.7 million compared to the second quarter of 2008. -- Revenue margin expanded from 12.43 percent in the first quarter of 2009 to 13.03 percent in the second quarter for National Lending. The individual businesses also reported revenue margin expansion. The company now expects the full year U.S. Card revenue margin to be a bit below 15 percent. -- The managed net charge-off rate for the National Lending segment increased 49 basis points in the second quarter of 2009 to 8.04 percent from 7.55 percent in the first quarter of 2009. - U.S. Card - 9.23 percent, an increase of 84 basis points over the first quarter of 2009 - Auto Finance - 3.65 percent, a decline of 123 basis points from the first quarter - International - 9.32 percent, an increase of 202 basis points over the first quarter of 2009 -- The delinquency rate for the segment was 5.82 percent as of June 30, 2009, an increase of 12 basis points from 5.70 percent as of March 31, 2009. - U.S. Card - 4.77 percent, a decline of 31 basis points over the first quarter of 2009 - Auto Finance - 8.89 percent, an increase of 137 basis points from the first quarter - International - 6.69 percent, an increase of 44 basis points over the first quarter of 2009 -- Managed loans held for investment declined $2.5 billion, or 2.6 percent, to $93.3 billion from $95.8 billion at the end of the first quarter of 2009, and down 8.7 percent relative to the year-ago quarter. - U.S. Card - declined $2.3 billion, or 3.4 percent, to $64.8 billion - Auto Finance - declined $765.5 million, or 3.7 percent, to $19.9 billion - International - increased $568.5 million, or 7.0 percent, to $8.6 billion The company generates earnings from its managed loan portfolio, which includes both on-balance sheet loans and securitized (off-balance sheet) loans. For this reason, the company believes managed financial measures to be useful to stakeholders. In compliance with Regulation G of the Securities and Exchange Commission, the company is providing a numerical reconciliation of managed financial measures to comparable measures calculated on a reported basis using generally accepted accounting principles (GAAP). Please see the schedule titled "Reconciliation to GAAP Financial Measures" attached to this release for more information. Forward looking statements The company cautions that its current expectations in this release, in the presentation slides available on the company's website and in its Form 8-K dated July 23, 2009; and the company's plans, objectives, expectations, and intentions, are forward-looking statements. Actual results could differ materially from current expectations due to a number of factors, including: general economic conditions in the U.S., the UK, or the company's local markets, including conditions affecting consumer income, confidence, spending, and savings which may affect consumer bankruptcies, defaults, charge-offs, deposit activity, and interest rates; changes in the labor and employment market; changes in the credit environment; the company's ability to execute on its strategic and operational plans; competition from providers of products and services that compete with the company's businesses; increases or decreases in the company's aggregate accounts and balances, or the growth rate and/or composition thereof; changes in the reputation of or expectations regarding the financial services industry or the company with respect to practices, products or financial condition; financial, legal, regulatory, tax or accounting changes or actions, including with respect to any litigation matter involving the company; and the success of the company's marketing efforts in attracting or retaining customers. A discussion of these and other factors can be found in the company's annual report and other reports filed with the Securities and Exchange Commission, including, but not limited to, the company's reports on Form 10-K for the fiscal year ended December 31, 2008 and report on Form 10-Q for the quarter ended March 31, 2009. About Capital One Capital One Financial Corporation (http://www.capitalone.com/) is a financial holding company whose subsidiaries, which include Capital One, N.A., Capital One Bank (USA), N. A., and Chevy Chase F.S.B. collectively, had $116.7 billion in deposits and $146 billion in managed loans outstanding as of June 30, 2009. Headquartered in McLean, Virginia, Capital One offers a broad spectrum of financial products and services to consumers, small businesses and commercial clients. Capital One, N.A. and Chevy Chase Bank, F.S.B. have approximately 1,000 branch locations primarily in New York, New Jersey, Texas, Louisiana, Maryland, Virginia, and the District of Columbia. A Fortune 500 company, Capital One trades on the New York Stock Exchange under the symbol "COF" and is included in the S&P 100 index. NOTE: Second quarter 2009 financial results, SEC Filings, and earnings conference call slides are accessible on Capital One's home page (http://www.capitalone.com/). Choose "Investors" on the bottom of the home page to view and download the earnings press release, slides, and other financial information. Additionally, a podcast and webcast of today's 5:00 pm (ET) earnings conference call is accessible through the same link. CAPITAL ONE FINANCIAL CORPORATION (COF) FINANCIAL & STATISTICAL SUMMARY REPORTED BASIS (in millions, except per share 2009 2009 2008 data and as noted) Q2 Q1(8) Q2 ------- ------- ------- Earnings (Reported Basis) Net Interest Income $1,946.6 $1,786.8 $1,727.8 Non-Interest Income (2) 1,231.7 (5) 1,090.3 1,622.3 (5) ------- ------- ------- Total Revenue (1) 3,178.3 2,877.1 3,350.1 Provision for Loan Losses 934.0 1,279.1 829.1 Marketing Expenses 134.0 162.7 288.1 Restructuring Expenses 43.4 17.6 13.6 Operating Expenses (3) 1,744.4 (9) 1,564.8 1,517.9 ------- ------- ------- Income (Loss) Before Taxes 322.5 (147.1) 701.4 Tax Rate 28.6% 40.9% 34.1% Income (Loss)From Continuing Operations, Net of Tax $230.2 $(86.9) $462.5 Loss From Discontinued Operations, Net of Tax (6.0) (25.0) (9.6) ---- ----- ---- Net Income (Loss) $224.2 $(111.9) $452.9 ------ ------- ------ Net Income (Loss) Available to Common Shareholders (F) $(275.5)(11) $(176.1) $452.9 ------------------------ ------- ------- ------ Common Share Statistics Basic EPS: (G) Income (Loss) From Continuing Operations $(0.64) $(0.39) $1.24 Loss From Discontinued Operations $(0.01) $(0.06) $(0.03) ------ ------ ------ Net Income (Loss) $(0.65) $(0.45) $1.21 Diluted EPS: (G) Income (Loss) From Continuing Operations $(0.64) $(0.39) $1.24 Loss From Discontinued Operations $(0.01) $(0.06) $(0.03) ------ ------ ------ Net Income (Loss) $(0.65) $(0.45) $1.21 Dividends Per Common Share $0.05 $0.375 $0.375 Tangible Book Value Per Common Share (period end) $25.34 $25.11 $30.77 Stock Price Per Common Share (period end) $21.88 $12.24 $38.01 Total Market Capitalization (period end) $9,826.3 $4,806.6 $14,280.4 Common Shares Outstanding (period end) 449.1 392.7 375.7 Shares Used to Compute Basic EPS 421.9 390.5 372.3 Shares Used to Compute Diluted EPS 421.9 390.5 373.7 ------------ ----- ----- ----- Reported Balance Sheet Statistics (period average) (A) Average Loans Held for Investment $105,278 $103,445 $97,950 Average Earning Assets $151,400 $145,374 $131,629 Average Assets $177,589 $168,454 $154,288 Average Interest Bearing Deposits $107,040 $100,852 $78,675 Total Average Deposits $119,611 $112,138 $89,522 Average Equity $27,658 (7),(10) $27,002 $24,839 Return on Average Assets (ROA) 0.52% (0.21)% 1.20% Return on Average Equity (ROE) 3.33% (1.29)% 7.45% ----------------------------- ---- ----- ---- Reported Balance Sheet Statistics (period end) (A) Loans Held for Investment $101,074 $105,527 $97,065 Total Assets $171,865 $177,357 $150,978 Interest Bearing Deposits $104,121 $108,696 $81,655 Total Deposits $116,724 $121,119 $92,407 -------------- -------- -------- ------- Performance Statistics (Reported) (A) Net Interest Income Growth (annualized) 36% (3)% (19)% Non Interest Income Growth (annualized) 52% (81)% (84)% Revenue Growth (annualized) 42% (37)% (54)% Net Interest Margin 5.14% 4.92% 5.25% Revenue Margin 8.40% 7.92% 10.18% Risk Adjusted Margin (B) 5.44% 4.90% 7.77% Non Interest Expense as a % of Average Loans Held for Investment (annualized) 7.30% 6.75% 7.43% Efficiency Ratio ( C ) 59.10% 60.04% 53.91% ---------------------- ----- ----- ----- Asset Quality Statistics (Reported) (A) Allowance $4,482 $4,648 $3,311 Allowance as a % of Reported Loans Held for Investment 4.84%(4) 4.84%(4) 3.41% Net Charge-Offs $1,119 (4) $1,097(4) $793 Net Charge-Off Rate 4.66%(4) 4.41%(4) 3.24% Delinquency Rate (30+ days) 4.04%(4) 3.99%(4) 3.43% -------------------------- ---- ---- ---- Full-time equivalent employees (in thousands) 26.6 27.5 24.0 ------------------------ ---- ---- ---- CAPITAL ONE FINANCIAL CORPORATION (COF) FINANCIAL & STATISTICAL SUMMARY MANAGED BASIS (*) 2009 2009 2008 (in millions) Q2 Q1 (8) Q2 ------------- ------- ------ ------- Earnings (Managed Basis) Net Interest Income $2,959.2 $2,743.8 $2,788.0 Non-Interest Income (2) 1,189.0 (5) 986.2 1,302.0 (5) ------- ----- ------- Total Revenue (1) 4,148.2 3,730.0 4,090.0 Provision for Loan Losses 1,903.9 2,132.0 1,569.0 Marketing Expenses 134.0 162.7 288.1 Restructuring Expenses 43.4 17.6 13.6 Operating Expenses (3) 1,744.4 (9) 1,564.8 1,517.9 ------- ------- ------- Income (Loss) Before Taxes 322.5 (147.1) 701.4 Tax Rate 28.6% 40.9% 34.1% Income (Loss) From Continuing Operations, Net of Tax $230.2 $(86.9) $462.5 Loss From Discontinued Operations, Net of Tax (6.0) (25.0) (9.6) ---- ----- ---- Net Income (Loss) $224.2 $(111.9) $452.9 ------ ------- ------ Net Income (Loss) Available to Common Shareholders (F) $(275.5)(11) $(176.1) $452.9 -------------------- ------- ------- ------ Managed Balance Sheet Statistics (period average) (A) Average Loans Held for Investment $148,609 $147,385 $147,716 Average Earning Assets $191,804 $186,817 $179,421 Average Assets $218,325 $210,133 $203,308 Return on Average Assets (ROA) 0.42% (0.17)% 0.91% ------------------------ ---- ----- ---- Managed Balance Sheet Statistics (period end) (A) Loans Held for Investment $146,251 $150,335 $147,247 Total Assets $214,095 $219,883 $200,420 Tangible Assets(D) $200,110 $206,161 $187,059 Tangible Common Equity (E) $11,379 $9,862 $11,560 Tangible Common Equity to Tangible Assets Ratio (H) 5.69%(6) 4.78% 6.18% % Off-Balance Sheet Securitizations 31% 30% 34% -------------------- -- -- -- Performance Statistics (Managed) (A) Net Interest Income Growth (annualized) 31% (3)% (25)% Non Interest Income Growth (annualized) 82% (67)% (76)% Revenue Growth (annualized) 45% (22)% (43)% Net Interest Margin 6.17% 5.87% 6.22% Revenue Margin 8.65% 7.99% 9.12% Risk Adjusted Margin (B) 4.29% 3.72% 5.70% Non Interest Expense as a % of Average Loans Held for Investment (annualized) 5.17% 4.74% 4.93% Efficiency Ratio ( C ) 45.28% 46.31% 44.16% ---------------------- ----- ----- ----- Asset Quality Statistics (Managed) (A) Net Charge-Offs $2,089 (4) $1,991(4) $1,533 Net Charge-Off Rate 6.00%(4) 5.52%(4) 4.15% Delinquency Rate (30+ days) 4.34%(4) 4.36%(4) 3.64% --------------------- ---- ---- ---- (*) The information in this statistical summary reflects the adjustment to add back the effect of securitization transactions qualifying as sales under generally accepted accounting principles. See accompanying schedule - "Reconciliation to GAAP Financial Measures". CAPITAL ONE FINANCIAL CORPORATION (COF) FINANCIAL & STATISTICAL SUMMARY NOTES (1) In accordance with the Company's finance charge and fee revenue recognition policy, the amounts billed to customers but not recognized as revenue were as follows: Q2 2009 - $571.9 million, Q1 2009 - $544.4 million and Q2 2008 - $476.0 million. (2) Includes the impact from the decrease in fair value of retained interests, including the interest-only strips, of $127.0 million in Q2 2009, $128.0 million in Q1 2009 and $71.7 million in Q2 2008. (3) Includes core deposit intangible amortization expense of $57.4 million in Q2 2009, $49.2 million in Q1 2009 and $48.5 million in Q2 2008, and integration costs of $8.8 million in Q2 2009, $23.6 million in Q1 2009 and $27.4 million in Q2 2008. (4) Excludes the impact from the Chevy Chase Bank, FSB acquired loan portfolio. See accompanying schedule Impact of Chevy Chase Bank, FSB (CCB) Acquisition. (5) In Q2 2009 and 2008 the Company elected to convert and sell 404,508 shares and 154,991 shares of MasterCard class B common stock, respectively. The Company recognized gains of $65.5 million and $44.9 million in non-interest income from those transactions, respectively. (6) The Q2 2009 TCE ratio reflects the issuance of 56,000,000 common shares on May 14, 2009 at $27.75 per share. (7) Average equity includes the impact of the Company's participation in the U.S. Treasury's Capital Purchase Program. On June 17, 2009, the Company repurchased all 3,555,199 preferred shares issued in Q4 2008 for approximately $3.57 billion, including accrued dividends. The warrants to purchase common shares of $491.5 million remain outstanding and are included in paid-in capital on the balance sheet. (8) Effective February 27, 2009 the Company acquired Chevy Chase Bank, FSB for $475.9 million, which included $9.8 billion in loans and $13.6 billion in deposits. The Company paid cash of $445.0 million and issued 2.6 million shares valued at $30.9 million. (9) Includes the FDIC Special Assessment of $80.5 million. (10) Average equity includes the impact of the issuance of 56,000,000 common shares on May 14, 2009 at $27.75 per share. (11) The calculation of net income (loss) available to common shareholders includes the impact from dividends on preferred shares of $38.0 million and from the accretion of the discount on preferred shares of $461.7 million. With the repayment of the preferred shares to the U.S. Treasury, the remaining accretion was accelerated to Q2 2009 and treated as a dividend. STATISTICS / METRIC DEFINITIONS (A) Based on continuing operations. Average equity and return on equity are based on the Company's stockholders' equity. (B) Risk adjusted margin equals total revenue less net charge-offs as a percentage of average earning assets. ( C ) Efficiency ratio equals non-interest expense less restructuring expense divided by total revenue. (D) Tangible assets include managed assets less intangible assets and is considered a non-GAAP measure. See accompanying schedule Reconciliation To GAAP Financial Measures for a reconciliation of tangible assets. (E) Includes stockholders' equity less preferred shares less intangible assets and related deferred tax liabilities. Tangible Common Equity on a reported and managed basis is the same and is considered a non-GAAP measure. See accompanying schedule Reconciliation To GAAP Financial Measures for a reconciliation of tangible common equity. (F) Net income (loss) available to common shareholders equals net income (loss) less dividends on preferred shares. (G) Earnings per share is based on net income (loss) available to common shareholders. (H) Tangible Common Equity to Tangible Assets Ratio ("TCE Ratio") is considered a non-GAAP measure. See accompanying schedule Reconciliation To GAAP Financial Measures for a reconciliation of the TCE Ratio. CAPITAL ONE FINANCIAL CORPORATION (COF) IMPACT OF CHEVY CHASE BANK, FSB (CCB) ACQUISITION Q2 2009 ------- (in millions, except per share data and COF w/out as noted) COF CCB CCB --------------------------------------- --- --- --- Earnings (Reported Basis) Total Revenue $3,178.3 $179.3 $3,999.0 Provision for Loan Losses 934.0 2.8 931.2 Marketing Expenses 134.0 1.8 132.2 Restructuring Expenses 43.4 - 43.4 Operating Expenses 1,744.4 151.1 1,593.3 ------- ----- ------- Income (Loss) From Continuing Operations, Net of Tax 230.2 15.3 214.9 Loss From Discontinued Operations, Net of Tax (6.0) - (6.0) ---- --- ---- Net Income (Loss) $224.2 $15.3 $208.9 ------ ----- ------ Net Income (Loss) Available to Common Shareholders $(275.5) $15.3 ($290.8) ------------------------------------- ------- ----- ------- Common Share Statistics Diluted EPS $(0.65) $(0.69) Shares Used to Compute Diluted EPS 421.9 419.3 ---------------------------------- ----- ----- Reported Balance Sheet Statistics (period end) (2) Loans (1) $101,378 $9,010 $92,368 Less: Allowance for Loan and Lease Losses $(4,482) $(3) $(4,479) ------- --- ------- Net Loans $96,896 $9,007 $87,889 Goodwill $13,381 $1,405 $11,976 Core Deposit Intangible $958 $223 $735 Total Assets $171,865 $15,396 $156,469 Total Deposits $116,724 $13,873 $102,851 Borrowings $23,338 $932 $22,406 ---------- ------- ---- ------- Return on Average Assets (ROA) (period average) (2) ROA (Reported) 0.52% 0.52% ROA (Managed) 0.42% 0.41% ------------- ---- ---- Managed Balance Sheet Statistics (period end) (2) Loans (1) $146,555 $9,010 $137,545 Tangible Assets $200,110 $186,298 Tangible Common Equity $11,379 $12,936 Tangible Common Equity to Tangible Assets Ratio 5.69% 6.94% ----------------------------------------- ---- ---- Revenue & Expense Statistics Revenue Margin (Reported) 8.40% 8.53% Revenue Margin (Managed) 8.65% 8.77% ------------------------ ---- ---- Reconciliation of Credit Mark Balance at beginning of period - March 31, 2009 $2,165 Charge-offs applied to credit mark $151 ---- Balance at end of period - June 30, 2009 $2,014 ---------------------------------------- ------ Acquired Loan Portfolio Information Loans 30 to 89 days past due $254 Loans 90+ days past due $1,117 Foreclosed assets $162 ----------------- ---- (1) Loans include loans held for investment of $8.7 billion and loans held for sale of $304.0 million. Loans represent acquired and originated loans. Loans held for investment originated since acquisition total $301.3 million. Total loans are inclusive of the credit mark of $2.0 billion at June 30, 2009. (2) Based on continuing operations. CAPITAL ONE FINANCIAL CORPORATION (COF) SEGMENT FINANCIAL & STATISTICAL SUMMARY FOR CONTINUING OPERATIONS MANAGED BASIS (1) 2009 2009 2008 (in thousands) Q2 Q1 Q2 -------------- ------- ------- ------- Local Banking (6): Interest Income $1,317,886 $1,324,980 $1,489,612 Interest Expense 680,503 725,951 899,907 ------- ------- ------- Net interest income $637,383 $599,029 $589,705 Non-interest income 189,475 184,510 192,758 Provision for loan losses 195,765 219,369 92,043 Other non-interest expenses 631,417 619,854 587,211 Income tax provision (113) (19,490) 36,123 ---- ------- ------ Net income (loss) $(211) $(36,194) $67,086 ===== ======== ======= Loans Held for Investment $43,662,945 $44,458,675 $44,270,734 Average Loans Held for Investment $44,171,188 $44,836,954 $44,250,451 Core Deposits(2) $68,118,408 $67,848,575 $63,407,571 Total Deposits $78,502,170 $79,114,684 $74,245,677 Loans Held for Investment Yield 5.32% 5.36% 6.35% Deposit Interest Expense Rate 1.59% 1.80% 2.28% Net Interest Margin - Loans(3) 2.20% 2.25% 1.99% Net Interest Margin - Deposits(4) 2.08% 1.87% 2.04% Efficiency Ratio(5) 76.36% 79.11% 75.05% Net charge-off rate 1.10% 0.76% 0.34% Non Performing Loans $1,026,177 $785,279 $359,017 Foreclosed Assets 72,116 63,173 29,607 ------ ------ ------ Non Performing Assets (8) $1,098,293 $848,452 $388,624 Non Performing Loans as a % of Loans Held for Investment 2.35% 1.77% 0.81% Non Performing Asset Rate (8) 2.51% 1.91% 0.88% Number of Active ATMs 1,345 (9) 1,338 (9) 1,303 Number of Locations (10) 732 (11) 728 (11) 725 National Lending: Interest Income $2,880,617 $2,837,945 $3,181,773 Interest Expense 710,301 776,254 1,014,244 ------- ------- --------- Net interest income $2,170,316 $2,061,691 $2,167,529 Non-interest income 908,301 1,005,446 1,164,810 Provision for loan losses 1,646,258 1,848,955 1,470,642 Other non-interest expenses 1,016,331 1,100,770 1,236,567 Income tax provision 145,198 41,532 217,496 ------- ------ ------- Net income (loss) $270,830 $75,880 $407,634 ======== ======= ======== Loans Held for Investment $93,300,970 $95,753,037 $102,201,802 Average Loans Held for Investment $94,481,457 $98,680,911 $102,629,246 Core Deposits(2) $- $478 $1,954 Total Deposits $1,281,217 $1,279,562 $1,644,241 Loans Held for Investment Yield 12.20% 11.50% 12.40% Net Interest Margin 9.19% 8.36% 8.45% Revenue Margin 13.03% 12.43% 12.99% Risk Adjusted Margin 4.99% 4.88% 7.31% Non-Interest Expenses as a % of Average Loans Held for Investment 4.30% 4.46% 4.82% Efficiency Ratio(5) 33.01% 35.89% 37.11% Net charge-off rate 8.04% 7.55% 5.67% Delinquency Rate (30+ days) 5.82% 5.70% 4.87% Number of Loan Accounts (000s) 40,697 42,549 45,812 Other (6): Net interest income $151,494 $83,033 $30,761 Non-interest income 91,239 (203,804) (55,594) Provision for loan losses 61,950 63,633 6,342 Restructuring expenses 43,374 17,627 13,560 Other non-interest expenses 230,634 6,841 (17,737) Income tax provision (benefit) (52,807) (82,265) (14,776) ------- ------- ------- Net income (loss) $(40,418) $(126,607) $(12,222) ======== ========= ======== Loans Held for Investment $9,286,809 $10,123,282 $774,724 Core Deposits(2) $34,755,086 $37,853,289 $14,800,701 Total Deposits $36,940,803 $40,724,652 $16,517,143 Total: Interest Income $3,994,692 $3,888,885 $4,270,572 Interest Expense 1,035,499 1,145,132 1,482,577 --------- --------- --------- Net interest income $2,959,193 $2,743,753 $2,787,995 Non-interest income 1,189,015 986,152 1,301,974 Provision for loan losses 1,903,973 2,131,957 1,569,027 Restructuring expenses 43,374 17,627 13,560 Other non-interest expenses 1,878,382 1,727,465 1,806,041 Income tax provision 92,278 (60,223) 238,843 ------ ------- ------- Net income (loss) $230,201 $(86,921) $462,498 ======== ======== ======== Loans Held for Investment $146,250,724 $150,334,994 $147,247,260 Core Deposits(2) $102,873,494 $105,702,342 $78,210,226 Total Deposits $116,724,190 $121,118,898 $92,407,061 CAPITAL ONE FINANCIAL CORPORATION (COF) LOCAL BANKING SEGMENT FINANCIAL & STATISTICAL INFORMATION 2009 2009 2008 (in thousands) Q2 Q1 Q2 -------------- --------- --------- --------- Loans Held for Investment: Commercial Lending Commercial and Multi-Family Real Estate $13,646,921 $13,619,009 $12,948,037 Middle Market 9,755,280 9,850,735 8,923,233 Specialty Lending 3,469,699 3,489,813 3,693,532 --------- --------- --------- Total Commercial Lending $26,871,900 $26,959,557 $25,564,802 Small Ticket Commercial Real Estate $2,503,034 $2,568,395 $2,746,931 Small Business Lending $4,561,896 $4,729,266 $4,555,432 Consumer Lending Mortgages $6,438,461 $6,831,471 $7,803,032 Branch Based Home Equity & Other Consumer 3,486,990 3,593,638 3,887,936 --------- --------- --------- Total Consumer Lending $9,925,451 $10,425,109 $11,690,968 Other $(199,336) $(223,652) $(287,399) ----------- ----------- ----------- Total Loans Held for Investment $43,662,945 $44,458,675 $44,270,734 =========== =========== =========== Non Performing Asset Rates (8): Commercial Lending Commercial and Multi-Family Real Estate 2.24% 1.98% 0.87% Middle Market 1.21% 0.57% 0.31% Specialty Lending 1.97% 1.16% 0.25% ---- ---- ---- Total Commercial Lending 1.83% 1.36% 0.58% Small Ticket Commercial Real Estate 10.08% 8.00% 2.74% Small Business Lending 2.20% 1.95% 1.17% Consumer Lending Mortgages 3.56% 2.36% 1.22% Branch Based Home Equity & Other Consumer 0.61% 0.58% 0.39% ---- ---- ---- Total Consumer Lending 2.53% 1.75% 0.95% ---- ---- ---- Total Non Performing Asset Rate 2.51% 1.91% 0.88% ==== ==== ==== Net Charge Off Rates: Commercial Lending Commercial and Multi-Family Real Estate 0.95% 0.62% 0.10% Middle Market 0.62% 0.07% 0.05% Specialty Lending 0.99% 0.85% 0.16% ---- ---- ---- Total Commercial Lending 0.83% 0.45% 0.09% Small Ticket Commercial Real Estate 1.90% 1.75% (0.03)% Small Business Lending 1.99% 1.55% 0.91% Consumer Lending Mortgages 0.86% 0.46% 0.35% Branch Based Home Equity & Other Consumer 1.47% 1.42% 1.02% ---- ---- ---- Total Consumer Lending 1.07% 0.79% 0.57% ---- ---- ---- Total Net Charge Off Rate 1.10% 0.76% 0.34% ==== ==== ==== CAPITAL ONE FINANCIAL CORPORATION (COF) NATIONAL LENDING SUB-SEGMENT FINANCIAL & STATISTICAL SUMMARY FOR CONTINUING OPERATIONS MANAGED BASIS (1) 2009 2009 2008 (in thousands) Q2 Q1 Q2 -------------- --------- --------- --------- US Card: Interest Income $2,004,268 $1,971,389 $2,132,284 Interest Expense 417,582 466,694 608,655 ------- ------- ------- Net interest income $1,586,686 $1,504,695 $1,523,629 Non-interest income 794,440 883,891 1,010,177 Provision for loan losses 1,336,736 1,521,997 1,099,453 Non-interest expenses 785,273 862,915 910,619 Income tax provision 90,691 1,286 183,307 ------ ----- ------- Net income (loss) $168,426 $2,388 $340,427 ======== ====== ======== Loans Held for Investment $64,760,128 $67,015,166 $68,059,998 Average Loans Held for Investment $65,862,569 $69,187,704 $67,762,384 Loans Held for Investment Yield 12.17% 11.40% 12.59% Net Interest Margin 9.64% 8.70% 8.99% Revenue Margin 14.46% 13.81% 14.96% Risk Adjusted Margin 5.23% 5.42% 8.70% Non-Interest Expenses as a % of Average Loans Held for Investment 4.77% 4.99% 5.38% Efficiency Ratio (5) 32.98% 36.13% 35.94% Net charge-off rate 9.23% 8.39% 6.26% Delinquency Rate (30+ days) 4.77% 5.08% 3.85% Purchase Volume (7) $23,610,760 $21,601,837 $26,738,213 Number of Loan Accounts (000s) 33,709 35,273 38,415 -------------- Auto Finance: Interest Income $596,900 $606,392 $666,499 Interest Expense 223,887 236,389 276,911 ------- ------- ------- Net interest income $373,013 $370,003 $389,588 Non-interest income 10,861 19,965 15,672 Provision for loan losses 125,966 166,169 230,614 Non-interest expenses 108,315 113,884 123,021 Income tax (benefit) provision 52,358 38,470 18,069 ------ ------ ------ Net income (loss) $97,235 $71,445 $33,556 ======= ======= ======= Loans Held for Investment $19,902,401 $20,667,910 $23,401,160 Average Loans Held for Investment $20,291,029 $21,110,528 $24,098,881 Loans Held for Investment Yield 11.77% 11.49% 11.06% Net Interest Margin 7.35% 7.01% 6.47% Revenue Margin 7.57% 7.39% 6.73% Risk Adjusted Margin 3.91% 2.51% 2.88% Non-Interest Expenses as a % of Average Loans Held for Investment 2.14% 2.16% 2.04% Efficiency Ratio (5) 28.22% 29.20% 30.36% Net charge-off rate 3.65% 4.88% 3.84% Delinquency Rate (30+ days) 8.89% 7.52% 7.62% Auto Loan Originations $1,341,583 $1,463,402 $1,513,686 Number of Loan Accounts (000s) 1,584 1,610 1,710 --------------- International: Interest Income $279,449 $260,164 $382,990 Interest Expense 68,832 73,171 128,678 ------ ------ ------- Net interest income $210,617 $186,993 $254,312 Non-interest income 103,000 101,590 138,961 Provision for loan losses 183,556 160,789 140,575 Non-interest expenses 122,743 123,971 202,927 Income tax provision 2,149 1,776 16,120 ----- ----- ------ Net income (loss) $5,169 $2,047 $33,651 ====== ====== ======= Loans Held for Investment $8,638,441 $8,069,961 $10,740,644 Average Loans Held for Investment $8,327,859 $8,382,679 $10,767,981 Loans Held for Investment Yield 13.42% 12.41% 14.23% Net Interest Margin 10.12% 8.92% 9.45% Revenue Margin 15.06% 13.77% 14.61% Risk Adjusted Margin 5.75% 6.47% 8.54% Non-Interest Expenses as a % of Average Loans Held for Investment 5.90% 5.92% 7.54% Efficiency Ratio (5) 39.14% 42.96% 51.60% Net charge-off rate 9.32% 7.30% 6.07% Delinquency Rate (30+ days) 6.69% 6.25% 5.35% Purchase Volume (7) $2,136,039 $1,871,723 $2,879,223 Number of Loan Accounts (000s) 5,404 5,666 5,687 CAPITAL ONE FINANCIAL CORPORATION (COF) SEGMENT AND NATIONAL LENDING SUB-SEGMENT FINANCIAL & STATISTICAL SUMMARY FOR CONTINUING OPERATIONS NOTES (1) The information in this financial and statistical summary reflects the adjustment to add back the effect of securitization transactions qualifying as sales under generally accepted accounting principles. See accompanying schedule - "Reconciliation to GAAP Financial Measures." In Q3 2007, the Company shutdown the mortgage origination operations of its wholesale mortgage banking unit, GreenPoint Mortgage. The results of the mortgage origination operation of GreenPoint have been accounted for as a discontinued operation and have been removed from the Company's results of continuing operations for all periods presented. The results of GreenPoint's mortgage servicing business are reported in continuing operations for all periods presented. Effective Q4 2007, GreenPoint's held for investment commercial and consumer loan portfolio results are included in continuing operations. (2) Includes domestic non-interest bearing deposits, NOW accounts, money market deposit accounts, savings accounts, certificates of deposit of less than $100,000 and other consumer time deposits. (3) Net Interest Margin - Loans equals net interest income earned on loans divided by average managed loans. (4) Net Interest Margin - Deposits equals net interest income earned on deposits divided by average deposits. (5) Efficiency Ratio equals non-interest expenses divided by total managed revenue. (6) The balances and results of Chevy Chase Bank, FSB are included in the Other segment. (7) Includes all purchase transactions net of returns and excludes cash advance transactions. (8) Non performing assets is comprised of non performing loans and foreclosed assets. The non performing asset rate equals non performing assets divided by the sum of loans held for investment and foreclosed assets. (9) Excludes acquired Chevy Chase Bank, FSB ATM locations of 911 in Q2 2009 and 907 in Q1 2009. (10) Excludes drive-up locations of 18 in Q2 2009, 18 in Q1 2009 and 19 in Q2 2008. (11) Excludes acquired Chevy Chase Bank, FSB branches of 251 in Q2 2009 and 250 in Q1 2009. CAPITAL ONE FINANCIAL CORPORATION Reconciliation to GAAP Financial Measures For the Three Months Ended June 30, 2009 (dollars in thousands)(unaudited) The Company's consolidated financial statements prepared in accordance with generally accepted accounting principles ("GAAP") are referred to as its "reported" financial statements. Loans included in securitization transactions which qualified as sales under GAAP have been removed from the Company's "reported" balance sheet. However, servicing fees, finance charges, and other fees, net of charge-offs, and interest paid to investors of securitizations are recognized as servicing and securitizations income on the "reported" income statement. The Company's "managed" consolidated financial statements reflect adjustments made related to effects of securitization transactions qualifying as sales under GAAP. The Company generates earnings from its "managed" loan portfolio which includes both the on-balance sheet loans and off-balance sheet loans. The Company's "managed" income statement takes the components of the servicing and securitizations income generated from the securitized portfolio and distributes the revenue and expense to appropriate income statement line items from which they originated. For this reason the Company believes the "managed" consolidated financial statements and related managed metrics to be useful to stakeholders. Total Reported Adjustments(1) Total Managed(2) ------------------------------------------------------------------------ Income Statement Measures(3) Net interest income $1,946,586 $1,012,607 $2,959,193 Non-interest income 1,231,687 (42,672) 1,189,015 --------- ------- --------- Total revenue 3,178,273 969,935 4,148,208 Provision for loan and lease losses 934,038 969,935 1,903,973 Net charge-offs $1,119,155 $969,935 $2,089,090 --------------- ---------- -------- ---------- Balance Sheet Measures Loans held for investment $101,073,629 $45,177,095 $146,250,724 Total assets $171,911,307 $42,229,427 $214,140,734 Total liabilities $146,585,646 $42,229,427 $188,815,073 Average loans held for investment $105,278,045 $43,331,087 $148,609,132 Average earning assets $151,416,846 $40,403,928 $191,820,774 Average total assets $177,589,212 $40,773,947 $218,363,159 Average total liabilities $149,931,060 $40,773,947 $190,705,007 Delinquencies $3,745,697 $2,241,752 $5,987,449 ------------- ---------- ---------- ---------- The table below presents a reconciliation of tangible common equity and tangible assets, which are the components used to calculate the tangible common equity "TCE" ratio. The Company believes the TCE ratio is an important financial measure of capital strength to our investors and readers even though it is considered to be a non-GAAP measure. (dollars in 2009 2009 2008 millions)(unaudited) Q2 Q1 Q2 ------- ------- ------- Equity $25,326 $26,744 $24,921 Less: preferred stock 38 (3,159) - Less: intangible assets (4) (13,985) (13,723) (13,361) ------- ------- ------- Tangible common equity $11,379 $9,862 $11,560 ======= ====== ======= Total assets 214,141 219,914 200,556 Less: discontinued ops assets (46) (31) (136) --- --- ---- Total assets- continuing ops 214,095 219,883 200,420 Less: intangible assets (4) (13,985) (13,723) (13,361) ------- ------- ------- Tangible assets $200,110 $206,160 $187,059 ======== ======== ======== TCE ratio 5.69 4.78 6.18 (1) Income statement adjustments reclassify the net of finance charges of $1,153.9 million, past-due fees of $164.6 million, other interest income of $(38.5) million and interest expense of $267.4 million; and net charge-offs of $969.9 million from non-interest income to net interest income and provision for loan and lease losses, respectively (2) The managed loan portfolio does not include auto loans which have been sold in whole loan sale transactions where the Company has retained servicing rights. (3) Based on continuing operations. (4) Includes impact from related deferred taxes. CAPITAL ONE FINANCIAL CORPORATION Consolidated Balance Sheets (in thousands)(unaudited) As of As of As of June 30 Mar 31 June 30 2009 2009 2008 ---------- ---------- ---------- Assets: Cash and due from banks $3,001,944 $3,076,926 $2,280,244 Federal funds sold and resale agreements 603,564 663,721 1,526,799 Interest-bearing deposits at other banks 1,166,419 4,013,678 718,070 --------- --------- ------- Cash and cash equivalents 4,771,927 7,754,325 4,525,113 Securities available for sale 37,667,165 36,326,951 25,028,355 Securities held to maturity 87,545 90,990 - Mortgage loans held for sale 319,975 289,337 111,824 Loans held for investment(1) 101,073,629 105,526,911 97,065,238 Less: Allowance for loan and lease losses (4,481,827) (4,648,031) (3,311,003) ---------- ---------- ---------- Net loans held for investment 96,591,802 100,878,880 93,754,235 Accounts receivable from securitizations 5,219,968 4,850,508 5,301,906 Premises and equipment, net 2,824,785 2,790,733 2,321,487 Interest receivable 951,201 815,738 778,595 Goodwill(1) 13,381,056 13,076,754 12,826,738 Other(1) 10,095,883 10,513,243 6,466,018 ---------- ---------- --------- Total assets $171,911,307 $177,387,459 $151,114,271 ============ ============ ============ Liabilities: Non-interest-bearing deposits $12,603,548 $12,422,456 $10,752,059 Interest-bearing deposits 104,120,642 108,696,442 81,655,001 Senior and subordinated notes 10,092,619 8,258,212 8,506,339 Other borrowings 13,260,589 14,610,092 19,302,185 Interest payable 659,784 656,769 621,489 Other 5,848,464 5,999,327 5,355,733 --------- --------- --------- Total liabilities 146,585,646 150,643,298 126,192,806 Stockholders' Equity: Preferred stock - 3,115,722 - Common stock 5,019 4,425 4,223 Paid-in capital, net 18,891,333 17,348,217 15,966,810 Retained earnings and cumulative other comprehensive income 9,598,606 9,444,639 12,115,480 Less: Treasury stock, at cost (3,169,297) (3,168,842) (3,165,048) ---------- ---------- ---------- Total stockholders' equity 25,325,661 26,744,161 24,921,465 ---------- ---------- ---------- Total liabilities and stockholders' equity $171,911,307 $177,387,459 $151,114,271 ============ ============ ============ (1) Balances at June 30, 2009 reflect adjustments made to the allocation of purchase price of the Chevy Chase Bank acquisition. The balances at March 31, 2009 have not been adjusted, however, if the adjustments had been made at March 31, 2009, net loans held for investment would have been $100,410.3 million (a decrease of $468.6 million), goodwill would have been $13,367.9 million (an increase of $291.1 million) and other assets would have been $10,664.8 million (an increase of $151.6 million). The allocation of purchase price is still preliminary and will be finalized upon completion of the analysis of the fair values of Chevy Chase Bank's assets and liabilities. CAPITAL ONE FINANCIAL CORPORATION Consolidated Statements of Income (in thousands, except per share data)(unaudited) Three Months Ended June 30 Mar 31 June 30 2009 2009 2008 ------- ------- ------- Interest Income: Loans held for investment, including past-due fees $2,233,808 $2,190,331 $2,297,709 Investment securities 412,845 394,780 281,084 Other 67,982 63,117 113,064 ------ ------ ------- Total interest income 2,714,635 2,648,228 2,691,857 Interest Expense: Deposits 555,579 631,848 592,576 Senior and subordinated notes 57,113 58,044 114,797 Other borrowings 155,357 171,585 256,728 ------- ------- ------- Total interest expense 768,049 861,477 964,101 ------- ------- ------- Net interest income 1,946,586 1,786,751 1,727,756 Provision for loan and lease losses 934,038 1,279,137 829,130 ------- --------- ------- Net interest income after provision for loan and lease losses 1,012,548 507,614 898,626 Non-Interest Income: Servicing and securitizations 362,416 453,637 834,740 Service charges and other customer- related fees 491,763 506,125 524,209 Mortgage servicing and other 13,163 23,380 16,552 Interchange 126,702 140,091 132,730 Other 237,643 (32,899) 114,085 ------- ------- ------- Total non-interest income 1,231,687 1,090,334 1,622,316 Non-Interest Expense: Salaries and associate benefits 633,819 554,431 578,572 Marketing 133,970 162,712 288,100 Communications and data processing 194,578 199,104 195,102 Supplies and equipment 128,483 118,900 131,937 Occupancy 114,885 100,251 80,137 Restructuring expense 43,374 17,627 13,560 Other 672,647 592,067 532,193 ------- ------- ------- Total non-interest expense 1,921,756 1,745,092 1,819,601 --------- --------- --------- Income (loss) from continuing operations before income taxes 322,479 (147,144) 701,341 Income taxes 92,278 (60,223) 238,843 ------ ------- ------- Income (loss) from continuing operations, net of tax 230,201 (86,921) 462,498 Loss from discontinued operations, net of tax (5,998) (24,958) (9,593) ------ ------- ------ Net income (loss) $224,203 $(111,879) $452,905 ======== ========= ======== Net income (loss) available to common shareholders $(275,515) $(176,069) $452,905 ========= ========= ======== Basic earnings per common share Income (loss) from continuing operations $(0.64) $(0.39) $1.24 Loss from discontinued operations (0.01) (0.06) (0.03) ----- ----- ----- Net Income (loss) per common share $(0.65) $(0.45) $1.21 ====== ====== ===== Diluted earnings per common share Income (loss) from continuing operations $(0.64) $(0.39) $1.24 Loss from discontinued operations (0.01) (0.06) (0.03) ----- ----- ----- Net Income (loss) per common share $(0.65) $(0.45) $1.21 ====== ====== ===== Dividends paid per common share $0.05 $0.375 $0.375 ===== ====== ====== Six Months Ended June 30 June 30 2009 2008 ------- ------- Interest Income: Loans held for investment, including past-due fees $4,424,139 $4,806,102 Investment securities 807,625 538,825 Other 131,099 226,455 ------- ------- Total interest income 5,362,863 5,571,382 Interest Expense: Deposits 1,187,427 1,202,965 Senior and subordinated notes 115,157 255,767 Other borrowings 326,942 572,977 ------- ------- Total interest expense 1,629,526 2,031,709 --------- --------- Net interest income 3,733,337 3,539,673 Provision for loan and lease losses 2,213,175 1,908,202 --------- --------- Net interest income after provision for loan and lease losses 1,520,162 1,631,471 Non-Interest Income: Servicing and securitizations 816,053 1,917,802 Service charges and other customer- related fees 997,888 1,098,270 Mortgage servicing and other 36,543 51,807 Interchange 266,793 284,632 Other 204,744 326,283 ------- ------- Total non-interest income 2,322,021 3,678,794 Non-Interest Expense: Salaries and associate benefits 1,188,250 1,189,852 Marketing 296,682 585,893 Communications and data processing 393,682 382,345 Supplies and equipment 247,383 262,868 Occupancy 215,136 168,217 Restructuring expense 61,001 66,319 Other 1,264,714 986,384 --------- ------- Total non-interest expense 3,666,848 3,641,878 --------- --------- Income (loss) from continuing operations before income taxes 175,335 1,668,387 Income taxes 32,055 573,334 ------ ------- Income (loss) from continuing operations, net of tax 143,280 1,095,053 Loss from discontinued operations, net of tax (30,956) (93,644) ------- ------- Net income (loss) $112,324 $1,001,409 ======== ========== Net income (loss) available to common shareholders $(451,584) $1,001,409 ========= ========== Basic earnings per common share Income (loss) from continuing operations $(1.03) $2.95 Loss from discontinued operations (0.08) (0.25) ----- ----- Net Income (loss) per common share $(1.11) $2.70 ====== ===== Diluted earnings per common share Income (loss) from continuing operations $(1.03) $2.94 Loss from discontinued operations (0.08) (0.25) ----- ----- Net Income (loss) per common share $(1.11) $2.69 ====== ===== Dividends paid per common share $0.425 $0.75 ====== ===== CAPITAL ONE FINANCIAL CORPORATION Statements of Average Balances, Income and Expense, Yields and Rates (1) (dollars in thousands)(unaudited) Reported Quarter Ended 06/30/09 ---------------------- Average Income/ Yield/ Balance Expense Rate ------- ------- -------- Earning assets: Loans held for investment $105,278,045 $2,233,808 8.49% Investment Securities (2) 37,499,187 412,845 4.40% Other 8,623,100 67,982 3.15% --------- ------ ---- Total earning assets $151,400,332 $2,714,635 7.17% ============ ========== Interest-bearing liabilities: Interest-bearing deposits NOW accounts $10,914,679 $14,602 0.54% Money market deposit accounts 35,751,007 103,855 1.16% Savings accounts 9,931,058 13,399 0.54% Other consumer time deposits 35,841,099 300,572 3.35% Public fund CD's of $100,000 or more 1,117,460 3,450 1.23% CD's of $100,000 or more 11,097,722 108,228 3.90% Foreign time deposits 2,387,093 11,473 1.92% --------- ------ ---- Total interest-bearing deposits $107,040,118 $555,579 2.08% Senior and subordinated notes 8,322,746 57,113 2.74% Other borrowings 16,274,845 155,357 3.82% ---------- ------- ---- Total interest-bearing liabilities $131,637,709 $768,049 2.33% ============ ======== ---- Net interest spread 4.84% ==== Interest income to average earning assets 7.17% Interest expense to average earning assets 2.03% ---- Net interest margin 5.14% ==== Reported Quarter Ended 03/31/09 ---------------------- Average Income/ Yield/ Balance Expense Rate ------- ------- -------- Earning assets: Loans held for investment $103,445,130 $2,190,331 8.47% Investment Securities (2) 34,209,102 394,780 4.62% Other 7,720,249 63,117 3.27% --------- ------ ---- Total earning assets $145,374,481 $2,648,228 7.29% ============ ========== Interest-bearing liabilities: Interest-bearing deposits NOW accounts $10,842,553 $11,554 0.43% Money market deposit accounts 30,839,817 115,017 1.49% Savings accounts 7,631,999 7,210 0.38% Other consumer time deposits 37,097,765 371,194 4.00% Public fund CD's of $100,000 or more 1,209,347 5,146 1.70% CD's of $100,000 or more 10,673,089 107,215 4.02% Foreign time deposits 2,557,479 14,512 2.27% --------- ------ ---- Total interest-bearing deposits $100,852,049 $631,848 2.51% Senior and subordinated notes 7,771,343 58,044 2.99% Other borrowings 15,697,078 171,585 4.37% ---------- ------- ---- Total interest-bearing liabilities $124,320,470 $861,477 2.77% ============ ======== ---- Net interest spread 4.52% ==== Interest income to average earning assets 7.29% Interest expense to average earning assets 2.37% ---- Net interest margin 4.92% ==== Reported Quarter Ended 06/30/08 ---------------------- Average Income/ Yield/ Balance Expense Rate ------- ------- -------- Earning assets: Loans held for investment $97,949,572 $2,297,709 9.38% Investment Securities (2) 24,165,083 281,084 4.65% Other 9,514,367 113,064 4.75% --------- ------- ---- Total earning assets $131,629,022 $2,691,857 8.18% ============ ========== Interest-bearing liabilities: Interest-bearing deposits NOW accounts $8,769,608 $24,802 1.13% Money market deposit accounts 24,881,125 165,871 2.67% Savings accounts 8,191,586 19,521 0.95% Other consumer time deposits 22,676,841 243,921 4.30% Public fund CD's of $100,000 or more 1,476,155 10,313 2.79% CD's of $100,000 or more 9,124,586 98,516 4.32% Foreign time deposits 3,555,189 29,632 3.33% --------- ------ ---- Total interest-bearing deposits $78,675,090 $592,576 3.01% Senior and subordinated notes 9,125,017 114,797 5.03% Other borrowings 24,851,821 256,728 4.13% ---------- ------- ---- Total interest-bearing liabilities $112,651,928 $964,101 3.42% ============ ======== ---- Net interest spread 4.76% ==== Interest income to average earning assets 8.18% Interest expense to average earning assets 2.93% ---- Net interest margin 5.25% ==== (1) Average balances, income and expenses, yields and rates are based on continuing operations. (2) Includes securities available for sale and securities held to maturity. CAPITAL ONE FINANCIAL CORPORATION Statements of Average Balances, Income and Expense, Yields and Rates (2) (dollars in thousands)(unaudited) Managed (1) Quarter Ended 06/30/09 ---------------------- Average Income/ Yield/ Balance Expense Rate ------- ------- -------- Earning assets: Loans held for investment $148,609,132 $3,564,773 9.60% Investment Securities (3) 37,499,187 412,845 4.40% Other 5,695,941 17,074 1.20% --------- ------ ---- Total earning assets $191,804,260 $3,994,692 8.33% ============ ========== Interest-bearing liabilities: Interest-bearing deposits NOW accounts $10,914,679 $14,602 0.54% Money market deposit accounts 35,751,007 103,855 1.16% Savings accounts 9,931,058 13,399 0.54% Other consumer time deposits 35,841,099 300,572 3.35% Public fund CD's of $100,000 or more 1,117,460 3,450 1.23% CD's of $100,000 or more 11,097,722 108,228 3.90% Foreign time deposits 2,387,093 11,473 1.92% --------- ------ ---- Total interest-bearing deposits $107,040,118 $555,579 2.08% Senior and subordinated notes 8,322,746 57,113 2.74% Other borrowings 16,274,845 155,357 3.82% Securitization liability 40,806,188 267,450 2.62% ---------- ------- ---- Total interest-bearing liabilities $172,443,897 $1,035,499 2.40% ============ ========== ---- Net interest spread 5.93% ==== Interest income to average earning assets 8.33% Interest expense to average earning assets 2.16% ---- Net interest margin 6.17% ==== Managed (1) Quarter Ended 03/31/09 ---------------------- Average Income/ Yield/ Balance Expense Rate ------- ------- -------- Earning assets: Loans held for investment $147,384,816 $3,478,362 9.44% Investment Securities (3) 34,209,102 394,780 4.62% Other 5,222,716 15,743 1.21% --------- ------ ---- Total earning assets $186,816,634 $3,888,885 8.33% ============ ========== Interest-bearing liabilities: Interest-bearing deposits NOW accounts $10,842,553 $11,554 0.43% Money market deposit accounts 30,839,817 115,017 1.49% Savings accounts 7,631,999 7,210 0.38% Other consumer time deposits 37,097,765 371,194 4.00% Public fund CD's of $100,000 or more 1,209,347 5,146 1.70% CD's of $100,000 or more 10,673,089 107,215 4.02% Foreign time deposits 2,557,479 14,512 2.27% --------- ------ ---- Total interest-bearing deposits $100,852,049 $631,848 2.51% Senior and subordinated notes 7,771,343 58,044 2.99% Other borrowings 15,697,078 171,585 4.37% Securitization liability 41,766,616 283,655 2.72% ---------- ------- ---- Total interest-bearing liabilities $166,087,086 $1,145,132 2.76% ============ ========== ---- Net interest spread 5.57% ==== Interest income to average earning assets 8.33% Interest expense to average earning assets 2.46% ---- Net interest margin 5.87% ==== Managed (1) Quarter Ended 06/30/08 ---------------------- Average Income/ Yield/ Balance Expense Rate ------- ------- ------- Earning assets: Loans held for investment $147,715,693 $3,929,069 10.64% Investment Securities (3) 24,165,083 281,084 4.65% Other 7,539,750 60,419 3.21% --------- ------ ---- Total earning assets $179,420,526 $4,270,572 9.52% ============ ========== Interest-bearing liabilities: Interest-bearing deposits NOW accounts $8,769,608 $24,802 1.13% Money market deposit accounts 24,881,125 165,871 2.67% Savings accounts 8,191,586 19,521 0.95% Other consumer time deposits 22,676,841 243,921 4.30% Public fund CD's of $100,000 or more 1,476,155 10,313 2.79% CD's of $100,000 or more 9,124,586 98,516 4.32% Foreign time deposits 3,555,189 29,632 3.33% --------- ------ ---- Total interest-bearing deposits $78,675,090 $592,576 3.01% Senior and subordinated notes 9,125,017 114,797 5.03% Other borrowings 24,851,821 256,728 4.13% Securitization liability 49,317,336 518,477 4.21% ---------- ------- ---- Total interest-bearing liabilities $161,969,264 $1,482,578 3.66% ============ ========== ---- Net interest spread 5.86% ==== Interest income to average earning assets 9.52% Interest expense to average earning assets 3.30% ---- Net interest margin 6.22% ==== (1) The information in this table reflects the adjustment to add back the effect of securitized loans. (2) Average balances, income and expenses, yields and rates are based on continuing operations. (3) Includes securities available for sale and securities held to maturity. DATASOURCE: Capital One Financial Corporation CONTACT: Investor Relations, Jeff Norris or Danielle Dietz, +1-703-720-2455, or Media Relations, Tatiana Stead, +1-703-720-2352, or Julie Rakes, +1-804-284-5800 Web Site: http://www.capitalone.com/

Copyright

1 Year Cofinimmo Chart

1 Year Cofinimmo Chart

1 Month Cofinimmo Chart

1 Month Cofinimmo Chart

Your Recent History

Delayed Upgrade Clock