ADVFN Logo ADVFN

We could not find any results for:
Make sure your spelling is correct or try broadening your search.

Trending Now

Toplists

It looks like you aren't logged in.
Click the button below to log in and view your recent history.

Hot Features

Registration Strip Icon for monitor Customisable watchlists with full streaming quotes from leading exchanges, such as LSE, NASDAQ, NYSE, AMEX, Bovespa, BIT and more.

XIN Xinyuan Real Estate Co Ltd

2.6393
0.00 (0.00%)
Pre Market
Last Updated: 09:09:53
Delayed by 15 minutes
Name Symbol Market Type
Xinyuan Real Estate Co Ltd NYSE:XIN NYSE Depository Receipt
  Price Change % Change Price High Price Low Price Open Price Traded Last Trade
  0.00 0.00% 2.6393 0 09:09:53

Xinyuan Real Estate Co., Ltd. Announces Second Quarter and First Half 2008 Results

02/09/2008 12:23pm

PR Newswire (US)


Xinyuan Real Estate (NYSE:XIN)
Historical Stock Chart


From Sep 2019 to Sep 2024
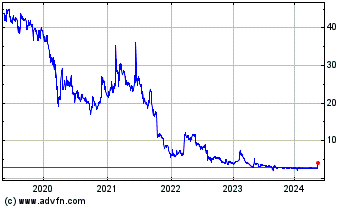
Click Here for more Xinyuan Real Estate Charts.
Second Quarter Revenues were US$87.7 Million; Second Quarter Net Income was US$13.2 Million; First Half 2008 Revenues Increased 117.9% to US$212.9 Million Year-Over-Year; First Half 2008 Net Income Increased 115.2% to US$46.1 Million Year-Over-Year BEIJING, Sept. 2 /Xinhua-PRNewswire/ -- Xinyuan Real Estate Co., Ltd. ('Xinyuan') (NYSE:XIN), a fast-growing residential real estate developer with a focus on strategically selected Tier II cities in China, today announced its unaudited financial results for the second quarter and six months ended June 30, 2008. -- Total revenues for the second quarter of 2008 increased 17.2% to US$87.7 million from US$74.8 million for the same quarter in 2007. -- Total revenues for the first half of 2008 increased 117.9% to US$212.9 million from US$97.7 million for the same period in 2007. -- Net income for the second quarter of 2008 decreased 9.6% to US$13.2 million from US$14.6 million for the same quarter in 2007. -- Net income for the first half of 2008 increased 115.2% to US$46.1 million from US$21.4 million for the same period in 2007. -- Diluted earnings per share were US$0.08 for the second quarter of 2008, equivalent to US$0.16 per American Depositary Share ('ADS'), compared to US$0.12 diluted earnings per share or US$0.24 per ADS for the same quarter in 2007. -- Diluted earnings per share were US$0.22 for the first half of 2008, equivalent to US$0.44 per ADS, compared to US$0.18 diluted earnings per share or US$0.36 per ADS for the same period in 2007. -- In the second quarter of 2008, the Company launched one new project with total developable gross floor area ('GFA') of 189,198 square meters in Zhengzhou, and completed construction of total GFA of approximately 53,600 square meters for one ongoing project in Suzhou. -- As of June 30, 2008, the Company had land reserves representing approximately 2.3 million square meters of developable gross floor area, all of which is either under construction or in the planning stage. This represents future sales of 1.5 to 2 years of development activity, and is consistent with the Company's business plan. Three Three Six Six months months months months ended ended ended ended 6/30/07 6/30/08 6/30/07 6/30/08 Total revenue (US$000) 74,828 87,723 97,705 212,860 Net income (US$000) 14,568 13,172 21,435 46,124 Diluted earnings per share (US$) 0.12 0.08 0.19 0.22 'The second quarter 2008 proved to be a challenging quarter most notably due to weaker market conditions brought about by the tightened credit supply and slowing buyer demand,' said Yong Zhang, Xinyuan's chairman and chief executive officer. 'As we expected, temporary policy changes to curb inflation and cool a rapidly growing real estate market have decreased sales volumes across the industry and slowed growth during the quarter. Although current market conditions are presenting challenges to nearly every company in the real estate industry, Xinyuan's overall growth rates so far in 2008 are better than many of our peers.' 'Over the next several months, we will concentrate on improving our capacity to execute our projects and mobilize the demand that is still unmet in second-tier cities," continued Mr. Zhang. "We remain confident in the prospects of the real estate sector in China. The significant improvement in CPI and its outlook should pave the way for further easing of monetary and fiscal policies later this year and next year. When the policies are relaxed and markets do begin to improve, our quick asset turnover business model will allow our strong and experienced professional team to rapidly take advantage of new opportunities.' Mr. Frank Ng, Xinyuan's chief financial officer also added, 'While the uncertainty within the real estate market has contributed to slowed revenue and net income growth rates for Xinyuan, we continue to seek opportunities to improve our position within the industry. During the second quarter we launched one project, Zhengzhou Xinyuan Colorful Garden, which has a total developable gross floor area of over 189,198 square meters, and we completed construction of approximately 53,600 square meters of gross floor area in our Suzhou Lake Splendid project. We will continue to rely on our unique business model, strong balance sheet and prudent financial management strategy as we deal with the present challenges and future opportunities of China's real estate market.' Financial Results for the Second Quarter and First Half of 2008 Revenues Total revenues were US$87.7 million for the second quarter of 2008, compared to US$125.1 million and US$74.8 million for the first quarter of 2008 and second quarter of 2007, respectively, representing a decrease of 29.9% and an increase of 17.2% from the first quarter of 2008 and second quarter of 2007, respectively. Total GFA recognized for revenue was approximately 101.0 thousand square meters for the second quarter of 2008, compared to 161.3 thousand square meters and 135.8 thousand square meters for the first quarter of 2008 and second quarter of 2007, respectively. The average selling price per square meter recognized for revenue was approximately Renminbi ('RMB')6,300 for the second quarter of 2008, compared to RMB5,800 and RMB4,400 for the first quarter of 2008 and second quarter of 2007, respectively. The quarter-over-quarter decrease in revenue was primarily due to decreased revenue of US$46.8 million from Suzhou Lake Splendid, Suzhou Colorful Garden, Anhui Wangjiang Garden, Jinan Elegant Scenery and Jinan International City Garden, among which the Suzhou Lake Splendid and Jinan Elegant Scenery were near to the completion of sales and construction by the end of the second quarter of 2008, compared to the first quarter of 2008, and was partially offset by increased revenue of US$14.2 million from Suzhou International City Garden and Zhengzhou Xinyuan Colorful Garden, which launched the pre-sales in the second quarter of 2008. The year-over-year increase in revenue was primarily attributable to increased revenue of US$59.0 million from Suzhou Colorful Garden, Suzhou International City Garden, Anhui Wangjiang Garden and Jinan International City Garden, compared to the second quarter of 2007, and was partially offset by reduced revenue of US$47.5 million from Suzhou Lake Splendid, Zhengzhou Central Garden West and Zhengzhou Central Garden East. For the first half of 2008, total revenues were US$212.9 million, an increase of 117.9% from US$97.7 million for the same period in 2007. Total GFA recognized for revenue was approximately 262.3 thousand square meters for the first half of 2008, compared to 172.3 thousand square meters for the first half of 2007. The average selling price per square meter recognized for revenue was approximately RMB6,000 for the first half of 2008, compared to RMB4,500 for the first half of 2007. The geographic breakdown of revenues from real estate sales were as follows: Revenue (US$ '000) City 2007Q2 2008Q1 2008Q2 amount % amount % amount % Suzhou 19,708 27% 53,825 43% 31,664 36% Zhengzhou 42,496 57% 8,492 7% 10,987 13% Hefei -- 0% 16,868 14% 11,885 14% Jinan 12,055 16% 44,975 36% 32,540 37% 74,259 100% 124,160 100% 87,076 100% Gross Profit Gross profit for the second quarter of 2008 was US$20.7 million, compared to US$36.6 million and US$27.0 million for the first quarter of 2008 and second quarter of 2007, respectively. For the first half of 2008, gross profit was US$57.3 million, an increase of 44.5% from US$39.6 million for the same period in 2007. The gross margin percentage for the second quarter of 2008 was 23.6%, compared to 29.2% and 36.1% for the first quarter of 2008 and second quarter of 2007, respectively. The quarter-over-quarter decrease in gross margin percentage was mainly attributed to the second quarter 2008 sale of newly launched projects of Suzhou International City Garden and Zhengzhou Xinyuan Colorful Garden which generated lower gross margins due to higher land acquisition costs and construction costs. The year-over-year decrease in gross margin percentage was attributed to the second quarter 2007 sale of Zhengzhou Central Garden West and Zhengzhou Central Garden East which generated higher gross margins due to lower land acquisition costs and construction costs. Similarly, due to lower margins on newly launched projects of Suzhou International City Garden and Zhengzhou Xinyuan Colorful Garden for the first half of 2008, the gross margin percentage was 26.9%, compared to 40.6% for the same period in 2007. Selling, General and Administrative Expenses Selling, general and administrative expenses were US$12.4 million for the second quarter of 2008, compared to US$10.9 million and US$5.0 million for the first quarter of 2008 and second quarter of 2007, respectively. As a percentage of total revenue, the selling, general and administrative expenses for the second quarter of 2008 were 14.2%, compared to 8.7% and 6.7% for the first quarter of 2008 and second quarter of 2007, respectively. The quarter- over-quarter increase in total selling, general and administrative expenses was due to increased selling and marketing activities to promote new projects. The year-over-year increase in total selling, general and administrative expenses was due to increased selling and marketing activities to promote new projects, salaries and other expenses associated with the addition of new employees, stock-based compensation amortization, and professional fees associated with maintenance as a listed company on the NYSE and under the rules governing the SEC. Similarly, for the first half of 2008, selling, general and administrative expenses were US$23.3 million, compared to US$7.9 million for the same period in 2007. As a percentage of total revenue, the selling, general and administrative expenses for the first half of 2008 were 10.9%, compared to 8.1% for the same period in 2007. Operating Margin The operating margin percentage for the second quarter of 2008 was 9.4%, compared to 20.5% and 29.3% for the first quarter of 2008 and second quarter of 2007, respectively. For the first half of 2008, the operating margin percentage was 16.0%, compared to 32.4% for the same period in 2007. The quarter-over-quarter and year-over-year decrease in operating margin was due to reduced gross margins of property developments for the second quarter of 2008 and increased selling and marketing activities to promote new projects, salaries and other expenses associated with the addition of new employees, stock-based compensation amortization, and professional fees. Excluding share-based compensation expenses (non-GAAP), operating margin for the quarter was 12.2%, compared to 23.1% and 29.3% in the first quarter of 2008 and second quarter of 2007, respectively. Share of Income in an Equity Investee and Exchange Gains In the second quarter of 2008, the Company recognized income in the amount of US$3.7 million from its equity investment in a 45% owned project company, Zhengzhou Jiantou Xinyuan Real Estate Co., Ltd., compared to income in the amount of US$3.6 million and US$3.6 million in the first quarter of 2008 and second quarter of 2007, respectively. The slight increase was attributable to increased net income of the project company in the second quarter of 2008. Similarly, for the first half of 2008, the Company recognized net income in the amount of US$7.3 million, compared to US$3.6 million for the same period in 2007. In addition, the Company recognized unrealized foreign exchange gain of US$1.5 million in the second quarter of 2008, which resulted from the appreciation of Renminbi against U.S. dollar, as the Company translated certain U.S. dollar-denominated long-term debts into Renminbi for the second quarter of 2008 using the exchange rate at June 30, 2008. A US$2.2 million and US$0.7 million foreign exchange gain of the same nature was recognized in the first quarter of 2008 and second quarter of 2007, respectively. For the first half of 2008, the Company recognized unrealized foreign exchange gain of US$3.8 million, compared to US$0.7 million for the same period in 2007. Change in Fair Value of Derivative Liabilities In the second quarter of 2008, the Company recognized a gain of US$2.8 million arising from a decrease in fair value of the warrants issued with floating rate notes, compared to a gain of US$11.3 million arising from an decrease in fair value of the warrants in the first quarter of 2008 and an expense of US$4.8 million arising from an increase in fair value of the warrants in the second quarter of 2007. For the first half of 2008, the Company recognized a gain of US$14.1 million arising from a decrease in fair value of the warrants, compared to an expense of US$4.3 million for the same period in 2007. Income Taxes Income tax expense for the second quarter of 2008 was US$4.3 million, compared to US$10.9 million and US$7.5 million for the first quarter of 2008 and second quarter of 2007, respectively. The quarter-over-quarter and year- over-year decrease was primarily attributable to decreased gross profit recognized and increased selling, general and administrative expenses charged in the second quarter of 2008, as compared to the first quarter of 2008 and second quarter of 2007. For the first half of 2008, the income tax expense was US$15.2 million, compared to US$10.9 million for the same period in 2007. Net Income Net income for the second quarter of 2008 was US$13.2 million, compared to US$33.0 million and US$14.6 million for the first quarter of 2008 and second quarter of 2007, respectively. For the first half of 2008, net income was US$46.1 million, compared to US$21.4 million for the same period in 2007. The Company reported basic and diluted earnings per share of US$0.09 and US$0.08, or earnings per ADS of US$0.18 and US$0.16 for the second quarter of 2008, respectively. For the first half of 2008, basic and diluted earnings per share were US$0.31 and US$0.22, respectively, or earnings per ADS of US$0.62 and US$0.44, respectively. Each ADS represents two common shares. Outlook for Fiscal Year 2008 Based on current operations and Xinyuan's estimates of the market conditions for the remainder of 2008, the Company expects its total revenues for full year 2008 to be in the range of US$450 million to US$520 million, representing year-over-year growth in the range of approximately 45% to 68%. The revised total revenue estimate for full year 2008 reflects the Company's updated expectation of possible delays in pre-sales resulting from potential market uncertainties. The Company maintains its full year net income estimate of US$60 million to US$70 million, representing year-over-year growth of approximately 31% to 53%. The Company expects to achieve net income within its estimated guidance range through increased gross profits margins on new projects, lower selling, general and administrative expenses and interest expenses, and with the recognition of unrealized foreign exchange gains and change in fair value of warrants in the first half of 2008. In its estimation of net income figures for full year 2008, the Company does not assume any future effects from foreign currency translation and adjustments to the fair value of warrants. The breakdown of saleable GFA in the future is as follows: Total GFA Sold GFA as Saleable of June 30, GFA in the 2008 future City (sq.m) (sq.m) (sq.m) Suzhou 481,789 232,197 249,592 Zhengzhou 534,826 70,708 464,118 Hefei 145,452 141,309 4,143 Jinan 348,424 230,614 117,810 Chengdu (*) 450,374 -- 450,374 Kunshan(*) 509,851 -- 509,851 2,470,716 674,828 1,795,888 * The Company targets to launch the pre-sales of projects in these cities in the second half of 2008. Non-GAAP Measures This release contains non-GAAP financial measures, as such term is defined by the U. S. Securities and Exchange Commission. These non-GAAP financial measures, which are identified in this release, are used by management as measures of the Company's performance, and should be considered in addition to, not in isolation or as a substitute for, measures of the Company's financial performance prepared in accordance with United States Generally Accepted Accounting Principles ('GAAP'). The Company's non-GAAP financial measures may be defined differently than similar terms used by other companies. Accordingly, care should be exercised in understanding how the Company defines its non-GAAP financial measures. Reconciliations of the Company's non-GAAP measures to the nearest GAAP measures are set forth in the section below titled 'Reconciliation of GAAP to Non-GAAP Results." These non-GAAP measures include non-GAAP gross profit, non-GAAP operating expenses, non-GAAP income from operations, and non-GAAP net income. The Company's management uses certain non-GAAP financial measures to gain an understanding of the Company's comparative operating performance (when comparing such results with previous periods or forecasts) and future prospects. The Company's non-GAAP financial measures exclude certain items, including stock-based compensation charges, unrealized foreign exchange gain or loss, amortization of intangible assets, amortization of convertible debt issuance cost and charges arising from changes in fair value of derivative warrant liabilities, from its internal financial statements for purposes of its internal budgets. Non-GAAP financial measures are used by the Company's management in their financial and operating decision-making, because management believes they reflect the Company's ongoing business in a manner that allows meaningful period-to-period comparisons. The Company computes its non-GAAP financial measures using the same consistent methods from quarter to quarter. The Company's management believes that these non-GAAP financial measures can provide useful information to investors and others in the following ways: 1) in understanding and evaluating the Company's current operating performance and future prospects in the same manner as management does, if they so choose, and 2) in comparing in a consistent manner the Company's current financial results with the Company's past financial results. The Company's management further believes the non-GAAP financial measures can provide useful information to both management and investors by excluding certain expenses, gains and losses (i) that are not expected to result in future cash settlement or (ii) that are non-recurring in nature or may not be indicative of its core operating results and business outlook. The Company's management believes excluding stock-based compensation from its non-GAAP financial measures is useful for itself and investors as such expense will not result in future cash payment and is otherwise unrelated to the Company's core operating results. The Company's management believes excluding the non-cash stock-based compensation charges, unrealized foreign exchange gain, amortization expense of intangible assets and charges resulting from changes in fair value of derivative warrant liabilities from its non-GAAP financial measure of net income are useful for itself and investors because they enable a more meaningful comparison of the Company's cash performance between reporting periods. In addition, such charges will not result in cash settlement in the future. Conference Call Information Xinyuan's management will host an earnings conference call on September 2, 2008 at 8 a.m. U.S. Eastern Daylight Time (8 p.m. Beijing/Hong Kong time). Dial-in details for the earnings conference call are as follows: US: +1-617-597-5308 Hong Kong: +852-3002-1672 Please dial-in 10 minutes before the call is scheduled to begin and provide the passcode to join the call. The passcode is 'Xinyuan Earnings Call.' A replay of the conference call may be accessed by phone at the following number until October 2, 2008: International: +1-617-801-6888 Passcode: 39540569 Additionally, a live and archived webcast of the conference call will be available at http://ir.xyre.com/ . About Xinyuan Real Estate Co., Ltd. Xinyuan Real Estate Co., Ltd. ('Xinyuan') (NYSE:XIN) is a fast-growing developer of large scale, high quality residential real estate projects aimed at providing middle-income consumers with a comfortable and convenient community lifestyle. Xinyuan focuses on China's Tier II cities, characterized as larger, more developed urban areas with above average GDP and population growth rates. Xinyuan has expanded its network to cover a total population of over 34.5 million people in six strategically selected Tier II cities, comprising Hefei, Jinan, Kunshan, Suzhou, Zhengzhou and Chengdu. Xinyuan is the first real estate developer from China to be listed on the New York Stock Exchange. For more information, please visit http://www.xyre.com/ . Safe Harbor Statement This press release contains forward-looking statements. These statements are made under the 'safe harbour' provisions of the U.S. Private Securities Litigation Reform Act of 1995. These forward-looking statements can be identified by terminology such as 'will,' 'expects,' 'anticipates,' 'future,' 'intends,' 'plans,' 'believes,' 'estimates,' 'confident' and similar statements. Statements that are not historical facts, including statements concerning our beliefs, forecasts, estimates and expectations, are forward-looking statements. Forward-looking statements involve inherent risks and uncertainties that could cause actual results to differ materially from those projected or anticipated, including risks related to: the risk that we may be unable to complete our property developments on time or at all; the risk that our results of operations may fluctuate from period to period; the risk that the PRC government may adopt further measures to curtail the growth in the property sector; the risk that we face intense competition from other real estate developers; the risk that PRC economic, political and social conditions, government policies as well as natural disaster can affect our business and other risks outlined in our public filings with the Securities and Exchange Commission, including our annual report on Form 20-F for the year ended December 31, 2007. All information provided in this press release is as of September 2, 2008. Except as required by law, we undertake no obligation to update or revise publicly any forward-looking statements, whether as a result of new information, future events or otherwise, after the date on which the statements are made or to reflect the occurrence of unanticipated events. Notes to Unaudited Financial Information This release contains unaudited financial information which is subject to adjustment. In addition, we are in the process of conducting further evaluations of our internal control over financial reporting for compliance with the requirements of Section 404 under the Sarbanes-Oxley Act. We make no representation of management's assessment regarding internal control over financial reporting or include an attestation report of the Company's independent auditors due to a transition period established by rules of the SEC for newly public companies. Adjustments to the financial statements may be identified when the audit work is completed, which could result in significant differences between our audited financial statements and this unaudited financial information. XINYUAN REAL ESTATE CO., LTD. AND ITS SUBSIDIARIES UNAUDITED CONDENSED CONSOLIDATED STATEMENTS OF OPERATIONS (All US$ amounts and number of shares data in thousands, except per share data) Three months ended June 30, March 31, June 30, 2007 2008 2008 Revenue $74,828 $125,137 $87,723 Cost of revenue (47,833) (88,582) (66,997) Gross profit 26,995 36,555 20,726 Selling and distribution expenses (2,173) (1,853) (4,153) General and administrative expenses (2,865) (9,016) (8,285) Operating income 21,957 25,686 8,288 Interest income 152 1,041 1,205 Interest expense 492 (3) 3 Share of income in an equity investee 3,599 3,585 3,716 Exchange gains 724 2,232 1,522 Change in fair value of warrant liabilities (4,822) 11,296 2,776 Income from operations before income taxes 22,102 43,837 17,510 Income taxes (7,534) (10,885) (4,338) Net Income 14,568 32,952 13,172 Accretion of Series A convertible preference shares (723) -- -- Net income attributable to ordinary shareholders $13,845 $32,952 $13,172 Earnings (loss) per share: Basic $0.13 $0.22 $0.09 Diluted(1) $0.12 $0.13 $0.08 Shares used in computation: Basic 106,510 148,398 148,398 Diluted 115,749 161,373 160,467 Note (1) Diluted earnings per share for the three months ended June 30, 2007, March 31, 2008 and June 30, 2008. The diluted earnings per share for the three months ended June 30, 2007, March 31, 2008 and June 30, 2008 are calculated as follows: (All US$ amounts and number of shares data in thousands, except per share data) Three Months Ended June 30, March 31, June 30, 2007 2008 2008 Numerator: Net income $14,568 $32,952 $13,172 Accretion of Series A convertible redeemable preference shares (723) Change in fair value of warrant liabilities* -- (11,296) -- Net income attributable to ordinary shareholders - diluted 13,845 21,656 13,172 Denominator: Number of shares outstanding - basic 106,510 148,398 148,398 Incremental shares as if warrants were exercised at beginning of period* -- 61 -- Convertible subordinated notes 8,317 9,597 9,597 Incremental shares of Burnham warrant 922 -- -- Stock options - 3,317 2,472 Number of shares outstanding - diluted 115,749 161,373 160,467 Diluted earnings per share $0.12 $0.13 $0.08 * The Company assumes the warrants embedded in the floating rate notes to be exercised on January 1, 2008. This would have caused the Company not to recognize the US$11.3 million gain arising from the change in fair value of the warrants because there would be no change in the fair value of the warrants during the three months ended March 31, 2008 if they were exercised on January 1, 2008. For the three months ended June 30, 2007 and 2008, the potential dilutive effects of the warrants were excluded from the computation of diluted earning per share because their effects were anti-dilutive. XINYUAN REAL ESTATE CO., LTD. AND ITS SUBSIDIARIES UNAUDITED CONDENSED CONSOLIDATED STATEMENTS OF OPERATIONS (All US$ amounts and number of shares data in thousands, except per share data) Six months ended June 30, June 30, 2007 2008 Revenue $97,705 $212,860 Cost of revenue (58,059) (155,579) Gross profit 39,646 57,281 Selling and distribution expenses (3,191) (6,006) General and administrative expenses (4,758) (17,301) Operating income 31,697 33,974 Interest income 317 2,246 Interest expense 318 -- Share of income in an equity investee 3,599 7,301 Exchange gains 724 3,754 Change in fair value of warrant liabilities (4,346) 14,072 Income from operations before income taxes 32,309 61,347 Income taxes (10,874) (15,223) Net Income 21,435 46,124 Accretion of Series A convertible preference shares (1,445) -- Net income attributable to ordinary shareholders $19,990 $46,124 Earnings (loss) per share: Basic 0.19 0.31 Diluted 0.18 0.22 Shares used in computation: Basic 106,510 148,398 Diluted 111,372 160,920 XINYUAN REAL ESTATE CO., LTD. AND ITS SUBSIDIARIES CONDENSED CONSOLIDATED BALANCE SHEETS DATA (U.S. Dollars in thousands) Audited Unaudited December 31, 2007 June 30, 2008 ASSETS Current assets Cash and cash equivalents $309,315 $120,126 Restricted cash 48,267 72,868 Accounts receivable 257 2,172 Other receivables 4,750 1,695 Other deposits and prepayments 12,864 21,799 Advances to suppliers 3,052 12,164 Real estate property development completed 4,917 279 Real estate property under development 379,142 678,096 Other current assets 7,782 2,432 Total current assets 770,346 911,631 Real estate property under development 9,738 -- Real estate properties held for lease, net 6,811 12,865 Property and equipment, net 4,649 4,892 Other long-term investment 242 242 Interests in an equity investee 9,344 17,558 Other assets 6,065 5,991 TOTAL ASSETS $807,195 $953,179 Audited Unaudited December 31, 2007 June 30, 2008 LIABILITIES AND SHAREHOLDERS' EQUITY Current liabilities Accounts payable $45,490 $62,987 Short-term bank loans 49,284 77,235 Customer deposits 25,261 35,019 Income tax payable 5,406 7,668 Deferred tax liabilities 7,532 14,009 Other payables and accrued liabilities 18,296 20,070 Payroll and welfare payable 3,105 1,599 Total current liabilities 154,374 218,587 Long-term bank loans 137,858 154,647 Warrant liabilities 16,592 2,520 Deferred tax liabilities 4,776 6,012 Unrecognized tax benefits 11,925 12,699 Other long-term debt 91,771 93,220 Total liabilities 417,296 487,685 Shareholders' equity Common shares 15 15 Additional paid-in capital 490,361 496,182 Statutory reserves 12,145 12,145 Accumulated deficit(2) (123,704) (77,579) Accumulated other comprehensive earnings 11,082 34,731 Total shareholders' equity 389,899 465,494 TOTAL LIABILITIES AND SHAREHOLDERS' EQUITY $807,195 $953,179 Note (2) On November 13, 2007, the holders of the Company's Series A convertible preference shares agreed to waive the contingent conversion option contained in the shares. The modification was deemed to be substantive and was treated for accounting purpose as an extinguishment of the Series A convertible preference shares. In connection with this, the Company recognized a dividend of approximately US$182.2 million to the Series A convertible preference shareholders, representing the difference between the fair value of the convertible preference shares immediately after the modification and the carrying value of the preference shares immediately prior to the modification. This deemed dividend did not affect the Company's net income or cash flows. However, it reduced the net income attributable to ordinary shareholders and retained earnings for the year ended December 31, 2007 by the same amount. XINYUAN REAL ESTATE CO., LTD. AND ITS SUBSIDIARIES RECONCILIATION OF GAAP to NON-GAAP RESULTS (U.S. Dollar in thousands, except per share data) Three months ended June 30, 2008 Non-GAAP GAAP Adjustments Results Gross profit 20,726 20,726 Operating expenses 12,438 (a) (2,441) 9,912 (b) (85) Operating income 8,288 (a) 2,441 10,814 (b) 85 Net income 13,172 (a) 2,560 11,519 (b) 85 (c) (2,776) (e) (1,522) Three months ended March 31, 2008 Non-GAAP GAAP Adjustments Results Gross profit 36,555 36,555 Operating expenses 10,869 (a) (3,175) 7,609 (b) (85) Operating income 25,686 (a) 3,175 28,946 (b) 85 Net income 32,952 (a) 3,344 22,853 (b) 85 (c) (11,296) (e) (2,232) Three months ended June 30, 2007 Non-GAAP GAAP Adjustments Results Gross profit 26,995 26,995 Operating expenses 5,038 (b) (85) 4,953 Operating income 21,957 (b) 85 22,042 Net income 14,568 (b) 85 19,122 (c) 4,822 (d) 371 (e) (724) (a) To adjust stock-based compensation charges (b) To adjust amortization of property management rights (c) To adjust changes in fair value of derivative warrant liabilities (d) To adjust amortization of convertible debt issuance cost (e) To adjust unrealized exchange gain XINYUAN REAL ESTATE CO., LTD. AND ITS SUBSIDIARIES RECONCILIATION OF GAAP to NON-GAAP RESULTS (U.S. Dollar in thousands, except per share data) Six months ended June 30, 2008 Non-GAAP GAAP Adjustments Results Gross profit 57,281 57,281 Operating expenses 23,307 (a) (5,616) 17,521 (b) (170) Operating income 33,974 (a) 5,616 39,760 (b) 170 Net income 46,124 (a) 5,904 34,372 (b) 170 (c) (14,072) (e) (3,754) Six months ended June 30, 2007 Non-GAAP GAAP Adjustments Results Gross profit 39,646 39,646 Operating expenses 7,949 (b) (170) 7,779 Operating income 31,697 (b) 170 31,867 Net income 21,435 (b) 170 26,074 (c) 4,822 (d) 371 (e) (724) (a) To adjust stock-based compensation charges (b) To adjust amortization of property management rights (c) To adjust changes in fair value of derivative warrant liabilities (d) To adjust amortization of convertible debt issuance cost (e) To adjust unrealized exchange gain For more information, please contact: In China: Ms. Lisa Wang Director of Investor Relations General Manager of Strategy, Investment and Financing Department Tel: +86-10-6598-1626 Email: Mr. Derek Mitchell Ogilvy Financial, Beijing Tel: +86-10-8520-6284 Email: In the United States: Mr. Thomas Smith Ogilvy Financial, New York Tel: +1-212-880-5269 Email: DATASOURCE: Xinyuan Real Estate Co., Ltd. CONTACT: Ms. Lisa Wang, Director of Investor Relations, General Manager of Strategy, Investment and Financing Department, +86-10-6598-1626, or ; Mr. Derek Mitchell, Ogilvy Financial, Beijing, +86-10-8520-6284, or ; In the United States: Mr. Thomas Smith, Ogilvy Financial, New York, +1-212-880-5269, or Web Site: http://www.xyre.com/

Copyright

1 Year Xinyuan Real Estate Chart

1 Year Xinyuan Real Estate Chart

1 Month Xinyuan Real Estate Chart

1 Month Xinyuan Real Estate Chart