Pay vs Performance Disclosure
|
3 Months Ended |
9 Months Ended |
12 Months Ended |
Sep. 30, 2021 |
Jun. 26, 2021 |
Sep. 30, 2023
USD ($)
|
Sep. 30, 2022
USD ($)
|
Sep. 30, 2021
USD ($)
|
| Pay vs Performance Disclosure [Table] |
|
|
|
|
|
| Pay vs Performance [Table Text Block] |
|
|
Pay Versus
Performance Disclosure
As required by Section 953(a) of the Dodd-Frank Wall Street Reform and Consumer
Protection Act, and Item 402(v) of Regulation S-K, we are providing the following information about the relationship between compensation actually paid to our Named Executive Officers (“NEOs”) and certain financial performance metrics of the
Company using a methodology that has been prescribed by the U.S. Securities and Exchange Commission. The disclosure does not necessarily reflect value actually realized by the NEOs or how the Committee evaluates compensation decisions in light
of Company or individual performance. For discussion of how the Committee seeks to align pay with performance when making compensation decisions, please see the Compensation Discussion and Analysis beginning on page 29.
|
2023
|
|
|
$9,960,170
|
|
|
n/a
|
|
|
$2,087,247
|
|
|
n/a
|
|
|
$2,146,817
|
|
|
$508,745
|
|
|
$78.44
|
|
|
$108.98
|
|
|
($1,502.0)
|
|
|
$2.84
|
|
2022
|
|
|
$6,060,694
|
|
|
n/a
|
|
|
$2,096,450
|
|
|
n/a
|
|
|
$2,036,182
|
|
|
$526,688
|
|
|
$105.02
|
|
|
$117.20
|
|
|
$1,073.0
|
|
|
$2.90
|
|
2021
|
|
|
$4,107,789
|
|
|
$6,853,838
|
|
|
$5,305,593
|
|
|
$11,338,149
|
|
|
$2,326,699
|
|
|
$3,345,437
|
|
|
$133.50
|
|
|
$111.01
|
|
|
$1,467.0
|
|
|
$2.96
|
|
(1)
|
Mr. Perreault
became our principal executive officer (“PEO”) on June 26, 2021 and was our PEO through Fiscal 2023. As previously announced, Mr. Perreault has ceased to serve as President and Chief Executive Officer of the Company, effective
December 12, 2023. Mr. Walsh, our former PEO, retired on June 26, 2021. Our non-PEO NEOs included: (a) for Fiscal 2023,
Messrs. O’Brien, Jastrzebski, Beard and Koerwer and Mses. Zagorski and Gaudiosi; (b) for Fiscal 2022, Messrs. Jastrzebski and Beard and Mses. Zagorski and Gaudiosi; and (c) for Fiscal 2021, Messrs. Jastrzebski, Beard and Gallagher and
Mses. Zagorski and Gaudiosi.
|
|
(2)
|
The following amounts were deducted from/added to Summary Compensation Table total compensation in accordance with the
SEC-mandated adjustments to calculate Compensation Actually Paid (“CAP”) to our PEO and average CAP to our non-PEO named executive officers. The fair value of equity awards was determined using methodologies and assumptions developed in
a manner substantively consistent with those used to determine the grant date fair value of such awards.
|
|
Summary Compensation Table Total
|
|
|
$4,107,789
|
|
|
$6,060,694
|
|
|
$9,960,170
|
|
Deduct Change in
Actuarial Present Value of Pension Plans Reported in Fiscal Year
|
|
|
—
|
|
|
—
|
|
|
—
|
|
Add Service Cost of
Pension in Fiscal Year
|
|
|
—
|
|
|
—
|
|
|
—
|
|
Add Prior Service Cost
of Pension in Fiscal Year
|
|
|
—
|
|
|
—
|
|
|
—
|
|
Deduct Grant Date Fair
Value of Stock Awards Granted in Fiscal Year
|
|
|
(2,522,588)
|
|
|
(4,158,984)
|
|
|
(7,733,691)
|
|
Add-Deduct Fair Value
at Fiscal Year-End of Outstanding and Unvested Stock Awards Granted in Fiscal Year
|
|
|
2,855,539
|
|
|
1,999,801
|
|
|
1,454,565
|
|
Add-Deduct Change in
Fair Value of Outstanding and Unvested Stock Awards Granted in Prior Fiscal Years
|
|
|
745,506
|
|
|
(2,073,984)
|
|
|
(1,912,144)
|
|
Add-Deduct Fair Value
at Vesting of Stock Awards Granted in Fiscal Year That Vested During Fiscal Year
|
|
|
—
|
|
|
—
|
|
|
—
|
|
Add-Deduct Change in
Fair Value as of Vesting Date of Stock Awards Granted in Prior Fiscal Years For Which Applicable Vesting Conditions Were Satisfied During Fiscal Year
|
|
|
48,425
|
|
|
151,830
|
|
|
168,939
|
|
Deduct Fair Value as of
Prior Fiscal Year-End of Stock Awards Granted in Prior Fiscal Years That Failed to Meet Applicable Vesting Conditions During Fiscal Year
|
|
|
(4,165)
|
|
|
(13,838)
|
|
|
(36,180)
|
|
Add Dividends or Other
Earnings Paid on Stock Awards in the Fiscal Year Prior to the Vesting Date that are not otherwise included in the Total Compensation for the Fiscal Year
|
|
|
75,087
|
|
|
130,931
|
|
|
185,588
|
|
Compensation Actually Paid
|
|
|
$5,305,593
|
|
|
$2,096,450
|
|
|
$2,087,247
|
|
Summary Compensation Table Total
|
|
|
$6,853,838
|
|
|
n/a
|
|
|
n/a
|
|
Deduct Change in
Actuarial Present Value of Pension Plans Reported in Fiscal Year
|
|
|
—
|
|
|
|
|
|
|
|
Add Service Cost of
Pension in Fiscal Year
|
|
|
571,123
|
|
|
|
|
|
|
|
Add Prior Service Cost
of Pension in Fiscal Year
|
|
|
—
|
|
|
|
|
|
|
|
Subtract Grant Date
Fair Value of Stock Awards Granted in Fiscal Year
|
|
|
(4,000,639)
|
|
|
|
|
|
|
|
Add-Deduct Fair Value
at Fiscal Year-End of Outstanding and Unvested Stock Awards Granted in Fiscal Year
|
|
|
5,650,907
|
|
|
|
|
|
|
|
Add-Deduct Change in
Fair Value of Outstanding and Unvested Stock Awards Granted in Prior Fiscal Years
|
|
|
1,934,202
|
|
|
|
|
|
|
|
Add-Deduct Fair Value
at Vesting of Stock Awards Granted in Fiscal Year That Vested During Fiscal Year
|
|
|
—
|
|
|
|
|
|
|
|
Add-Deduct Change in
Fair Value as of Vesting Date of Stock Awards Granted in Prior Fiscal Years For Which Applicable Vesting Conditions Were Satisfied During Fiscal Year
|
|
|
175,908
|
|
|
|
|
|
|
|
Deduct Fair Value as of
Prior Fiscal Year-End of Stock Awards Granted in Prior Fiscal Years That Failed to Meet Applicable Vesting Conditions During Fiscal Year
|
|
|
(18,130)
|
|
|
|
|
|
|
|
Add Dividends or Other
Earnings Paid on Stock Awards in the Fiscal Year Prior to the Vesting Date that are not otherwise included in the Total Compensation for the Fiscal Year
|
|
|
170,940
|
|
|
|
|
|
|
|
Compensation Actually Paid
|
|
|
$11,338,149
|
|
|
n/a
|
|
|
n/a
|
|
Average Summary Compensation Table Total
|
|
|
$2,326,699
|
|
|
$2,036,182
|
|
|
$2,146,817
|
|
Deduct Change in
Actuarial Present Value of Pension Plans Reported in Fiscal Year
|
|
|
(4,416)
|
|
|
—
|
|
|
(112,777)
|
|
Add Service Cost of
Pension in Fiscal Year
|
|
|
40,323
|
|
|
48,571
|
|
|
24,384
|
|
Add Prior Service Cost
of Pension in Fiscal Year
|
|
|
—
|
|
|
—
|
|
|
—
|
|
Deduct Grant Date Fair
Value of Stock Awards Granted in Fiscal Year
|
|
|
(946,162)
|
|
|
(996,247)
|
|
|
(1,220,089)
|
|
Add-Deduct Fair Value
at Fiscal Year-End of Outstanding and Unvested Stock Awards Granted in Fiscal Year
|
|
|
1,336,445
|
|
|
479,065
|
|
|
170,192
|
|
Add-Deduct Change in
Fair Value of Outstanding and Unvested Stock Awards Granted in Prior Fiscal Years
|
|
|
458,419
|
|
|
(1,148,318)
|
|
|
(294,986)
|
|
Add-Deduct Fair Value
at Vesting of Stock Awards Granted in Fiscal Year That Vested During Fiscal Year
|
|
|
—
|
|
|
—
|
|
|
3,411
|
|
Add-Deduct Change in
Fair Value as of Vesting Date of Stock Awards Granted in Prior Fiscal Years For Which Applicable Vesting Conditions Were Satisfied During Fiscal Year
|
|
|
93,323
|
|
|
76,365
|
|
|
48,985
|
|
Deduct Fair Value as of
Prior Fiscal Year-End of Stock Awards Granted in Prior Fiscal Years That Failed to Meet Applicable Vesting Conditions During Fiscal Year
|
|
|
(2,135)
|
|
|
(12,696)
|
|
|
(254,651)
|
|
Add Dividends or Other
Earnings Paid on Stock Awards in the Fiscal Year Prior to the Vesting Date that are not otherwise included in the Total Compensation for the Fiscal Year
|
|
|
42,941
|
|
|
43,766
|
|
|
(2,541)
|
|
Average Compensation Actually Paid for NEOs
|
|
|
$3,345,437
|
|
|
$526,688
|
|
|
$508,745
|
|
(3)
|
The Peer Group for which TSR is provided in column (g) is the S&P 500 Utilities Index.
|
|
(4)
|
Adjusted EPS is a Non-GAAP financial measure. For a discussion of adjustments, please see the “Executive Summary” section of
our Compensation Discussion and Analysis.
|
|
|
|
| Company Selected Measure Name |
|
|
Adjusted EPS
|
|
|
| Named Executive Officers, Footnote [Text Block] |
|
|
|
(1)
|
Mr. Perreault
became our principal executive officer (“PEO”) on June 26, 2021 and was our PEO through Fiscal 2023. As previously announced, Mr. Perreault has ceased to serve as President and Chief Executive Officer of the Company, effective
December 12, 2023. Mr. Walsh, our former PEO, retired on June 26, 2021. Our non-PEO NEOs included: (a) for Fiscal 2023,
Messrs. O’Brien, Jastrzebski, Beard and Koerwer and Mses. Zagorski and Gaudiosi; (b) for Fiscal 2022, Messrs. Jastrzebski and Beard and Mses. Zagorski and Gaudiosi; and (c) for Fiscal 2021, Messrs. Jastrzebski, Beard and Gallagher and
Mses. Zagorski and Gaudiosi.
|
|
|
|
| Peer Group Issuers, Footnote [Text Block] |
|
|
|
(3)
|
The Peer Group for which TSR is provided in column (g) is the S&P 500 Utilities Index.
|
|
|
|
| Adjustment To PEO Compensation, Footnote [Text Block] |
|
|
|
(2)
|
The following amounts were deducted from/added to Summary Compensation Table total compensation in accordance with the
SEC-mandated adjustments to calculate Compensation Actually Paid (“CAP”) to our PEO and average CAP to our non-PEO named executive officers. The fair value of equity awards was determined using methodologies and assumptions developed in
a manner substantively consistent with those used to determine the grant date fair value of such awards.
|
|
Summary Compensation Table Total
|
|
|
$4,107,789
|
|
|
$6,060,694
|
|
|
$9,960,170
|
|
Deduct Change in
Actuarial Present Value of Pension Plans Reported in Fiscal Year
|
|
|
—
|
|
|
—
|
|
|
—
|
|
Add Service Cost of
Pension in Fiscal Year
|
|
|
—
|
|
|
—
|
|
|
—
|
|
Add Prior Service Cost
of Pension in Fiscal Year
|
|
|
—
|
|
|
—
|
|
|
—
|
|
Deduct Grant Date Fair
Value of Stock Awards Granted in Fiscal Year
|
|
|
(2,522,588)
|
|
|
(4,158,984)
|
|
|
(7,733,691)
|
|
Add-Deduct Fair Value
at Fiscal Year-End of Outstanding and Unvested Stock Awards Granted in Fiscal Year
|
|
|
2,855,539
|
|
|
1,999,801
|
|
|
1,454,565
|
|
Add-Deduct Change in
Fair Value of Outstanding and Unvested Stock Awards Granted in Prior Fiscal Years
|
|
|
745,506
|
|
|
(2,073,984)
|
|
|
(1,912,144)
|
|
Add-Deduct Fair Value
at Vesting of Stock Awards Granted in Fiscal Year That Vested During Fiscal Year
|
|
|
—
|
|
|
—
|
|
|
—
|
|
Add-Deduct Change in
Fair Value as of Vesting Date of Stock Awards Granted in Prior Fiscal Years For Which Applicable Vesting Conditions Were Satisfied During Fiscal Year
|
|
|
48,425
|
|
|
151,830
|
|
|
168,939
|
|
Deduct Fair Value as of
Prior Fiscal Year-End of Stock Awards Granted in Prior Fiscal Years That Failed to Meet Applicable Vesting Conditions During Fiscal Year
|
|
|
(4,165)
|
|
|
(13,838)
|
|
|
(36,180)
|
|
Add Dividends or Other
Earnings Paid on Stock Awards in the Fiscal Year Prior to the Vesting Date that are not otherwise included in the Total Compensation for the Fiscal Year
|
|
|
75,087
|
|
|
130,931
|
|
|
185,588
|
|
Compensation Actually Paid
|
|
|
$5,305,593
|
|
|
$2,096,450
|
|
|
$2,087,247
|
|
Summary Compensation Table Total
|
|
|
$6,853,838
|
|
|
n/a
|
|
|
n/a
|
|
Deduct Change in
Actuarial Present Value of Pension Plans Reported in Fiscal Year
|
|
|
—
|
|
|
|
|
|
|
|
Add Service Cost of
Pension in Fiscal Year
|
|
|
571,123
|
|
|
|
|
|
|
|
Add Prior Service Cost
of Pension in Fiscal Year
|
|
|
—
|
|
|
|
|
|
|
|
Subtract Grant Date
Fair Value of Stock Awards Granted in Fiscal Year
|
|
|
(4,000,639)
|
|
|
|
|
|
|
|
Add-Deduct Fair Value
at Fiscal Year-End of Outstanding and Unvested Stock Awards Granted in Fiscal Year
|
|
|
5,650,907
|
|
|
|
|
|
|
|
Add-Deduct Change in
Fair Value of Outstanding and Unvested Stock Awards Granted in Prior Fiscal Years
|
|
|
1,934,202
|
|
|
|
|
|
|
|
Add-Deduct Fair Value
at Vesting of Stock Awards Granted in Fiscal Year That Vested During Fiscal Year
|
|
|
—
|
|
|
|
|
|
|
|
Add-Deduct Change in
Fair Value as of Vesting Date of Stock Awards Granted in Prior Fiscal Years For Which Applicable Vesting Conditions Were Satisfied During Fiscal Year
|
|
|
175,908
|
|
|
|
|
|
|
|
Deduct Fair Value as of
Prior Fiscal Year-End of Stock Awards Granted in Prior Fiscal Years That Failed to Meet Applicable Vesting Conditions During Fiscal Year
|
|
|
(18,130)
|
|
|
|
|
|
|
|
Add Dividends or Other
Earnings Paid on Stock Awards in the Fiscal Year Prior to the Vesting Date that are not otherwise included in the Total Compensation for the Fiscal Year
|
|
|
170,940
|
|
|
|
|
|
|
|
Compensation Actually Paid
|
|
|
$11,338,149
|
|
|
n/a
|
|
|
n/a
|
|
|
|
| Non-PEO NEO Average Total Compensation Amount |
|
|
$ 2,146,817
|
$ 2,036,182
|
$ 2,326,699
|
| Non-PEO NEO Average Compensation Actually Paid Amount |
|
|
$ 508,745
|
526,688
|
3,345,437
|
| Adjustment to Non-PEO NEO Compensation Footnote [Text Block] |
|
|
|
(2)
|
The following amounts were deducted from/added to Summary Compensation Table total compensation in accordance with the
SEC-mandated adjustments to calculate Compensation Actually Paid (“CAP”) to our PEO and average CAP to our non-PEO named executive officers. The fair value of equity awards was determined using methodologies and assumptions developed in
a manner substantively consistent with those used to determine the grant date fair value of such awards.
|
|
Average Summary Compensation Table Total
|
|
|
$2,326,699
|
|
|
$2,036,182
|
|
|
$2,146,817
|
|
Deduct Change in
Actuarial Present Value of Pension Plans Reported in Fiscal Year
|
|
|
(4,416)
|
|
|
—
|
|
|
(112,777)
|
|
Add Service Cost of
Pension in Fiscal Year
|
|
|
40,323
|
|
|
48,571
|
|
|
24,384
|
|
Add Prior Service Cost
of Pension in Fiscal Year
|
|
|
—
|
|
|
—
|
|
|
—
|
|
Deduct Grant Date Fair
Value of Stock Awards Granted in Fiscal Year
|
|
|
(946,162)
|
|
|
(996,247)
|
|
|
(1,220,089)
|
|
Add-Deduct Fair Value
at Fiscal Year-End of Outstanding and Unvested Stock Awards Granted in Fiscal Year
|
|
|
1,336,445
|
|
|
479,065
|
|
|
170,192
|
|
Add-Deduct Change in
Fair Value of Outstanding and Unvested Stock Awards Granted in Prior Fiscal Years
|
|
|
458,419
|
|
|
(1,148,318)
|
|
|
(294,986)
|
|
Add-Deduct Fair Value
at Vesting of Stock Awards Granted in Fiscal Year That Vested During Fiscal Year
|
|
|
—
|
|
|
—
|
|
|
3,411
|
|
Add-Deduct Change in
Fair Value as of Vesting Date of Stock Awards Granted in Prior Fiscal Years For Which Applicable Vesting Conditions Were Satisfied During Fiscal Year
|
|
|
93,323
|
|
|
76,365
|
|
|
48,985
|
|
Deduct Fair Value as of
Prior Fiscal Year-End of Stock Awards Granted in Prior Fiscal Years That Failed to Meet Applicable Vesting Conditions During Fiscal Year
|
|
|
(2,135)
|
|
|
(12,696)
|
|
|
(254,651)
|
|
Add Dividends or Other
Earnings Paid on Stock Awards in the Fiscal Year Prior to the Vesting Date that are not otherwise included in the Total Compensation for the Fiscal Year
|
|
|
42,941
|
|
|
43,766
|
|
|
(2,541)
|
|
Average Compensation Actually Paid for NEOs
|
|
|
$3,345,437
|
|
|
$526,688
|
|
|
$508,745
|
|
|
|
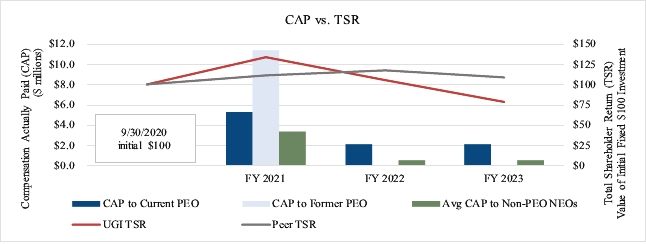
| Compensation Actually Paid vs. Total Shareholder Return [Text Block] |
|
|
The following graphs present the relationship during 2023, 2022, and 2021
between (1) CAP to (a) each person serving as PEO and (b) our other NEOs on an average basis, and each of (2) (a) the Company’s and Peer Group’s TSR for such years and (b) the Company’s Net Income and Adjusted EPS for such years.
|
|
|
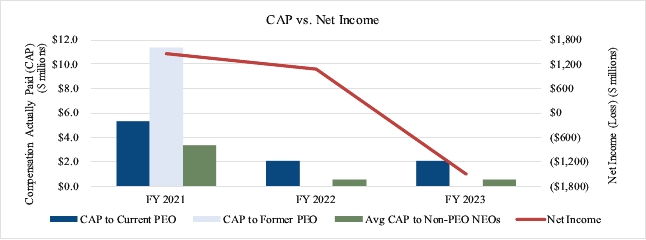
| Compensation Actually Paid vs. Net Income [Text Block] |
|
|
The following graphs present the relationship during 2023, 2022, and 2021
between (1) CAP to (a) each person serving as PEO and (b) our other NEOs on an average basis, and each of (2) (a) the Company’s and Peer Group’s TSR for such years and (b) the Company’s Net Income and Adjusted EPS for such years.
|
|
|
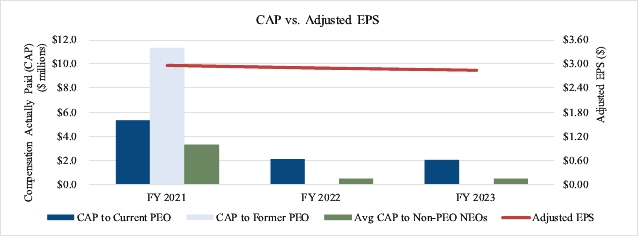
| Compensation Actually Paid vs. Company Selected Measure [Text Block] |
|
|
The following graphs present the relationship during 2023, 2022, and 2021
between (1) CAP to (a) each person serving as PEO and (b) our other NEOs on an average basis, and each of (2) (a) the Company’s and Peer Group’s TSR for such years and (b) the Company’s Net Income and Adjusted EPS for such years.
|
|
|
|
• Adjusted EPS
• Safety - OSHA recordables
• Diversity & Inclusion goals
• Relative TSR
|
|
|
|
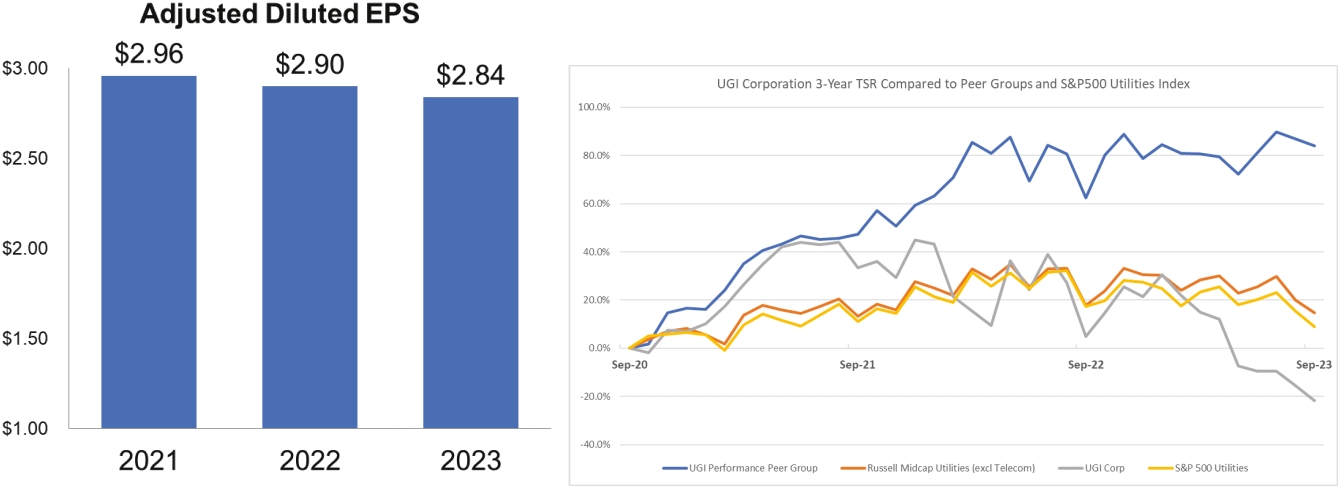
| Total Shareholder Return Vs Peer Group [Text Block] |
|
|
The following graphs present the relationship during 2023, 2022, and 2021
between (1) CAP to (a) each person serving as PEO and (b) our other NEOs on an average basis, and each of (2) (a) the Company’s and Peer Group’s TSR for such years and (b) the Company’s Net Income and Adjusted EPS for such years.
|
|
|
| Tabular List [Table Text Block] |
|
|
|
|
|
|
• Adjusted EPS
• Safety - OSHA recordables
• Diversity & Inclusion goals
• Relative TSR
|
|
|
|
| Total Shareholder Return Amount |
|
|
$ 78.44
|
105.02
|
133.5
|
| Peer Group Total Shareholder Return Amount |
|
|
108.98
|
117.2
|
111.01
|
| Net Income (Loss) |
|
|
$ (1,502,000,000)
|
$ 1,073,000,000
|
$ 1,467,000,000
|
| Company Selected Measure Amount |
|
|
2.84
|
2.9
|
2.96
|
| PEO Name |
Mr. Perreault
|
Mr. Walsh
|
Mr. Perreault
|
Mr. Perreault
|
|
| Measure [Axis]: 1 |
|
|
|
|
|
| Pay vs Performance Disclosure [Table] |
|
|
|
|
|
| Measure Name |
|
|
Adjusted EPS
|
|
|
| Non-GAAP Measure Description [Text Block] |
|
|
|
(4)
|
Adjusted EPS is a Non-GAAP financial measure. For a discussion of adjustments, please see the “Executive Summary” section of
our Compensation Discussion and Analysis.
|
|
|
|
| Measure [Axis]: 2 |
|
|
|
|
|
| Pay vs Performance Disclosure [Table] |
|
|
|
|
|
| Measure Name |
|
|
Safety - OSHA recordables
|
|
|
| Measure [Axis]: 3 |
|
|
|
|
|
| Pay vs Performance Disclosure [Table] |
|
|
|
|
|
| Measure Name |
|
|
Diversity & Inclusion goals
|
|
|
| Measure [Axis]: 4 |
|
|
|
|
|
| Pay vs Performance Disclosure [Table] |
|
|
|
|
|
| Measure Name |
|
|
Relative TSR
|
|
|
| Mr. Perreault [Member] |
|
|
|
|
|
| Pay vs Performance Disclosure [Table] |
|
|
|
|
|
| PEO Total Compensation Amount |
|
|
$ 9,960,170
|
$ 6,060,694
|
$ 4,107,789
|
| PEO Actually Paid Compensation Amount |
|
|
2,087,247
|
2,096,450
|
5,305,593
|
| Mr. Walsh [Member] |
|
|
|
|
|
| Pay vs Performance Disclosure [Table] |
|
|
|
|
|
| PEO Total Compensation Amount |
|
|
|
|
6,853,838
|
| PEO Actually Paid Compensation Amount |
|
|
|
|
11,338,149
|
| PEO [Member] | Mr. Perreault [Member] | Change in Actuarial Present Value of Pension Plans Reported in Fiscal Year [Member] |
|
|
|
|
|
| Pay vs Performance Disclosure [Table] |
|
|
|
|
|
| Adjustment to Compensation Amount |
|
|
0
|
0
|
0
|
| PEO [Member] | Mr. Perreault [Member] | Service Cost of Pension in Fiscal Year [Member] |
|
|
|
|
|
| Pay vs Performance Disclosure [Table] |
|
|
|
|
|
| Adjustment to Compensation Amount |
|
|
0
|
0
|
0
|
| PEO [Member] | Mr. Perreault [Member] | Prior Service Cost of Pension in Fiscal Year [Member] |
|
|
|
|
|
| Pay vs Performance Disclosure [Table] |
|
|
|
|
|
| Adjustment to Compensation Amount |
|
|
0
|
0
|
0
|
| PEO [Member] | Mr. Perreault [Member] | Grant Date Fair Value of Stock Awards Granted in Fiscal Year [Member] |
|
|
|
|
|
| Pay vs Performance Disclosure [Table] |
|
|
|
|
|
| Adjustment to Compensation Amount |
|
|
(7,733,691)
|
(4,158,984)
|
(2,522,588)
|
| PEO [Member] | Mr. Perreault [Member] | Fair Value at Fiscal Year-End of Outstanding and Unvested Stock Awards Granted in Fiscal Year [Member] |
|
|
|
|
|
| Pay vs Performance Disclosure [Table] |
|
|
|
|
|
| Adjustment to Compensation Amount |
|
|
1,454,565
|
1,999,801
|
2,855,539
|
| PEO [Member] | Mr. Perreault [Member] | Change in Fair Value of Outstanding and Unvested Stock Awards Granted in Prior Fiscal Years [Member] |
|
|
|
|
|
| Pay vs Performance Disclosure [Table] |
|
|
|
|
|
| Adjustment to Compensation Amount |
|
|
(1,912,144)
|
(2,073,984)
|
745,506
|
| PEO [Member] | Mr. Perreault [Member] | Fair Value at Vesting of Stock Awards Granted in Fiscal Year that Vested During Fiscal Year [Member] |
|
|
|
|
|
| Pay vs Performance Disclosure [Table] |
|
|
|
|
|
| Adjustment to Compensation Amount |
|
|
0
|
0
|
0
|
| PEO [Member] | Mr. Perreault [Member] | Change in Fair Value as of Vesting Date of Stock Awards Granted in Prior Fiscal Years for which Applicable Vesting Conditions were Satisfied During Fiscal Year [Member] |
|
|
|
|
|
| Pay vs Performance Disclosure [Table] |
|
|
|
|
|
| Adjustment to Compensation Amount |
|
|
168,939
|
151,830
|
48,425
|
| PEO [Member] | Mr. Perreault [Member] | Fair Value as of Prior Fiscal Year-End of Stock Awards Granted in Prior Fiscal Years that Failed to Meet Applicable Vesting Conditions During Fiscal Year [Member] |
|
|
|
|
|
| Pay vs Performance Disclosure [Table] |
|
|
|
|
|
| Adjustment to Compensation Amount |
|
|
(36,180)
|
(13,838)
|
(4,165)
|
| PEO [Member] | Mr. Perreault [Member] | Dividends or Other Earnings Paid on Stock Awards in the Fiscal Year Prior to the Vesting Date that are not Otherwise Included in the Total Compensation for the Fiscal Year [Member] |
|
|
|
|
|
| Pay vs Performance Disclosure [Table] |
|
|
|
|
|
| Adjustment to Compensation Amount |
|
|
185,588
|
130,931
|
75,087
|
| PEO [Member] | Mr. Walsh [Member] | Change in Actuarial Present Value of Pension Plans Reported in Fiscal Year [Member] |
|
|
|
|
|
| Pay vs Performance Disclosure [Table] |
|
|
|
|
|
| Adjustment to Compensation Amount |
|
|
|
|
0
|
| PEO [Member] | Mr. Walsh [Member] | Service Cost of Pension in Fiscal Year [Member] |
|
|
|
|
|
| Pay vs Performance Disclosure [Table] |
|
|
|
|
|
| Adjustment to Compensation Amount |
|
|
|
|
571,123
|
| PEO [Member] | Mr. Walsh [Member] | Prior Service Cost of Pension in Fiscal Year [Member] |
|
|
|
|
|
| Pay vs Performance Disclosure [Table] |
|
|
|
|
|
| Adjustment to Compensation Amount |
|
|
|
|
0
|
| PEO [Member] | Mr. Walsh [Member] | Grant Date Fair Value of Stock Awards Granted in Fiscal Year [Member] |
|
|
|
|
|
| Pay vs Performance Disclosure [Table] |
|
|
|
|
|
| Adjustment to Compensation Amount |
|
|
|
|
(4,000,639)
|
| PEO [Member] | Mr. Walsh [Member] | Fair Value at Fiscal Year-End of Outstanding and Unvested Stock Awards Granted in Fiscal Year [Member] |
|
|
|
|
|
| Pay vs Performance Disclosure [Table] |
|
|
|
|
|
| Adjustment to Compensation Amount |
|
|
|
|
5,650,907
|
| PEO [Member] | Mr. Walsh [Member] | Change in Fair Value of Outstanding and Unvested Stock Awards Granted in Prior Fiscal Years [Member] |
|
|
|
|
|
| Pay vs Performance Disclosure [Table] |
|
|
|
|
|
| Adjustment to Compensation Amount |
|
|
|
|
1,934,202
|
| PEO [Member] | Mr. Walsh [Member] | Fair Value at Vesting of Stock Awards Granted in Fiscal Year that Vested During Fiscal Year [Member] |
|
|
|
|
|
| Pay vs Performance Disclosure [Table] |
|
|
|
|
|
| Adjustment to Compensation Amount |
|
|
|
|
0
|
| PEO [Member] | Mr. Walsh [Member] | Change in Fair Value as of Vesting Date of Stock Awards Granted in Prior Fiscal Years for which Applicable Vesting Conditions were Satisfied During Fiscal Year [Member] |
|
|
|
|
|
| Pay vs Performance Disclosure [Table] |
|
|
|
|
|
| Adjustment to Compensation Amount |
|
|
|
|
175,908
|
| PEO [Member] | Mr. Walsh [Member] | Fair Value as of Prior Fiscal Year-End of Stock Awards Granted in Prior Fiscal Years that Failed to Meet Applicable Vesting Conditions During Fiscal Year [Member] |
|
|
|
|
|
| Pay vs Performance Disclosure [Table] |
|
|
|
|
|
| Adjustment to Compensation Amount |
|
|
|
|
(18,130)
|
| PEO [Member] | Mr. Walsh [Member] | Dividends or Other Earnings Paid on Stock Awards in the Fiscal Year Prior to the Vesting Date that are not Otherwise Included in the Total Compensation for the Fiscal Year [Member] |
|
|
|
|
|
| Pay vs Performance Disclosure [Table] |
|
|
|
|
|
| Adjustment to Compensation Amount |
|
|
|
|
170,940
|
| Non-PEO NEO [Member] | Change in Actuarial Present Value of Pension Plans Reported in Fiscal Year [Member] |
|
|
|
|
|
| Pay vs Performance Disclosure [Table] |
|
|
|
|
|
| Adjustment to Compensation Amount |
|
|
(112,777)
|
0
|
(4,416)
|
| Non-PEO NEO [Member] | Service Cost of Pension in Fiscal Year [Member] |
|
|
|
|
|
| Pay vs Performance Disclosure [Table] |
|
|
|
|
|
| Adjustment to Compensation Amount |
|
|
24,384
|
48,571
|
40,323
|
| Non-PEO NEO [Member] | Prior Service Cost of Pension in Fiscal Year [Member] |
|
|
|
|
|
| Pay vs Performance Disclosure [Table] |
|
|
|
|
|
| Adjustment to Compensation Amount |
|
|
0
|
0
|
0
|
| Non-PEO NEO [Member] | Grant Date Fair Value of Stock Awards Granted in Fiscal Year [Member] |
|
|
|
|
|
| Pay vs Performance Disclosure [Table] |
|
|
|
|
|
| Adjustment to Compensation Amount |
|
|
(1,220,089)
|
(996,247)
|
(946,162)
|
| Non-PEO NEO [Member] | Fair Value at Fiscal Year-End of Outstanding and Unvested Stock Awards Granted in Fiscal Year [Member] |
|
|
|
|
|
| Pay vs Performance Disclosure [Table] |
|
|
|
|
|
| Adjustment to Compensation Amount |
|
|
170,192
|
479,065
|
1,336,445
|
| Non-PEO NEO [Member] | Change in Fair Value of Outstanding and Unvested Stock Awards Granted in Prior Fiscal Years [Member] |
|
|
|
|
|
| Pay vs Performance Disclosure [Table] |
|
|
|
|
|
| Adjustment to Compensation Amount |
|
|
(294,986)
|
(1,148,318)
|
458,419
|
| Non-PEO NEO [Member] | Fair Value at Vesting of Stock Awards Granted in Fiscal Year that Vested During Fiscal Year [Member] |
|
|
|
|
|
| Pay vs Performance Disclosure [Table] |
|
|
|
|
|
| Adjustment to Compensation Amount |
|
|
3,411
|
0
|
0
|
| Non-PEO NEO [Member] | Change in Fair Value as of Vesting Date of Stock Awards Granted in Prior Fiscal Years for which Applicable Vesting Conditions were Satisfied During Fiscal Year [Member] |
|
|
|
|
|
| Pay vs Performance Disclosure [Table] |
|
|
|
|
|
| Adjustment to Compensation Amount |
|
|
48,985
|
76,365
|
93,323
|
| Non-PEO NEO [Member] | Fair Value as of Prior Fiscal Year-End of Stock Awards Granted in Prior Fiscal Years that Failed to Meet Applicable Vesting Conditions During Fiscal Year [Member] |
|
|
|
|
|
| Pay vs Performance Disclosure [Table] |
|
|
|
|
|
| Adjustment to Compensation Amount |
|
|
(254,651)
|
(12,696)
|
(2,135)
|
| Non-PEO NEO [Member] | Dividends or Other Earnings Paid on Stock Awards in the Fiscal Year Prior to the Vesting Date that are not Otherwise Included in the Total Compensation for the Fiscal Year [Member] |
|
|
|
|
|
| Pay vs Performance Disclosure [Table] |
|
|
|
|
|
| Adjustment to Compensation Amount |
|
|
$ (2,541)
|
$ 43,766
|
$ 42,941
|

 Hot Features