We could not find any results for:
Make sure your spelling is correct or try broadening your search.
| Share Name | Share Symbol | Market | Type |
|---|---|---|---|
| Trinseo Plc | NYSE:TSE | NYSE | Common Stock |
| Price Change | % Change | Share Price | High Price | Low Price | Open Price | Shares Traded | Last Trade | |
|---|---|---|---|---|---|---|---|---|
| 0.01 | 0.30% | 3.29 | 3.30 | 3.13 | 3.30 | 378,435 | 00:59:59 |
UNITED STATES
SECURITIES AND EXCHANGE COMMISSION
Washington, D.C. 20549
FORM
CURRENT REPORT
Pursuant to Section 13 or 15(d)
of The Securities Exchange Act of 1934
Date of Report (Date of earliest event reported):
(Exact name of registrant as specified in its charter)
(State or other jurisdiction | (Commission | (I.R.S. Employer |
(Address of principal executive offices, including zip code)
(
(Telephone number, including area code)
Check the appropriate box below if the Form 8-K filing is intended to simultaneously satisfy the filing obligation of the registrant under any of the following provisions (see General Instruction A.2. below):
Written communications pursuant to Rule 425 under the Securities Act (17 CFR 230.425) |
Soliciting material pursuant to Rule 14a-12 under the Exchange Act (17 CFR 240.14a-12) |
Pre-commencement communications pursuant to Rule 14d-2(b) under the Exchange Act (17 CFR 240.14d-2(b)) |
Pre-commencement communications pursuant to Rule 13e-4(c) under the Exchange Act (17 CFR 240.13e-4(c)) |
Securities registered pursuant to Section 12(b) of the Act:
Title of Each Class | Trading symbol | Name of Exchange on which registered |
Indicate by check mark whether the registrant is an emerging growth company as defined in Rule 405 of the Securities Act of 1933 (§230.405 of this chapter) or Rule 12b-2 of the Securities Exchange Act of 1934 (§240.12b-2 of this chapter).
Emerging growth company
If an emerging growth company, indicate by check mark if the registrant has elected not to use the extended transition period for complying with any new or revised financial accounting standards provided pursuant to Section 13(a) of the Exchange Act. ☐
ITEM 2.02 | Results of Operations and Financial Condition |
On May 8, 2024, Trinseo PLC, a public limited company existing under the laws of Ireland (the “Company”), issued a press release announcing its financial results for the first quarter ended March 31, 2024. A copy of the press release is furnished as Exhibit 99.1 hereto. The Company intends to hold an investor call and webcast to discuss these results on Thursday, May 9, 2024 at 10 AM Eastern Time. Ahead of this call the Company is also making available on its website an investor presentation, which will be discussed on the call and is furnished as Exhibit 99.2 hereto.
The information contained herein and in the accompanying exhibits shall not be deemed filed for the purposes of Section 18 of the Securities Exchange Act of 1934, as amended, or otherwise subject to the liability of that section, nor shall it be deemed incorporated by reference in any filing under the Securities Act of 1933, as amended, except as shall be expressly set forth by specific reference in such a filing.
ITEM 9.01. | Financial Statements and Exhibits |
(d) Exhibits
Exhibit | Description | |
99.1 | ||
99.2 | ||
104 | Cover Page Interactive Data File (formatted in Inline XBRL and contained in Exhibit 101) |
SIGNATURES
Pursuant to the requirements of the Securities Exchange Act of 1934, each registrant has duly caused this report to be signed on its behalf by the undersigned hereunto duly authorized.
TRINSEO PLC | |||
By: | /s/ David Stasse | ||
Name: | David Stasse | ||
Title: | Executive Vice President and Chief Financial Officer | ||
Date: May 8, 2024 | |||
Exhibit 99.1

Contact: | ||
Andy Myers | ||
Tel : +1 610-240-3221 | ||
Email: aemyers@trinseo.com |
Trinseo Reports First Quarter 2024 Financial Results and Provides Second Quarter Outlook
First Quarter 2024 and Other Highlights
● | Net loss of $76 million and EPS of negative $2.14 |
| ● | Adjusted EBITDA* of $45 million, including a $13 million favorable impact from net timing; Adjusted Net Loss* of $69 million |
● | Cash used in operations of $66 million and capital expenditures of $16 million resulted in Free Cash Flow* of negative $82 million. First quarter Free Cash Flow* included a $61 million increase in trade working capital driven by seasonal factors and a more than 50% increase in styrene monomer prices |
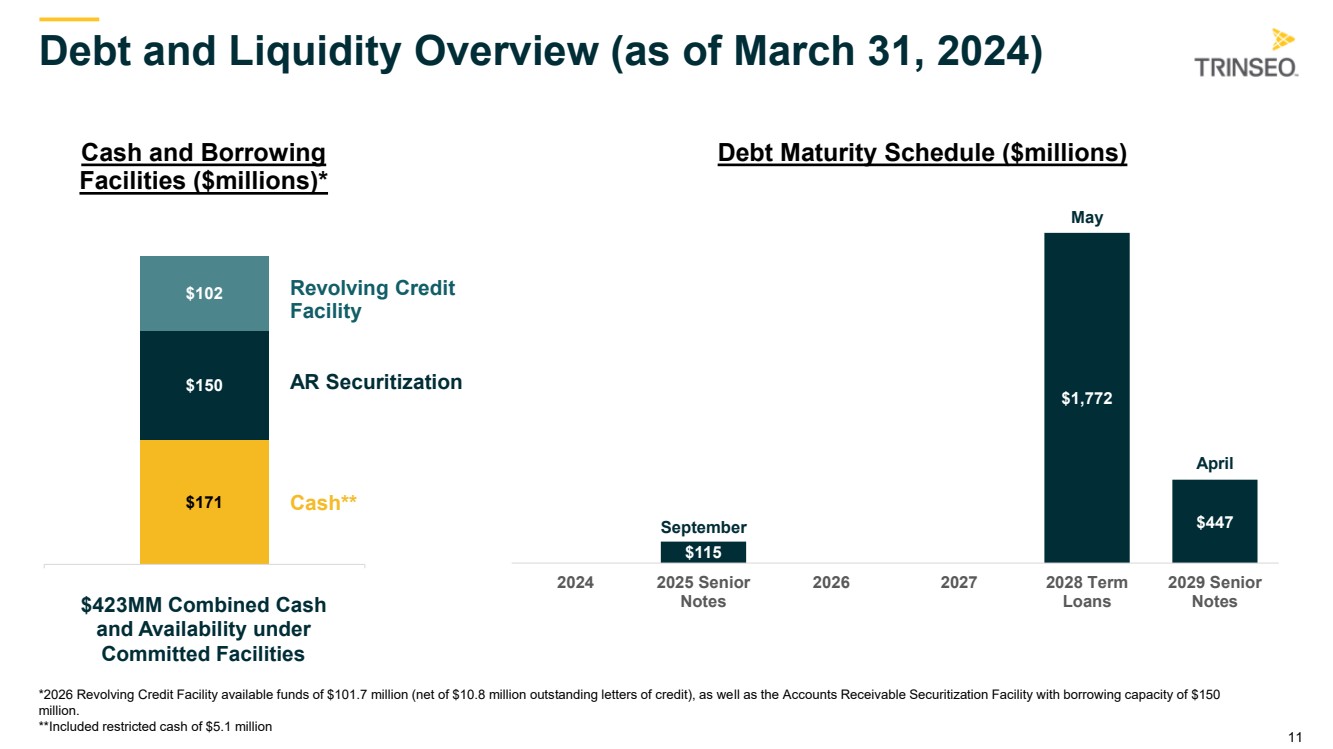
● | First quarter ending cash of $171 million, of which $5 million was restricted, with approximately $252 million of additional available liquidity under two undrawn, committed financing facilities with continued focus on cash management and liquidity |
| ● | Extended the maturity date of the Accounts Receivable Securitization Facility by one year to November 2025, and expanded available borrowing capacity by $36 million quarter-over-quarter |
● | Announced commencement of the sale process for the Company’s interest in Americas Styrenics, via the initiation of an ownership exit provision in the joint venture agreement, which is expected to lead to a definitive agreement in early 2025 |
| ● | Announced the potential closure of the virgin polycarbonate production site in Stade, Germany which, if approved, is expected to increase annual profitability by $15 million to $20 million compared to 2023 |
| | Three Months Ended | ||||
| | March 31, | ||||
$millions, except per share data | | 2024 |
| 2023 | ||
Net Sales |
| $ | 904 |
| $ | 996 |
Net Loss | |
| (76) | |
| (49) |
Diluted EPS ($) | |
| (2.14) | |
| (1.40) |
Adjusted Net Loss* | |
| (69) | |
| (35) |
Adjusted EPS ($)* | |
| (1.94) | |
| (1.01) |
EBITDA* | |
| 38 | |
| 29 |
Adjusted EBITDA* | |
| 45 | |
| 36 |
*For a reconciliation of EBITDA, Adjusted EBITDA, and Adjusted Net Loss, all of which are non-GAAP measures, to Net Loss, as well as a reconciliation of Free Cash Flow and Adjusted EPS, see Notes 2 and 3 to the financial statements included below.
WAYNE, Pa — May 8, 2024 — Trinseo (NYSE: TSE), a specialty material solutions provider, today reported its first quarter 2024 financial results. Sales volumes excluding styrene-related sales were the highest since the third quarter of 2022 and the first year-over-year increase since the first quarter of 2022. Net sales in the first quarter decreased 9% versus prior year. Lower price, from the pass-through of lower raw material costs and pressure from weak polystyrene and ABS market conditions, led to a 7% decrease, while lower sales volumes, primarily from lower styrene-related sales following the closure of the Terneuzen, the Netherlands styrene facility, led to a 3% decrease.
First quarter net loss of $76 million was $27 million below prior year, reflecting higher interest and income tax expenses. Adjusted EBITDA of $45 million was $9 million above prior year. Higher margins in the current year and fixed cost under absorption in the prior year, both primarily in Engineered Materials, were partially offset by lower equity affiliate income due to the planned turnaround at Americas Styrenics. First quarter results included a favorable impact of $13 million from net timing.
Commenting on the Company’s first quarter performance, Frank Bozich, President and Chief Executive Officer of Trinseo, said, “We were encouraged with how the first quarter progressed, as results improved steadily throughout the quarter. We believe destocking in some of our value chains has ended, as market tightness resulted in significant margin expansion in Engineered Materials and Americas Styrenics in March, and we see this continuing into the second quarter. While the first quarter working capital increase was expected, it was higher than what we’d attribute to seasonality due to significantly higher styrene costs. We believe this will reverse itself and release working capital in the third quarter.”
First Quarter Results and Commentary by Business Segment
Effective January 1, 2024, following the closure of the Terneuzen, the Netherlands styrene production facility, the Company will no longer report results under a Feedstocks reporting segment. Therefore, prior year results have been adjusted to show the historical results of the Feedstocks segment within the segments that consume styrene monomer in their end products; Latex Binders, Plastics Solutions and Polystyrene. This included styrene-related sales as well as styrene production profitability.
| ● | Engineered Materials net sales of $189 million for the quarter decreased 8% versus prior year including a 12% impact from lower price due to raw material pass-through, partially offset by a 3% impact from higher sales volume of PMMA resins and MMA. Adjusted EBITDA of $4 million, including an unfavorable net timing impact of $7 million, was $16 million above prior year primarily due to higher MMA-related margins, lower natural gas hedge losses, and fixed cost under absorption in the prior year. |
| ● | Latex Binders net sales of $241 million for the quarter decreased 3% versus prior year including a 7% impact from lower price from the pass-through of lower raw material costs, partially offset by a 3% impact from higher volumes in paper and board applications. Adjusted EBITDA of $26 million was $2 million above prior year due to slightly higher volume and margin. |
| ● | Plastics Solutions net sales of $266 million for the quarter were 12% below prior year including an 8% decrease from lower price due to weaker market conditions in ABS. Additionally, lower polycarbonate volumes resulted in a 4% decrease, which was partially offset by higher volume in PC compounds. Adjusted EBITDA of $23 million was $1 million below prior year as lower ABS margin was mostly offset by a favorable net timing variance from increasing styrene cost during the quarter. |
| ● | Polystyrene net sales of $208 million for the quarter were 14% below prior year including a 3% impact from lower price and an 11% impact from lower sales volume. Weak market conditions in Europe led to lower polystyrene prices and sales volume, and the closure of the styrene production facility in Terneuzen, the Netherlands led to lower styrene-related sales volume. Adjusted EBITDA of $13 million was $4 million above prior year as polystyrene price and margin pressure was more than offset by a favorable net timing variance as well as lower fixed costs following the closure of the Terneuzen styrene plant. |
| ● | Americas Styrenics Adjusted EBITDA of $6 million for the quarter was $12 million below prior year due to a planned turnaround at its largest styrene production facility in the current year. |
2024 Outlook
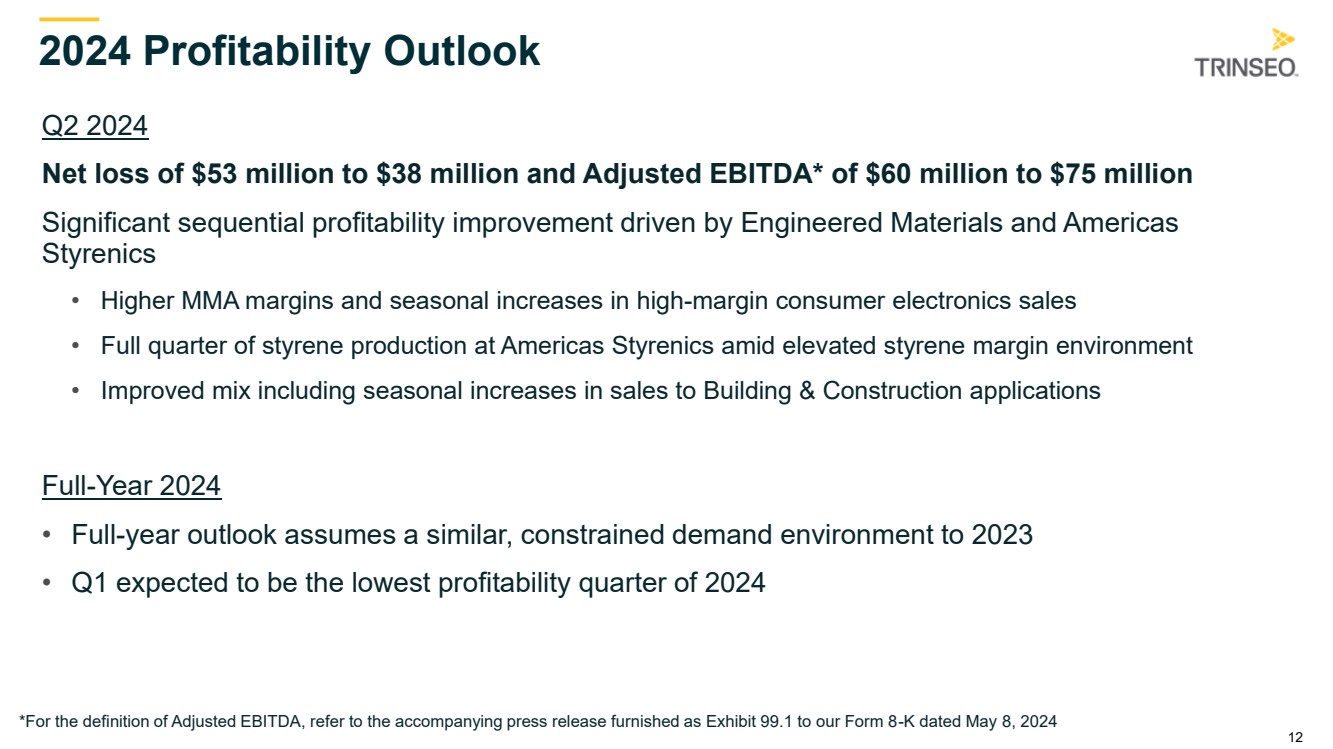
| ● | Second quarter 2024 net loss of $53 million to $38 million |
| ● | Second quarter 2024 Adjusted EBITDA of $60 million to $75 million |
Commenting on the second quarter outlook, Bozich said, “We are seeing the positive earnings momentum from the end of the first quarter continue into the second quarter, including similar sales and margin levels to start the quarter. I am confident in a significant sequential profitability improvement as the turnaround at Americas Styrenics is behind us, and as we enter the seasonally stronger period for many of our building and construction applications. Additionally, there has been continued tightness in the styrene and MMA markets that is supportive of continued higher margins. We also expect a sequential free cash flow improvement from higher profitability and moderating styrene prices.”
Bozich continued, “As expected, we are seeing the financial benefits of our asset and cost optimization actions that we implemented over the past 18 months, and we continue to evaluate additional actions including the potential closure of the Stade, Germany virgin polycarbonate plant. Finally, while we had more than adequate access to liquidity to end the quarter and we are seeing positive earnings momentum, liquidity preservation remains our top priority.”
Conference Call and Webcast Information
Trinseo will host a conference call to discuss its first quarter 2024 financial results on Thursday, May 9, 2024 at 10 a.m. Eastern Time.
Commenting on results will be Frank Bozich, President and Chief Executive Officer, David Stasse, Executive Vice President and Chief Financial Officer, and Andy Myers, Director of Investor Relations.
For those interested in asking questions during the Q&A session, please register using the following link:
| ● | Conference Call Registration |
For those interested in listening only, please register for the webcast using the following link:
| ● | Webcast Registration |
After registering for the conference call, you will receive a confirmation email with a meeting invitation and information for entry. Registration is open through the live call, but it is advised that you register in advance to ensure you are connected for the full call.
Trinseo has posted its first quarter 2024 financial results on the Company’s Investor Relations website. The presentation slides will also be made available in the webcast player prior to the conference call. The Company will also furnish copies of the financial results press release and presentation slides to investors by means of a Form 8-K filing with the U.S. Securities and Exchange Commission.
A replay of the conference call and transcript will be archived on the Company’s Investor Relations website shortly following the conference call. The replay will be available until May 9, 2025.
About Trinseo
Trinseo (NYSE: TSE), a specialty material solutions provider, partners with companies to bring ideas to life in an imaginative, smart and sustainably focused manner by combining its premier expertise, forward-looking innovations and best-in-class materials to unlock value for companies and consumers.
From design to manufacturing, Trinseo taps into decades of experience in diverse material solutions to address customers’ unique challenges in a wide range of industries, including building and construction, consumer goods, medical and mobility.
Trinseo’s approximately 3,100 employees bring endless creativity to reimagining the possibilities with clients all over the world from the company’s locations in North America, Europe and Asia Pacific. Trinseo reported net sales of approximately $3.7 billion in 2023. Discover more by visiting www.trinseo.com and connecting with Trinseo on LinkedIn, Twitter, Facebook and WeChat.
Use of non-GAAP measures
In addition to using standard measures of performance and liquidity that are recognized in accordance with accounting principles generally accepted in the United States of America (“GAAP”), we use additional measures of income excluding certain GAAP items (“non-GAAP measures”), such as Adjusted Net Income, EBITDA, Adjusted EBITDA and Adjusted EPS and measures of liquidity excluding certain GAAP items, such as Free Cash Flow. We believe these measures are useful for investors and management in evaluating business trends and performance each period. These measures are also used to manage our business and assess current period profitability, as well as to provide an appropriate basis to evaluate the effectiveness of our pricing strategies. Such measures are not recognized in accordance with GAAP and should not be viewed as an alternative to GAAP measures of performance or liquidity, as applicable. The definitions of each of these measures, further discussion of usefulness, and reconciliations of non-GAAP measures to GAAP measures are provided in the Notes to Condensed Consolidated Financial Information presented herein.
Cautionary Note on Forward-Looking Statements
This press release may contain forward-looking statements including, without limitation, statements concerning plans, objectives, goals, projections, forecasts, strategies, future events or performance, and underlying assumptions and other statements, which are not statements of historical facts or guarantees or assurances of future performance. Forward-looking statements may be identified by the use of words like “expect,” “anticipate,” “believe,” “intend,” “forecast,” “outlook,” “will,” “may,” “might,” “see,” “tend,” “assume,” “potential,” “likely,” “target,” “plan,” “contemplate,” “seek,” “attempt,” “should,” “could,” “would” or expressions of similar meaning. Forward-looking statements reflect management’s evaluation of information currently available and are based on our current expectations and assumptions regarding our business, the economy, our current indebtedness, and other future conditions. Because forward-looking statements relate to the future, they are subject to inherent uncertainties, risks and changes in circumstances that are difficult to predict. Factors that might cause future results to differ from those expressed by the forward-looking statements include, but are not limited to, our ability to successfully implement proposed restructuring initiatives and to successfully generate cost savings through restructuring and cost reduction initiatives; our ability to successfully execute our business and transformation strategy; increased costs or disruption in the supply of raw materials; deterioration of our credit profile limiting our access to
commercial credit;increased energy costs; compliance with laws and regulations impacting our business; any disruptions in production at our chemical manufacturing facilities, including those resulting from accidental spills or discharges; conditions in the global economy and capital markets; our current and future levels of indebtedness and ability to service our debt; our ability to meet the covenants under our existing indebtedness; our ability to generate cash flows from operations; and those discussed in our Annual Report on Form 10-K, under Part I, Item 1A —"Risk Factors" and elsewhere in our other reports, filings and furnishings made with the U.S. Securities and Exchange Commission from time to time. As a result of these or other factors, our actual results, performance or achievements may differ materially from those contemplated by the forward-looking statements. Therefore, we caution you against relying on any of these forward-looking statements. The forward-looking statements included in this press release are made only as of the date hereof. We undertake no obligation to publicly update or revise any forward-looking statement as a result of new information, future events or otherwise, except as otherwise required by law.
TRINSEO PLC
Condensed Consolidated Statements of Operations
(In millions, except per share data)
(Unaudited)
| | Three Months Ended | | ||||
| | March 31, | | ||||
|
| 2024 |
| 2023 |
| ||
Net sales |
| $ | 904.0 |
| $ | 996.3 |
|
Cost of sales | |
| 843.4 | |
| 959.1 | |
Gross profit | |
| 60.6 | |
| 37.2 | |
Selling, general and administrative expenses | |
| 70.1 | |
| 84.7 | |
Equity in earnings of unconsolidated affiliate | |
| 6.2 | |
| 17.6 | |
Impairment and other charges | | | — | | | 0.3 | |
Operating income (loss) | |
| (3.3) | |
| (30.2) | |
Interest expense, net | |
| 63.0 | |
| 38.3 | |
Other expense (income), net | | | 3.8 | | | (2.9) | |
Loss before income taxes | | | (70.1) | | | (65.6) | |
Provision for (benefit from) income taxes | | | 5.4 | | | (16.7) | |
Net loss | | $ | (75.5) | | $ | (48.9) | |
Weighted average shares- basic | | | 35.3 | | | 35.0 | |
Net loss per share- basic | | $ | (2.14) | | $ | (1.40) | |
Weighted average shares- diluted | |
| 35.3 | |
| 35.0 | |
Net loss per share- diluted | | $ | (2.14) | | $ | (1.40) | |
TRINSEO PLC
Condensed Consolidated Balance Sheets
(In millions)
(Unaudited)
| | March 31, | | December 31, | ||
|
| 2024 | | 2023 | ||
Assets |
| | | | |
|
Cash and cash equivalents | | $ | 166.4 | | $ | 259.1 |
Accounts receivable, net of allowance | |
| 556.5 | |
| 490.8 |
Inventories | |
| 431.2 | |
| 404.7 |
Other current assets | |
| 42.6 | |
| 39.5 |
Investments in unconsolidated affiliate | |
| 258.4 | |
| 252.2 |
Property, plant, equipment, goodwill, and other intangible assets, net | |
| 1,354.8 | | | 1,401.4 |
Right-of-use assets - operating, net | | | 60.7 | | | 65.3 |
Other long-term assets | |
| 118.8 | |
| 116.2 |
Total assets | | $ | 2,989.4 | | $ | 3,029.2 |
Liabilities and shareholders’ equity | | | | | | |
Current liabilities | | | 732.0 | | | 672.6 |
Long-term debt, net of unamortized deferred financing fees | |
| 2,276.7 | |
| 2,277.6 |
Noncurrent lease liabilities - operating | | | 47.5 | | | 51.7 |
Other noncurrent obligations | |
| 281.2 | |
| 295.3 |
Shareholders’ equity | | | (348.0) | | | (268.0) |
Total liabilities and shareholders’ equity | | $ | 2,989.4 | | $ | 3,029.2 |
TRINSEO PLC
Condensed Consolidated Statements of Cash Flows
(In millions)
(Unaudited)
| | Three Months Ended | ||||
| | March 31, | ||||
|
| 2024 |
| 2023 | ||
Cash flows from operating activities |
| |
|
| |
|
Cash provided by (used in) operating activities | | $ | (66.2) | | $ | 45.4 |
| | | | | | |
Cash flows from investing activities | | | | | | |
Capital expenditures | |
| (15.7) | |
| (21.8) |
Proceeds from the sale of businesses and other assets | |
| 4.7 | |
| — |
Cash used in investing activities | |
| (11.0) | |
| (21.8) |
| | | | | | |
Cash flows from financing activities | | | | | | |
Deferred financing fees | |
| 0.4 | |
| — |
Short-term borrowings, net | |
| (3.7) | |
| (2.7) |
Dividends paid | | | (0.6) | | | (11.8) |
Proceeds from exercise of option awards | | | — | | | 0.1 |
Withholding taxes paid on restricted share units | | | — | | | (1.3) |
Acquisition-related contingent consideration payment | | | (0.7) | | | (1.2) |
Repurchases and repayments of long-term debt | | | (4.6) | | | (3.6) |
Proceeds from Accounts Receivable Securitization Facility | |
| 30.0 | |
| — |
Repayments of Accounts Receivable Securitization Facility | |
| (30.0) | |
| — |
Cash used in by financing activities | |
| (9.2) | |
| (20.5) |
Effect of exchange rates on cash | |
| (3.2) | |
| 2.3 |
Net change in cash, cash equivalents, and restricted cash | |
| (89.6) | |
| 5.4 |
Cash, cash equivalents, and restricted cash—beginning of period | |
| 261.1 | |
| 211.7 |
Cash, cash equivalents, and restricted cash—end of period | | $ | 171.5 | | $ | 217.1 |
Less: Restricted cash | | | 5.1 | | | — |
Cash and cash equivalents—end of period | | $ | 166.4 | | $ | 217.1 |
TRINSEO PLC
Notes to Condensed Consolidated Financial Information
(Unaudited)
Note 1: Net Sales by Segment
| | Three Months Ended | ||||
| | March 31, | ||||
(In millions) | | 2024 |
| 2023 | ||
Engineered Materials |
| $ | 189.2 |
| $ | 206.2 |
Latex Binders | |
| 241.5 | |
| 249.0 |
Plastics Solutions | | | 265.7 | | | 300.3 |
Polystyrene | |
| 207.6 | |
| 240.8 |
Americas Styrenics* | |
| — | |
| — |
Total Net Sales | | $ | 904.0 | | $ | 996.3 |
* The results of this segment are comprised entirely of earnings from Americas Styrenics, our 50%-owned equity method investment. As such, we do not separately report net sales of Americas Styrenics within our condensed consolidated statements of operations.
Note 2: Reconciliation of Non-GAAP Performance Measures to Net Income
EBITDA is a non-GAAP financial performance measure, which is defined as income from continuing operations before interest expense, net; income tax provision; depreciation and amortization expense. We refer to EBITDA in making operating decisions because we believe it provides our management as well as our investors with meaningful information regarding the Company’s operational performance. We believe the use of EBITDA as a metric assists our board of directors, management and investors in comparing our operating performance on a consistent basis.
We also present Adjusted EBITDA as a non-GAAP financial performance measure, which we define as income from continuing operations before interest expense, net; income tax provision; depreciation and amortization expense; loss on extinguishment of long-term debt; asset impairment charges; gains or losses on the dispositions of businesses and assets; restructuring charges; acquisition related costs and benefits, and other items. In doing so, we are providing management, investors, and credit rating agencies with an indicator of our ongoing performance and business trends, removing the impact of transactions and events that we would not consider a part of our core operations.
Lastly, we present Adjusted Net Income (Loss) and Adjusted EPS as additional performance measures. Adjusted Net Income (Loss) is calculated as Adjusted EBITDA (defined beginning with net income from continuing operations, above), less interest expense, less the provision for income taxes and depreciation and amortization, tax affected for various discrete items, as appropriate. Adjusted EPS is calculated as Adjusted Net Income (Loss) per weighted average diluted shares outstanding for a given period. We believe that Adjusted Net Income (Loss) and Adjusted EPS provide transparent and useful information to management, investors, analysts and other stakeholders in evaluating and assessing our operating results from period-to-period after removing the impact of certain transactions and activities that affect comparability and that are not considered part of our core operations.
There are limitations to using the financial performance measures noted above. These performance measures are not intended to represent net income or other measures of financial performance. As such, they should not be used as alternatives to net income as indicators of operating performance. Other companies in our industry may define these performance measures differently than we do. As a result, it may be difficult to use these or similarly-named financial measures that other companies may use, to compare the performance of those companies to our performance. We compensate for these limitations by providing reconciliations of these performance measures to our net income, which is determined in accordance with GAAP.
| | Three Months Ended | | | ||||
| | March 31, | | | ||||
(In millions, except per share data) |
| 2024 |
| 2023 | | | ||
Net loss | | $ | (75.5) |
| $ | (48.9) | | |
Interest expense, net | |
| 63.0 | |
| 38.3 | | |
Provision for (benefit from) income taxes | |
| 5.4 | |
| (16.7) | | |
Depreciation and amortization | |
| 45.0 | |
| 56.0 | | |
EBITDA | | $ | 37.9 | | $ | 28.7 | | |
Net gain on disposition of businesses and assets | |
| (3.6) | |
| — | | Selling, general, and administrative expenses |
Restructuring and other charges (a) | |
| 9.4 | |
| 3.7 | | Selling, general, and administrative expenses |
Asset impairment charges or write-offs | | | — | | | 0.3 | | Impairment and other charges |
Other items (b) | |
| 1.3 | |
| 3.6 | | Selling, general, and administrative expenses; Other expense (income), net |
Adjusted EBITDA | | $ | 45.0 | | $ | 36.3 | | |
Adjusted EBITDA to Adjusted Net Loss: | | | | | | | | |
Adjusted EBITDA | | | 45.0 | | | 36.3 | | |
Interest expense, net | | | 63.0 | | | 38.3 | | |
Provision for (benefit from) income taxes - Adjusted (c) | | | 4.2 | | | (20.0) | | |
Depreciation and amortization - Adjusted (d) | | | 46.3 | | | 53.3 | | |
Adjusted Net Loss | | $ | (68.5) | | $ | (35.3) | | |
Weighted average shares- diluted | | | 35.3 | | | 35.0 | | |
Adjusted EPS | | $ | (1.94) | | $ | (1.01) | | |
| | | | | | | | |
Adjusted EBITDA by Segment: | | | | | | | | |
Engineered Materials | | $ | 4.3 | | $ | (11.7) | | |
Latex Binders | | | 25.7 | | | 24.0 | | |
Plastics Solutions | | | 22.7 | | | 23.6 | | |
Polystyrene | | | 12.6 | | | 8.9 | | |
Americas Styrenics | | | 6.1 | | | 17.6 | | |
Corporate Unallocated | | | (26.4) | | | (26.1) | | |
Adjusted EBITDA | | $ | 45.0 | | $ | 36.3 | | |
| (a) | Restructuring and other charges for the 2024 period primarily relates to contract termination costs as well as decommissioning and other charges incurred in connection with the Company’s asset optimization and corporate restructuring plan. Restructuring and other charges for the 2023 period primarily relates to contract termination costs as well as decommissioning and other charges incurred in connection with the Company’s asset restructuring plan. |
| (b) | Other items for the 2024 and 2023 periods primarily relate to fees incurred in conjunction with certain of the Company’s strategic initiatives, as well as costs related to our transition to a new enterprise resource planning system. |
| (c) | Adjusted to remove the tax impact of the items noted within the table above. The income tax expense (benefit) related to these items was determined utilizing either (1) the estimated annual effective tax rate on our ordinary income based upon our forecasted ordinary income for the full year or, (2) for items treated discretely for tax purposes we utilized the applicable rates in the taxing jurisdictions in which these adjustments occurred. |
| (d) | Amounts for the three months ended March 31, 2024 and 2023 excludes accelerated depreciation of $1.3 million and $2.7 million, respectively. The 2024 period charges are primarily related to the shortening of the useful life of certain assets related to the asset optimization and corporate restructuring plan. The 2023 period charges are primarily related to the shortening of the useful life of certain assets related to the asset restructuring plan as well as charges related to the shortening of the useful life of certain IT assets related to the Company’s transition to a new enterprise resource planning system. |
For the same reasons discussed above, we are providing the following reconciliation of forecasted net loss to forecasted Adjusted EBITDA, Adjusted Net Loss and Adjusted EPS for the three months ended June 30, 2024. See “Note on Forward-Looking Statements” above for a discussion of the limitations of these forecasts. Totals may not sum due to rounding.
| | | Three Months Ended |
| | | June 30, |
(In millions, except per share data) | | | 2024 |
Adjusted EBITDA |
| $ | 60 - 75 |
Interest expense, net | |
| 63 |
Provision for income taxes | |
| 4 |
Depreciation and amortization | |
| 46 |
Reconciling items to Adjusted EBITDA (e) | |
| — |
Net Loss from continuing operations | |
| (53) - (38) |
Reconciling items to Adjusted Net Loss (e) | |
| — |
Adjusted Net Loss | | $ | (53) - (38) |
| | | |
Weighted average shares - diluted (f) | | | 35.3 |
EPS from continuing operations - diluted ($) | | $ | (1.50) - (1.08) |
Adjusted EPS ($) | | $ | (1.50) - (1.08) |
| (e) | Reconciling items to Adjusted EBITDA and Adjusted Net Income (Loss) are not typically forecasted by the Company based on their nature as being primarily driven by transactions that are not part of the core operations of the business and, as a result, cannot be estimated without unreasonable cost or uncertainty. As such, for the forecasted second quarter ended June 30, 2024, we have not included estimates for these items. |
| (f) | Weighted average shares presented for the purpose of forecasting EPS and Adjusted EPS assume that the Company will be in a net loss position for second quarter 2024, and therefore excludes the impact of potentially dilutive shares, as the inclusion of said shares would have an anti-dilutive effect. Further, the weighted average shares presented do not forecast significant future share transactions or events, such as repurchases, significant share-based compensation award grants, and changes in the Company’s share price. These are all factors which could have a significant impact on the calculation of EPS and Adjusted EPS during actual future periods. |
Note 3: Reconciliation of Non-GAAP Liquidity Measures to Cash from Operations
The Company uses certain measures, such as Free Cash Flow as non-GAAP measures, to evaluate and discuss its liquidity position and results. Free Cash Flow is defined as cash from operating activities, less capital expenditures. We believe that Free Cash Flow provides an indicator of the Company’s ongoing ability to generate cash through core operations, as it excludes the cash impacts of various financing transactions as well as cash flows from business combinations that are not considered organic in nature. We also believe that Free Cash Flow provides management and investors with useful analytical indicators of our ability to service our indebtedness, pay dividends (when declared), and meet our ongoing cash obligations.
Free Cash Flow is not intended to represent cash flows from operations as defined by GAAP, and therefore, should not be used as alternatives for that measure. Other companies in our industry may define Free Cash Flow differently than we do. As a result, it may be difficult to use this or similarly-named financial measures that other companies may use, to compare the liquidity and cash generation of those companies to our own. The Company compensates for these limitations by providing the following detail, which is determined in accordance with GAAP.
Free Cash Flow
| | Three Months Ended | ||||
| | March 31, | ||||
(In millions) | | 2024 | | 2023 | ||
Cash provided by (used in) operating activities |
| $ | (66.2) |
| $ | 45.4 |
Capital expenditures | |
| (15.7) | |
| (21.8) |
Free Cash Flow | | $ | (81.9) | | $ | 23.6 |
| ™ 1 Trademark of Trinseo PLC or its affiliates First Quarter 2024 Financial Results & Second Quarter Outlook May 8, 2024 |
| 2 Introductions & Disclosure Rules Introductions • Frank Bozich, President & CEO • David Stasse, Executive Vice President & CFO • Andy Myers, Vice President of Investor Relations Disclosure Rules This presentation may contain forward-looking statements including, without limitation, statements concerning plans, objectives, goals, projections, forecasts, strategies, future events or performance, and underlying assumptions and other statements, which are not statements of historical facts or guarantees or assurances of future performance. Forward-looking statements may be identified by the use of words like “expect,” “anticipate,” “believe,” “intend,” “forecast,” “outlook,” “will,” “may,” “might,” “see,” “tend,” “assume,” “potential,” “likely,” “target,” “plan,” “contemplate,” “seek,” “attempt,” “should,” “could,” “would” or expressions of similar meaning. Forward-looking statements reflect management’s evaluation of information currently available and are based on our current expectations and assumptions regarding our business, the economy, our current indebtedness, and other future conditions. Because forward-looking statements relate to the future, they are subject to inherent uncertainties, risks and changes in circumstances that are difficult to predict. Factors that might cause future results to differ from those expressed by the forward-looking statements include, but are not limited to, our ability to successfully implement proposed restructuring initiatives and to successfully generate cost savings through restructuring and cost reduction initiatives; our ability to successfully execute our business and transformation strategy; increased costs or disruption in the supply of raw materials; deterioration of our credit profile limiting our access to commercial credit;increased energy costs; compliance with laws and regulations impacting our business; any disruptions in production at our chemical manufacturing facilities, including those resulting from accidental spills or discharges; conditions in the global economy and capital markets; our current and future levels of indebtedness and ability to service our debt; our ability to meet the covenants under our existing indebtedness; our ability to generate cash flows from operations; and those discussed in our Annual Report on Form 10-K, under Part I, Item 1A —"Risk Factors" and elsewhere in our other reports, filings and furnishings made with the U.S. Securities and Exchange Commission from time to time. As a result of these or other factors, our actual results, performance or achievements may differ materially from those contemplated by the forward-looking statements. Therefore, we caution you against relying on any of these forward-looking statements. The forward-looking statements included in this press release are made only as of the date hereof. We undertake no obligation to publicly update or revise any forward-looking statement as a result of new information, future events or otherwise, except as otherwise required by law. This presentation contains financial measures that are not in accordance with generally accepted accounting principles in the US (“GAAP”) including EBITDA, Adjusted EBITDA, Adjusted Net Income, Adjusted EPS and Free Cash Flow. We believe these measures provide relevant and meaningful information to investors and lenders about the ongoing operating results and liquidity position of the Company. Such measures when referenced herein should not be viewed as an alternative to GAAP measures of performance or liquidity, as applicable. We have provided a reconciliation of these measures to the most comparable GAAP metric alongside of the respective measure or otherwise in the Appendix section and in the accompanying press release. |
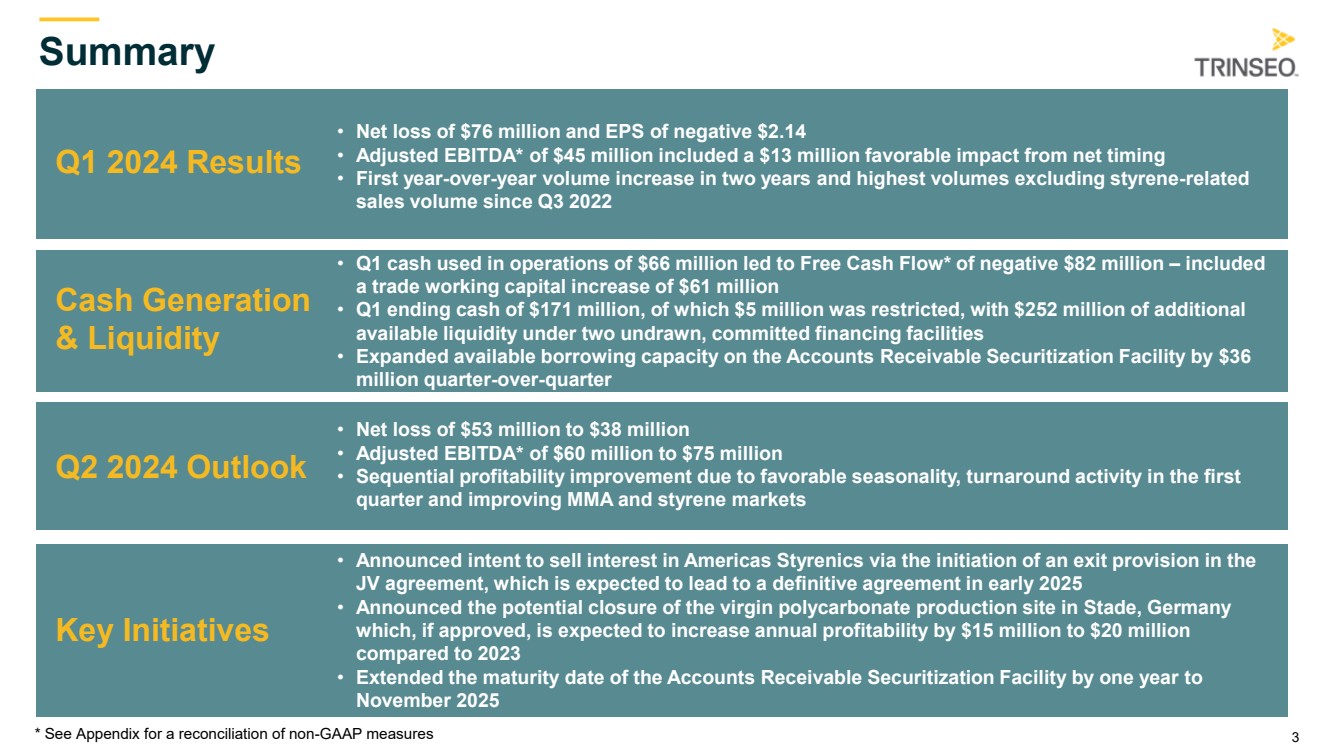
| 3 Summary Q1 2024 Results • Net loss of $76 million and EPS of negative $2.14 • Adjusted EBITDA* of $45 million included a $13 million favorable impact from net timing • First year-over-year volume increase in two years and highest volumes excluding styrene-related sales volume since Q3 2022 * See Appendix for a reconciliation of non-GAAP measures Cash Generation & Liquidity • Q1 cash used in operations of $66 million led to Free Cash Flow* of negative $82 million – included a trade working capital increase of $61 million • Q1 ending cash of $171 million, of which $5 million was restricted, with $252 million of additional available liquidity under two undrawn, committed financing facilities • Expanded available borrowing capacity on the Accounts Receivable Securitization Facility by $36 million quarter-over-quarter Q2 2024 Outlook • Net loss of $53 million to $38 million • Adjusted EBITDA* of $60 million to $75 million • Sequential profitability improvement due to favorable seasonality, turnaround activity in the first quarter and improving MMA and styrene markets Key Initiatives • Announced intent to sell interest in Americas Styrenics via the initiation of an exit provision in the JV agreement, which is expected to lead to a definitive agreement in early 2025 • Announced the potential closure of the virgin polycarbonate production site in Stade, Germany which, if approved, is expected to increase annual profitability by $15 million to $20 million compared to 2023 • Extended the maturity date of the Accounts Receivable Securitization Facility by one year to November 2025 |
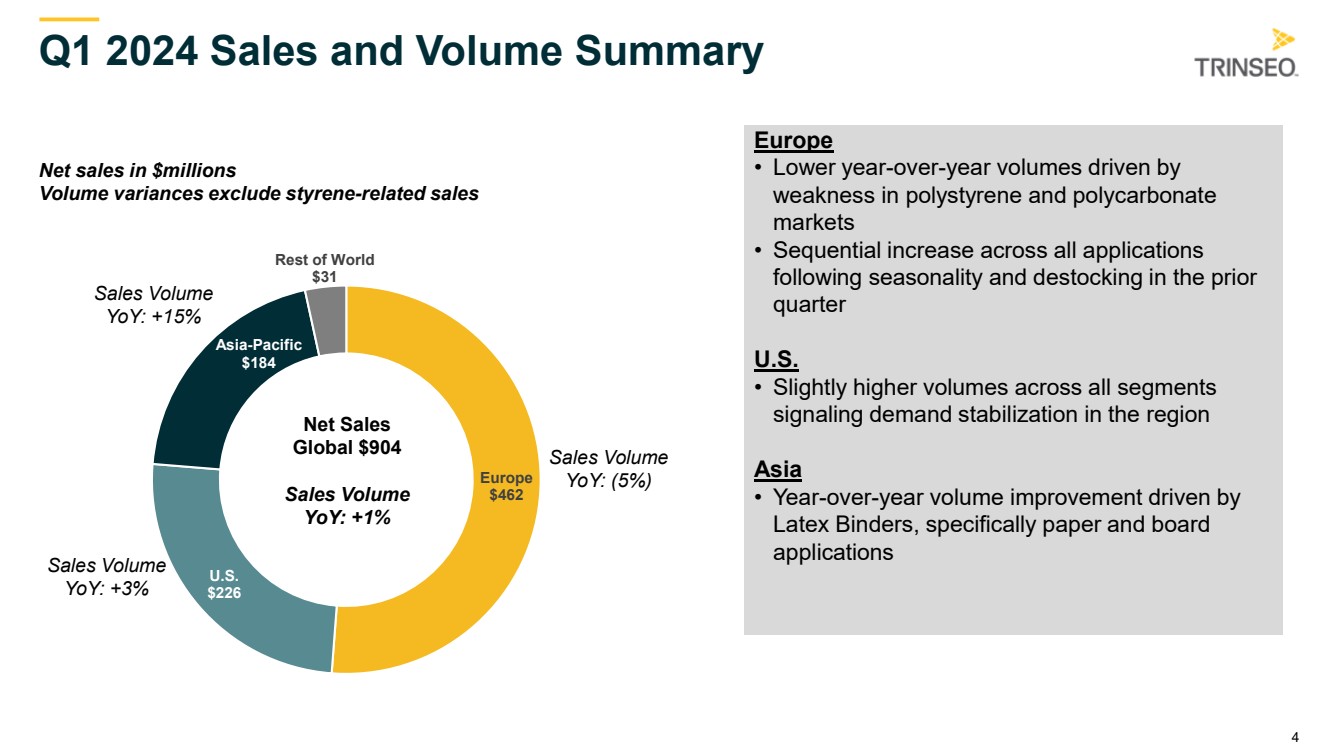
| 4 Europe $462 U.S. $226 Asia-Pacific $184 Rest of World $31 Q1 2024 Sales and Volume Summary Net sales in $millions Volume variances exclude styrene-related sales Europe • Lower year-over-year volumes driven by weakness in polystyrene and polycarbonate markets • Sequential increase across all applications following seasonality and destocking in the prior quarter U.S. • Slightly higher volumes across all segments signaling demand stabilization in the region Asia • Year-over-year volume improvement driven by Latex Binders, specifically paper and board applications Net Sales Global $904 Sales Volume YoY: +1% Sales Volume YoY: (5%) Sales Volume YoY: +15% Sales Volume YoY: +3% |
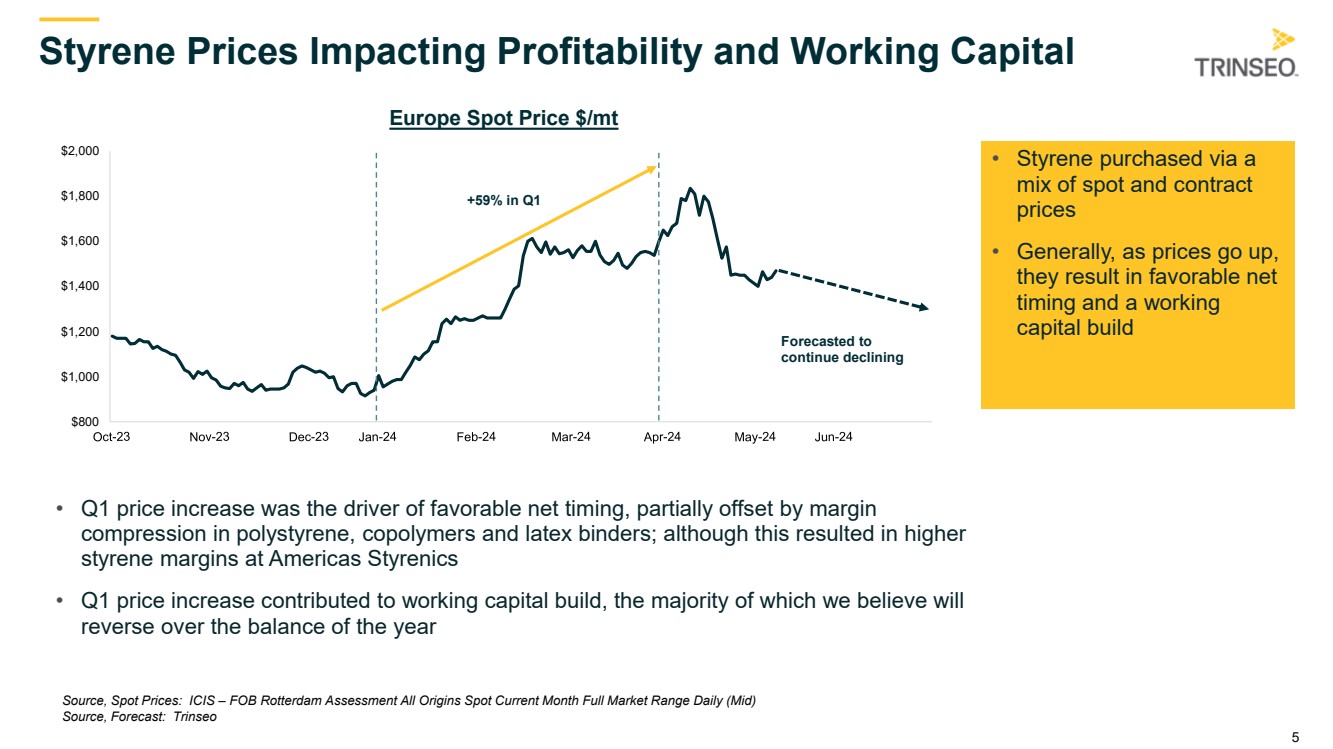
| 5 Styrene Prices Impacting Profitability and Working Capital Europe Spot Price $/mt • Q1 price increase was the driver of favorable net timing, partially offset by margin compression in polystyrene, copolymers and latex binders; although this resulted in higher styrene margins at Americas Styrenics • Q1 price increase contributed to working capital build, the majority of which we believe will reverse over the balance of the year Source, Spot Prices: ICIS – FOB Rotterdam Assessment All Origins Spot Current Month Full Market Range Daily (Mid) Source, Forecast: Trinseo $800 $1,000 $1,200 $1,400 $1,600 $1,800 $2,000 +59% in Q1 Forecasted to continue declining • Styrene purchased via a mix of spot and contract prices • Generally, as prices go up, they result in favorable net timing and a working capital build |
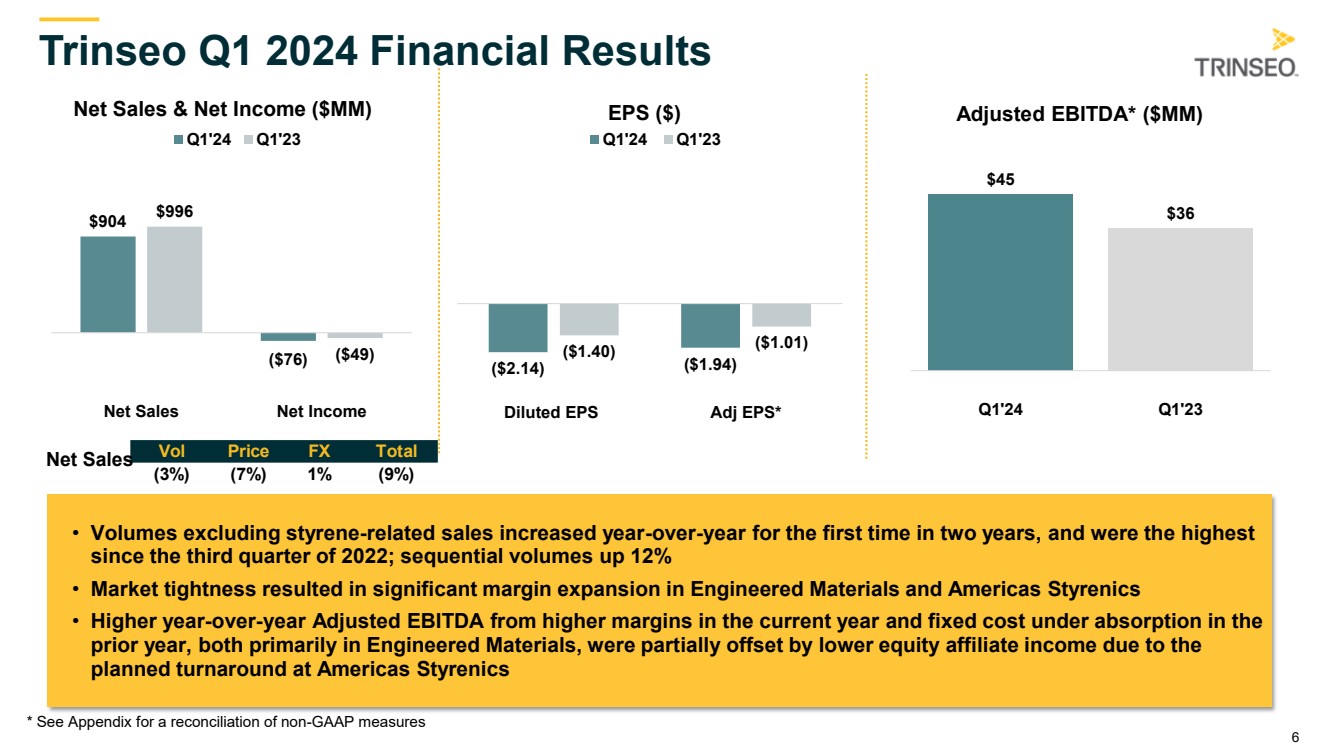
| 6 Trinseo Q1 2024 Financial Results $904 ($76) $996 ($49) Net Sales Net Income Net Sales & Net Income ($MM) Q1'24 Q1'23 ($2.14) ($1.94) ($1.40) ($1.01) Diluted EPS Adj EPS* EPS ($) Q1'24 Q1'23 $45 $36 Q1'24 Q1'23 Adjusted EBITDA* ($MM) Vol Price FX Total (3%) (7%) 1% (9%) Net Sales • Volumes excluding styrene-related sales increased year-over-year for the first time in two years, and were the highest since the third quarter of 2022; sequential volumes up 12% • Market tightness resulted in significant margin expansion in Engineered Materials and Americas Styrenics • Higher year-over-year Adjusted EBITDA from higher margins in the current year and fixed cost under absorption in the prior year, both primarily in Engineered Materials, were partially offset by lower equity affiliate income due to the planned turnaround at Americas Styrenics * See Appendix for a reconciliation of non-GAAP measures |
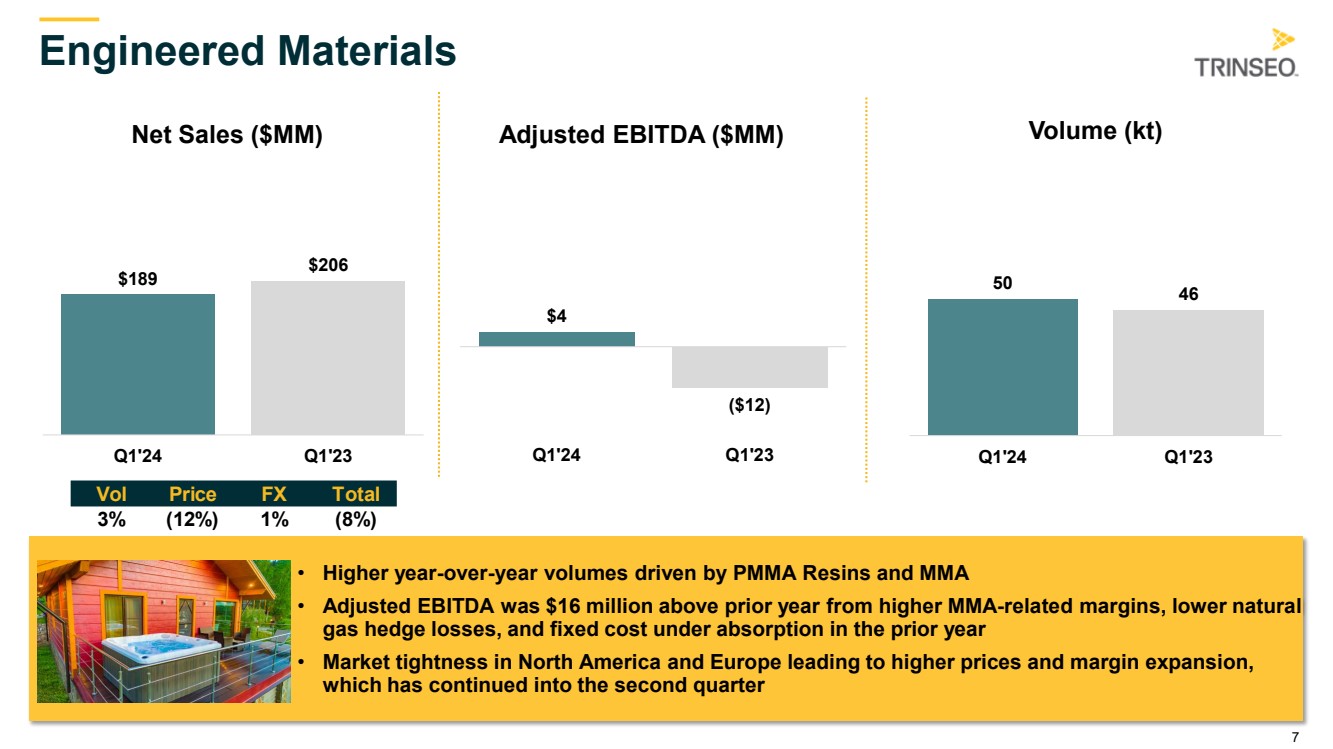
| 7 Engineered Materials • Higher year-over-year volumes driven by PMMA Resins and MMA • Adjusted EBITDA was $16 million above prior year from higher MMA-related margins, lower natural gas hedge losses, and fixed cost under absorption in the prior year • Market tightness in North America and Europe leading to higher prices and margin expansion, which has continued into the second quarter $189 $206 Q1'24 Q1'23 Net Sales ($MM) Vol Price FX Total 3% (12%) 1% (8%) $4 ($12) Q1'24 Q1'23 Adjusted EBITDA ($MM) 50 46 Q1'24 Q1'23 Volume (kt) |
| 8 • Higher year-over-year volumes in paper & board applications, primarily in Asia Pacific • Adjusted EBITDA was $2 million above prior year due to slightly higher volume and margin • Continued focus on CASE applications to improve portfolio; expect mid to high-single digit growth in 2024 Latex Binders $241 $249 Q1'24 Q1'23 Net Sales ($MM) $26 $24 Q1'24 Q1'23 Adjusted EBITDA ($MM) 119 112 Q1'24 Q1'23 Volume* (kt) Vol Price FX Total 3% (7%) 1% (3%) *Volumes exclude styrene-related sales |
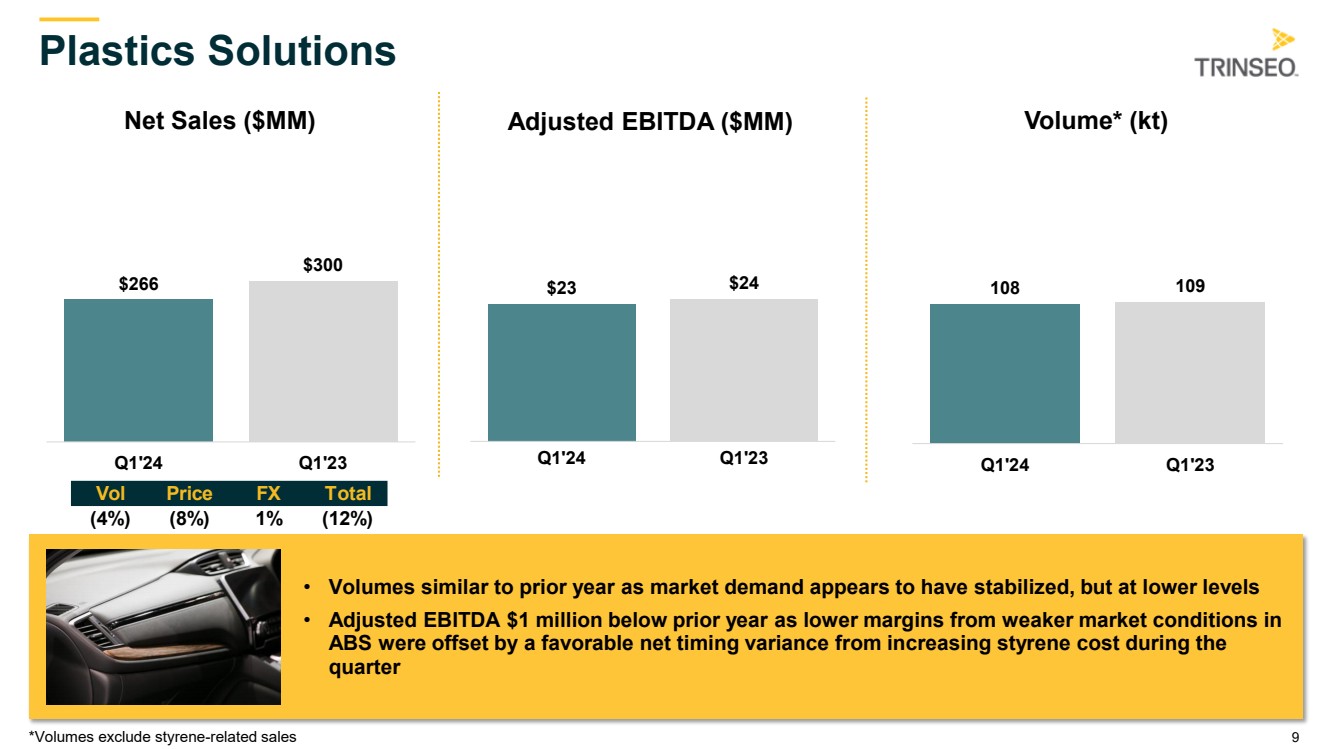
| 9 Plastics Solutions • Volumes similar to prior year as market demand appears to have stabilized, but at lower levels • Adjusted EBITDA $1 million below prior year as lower margins from weaker market conditions in ABS were offset by a favorable net timing variance from increasing styrene cost during the quarter $266 $300 Q1'24 Q1'23 Net Sales ($MM) $23 $24 Q1'24 Q1'23 Adjusted EBITDA ($MM) 108 109 Q1'24 Q1'23 Volume* (kt) Vol Price FX Total (4%) (8%) 1% (12%) *Volumes exclude styrene-related sales |
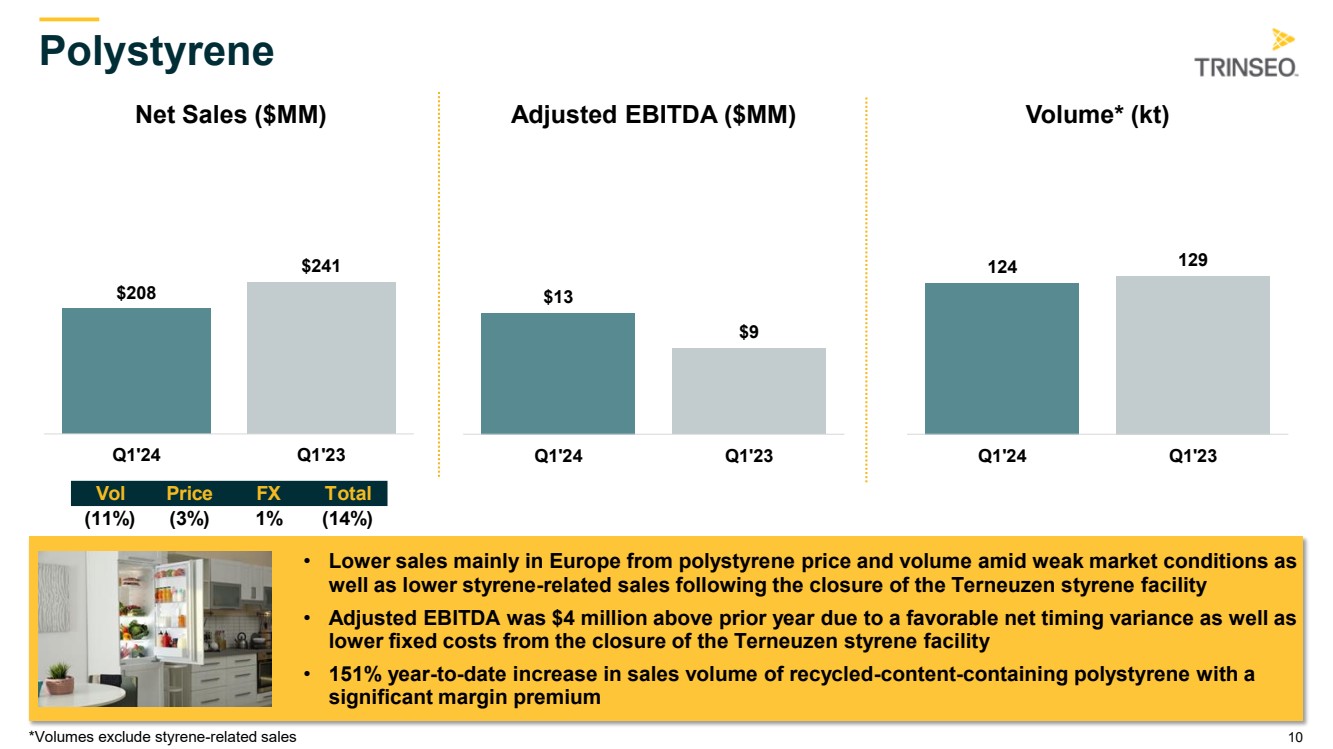
| 10 Polystyrene • Lower sales mainly in Europe from polystyrene price and volume amid weak market conditions as well as lower styrene-related sales following the closure of the Terneuzen styrene facility • Adjusted EBITDA was $4 million above prior year due to a favorable net timing variance as well as lower fixed costs from the closure of the Terneuzen styrene facility • 151% year-to-date increase in sales volume of recycled-content-containing polystyrene with a significant margin premium $208 $241 Q1'24 Q1'23 Net Sales ($MM) $13 $9 Q1'24 Q1'23 Adjusted EBITDA ($MM) 124 129 Q1'24 Q1'23 Volume* (kt) Vol Price FX Total (11%) (3%) 1% (14%) *Volumes exclude styrene-related sales |
| 11 $115 $1,772 $447 2024 2025 Senior Notes 2026 2027 2028 Term Loans 2029 Senior Notes $171 $150 $102 Debt and Liquidity Overview (as of March 31, 2024) Debt Maturity Schedule ($millions) May April Cash and Borrowing Facilities ($millions)* Revolving Credit Facility AR Securitization Cash** $423MM Combined Cash and Availability under Committed Facilities *2026 Revolving Credit Facility available funds of $101.7 million (net of $10.8 million outstanding letters of credit), as well as the Accounts Receivable Securitization Facility with borrowing capacity of $150 million. **Included restricted cash of $5.1 million September |
| 12 2024 Profitability Outlook *For the definition of Adjusted EBITDA, refer to the accompanying press release furnished as Exhibit 99.1 to our Form 8-K dated May 8, 2024 Q2 2024 Net loss of $53 million to $38 million and Adjusted EBITDA* of $60 million to $75 million Significant sequential profitability improvement driven by Engineered Materials and Americas Styrenics • Higher MMA margins and seasonal increases in high-margin consumer electronics sales • Full quarter of styrene production at Americas Styrenics amid elevated styrene margin environment • Improved mix including seasonal increases in sales to Building & Construction applications Full-Year 2024 • Full-year outlook assumes a similar, constrained demand environment to 2023 • Q1 expected to be the lowest profitability quarter of 2024 |
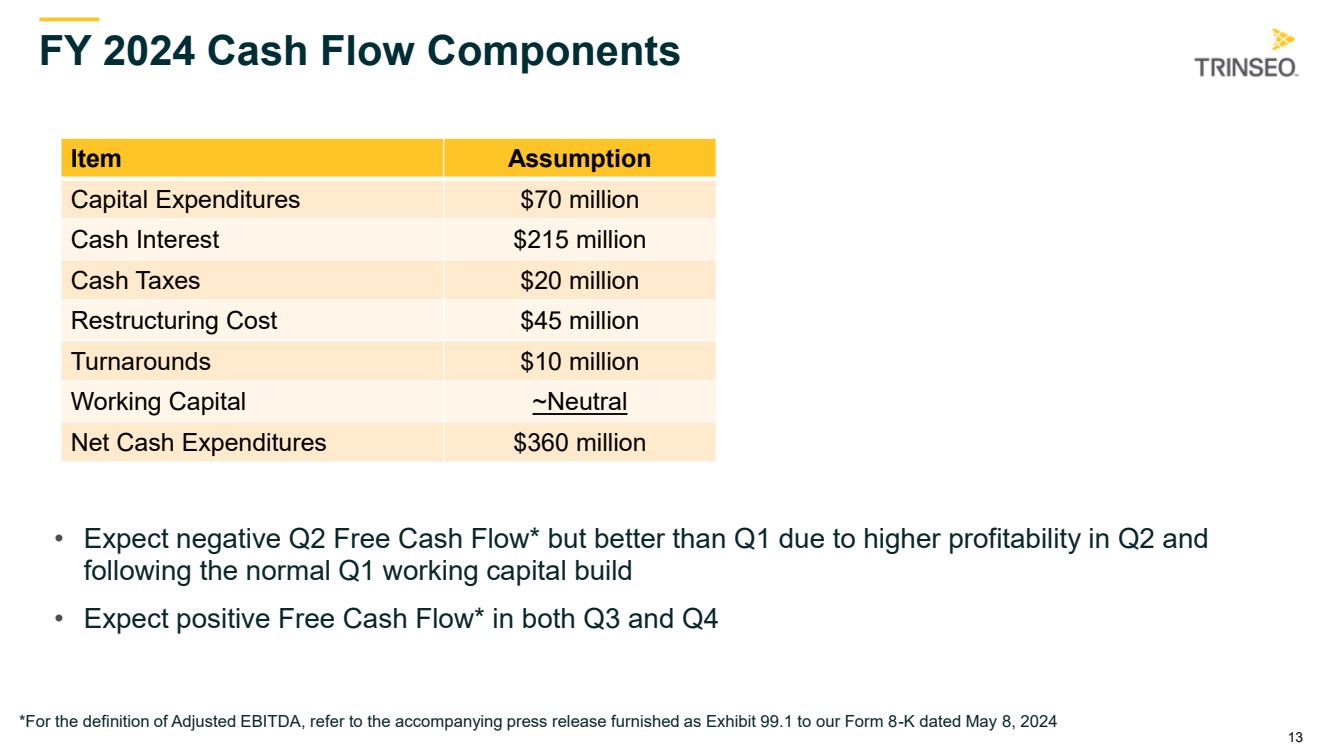
| 13 FY 2024 Cash Flow Components Item Assumption Capital Expenditures $70 million Cash Interest $215 million Cash Taxes $20 million Restructuring Cost $45 million Turnarounds $10 million Working Capital ~Neutral Net Cash Expenditures $360 million • Expect negative Q2 Free Cash Flow* but better than Q1 due to higher profitability in Q2 and following the normal Q1 working capital build • Expect positive Free Cash Flow* in both Q3 and Q4 *For the definition of Adjusted EBITDA, refer to the accompanying press release furnished as Exhibit 99.1 to our Form 8-K dated May 8, 2024 |
| 14 Appendix |
| 15 Segment Information (in $millions, unless noted) Q1'22 Q2'22 Q3'22 Q4'22 Q1'23 Q2'23 Q3'23 Q4'23 Q1'24 2022 2023 Engineered Materials 60 60 50 41 46 50 47 51 50 212 194 Latex Binders 132 138 132 117 112 117 112 106 119 520 447 Plastics Solutions 134 120 100 102 109 105 100 96 108 457 409 Polystyrene 165 141 124 134 129 122 118 107 124 564 475 Trade Volume* (kt) 493 460 407 394 396 393 377 359 402 1,753 1,525 Engineered Materials 295 301 243 205 206 206 186 190 189 1,044 789 Latex Binders 309 360 343 255 249 255 224 215 241 1,267 943 Plastics Solutions 418 380 305 278 300 282 259 240 266 1,382 1,081 Polystyrene 364 384 287 237 241 220 210 192 208 1,272 863 Net Sales 1,387 1,426 1,178 975 996 963 879 837 904 4,966 3,675 Engineered Materials 35 34 8 (5) (12) 12 5 (0) 4 72 5 Latex Binders 31 32 14 16 24 23 18 18 26 93 83 Plastics Solutions 71 49 (32) (12) 24 24 17 16 23 76 81 Polystyrene 45 32 (25) 4 9 2 (1) 0 13 56 10 Americas Styrenics 22 39 23 18 18 13 19 13 6 102 62 Corporate (27) (21) (24) (16) (26) (17) (17) (27) (26) (88) (87) Adjusted EBITDA** 178 164 (37) 6 36 57 41 20 45 312 154 Adj EBITDA Variance Analysis Net Timing** Impacts - Fav/(Unfav) Engineered Materials (0) 0 (1) (3) (7) (9) (6) 5 (7) (3) (17) Latex Binders 6 1 1 (3) 1 (1) (1) 0 2 5 (1) Plastics Solutions 15 14 (8) (4) (1) (2) 0 1 9 17 (1) Polystyrene 10 17 (16) (9) 5 (4) 3 (5) 9 2 (1) Net Timing*** Impacts - Fav/(Unfav) 32 33 (24) (19) (2) (16) (4) 1 13 21 (20) *Trade volume excludes styrene-related sales **See this Appendix for a reconciliation of non-GAAP measures ***Net Timing is the difference between Raw Material Timing and Price Lag. Raw Material Timing represents the timing of raw material cost changes flowing through cost of goods sold versus current pricing. Price Lag represents the difference in revenue between the current contractual price and the current period price. |
| 16 (in $millions, unless noted) Q1'22 Q2'22 Q3'22 Q4'22 Q1'23 Q2'23 Q3'23 Q4'23 Q1'24 2022 2023 Engineered Materials 60 60 50 41 46 50 47 51 50 212 194 Latex Binders 132 138 132 117 112 117 112 106 119 520 447 Plastics Solutions 134 120 100 102 109 105 100 96 108 457 409 Polystyrene 165 141 124 134 129 122 118 107 124 564 475 Trade Volume* (kt) 493 460 407 394 396 393 377 359 402 1,753 1,525 Engineered Materials 295 301 243 205 206 206 186 190 189 1,044 789 Latex Binders 307 354 341 255 248 254 222 215 241 1,256 939 Plastics Solutions 396 362 293 271 290 272 246 231 266 1,323 1,038 Polystyrene 318 312 248 216 209 193 175 166 208 1,093 743 Feedstocks 70 97 53 28 43 37 50 35 - 249 166 Net Sales 1,387 1,426 1,178 975 996 963 879 837 904 4,966 3,675 Engineered Materials 35 34 8 (5) (12) 12 5 (0) 4 72 5 Latex Binders 30 29 31 20 26 25 23 19 26 111 93 Plastics Solutions 69 46 (15) (9) 26 25 22 16 23 91 89 Polystyrene 45 23 19 12 16 6 9 2 13 99 33 Feedstocks 4 14 (78) (16) (11) (7) (19) (4) - (75) (41) Americas Styrenics 22 39 23 18 18 13 19 13 6 102 62 Corporate (27) (21) (24) (16) (26) (17) (17) (27) (26) (88) (87) Adjusted EBITDA** 178 164 (37) 6 36 57 41 20 45 312 154 Adj EBITDA Variance Analysis Net Timing** Impacts - Fav/(Unfav) Engineered Materials (0) 0 (1) (3) (7) (9) (6) 5 (7) (3) (17) Latex Binders 3 (3) 7 (1) (0) (0) (2) 1 2 6 (1) Plastics Solutions 11 10 (1) (2) (2) (1) (1) 2 9 17 (2) Polystyrene 5 7 (6) (4) 1 (2) 2 (3) 9 1 (1) Feedstocks 13 19 (23) (8) 6 (4) 4 (4) - 1 1 Net Timing*** Impacts - Fav/(Unfav) 32 33 (24) (19) (2) (16) (4) 1 13 21 (20) *Trade volume excludes styrene-related sales **See this Appendix for a reconciliation of non-GAAP measures ***Net Timing is the difference between Raw Material Timing and Price Lag. Raw Material Timing represents the timing of raw material cost changes flowing through cost of goods sold versus current pricing. Price Lag represents the difference in revenue between the current contractual price and the current period price. Segment Information – Excluding Feedstocks Recast |
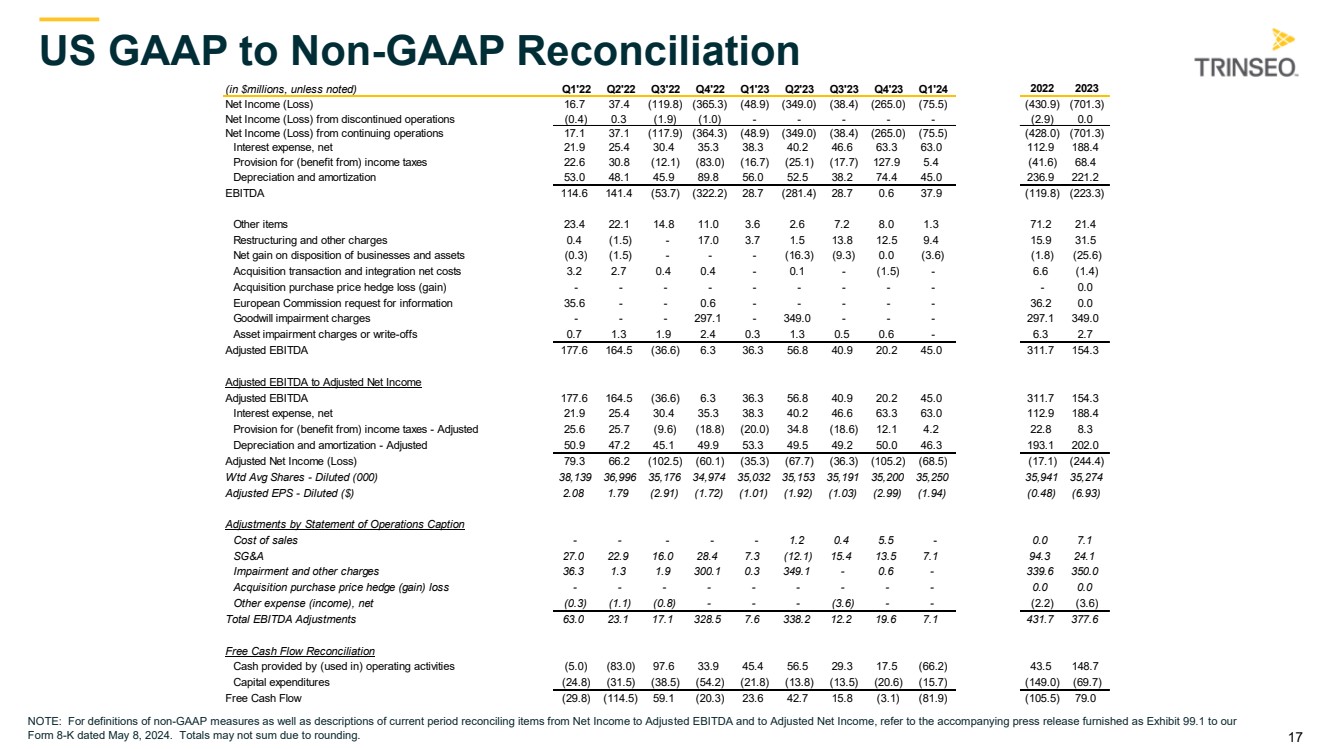
| 17 (in $millions, unless noted) Q1'22 Q2'22 Q3'22 Q4'22 Q1'23 Q2'23 Q3'23 Q4'23 Q1'24 2022 2023 Net Income (Loss) 16.7 37.4 (119.8) (365.3) (48.9) (349.0) (38.4) (265.0) (75.5) (430.9) (701.3) Net Income (Loss) from discontinued operations (0.4) 0.3 (1.9) (1.0) - - - - - (2.9) 0.0 Net Income (Loss) from continuing operations 17.1 37.1 (117.9) (364.3) (48.9) (349.0) (38.4) (265.0) (75.5) (428.0) (701.3) Interest expense, net 21.9 25.4 30.4 35.3 38.3 40.2 46.6 63.3 63.0 112.9 188.4 Provision for (benefit from) income taxes 22.6 30.8 (12.1) (83.0) (16.7) (25.1) (17.7) 127.9 5.4 (41.6) 68.4 Depreciation and amortization 53.0 48.1 45.9 89.8 56.0 52.5 38.2 74.4 45.0 236.9 221.2 EBITDA 114.6 141.4 (53.7) (322.2) 28.7 (281.4) 28.7 0.6 37.9 (119.8) (223.3) Other items 23.4 22.1 14.8 11.0 3.6 2.6 7.2 8.0 1.3 71.2 21.4 Restructuring and other charges 0.4 (1.5) - 17.0 3.7 1.5 13.8 12.5 9.4 15.9 31.5 Net gain on disposition of businesses and assets (0.3) (1.5) - - - (16.3) (9.3) 0.0 (3.6) (1.8) (25.6) Acquisition transaction and integration net costs 3.2 2.7 0.4 0.4 - 0.1 - (1.5) - 6.6 (1.4) Acquisition purchase price hedge loss (gain) - - - - - - - - - - 0.0 European Commission request for information 35.6 - - 0.6 - - - - - 36.2 0.0 Goodwill impairment charges - - - 297.1 - 349.0 - - - 297.1 349.0 Asset impairment charges or write-offs 0.7 1.3 1.9 2.4 0.3 1.3 0.5 0.6 - 6.3 2.7 Adjusted EBITDA 177.6 164.5 (36.6) 6.3 36.3 56.8 40.9 20.2 45.0 311.7 154.3 Adjusted EBITDA to Adjusted Net Income Adjusted EBITDA 177.6 164.5 (36.6) 6.3 36.3 56.8 40.9 20.2 45.0 311.7 154.3 Interest expense, net 21.9 25.4 30.4 35.3 38.3 40.2 46.6 63.3 63.0 112.9 188.4 Provision for (benefit from) income taxes - Adjusted 25.6 25.7 (9.6) (18.8) (20.0) 34.8 (18.6) 12.1 4.2 22.8 8.3 Depreciation and amortization - Adjusted 50.9 47.2 45.1 49.9 53.3 49.5 49.2 50.0 46.3 193.1 202.0 Adjusted Net Income (Loss) 79.3 66.2 (102.5) (60.1) (35.3) (67.7) (36.3) (105.2) (68.5) (17.1) (244.4) Wtd Avg Shares - Diluted (000) 38,139 36,996 35,176 34,974 35,032 35,153 35,191 35,200 35,250 35,941 35,274 Adjusted EPS - Diluted ($) 2.08 1.79 (2.91) (1.72) (1.01) (1.92) (1.03) (2.99) (1.94) (0.48) (6.93) Adjustments by Statement of Operations Caption Cost of sales - - - - - 1.2 0.4 5.5 - 0.0 7.1 SG&A 27.0 22.9 16.0 28.4 7.3 (12.1) 15.4 13.5 7.1 94.3 24.1 Impairment and other charges 36.3 1.3 1.9 300.1 0.3 349.1 - 0.6 - 339.6 350.0 Acquisition purchase price hedge (gain) loss - - - - - - - - - 0.0 0.0 Other expense (income), net (0.3) (1.1) (0.8) - - - (3.6) - - (2.2) (3.6) Total EBITDA Adjustments 63.0 23.1 17.1 328.5 7.6 338.2 12.2 19.6 7.1 431.7 377.6 Free Cash Flow Reconciliation Cash provided by (used in) operating activities (5.0) (83.0) 97.6 33.9 45.4 56.5 29.3 17.5 (66.2) 43.5 148.7 Capital expenditures (24.8) (31.5) (38.5) (54.2) (21.8) (13.8) (13.5) (20.6) (15.7) (149.0) (69.7) Free Cash Flow (29.8) (114.5) 59.1 (20.3) 23.6 42.7 15.8 (3.1) (81.9) (105.5) 79.0 US GAAP to Non-GAAP Reconciliation NOTE: For definitions of non-GAAP measures as well as descriptions of current period reconciling items from Net Income to Adjusted EBITDA and to Adjusted Net Income, refer to the accompanying press release furnished as Exhibit 99.1 to our Form 8-K dated May 8, 2024. Totals may not sum due to rounding. |
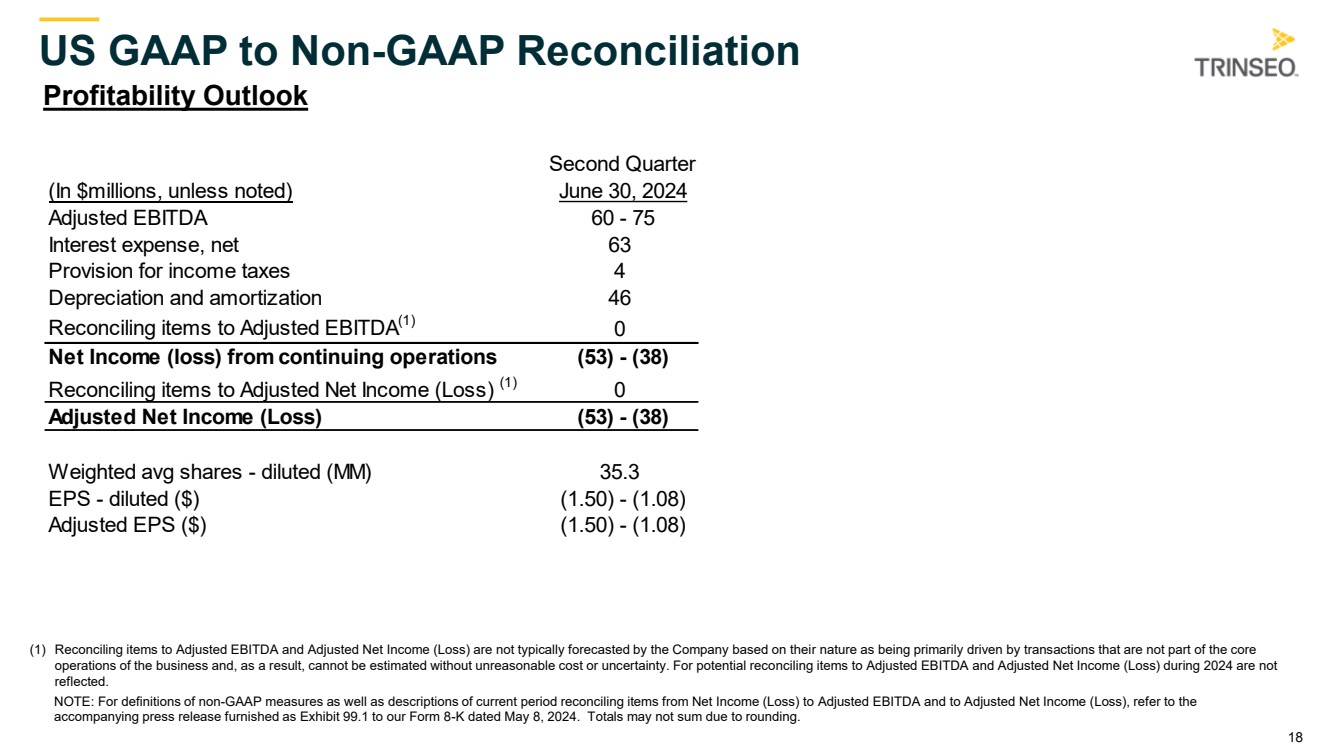
| 18 Second Quarter (In $millions, unless noted) June 30, 2024 Adjusted EBITDA 60 - 75 Interest expense, net 63 Provision for income taxes 4 Depreciation and amortization 46 Reconciling items to Adjusted EBITDA(1) 0 Net Income (loss) from continuing operations (53) - (38) Reconciling items to Adjusted Net Income (Loss) (1) 0 Adjusted Net Income (Loss) (53) - (38) Weighted avg shares - diluted (MM) 35.3 EPS - diluted ($) (1.50) - (1.08) Adjusted EPS ($) (1.50) - (1.08) US GAAP to Non-GAAP Reconciliation Profitability Outlook (1) Reconciling items to Adjusted EBITDA and Adjusted Net Income (Loss) are not typically forecasted by the Company based on their nature as being primarily driven by transactions that are not part of the core operations of the business and, as a result, cannot be estimated without unreasonable cost or uncertainty. For potential reconciling items to Adjusted EBITDA and Adjusted Net Income (Loss) during 2024 are not reflected. NOTE: For definitions of non-GAAP measures as well as descriptions of current period reconciling items from Net Income (Loss) to Adjusted EBITDA and to Adjusted Net Income (Loss), refer to the accompanying press release furnished as Exhibit 99.1 to our Form 8-K dated May 8, 2024. Totals may not sum due to rounding. |
Document and Entity Information |
May 08, 2024 |
|---|---|
| Cover [Abstract] | |
| Document Type | 8-K |
| Document Period End Date | May 08, 2024 |
| Entity File Number | 001-36473 |
| Entity Registrant Name | Trinseo PLC |
| Entity Incorporation, State or Country Code | L2 |
| Entity Tax Identification Number | 00-0000000 |
| Entity Address, Address Line One | 440 East Swedesford Road |
| Entity Address, Adress Line Two | Suite 301 |
| Entity Address, City or Town | Wayne |
| Entity Address, State or Province | PA |
| Entity Address, Postal Zip Code | 19087 |
| City Area Code | 610 |
| Local Phone Number | 240-3200 |
| Written Communications | false |
| Soliciting Material | false |
| Pre-commencement Tender Offer | false |
| Pre-commencement Issuer Tender Offer | false |
| Title of 12(b) Security | Ordinary Shares, par value $0.01 per share |
| Trading Symbol | TSE |
| Security Exchange Name | NYSE |
| Entity Emerging Growth Company | false |
| Entity Central Index Key | 0001519061 |
| Amendment Flag | false |
1 Year Trinseo Chart |
1 Month Trinseo Chart |

It looks like you are not logged in. Click the button below to log in and keep track of your recent history.
Support: +44 (0) 203 8794 460 | support@advfn.com
By accessing the services available at ADVFN you are agreeing to be bound by ADVFN's Terms & Conditions
 Hot Features