
We could not find any results for:
Make sure your spelling is correct or try broadening your search.
| Share Name | Share Symbol | Market | Type |
|---|---|---|---|
| Cohen & Steers Real Estate Opportunities and Income Fund | NYSE:RLTY | NYSE | Common Stock |
| Price Change | % Change | Share Price | High Price | Low Price | Open Price | Shares Traded | Last Trade | |
|---|---|---|---|---|---|---|---|---|
| 0.00 | 0.00% | 15.50 | 15.57 | 15.38 | 15.49 | 91,743 | 01:00:00 |
| Six Months Ended June 30, 2023 |
||||
| Cohen & Steers Real Estate Opportunities and Income Fund at Net Asset Value(a) |
7.50 | %(b) | ||
| Cohen & Steers Real Estate Opportunities and Income Fund at Market Value(a) |
6.87 | % | ||
| Blended Benchmark—70% FTSE Nareit All Equity REITs Index/30% Preferred Blend (50% ICE BofA U.S. IG Institutional Capital Securities Index, 25% ICE BofA Core Fixed Rate Preferred Securities Index and 25% Bloomberg Developed Market USD Contingent Capital Securities Index)(c) |
2.56 | % | ||
| S&P 500 Indexc |
16.89 | % | ||
| (a) | As a closed-end investment company, the price of the Fund’s exchange-traded shares will be set by market forces and can deviate from the net asset value (NAV) per share of the Fund. |
| (b) | The return shown is based on the NAV reported on June 30, 2023 and may differ from the return shown in the Financial Highlights, which reflects adjustments made to the NAV in accordance with accounting principles generally accepted in the United States of America (GAAP). |
| (c) | For benchmark descriptions, see page 6. |
 |
 | |
| WILLIAM F. SCAPELL | JASON YABLON | |
| Portfolio Manager | Portfolio Manager | |
 |
 | |
| ELAINE ZAHARIS-NIKAS | JERRY DOROST | |
| Portfolio Manager | Portfolio Manager | |
 |
 | |
| MATHEW KIRSCHNER | YIGAL JHIRAD | |
| Portfolio Manager | Portfolio Manager | |
| 1 Year | 5 Years | 10 Years | Since Inception(a) |
|||||||||||||
| Fund at NAV |
–0.25 | % | — | — | –8.52 | % | ||||||||||
| Fund at Market Value |
–6.90 | % | — | — | –18.10 | % | ||||||||||
| (a) | Commencement of investment operations is February 24, 2022. |
| Leverage (as a % of managed assets) |
35% | |
| % Variable Rate Financing |
15% | |
| Variable Rate |
6.0% | |
| % Fixed Rate Financing(c) |
85% | |
| Weighted Average Rate on Fixed Financing |
2.9% | |
| Weighted Average Term on Fixed Financing |
2.8 years |
| (a) | Data as of June 30, 2023. Information is subject to change. |
| (b) | See Note 7 in Notes to Financial Statements. |
| (c) | Represents fixed payer interest rate swap contracts on variable rate borrowing. |
| Security | Value | % of Managed Assets |
||||||
| Prologis, Inc. |
$ | 24,998,861 | 6.0 | |||||
| American Tower Corp. |
21,164,284 | 5.1 | ||||||
| Digital Realty Trust, Inc. |
20,599,425 | 5.0 | ||||||
| Welltower, Inc. |
18,996,450 | 4.6 | ||||||
| Simon Property Group, Inc. |
17,956,332 | 4.3 | ||||||
| Invitation Homes, Inc. |
17,145,201 | 4.1 | ||||||
| Realty Income Corp. |
16,082,613 | 3.9 | ||||||
| Crown Castle, Inc. |
13,530,831 | 3.3 | ||||||
| Equinix, Inc. |
11,185,256 | 2.7 | ||||||
| Mid‑America Apartment Communities, Inc. |
11,137,109 | 2.7 | ||||||
| (a) | Top ten holdings (excluding short-term investments and derivative instruments) are determined on the basis of the value of individual securities held. The Fund may also hold positions in other securities issued by the companies listed above. See the Schedule of Investments for additional details on such other positions. |
| (b) | Excludes derivative instruments. |
| Shares | Value | |||||||||||
| COMMON STOCK |
105.1% | |||||||||||
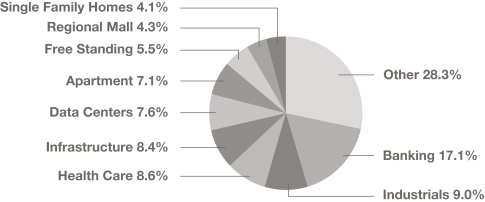
| APARTMENT |
10.9% | |||||||||||
| Apartment Income REIT Corp. |
|
86,535 | $ | 3,123,048 | ||||||||
| Camden Property Trust(a)(b) |
|
90,968 | 9,903,686 | |||||||||
| Mid‑America Apartment Communities, Inc.(a) |
|
73,338 | 11,137,109 | |||||||||
| UDR, Inc.(a) |
|
119,902 | 5,150,990 | |||||||||
| |
|
|||||||||||
| 29,314,833 | ||||||||||||
| |
|
|||||||||||
| DATA CENTERS |
11.9% | |||||||||||
| Digital Realty Trust, Inc.(a)(b) |
|
180,903 | 20,599,425 | |||||||||
| Equinix, Inc.(a)(b) |
|
14,268 | 11,185,256 | |||||||||
| |
|
|||||||||||
| 31,784,681 | ||||||||||||
| |
|
|||||||||||
| DIVERSIFIED |
1.3% | |||||||||||
| WP Carey, Inc. |
|
52,156 | 3,523,659 | |||||||||
| |
|
|||||||||||
| FREE STANDING |
8.5% | |||||||||||
| Realty Income Corp.(a) |
|
268,985 | 16,082,613 | |||||||||
| Spirit Realty Capital, Inc.(a) |
|
167,623 | 6,600,994 | |||||||||
| |
|
|||||||||||
| 22,683,607 | ||||||||||||
| |
|
|||||||||||
| HEALTH CARE |
13.3% | |||||||||||
| Healthcare Realty Trust, Inc., Class A(a)(b) |
|
491,509 | 9,269,860 | |||||||||
| Medical Properties Trust, Inc. |
|
448,569 | 4,153,749 | |||||||||
| Omega Healthcare Investors, Inc. |
|
101,984 | 3,129,889 | |||||||||
| Welltower, Inc.(a) |
|
234,843 | 18,996,450 | |||||||||
| |
|
|||||||||||
| 35,549,948 | ||||||||||||
| |
|
|||||||||||
| HOTEL |
0.7% | |||||||||||
| Xenia Hotels & Resorts, Inc.(b) |
|
156,900 | 1,931,439 | |||||||||
| |
|
|||||||||||
| INDUSTRIALS |
13.9% | |||||||||||
| Americold Realty Trust, Inc.(a) |
|
288,431 | 9,316,322 | |||||||||
| EastGroup Properties, Inc. |
|
16,327 | 2,834,367 | |||||||||
| Prologis, Inc.(a) |
|
203,856 | 24,998,861 | |||||||||
| |
|
|||||||||||
| 37,149,550 | ||||||||||||
| |
|
|||||||||||
| INFRASTRUCTURE |
12.9% | |||||||||||
| American Tower Corp.(a)(b) |
|
109,128 | 21,164,284 | |||||||||
| Crown Castle, Inc.(a) |
|
118,754 | 13,530,831 | |||||||||
| |
|
|||||||||||
| 34,695,115 | ||||||||||||
| |
|
|||||||||||
| Shares | Value | |||||||||||
| MANUFACTURED HOME |
3.1% | |||||||||||
| Sun Communities, Inc.(b) |
|
63,564 | $ | 8,292,559 | ||||||||
| |
|
|||||||||||
| OFFICE |
2.8% | |||||||||||
| Cousins Properties, Inc.(a) |
|
112,583 | 2,566,892 | |||||||||
| Highwoods Properties, Inc.(a) |
|
208,526 | 4,985,857 | |||||||||
| |
|
|||||||||||
| 7,552,749 | ||||||||||||
| |
|
|||||||||||
| REGIONAL MALL |
6.7% | |||||||||||
| Simon Property Group, Inc.(a) |
|
155,493 | 17,956,332 | |||||||||
| |
|
|||||||||||
| SELF STORAGE |
4.6% | |||||||||||
| Extra Space Storage, Inc.(a) |
|
46,891 | 6,979,725 | |||||||||
| Public Storage(a) |
|
18,642 | 5,441,227 | |||||||||
| |
|
|||||||||||
| 12,420,952 | ||||||||||||
| |
|
|||||||||||
| SHOPPING CENTER |
5.3% | |||||||||||
| Kimco Realty Corp.(a) |
|
298,477 | 5,885,966 | |||||||||
| Kite Realty Group Trust(a)(b) |
|
366,778 | 8,193,821 | |||||||||
| |
|
|||||||||||
| 14,079,787 | ||||||||||||
| |
|
|||||||||||
| SINGLE FAMILY HOMES |
6.4% | |||||||||||
| Invitation Homes, Inc.(a) |
|
498,407 | 17,145,201 | |||||||||
| |
|
|||||||||||
| SPECIALTY |
2.8% | |||||||||||
| Gaming and Leisure Properties, Inc.(a) |
|
27,063 | 1,311,473 | |||||||||
| Lamar Advertising Co., Class A |
|
28,576 | 2,836,168 | |||||||||
| VICI Properties, Inc., Class A(a) |
|
106,617 | 3,350,972 | |||||||||
| |
|
|||||||||||
| 7,498,613 | ||||||||||||
| |
|
|||||||||||
| TOTAL COMMON STOCK (Identified cost—$301,542,484) |
|
281,579,025 | ||||||||||
| |
|
|||||||||||
| EXCHANGE-TRADED FUNDS—CORPORATES |
0.9% | |||||||||||
| Vanguard Short-Term Corporate Bond ETF(b) |
|
30,000 | 2,269,800 | |||||||||
| |
|
|||||||||||
| TOTAL EXCHANGE-TRADED FUNDS (Identified cost—$2,215,550) |
|
2,269,800 | ||||||||||
| |
|
|||||||||||
| PREFERRED SECURITIES—EXCHANGE-TRADED |
8.1% | |||||||||||
| BANKING |
3.3% | |||||||||||
| Bank of America Corp., 6.00%, Series GG(a)(c) |
|
33,000 | 824,340 | |||||||||
| Bank of America Corp., 5.875%, Series HH(a)(c) |
|
41,000 | 1,011,470 | |||||||||
| Bank of America Corp., 5.375%, Series KK(a)(c) |
|
5,931 | 136,413 | |||||||||
| Shares | Value | |||||||||||
| Citigroup, Inc., 7.125% to 9/30/23, Series J(a)(c)(d) |
|
18,953 | $ | 482,164 | ||||||||
| Citigroup, Inc., 6.875% to 11/15/23, Series K(a)(c)(d) |
|
24,438 | 619,015 | |||||||||
| Dime Community Bancshares, Inc., 5.50%(c) |
|
14,356 | 234,864 | |||||||||
| JPMorgan Chase & Co., 5.75%, Series DD(a)(c) |
|
13,000 | 326,820 | |||||||||
| Morgan Stanley, 6.875% to 1/15/24, Series F(a)(c) |
|
25,000 | 633,000 | |||||||||
| Morgan Stanley, 7.125% to 10/15/23, Series E(a)(c) |
|
14,559 | 366,013 | |||||||||
| Morgan Stanley, 5.85% to 4/15/27, Series K(a)(c) |
|
38,838 | 913,082 | |||||||||
| Morgan Stanley, 6.375% to 10/15/24, Series I(a)(c) |
|
91,254 | 2,239,373 | |||||||||
| Wells Fargo & Co., 6.625% to 3/15/24, Series R(a)(c) |
|
38,652 | 974,417 | |||||||||
| |
|
|||||||||||
| 8,760,971 | ||||||||||||
| |
|
|||||||||||
| CONSUMER STAPLE PRODUCTS |
0.5% | |||||||||||
| CHS, Inc., 7.875%(c) |
|
14,862 | 387,155 | |||||||||
| CHS, Inc., 7.50%, Series 4(c) |
|
34,342 | 902,851 | |||||||||
| |
|
|||||||||||
| 1,290,006 | ||||||||||||
| |
|
|||||||||||
| FINANCIAL SERVICES |
0.5% | |||||||||||
| Oaktree Capital Group LLC, 6.625%, Series A(a)(c) |
|
38,000 | 852,340 | |||||||||
| Oaktree Capital Group LLC, 6.55%, Series B(a)(c) |
|
19,994 | 446,466 | |||||||||
| |
|
|||||||||||
| 1,298,806 | ||||||||||||
| |
|
|||||||||||
| INDUSTRIAL SERVICES |
0.4% | |||||||||||
| WESCO International, Inc., 10.625% to 6/22/25, Series A(a)(c)(d) |
|
37,000 | 988,640 | |||||||||
| |
|
|||||||||||
| INSURANCE |
0.9% | |||||||||||
| Allstate Corp./The, 7.375%, Series J(c) |
|
25,067 | 670,041 | |||||||||
| Athene Holding Ltd., 6.375% to 6/30/25, Series C(a)(c)(d) |
|
32,110 | 750,411 | |||||||||
| Athene Holding Ltd., 4.875%, Series D(a)(c) |
|
24,721 | 402,952 | |||||||||
| Kemper Corp., 5.875% to 3/15/27, due 3/15/62(a)(d) |
|
3,688 | 64,540 | |||||||||
| RenaissanceRe Holdings Ltd., 5.75%, Series F (Bermuda)(c) |
|
10,114 | 230,094 | |||||||||
| W R Berkley Corp., 4.125%, due 3/30/61 |
|
15,369 | 295,392 | |||||||||
| |
|
|||||||||||
| 2,413,430 | ||||||||||||
| |
|
|||||||||||
| PIPELINE |
0.5% | |||||||||||
| Energy Transfer LP, 7.60% to 5/15/24, Series E(a)(c)(d) |
|
60,500 | 1,474,990 | |||||||||
| |
|
|||||||||||
| REAL ESTATE |
0.3% | |||||||||||
| DigitalBridge Group, Inc., 7.15%, Series I(c) |
|
16,976 | 357,345 | |||||||||
| Shares | Value | |||||||||||
| DigitalBridge Group, Inc., 7.125%, Series J(c) |
|
14,993 | $ | 321,450 | ||||||||
| Rexford Industrial Realty, Inc., 5.875%, Series B(a)(c) |
|
3,039 | 69,410 | |||||||||
| |
|
|||||||||||
| 748,205 | ||||||||||||
| |
|
|||||||||||
| TELECOMMUNICATIONS |
1.2% | |||||||||||
| AT&T, Inc., 5.00%, Series A(a)(c) |
|
71,000 | 1,584,720 | |||||||||
| AT&T, Inc., 4.75%, Series C(a)(c) |
|
76,741 | 1,617,700 | |||||||||
| Telephone and Data Systems, Inc., 6.625%, Series UU(a)(c) |
|
6,765 | 102,152 | |||||||||
| |
|
|||||||||||
| 3,304,572 | ||||||||||||
| |
|
|||||||||||
| UTILITIES |
0.5% | |||||||||||
| Algonquin Power & Utilities Corp., 6.20% to 7/1/24, due 7/1/79, Series 19‑A (Canada)(a)(d) |
|
25,000 | 596,750 | |||||||||
| Duke Energy Corp., 5.75%, Series A(a)(c) |
|
7,866 | 195,077 | |||||||||
| NiSource, Inc., 6.50% to 3/15/24, Series B(a)(c)(d) |
|
22,589 | 569,017 | |||||||||
| |
|
|||||||||||
| 1,360,844 | ||||||||||||
| |
|
|||||||||||
| TOTAL PREFERRED SECURITIES—EXCHANGE-TRADED (Identified cost—$23,019,918) |
|
21,640,464 | ||||||||||
| |
|
|||||||||||
| Principal Amount |
||||||||||||
| PREFERRED SECURITIES—OVER‑THE‑COUNTER |
33.5% | |||||||||||
| BANKING |
23.3% | |||||||||||
| Banco Santander SA, 7.50% to 2/8/24 (Spain)(c)(d)(e)(f) |
|
$ | 1,200,000 | 1,148,226 | ||||||||
| Bank of America Corp., 6.10% to 3/17/25, Series AA(a)(c)(d) |
|
875,000 | 869,750 | |||||||||
| Bank of America Corp., 6.125% to 4/27/27, Series TT(a)(c)(d) |
|
678,000 | 664,203 | |||||||||
| Bank of America Corp., 6.25% to 9/5/24, Series X(a)(b)(c)(d) |
|
1,029,000 | 1,018,710 | |||||||||
| Bank of America Corp., 6.30% to 3/10/26, Series DD(a)(c)(d) |
|
1,310,000 | 1,312,947 | |||||||||
| Bank of America Corp., 6.50% to 10/23/24, Series Z(a)(c)(d) |
|
975,000 | 974,727 | |||||||||
| Bank of Nova Scotia/The, 4.90% to 6/4/25 (Canada)(a)(c)(d) |
|
1,275,000 | 1,206,877 | |||||||||
| Bank of Nova Scotia/The, 8.625% to 10/27/27, due 10/27/82 (Canada)(d) |
|
200,000 | 208,428 | |||||||||
| Barclays PLC, 6.125% to 12/15/25 (United Kingdom)(a)(c)(d)(f) |
|
1,000,000 | 877,750 | |||||||||
| Barclays PLC, 7.125% to 6/15/25 (United Kingdom)(c)(d)(f) |
|
800,000 | 924,001 | |||||||||
| Barclays PLC, 8.00% to 6/15/24 (United Kingdom)(a)(c)(d)(f) |
|
2,000,000 | 1,894,800 | |||||||||
| Barclays PLC, 8.00% to 3/15/29 (United Kingdom)(a)(c)(d)(f) |
|
1,000,000 | 895,900 | |||||||||
| Principal Amount |
Value | |||||||||
| BNP Paribas SA, 6.625% to 3/25/24 (France)(a)(c)(d)(f)(g) |
$ | 1,000,000 | $ | 964,126 | ||||||
| BNP Paribas SA, 7.375% to 8/19/25 (France)(a)(c)(d)(f)(g) |
2,000,000 | 1,944,146 | ||||||||
| BNP Paribas SA, 7.75% to 8/16/29 (France)(a)(c)(d)(f)(g) |
400,000 | 388,160 | ||||||||
| BNP Paribas SA, 9.25% to 11/17/27 (France)(a)(c)(d)(f)(g) |
600,000 | 619,868 | ||||||||
| Charles Schwab Corp./The, 4.00% to 12/1/30, Series H(a)(c)(d) |
1,400,000 | 1,023,400 | ||||||||
| Charles Schwab Corp./The, 5.375% to 6/1/25, Series G(a)(c)(d) |
2,800,000 | 2,690,016 | ||||||||
| Charles Schwab Corp./The, 4.00% to 6/1/26, Series I(a)(c)(d) |
737,000 | 599,918 | ||||||||
| Citigroup, Inc., 5.95% to 5/15/25, Series P(a)(c)(d) |
1,923,000 | 1,846,615 | ||||||||
| Citigroup, Inc., 6.25% to 8/15/26, Series T(a)(c)(d) |
1,475,000 | 1,455,132 | ||||||||
| Citigroup, Inc., 9.341% (3 Month US LIBOR + 4.068%), due 10/30/23, Series 0(a)(c)(h) |
1,839,000 | 1,850,034 | ||||||||
| Citigroup, Inc., 9.551% (3 Month US LIBOR + 4.23%), due 8/15/23(c)(h) |
350,000 | 352,100 | ||||||||
| Citizens Financial Group, Inc., 5.65% to 10/6/25, Series F(a)(c)(d) |
750,000 | 659,856 | ||||||||
| Commerzbank AG, 7.00% to 4/9/25 (Germany)(c)(d)(e)(f) |
400,000 | 365,851 | ||||||||
| Credit Agricole SA, 6.875% to 9/23/24 (France)(a)(c)(d)(f)(g) |
1,400,000 | 1,352,624 | ||||||||
| Credit Agricole SA, 7.875% to 1/23/24 (France)(a)(c)(d)(f)(g) |
2,600,000 | 2,578,196 | ||||||||
| Credit Agricole SA, 8.125% to 12/23/25 (France)(a)(c)(d)(f)(g) |
1,200,000 | 1,206,750 | ||||||||
| Credit Suisse Group AG, 6.375% to 8/21/26, Claim (Switzerland)(c)(d)(f)(g)(i)(j) |
400,000 | 16,932 | ||||||||
| Credit Suisse Group AG, 7.25% to 9/12/25, Claim (Switzerland)(c)(d)(f)(g)(i)(j) |
400,000 | 16,932 | ||||||||
| Deutsche Bank AG/NewYork, 7.50% to 4/30/25 (Germany)(c)(d)(f) |
800,000 | 709,920 | ||||||||
| Goldman Sachs Group, Inc./The, 4.95% to 2/10/25, Series R(a)(c)(d) |
614,000 | 580,371 | ||||||||
| Goldman Sachs Group, Inc./The, 5.50% to 8/10/24, Series Q(a)(c)(d) |
1,250,000 | 1,221,787 | ||||||||
| HSBC Holdings PLC, 6.375% to 3/30/25 (United Kingdom)(a)(c)(d)(f) |
600,000 | 575,415 | ||||||||
| Principal Amount |
Value | |||||||||||
| ING Groep N.V., 6.50% to 4/16/25 (Netherlands)(a)(c)(d)(f) |
|
$ | 1,000,000 | $ | 934,100 | |||||||
| ING Groep N.V., 6.75% to 4/16/24 (Netherlands)(c)(d)(e)(f) |
|
1,000,000 | 956,250 | |||||||||
| Intesa Sanpaolo SpA, 7.70% to 9/17/25 (Italy)(a)(c)(d)(f)(g) |
|
600,000 | 564,750 | |||||||||
| JPMorgan Chase & Co., 3.65% to 6/1/26, Series KK(c)(d) |
|
509,000 | 449,269 | |||||||||
| JPMorgan Chase & Co., 4.60% to 2/1/25, Series HH(c)(d) |
|
83,000 | 77,605 | |||||||||
| JPMorgan Chase & Co., 6.10% to 10/1/24, Series X(a)(c)(d) |
|
975,000 | 973,367 | |||||||||
| JPMorgan Chase & Co., 6.125% to 4/30/24, Series U(a)(c)(d) |
|
466,000 | 465,070 | |||||||||
| JPMorgan Chase & Co., 6.75% to 2/1/24, Series S(a)(c)(d) |
|
784,000 | 786,528 | |||||||||
| Lloyds Banking Group PLC, 7.50% to 6/27/24 (United Kingdom)(a)(c)(d)(f) |
|
1,800,000 | 1,721,070 | |||||||||
| Lloyds Banking Group PLC, 7.50% to 9/27/25 (United Kingdom)(a)(c)(d)(f) |
|
2,000,000 | 1,875,300 | |||||||||
| Natwest Group PLC, 6.00% to 12/29/25 (United Kingdom)(a)(c)(d)(f) |
|
2,800,000 | 2,597,000 | |||||||||
| Natwest Group PLC, 8.00% to 8/10/25 (United Kingdom)(a)(c)(d)(f) |
|
2,600,000 | 2,533,258 | |||||||||
| PNC Financial Services Group, Inc./The, 6.00% to 5/15/27, Series U(a)(c)(d) |
|
321,000 | 289,702 | |||||||||
| PNC Financial Services Group, Inc./The, 6.20% to 9/15/27, Series V(a)(c)(d) |
|
841,000 | 786,041 | |||||||||
| PNC Financial Services Group, Inc./The, 8.977% (3 Month US LIBOR + 3.678%), due 8/1/23, Series O(a)(c)(h) |
|
2,000,000 | 2,004,446 | |||||||||
| Societe Generale SA, 8.00% to 9/29/25 (France)(c)(d)(f)(g) |
|
400,000 | 375,744 | |||||||||
| Societe Generale SA, 9.375% to 11/22/27 (France)(c)(d)(f)(g) |
|
400,000 | 392,000 | |||||||||
| Toronto-Dominion Bank/The, 8.125% to 10/31/27, due 10/31/82 (Canada)(d) |
|
200,000 | 203,676 | |||||||||
| UBS Group AG, 6.875% to 8/7/25 (Switzerland)(c)(d)(e)(f) |
|
2,000,000 | 1,836,062 | |||||||||
| UBS Group AG, 7.00% to 2/19/25 (Switzerland)(c)(d)(e)(f) |
|
2,000,000 | 1,908,306 | |||||||||
| UniCredit SpA, 8.00% to 6/3/24 (Italy)(c)(d)(e)(f) |
|
600,000 | 588,534 | |||||||||
| Wells Fargo & Co., 3.90% to 3/15/26, Series BB(a)(c)(d) |
|
1,350,000 | 1,189,384 | |||||||||
| Wells Fargo & Co., 5.875% to 6/15/25, Series U(a)(c)(h) |
|
3,971,000 | 3,901,103 | |||||||||
| |
|
|||||||||||
| 62,423,033 | ||||||||||||
| |
|
|||||||||||
| ENERGY |
0.4% | |||||||||||
| BP Capital Markets PLC, 4.375% to 6/22/25 (United Kingdom)(a)(c)(d) |
|
1,000,000 | 961,750 | |||||||||
| |
|
|||||||||||
| Principal Amount |
Value | |||||||||||
| FINANCIAL SERVICES |
0.1% | |||||||||||
| Ares Finance Co. III LLC, 4.125% to 6/30/26, due 6/30/51(d)(g) |
|
$ | 225,000 | $ | 164,542 | |||||||
| |
|
|||||||||||
| INSURANCE |
4.2% | |||||||||||
| Aegon NV, 5.50% to 4/11/28, due 4/11/48 (Netherlands)(a)(d) |
|
500,000 | 476,030 | |||||||||
| Argentum Netherlands BV for Swiss Re Ltd., 5.625% to 8/15/27, due 8/15/52 (Switzerland)(d)(e) |
|
400,000 | 377,966 | |||||||||
| Argentum Netherlands BV for Zurich Insurance Co. Ltd., 5.125% to 6/1/28, due 6/1/48 (Switzerland)(d)(e) |
|
200,000 | 190,527 | |||||||||
| CNP Assurances, 5.25% to 1/18/33, due 7/18/53, Series EMTN (France)(d)(e) |
|
500,000 | 523,622 | |||||||||
| Corebridge Financial, Inc., 6.875% to 9/15/27, due 12/15/52(d) |
|
695,000 | 667,379 | |||||||||
| Dai‑ichi Life Insurance Co., Ltd./The, 5.10% to 10/28/24 (Japan)(a)(c)(d)(g) |
|
2,000,000 | 1,950,030 | |||||||||
| Fukoku Mutual Life Insurance Co., 6.50% to 9/19/23 (Japan)(c)(d)(e) |
|
1,500,000 | 1,493,385 | |||||||||
| Global Atlantic Fin Co., 4.70% to 7/15/26, due 10/15/51(a)(d)(g) |
|
638,000 | 453,504 | |||||||||
| Lancashire Holdings Ltd., 5.625% to 3/18/31, due 9/18/41 (United Kingdom)(d)(e) |
|
300,000 | 249,603 | |||||||||
| Markel Group, Inc., 6.00% to 6/1/25(a)(c)(d) |
|
390,000 | 376,828 | |||||||||
| MetLife, Inc., 10.75%, due 8/1/39(a) |
|
500,000 | 646,632 | |||||||||
| Phoenix Group Holdings PLC, 4.75% to 6/4/26, due 9/4/31 (United Kingdom)(d)(e) |
|
600,000 | 548,723 | |||||||||
| Prudential Financial, Inc., 5.20% to 3/15/24, due 3/15/44(d) |
|
1,050,000 | 1,039,584 | |||||||||
| Prudential Financial, Inc., 5.125% to 11/28/31, due 3/1/52(d) |
|
496,000 | 449,158 | |||||||||
| QBE Insurance Group Ltd., 5.875% to 5/12/25 (Australia)(c)(d)(g) |
|
200,000 | 190,841 | |||||||||
| QBE Insurance Group Ltd., 5.875% to 6/17/26, due 6/17/46, Series EMTN (Australia)(d)(e) |
|
200,000 | 190,862 | |||||||||
| QBE Insurance Group Ltd., 7.50% to 11/24/23, due 11/24/43 (Australia)(d)(g) |
|
500,000 | 500,529 | |||||||||
| Voya Financial, Inc., 6.125% to 9/15/23, Series A(a)(c)(d) |
|
1,000,000 | 969,336 | |||||||||
| |
|
|||||||||||
| 11,294,539 | ||||||||||||
| |
|
|||||||||||
| Principal Amount |
Value | |||||||||||
| PIPELINE |
1.5% | |||||||||||
| Enbridge, Inc., 7.375% to 10/15/27, due 1/15/83 (Canada)(a)(d) |
|
$ | 800,000 | $ | 786,487 | |||||||
| Energy Transfer LP, 7.125% to 5/15/30, Series G(a)(c)(d) |
|
2,191,000 | 1,863,274 | |||||||||
| Transcanada Trust, 5.60% to 12/7/31, due 3/7/82 (Canada)(a)(d) |
|
880,000 | 742,667 | |||||||||
| Transcanada Trust, 5.875% to 8/15/26, due 8/15/76, Series 16‑A (Canada)(a)(d) |
|
576,000 | 544,752 | |||||||||
| |
|
|||||||||||
| 3,937,180 | ||||||||||||
| |
|
|||||||||||
| REAL ESTATE |
0.4% | |||||||||||
| Scentre Group Trust 2, 4.75% to 6/24/26, due 9/24/80 (Australia)(a)(d)(g) |
|
1,300,000 | 1,165,450 | |||||||||
| |
|
|||||||||||
| TELECOMMUNICATIONS |
0.8% | |||||||||||
| Vodafone Group PLC, 6.25% to 7/3/24, due 10/3/78 (United Kingdom)(d)(e) |
|
1,183,000 | 1,172,211 | |||||||||
| Vodafone Group PLC, 7.00% to 1/4/29, due 4/4/79 (United Kingdom)(a)(d) |
|
550,000 | 564,949 | |||||||||
| Vodafone Group PLC, 6.50% to 5/30/29, due 8/30/84 (United Kingdom)(d)(e) |
|
400,000 | 439,449 | |||||||||
| |
|
|||||||||||
| 2,176,609 | ||||||||||||
| |
|
|||||||||||
| UTILITIES |
2.8% | |||||||||||
| Algonquin Power & Utilities Corp., 4.75% to 1/18/27, due 1/18/82 (Canada)(a)(d) |
|
2,075,000 | 1,652,447 | |||||||||
| Dominion Energy, Inc., 4.65% to 12/15/24, Series B(a)(c)(d) |
|
1,050,000 | 949,305 | |||||||||
| Duke Energy Corp., 4.875% to 9/16/24(a)(c)(d) |
|
798,000 | 768,394 | |||||||||
| Edison International, 5.375% to 3/15/26, Series A(a)(c)(d) |
|
1,300,000 | 1,139,320 | |||||||||
| Emera, Inc., 6.75% to 6/15/26, due 6/15/76, Series 16‑A (Canada)(b)(d) |
|
1,200,000 | 1,164,876 | |||||||||
| Sempra, 4.125% to 1/1/27, due 4/1/52(d) |
|
1,175,000 | 952,098 | |||||||||
| Southern Co./The, 4.00% to 10/15/25, due 1/15/51, Series B(a)(d) |
|
1,000,000 | 927,320 | |||||||||
| |
|
|||||||||||
| 7,553,760 | ||||||||||||
| |
|
|||||||||||
| TOTAL PREFERRED SECURITIES—OVER‑THE‑COUNTER (Identified cost—$95,861,472) |
|
89,676,863 | ||||||||||
| |
|
|||||||||||
| Principal Amount |
Value | |||||||||||
| CORPORATE BONDS |
3.8% | |||||||||||
| REAL ESTATE |
3.2% | |||||||||||
| American Tower Corp., 5.55%, due 7/15/33 |
|
$ | 500,000 | $ | 503,895 | |||||||
| American Tower Corp., 5.65%, due 3/15/33(a) |
|
850,000 | 862,744 | |||||||||
| Boston Properties LP, 6.75%, due 12/1/27(a) |
|
485,000 | 490,996 | |||||||||
| Digital Realty Trust LP, 5.55%, due 1/15/28(a) |
|
1,070,000 | 1,055,313 | |||||||||
| Kimco Realty OP LLC, 4.25%, due 4/1/45 |
|
400,000 | 310,539 | |||||||||
| Realty Income Corp., 5.625%, due 10/13/32(b) |
|
715,000 | 723,205 | |||||||||
| Retail Opportunity Investments Partnership LP, 4.00%, due 12/15/24 |
|
1,000,000 | 958,469 | |||||||||
| Simon Property Group LP, 5.50%, due 3/8/33(a) |
|
585,000 | 581,297 | |||||||||
| Simon Property Group LP, 5.85%, due 3/8/53 |
|
415,000 | 412,840 | |||||||||
| Spirit Realty LP, 3.40%, due 1/15/30(a) |
|
350,000 | 297,687 | |||||||||
| Spirit Realty LP, 2.10%, due 3/15/28(a) |
|
500,000 | 419,630 | |||||||||
| VICI Properties LP/VICI Note Co., Inc., 5.75%, due 2/1/27(a)(g) |
|
600,000 | 587,826 | |||||||||
| VICI Properties LP/VICI Note Co., Inc., 5.625%, due 5/1/24(a)(g) |
|
600,000 | 596,841 | |||||||||
| Welltower OP LLC, 4.50%, due 1/15/24(a) |
|
728,000 | 720,078 | |||||||||
| |
|
|||||||||||
| 8,521,360 | ||||||||||||
| |
|
|||||||||||
| UTILITIES |
0.6% | |||||||||||
| Enel Finance America LLC, 7.10%, due 10/14/27 (Italy)(g) |
|
200,000 | 210,298 | |||||||||
| Enel Finance International NV, 7.50%, due 10/14/32 (Italy)(g) |
|
200,000 | 221,878 | |||||||||
| NextEra Energy Capital Holdings, Inc., 6.051%, due 3/1/25(a) |
|
465,000 | 466,956 | |||||||||
| Southern California Edison Co., 5.85%, due 11/1/27(a) |
|
750,000 | 767,545 | |||||||||
| |
|
|||||||||||
| 1,666,677 | ||||||||||||
| |
|
|||||||||||
| TOTAL CORPORATE BONDS (Identified cost—$10,094,790) |
|
10,188,037 | ||||||||||
| |
|
|||||||||||
| Shares | ||||||||||||
| SHORT-TERM INVESTMENTS |
4.7% | |||||||||||
| MONEY MARKET FUNDS |
||||||||||||
| State Street Institutional Treasury Plus Money Market Fund, Premier Class, 5.02%(k) |
|
6,596,530 | 6,596,530 | |||||||||
| Shares | Value | |||||||||||
| State Street Institutional U.S. Government Money Market Fund, Premier Class, 5.03%(k) |
|
6,026,558 | $ | 6,026,558 | ||||||||
| |
|
|||||||||||
| TOTAL SHORT-TERM INVESTMENTS (Identified cost—$12,623,088) |
|
12,623,088 | ||||||||||
| |
|
|||||||||||
| TOTAL INVESTMENTS IN SECURITIES (Identified cost—$445,357,302) |
156.1% | 417,977,277 | ||||||||||
| WRITTEN OPTION CONTRACTS (Premiums received—$1,052,197) |
(0.4) | (1,138,046 | ) | |||||||||
| LIABILITIES IN EXCESS OF OTHER ASSETS |
(55.7) | (149,040,825 | ) | |||||||||
| |
|
|
|
|||||||||
| NET ASSETS (Equivalent to $15.98 per share based on 16,755,000 shares of common stock outstanding) |
100.0% | $ | 267,798,406 | |||||||||
| |
|
|
|
|||||||||
| Description | Exercise Price |
Expiration Date |
Number of Contracts |
Notional Amount(I) |
Premiums Received |
Value | ||||||||||||||||
| Call—iShares U.S. Real Estate ETF |
$ 87.00 | 7/21/23 | (1,000 | ) | $(8,654,000 | ) | $(102,977 | ) | $(112,000 | ) | ||||||||||||
| Call—iShares U.S. Real Estate ETF |
88.00 | 7/21/23 | (6,000 | ) | (51,924,000 | ) | (490,800 | ) | (414,000 | ) | ||||||||||||
| (7,000 | ) | $(60,578,000 | ) | $(593,777 | ) | $(526,000 | ) | |||||||||||||||
| |
||||||||||||||||||||||
| Description | Counterparty | Exercise Price |
Expiration Date |
Number of Contracts |
Notional Amount(l) |
Premiums Received |
Value | |||||||||||||||||||
| Call—American Tower Corp. |
Goldman Sachs International | $197.88 | 7/21/23 | (4,104 | ) | $(795,930 | ) | $(19,178 | ) | $(12,741 | ) | |||||||||||||||
| Call—Crown Castle, Inc. |
Goldman Sachs International | 116.79 | 7/21/23 | (8,012 | ) | (912,887 | ) | (21,653 | ) | (13,011 | ) | |||||||||||||||
| Call—Digital Realty Trust, Inc. |
Goldman Sachs International | 96.68 | 7/21/23 | (10,270 | ) | (1,169,445 | ) | (23,020 | ) | (180,991 | ) | |||||||||||||||
| Call—Equinix, Inc. |
Goldman Sachs International | 739.72 | 7/21/23 | (841 | ) | (659,294 | ) | (17,100 | ) | (41,466 | ) | |||||||||||||||
| Call—Extra Space Storage, Inc. |
Goldman Sachs International | 151.85 | 7/21/23 | (2,251 | ) | (335,061 | ) | (7,934 | ) | (3,560 | ) | |||||||||||||||
| Call—Invitation Homes, Inc. |
Goldman Sachs International | 35.13 | 7/21/23 | (35,249 | ) | (1,212,566 | ) | (22,457 | ) | (13,007 | ) | |||||||||||||||
| Description | Counterparty | Exercise Price |
Expiration Date |
Number of Contracts |
Notional Amount(l) |
Premiums Received |
Value | |||||||||||||||||||
| Call—Kimco Realty Corp. |
Goldman Sachs International | $19.04 | 7/21/23 | (9,806 | ) | $(193,374 | ) | $(4,275 | ) | $(8,967 | ) | |||||||||||||||
| Call—Mid‑America Apartment Communities, Inc. |
Goldman Sachs International | 152.57 | 7/21/23 | (4,882 | ) | (741,381 | ) | (16,783 | ) | (11,117 | ) | |||||||||||||||
| Call—Prologis, Inc. |
Goldman Sachs International | 126.86 | 7/21/23 | (17,157 | ) | (2,103,963 | ) | (56,584 | ) | (16,606 | ) | |||||||||||||||
| Call—Public Storage |
Goldman Sachs International | 288.35 | 7/21/23 | (975 | ) | (284,583 | ) | (7,306 | ) | (7,690 | ) | |||||||||||||||
| Call—Realty Income Corp. |
Goldman Sachs International | 61.14 | 7/21/23 | (7,537 | ) | (450,637 | ) | (8,046 | ) | (1,810 | ) | |||||||||||||||
| Call—Simon Property Group, Inc. |
Goldman Sachs International | 109.23 | 7/21/23 | (7,715 | ) | (890,928 | ) | (17,720 | ) | (55,454 | ) | |||||||||||||||
| Call—VICI Properties, Inc. |
Goldman Sachs International | 32.10 | 7/21/23 | (6,335 | ) | (199,109 | ) | (4,324 | ) | (1,488 | ) | |||||||||||||||
| Call—Welltower, Inc. |
Goldman Sachs International | 78.18 | 7/21/23 | (14,199 | ) | (1,148,557 | ) | (35,321 | ) | (50,040 | ) | |||||||||||||||
| Call—American Tower Corp. |
Goldman Sachs International | 202.53 | 8/18/23 | (3,790 | ) | (735,033 | ) | (16,705 | ) | (14,763 | ) | |||||||||||||||
| Call—Crown Castle, Inc. |
Goldman Sachs International | 119.88 | 8/18/23 | (6,579 | ) | (749,611 | ) | (17,222 | ) | (13,301 | ) | |||||||||||||||
| Call—Digital Realty Trust, Inc. |
Goldman Sachs International | 113.17 | 8/18/23 | (7,128 | ) | (811,665 | ) | (18,846 | ) | (40,001 | ) | |||||||||||||||
| Call—Equinix, Inc. |
Goldman Sachs International | 795.74 | 8/18/23 | (643 | ) | (504,073 | ) | (16,349 | ) | (14,547 | ) | |||||||||||||||
| Call—Gaming & Leisure Properties, Inc. |
Goldman Sachs International | 50.63 | 8/18/23 | (1,640 | ) | (79,474 | ) | (1,602 | ) | (309 | ) | |||||||||||||||
| Call—Kimco Realty Corp. |
Goldman Sachs International | 20.44 | 8/18/23 | (10,138 | ) | (199,921 | ) | (3,979 | ) | (4,131 | ) | |||||||||||||||
| Call—Prologis, Inc. |
Goldman Sachs International | 127.41 | 8/18/23 | (13,248 | ) | (1,624,602 | ) | (37,256 | ) | (30,112 | ) | |||||||||||||||
| Call—Public Storage |
Goldman Sachs International | 294.85 | 8/18/23 | (857 | ) | (250,141 | ) | (5,854 | ) | (6,944 | ) | |||||||||||||||
| Call—Realty Income Corp. |
Goldman Sachs International | 62.37 | 8/18/23 | (14,289 | ) | (854,339 | ) | (14,100 | ) | (5,687 | ) | |||||||||||||||
| Call—Simon Property Group, Inc. |
Goldman Sachs International | 118.09 | 8/18/23 | (7,468 | ) | (862,405 | ) | (18,211 | ) | (22,779 | ) | |||||||||||||||
| Call—VICI Properties, Inc. |
Goldman Sachs International | 32.70 | 8/18/23 | (5,950 | ) | (187,009 | ) | (4,075 | ) | (1,834 | ) | |||||||||||||||
| Call—Welltower, Inc. |
Goldman Sachs International | 81.54 | 8/18/23 | (16,103 | ) | (1,302,572 | ) | (42,520 | ) | (39,690 | ) | |||||||||||||||
| (217,166 | ) | $(19,258,560 | ) | $(458,420 | ) | $(612,046 | ) | |||||||||||||||||||
| |
||||||||||||||||||||||||||
| Notional Amount |
Fixed Rate Payable |
Fixed Payment Frequency |
Floating Rate Receivable (resets monthly)(m) |
Floating Payment Frequency |
Maturity Date |
Value | Upfront Receipts (Payments) |
Unrealized Appreciation (Depreciation) | ||||||||||||||||||
| $37,000,000 | 2.201% | Monthly | 5.060% | Monthly | 10/1/25 | $1,996,157 | $ — | $1,996,157 | ||||||||||||||||||
| 14,500,000 | 2.360% | Monthly | 5.060% | Monthly | 12/18/25 | 743,285 | — | 743,285 | ||||||||||||||||||
| 37,000,000 | 1.957% | Monthly | 5.060% | Monthly | 3/1/26 | 2,404,167 | — | 2,404,167 | ||||||||||||||||||
| 37,000,000 | 1.557% | Monthly | 5.060% | Monthly | 3/1/27 | 3,331,636 | — | 3,331,636 | ||||||||||||||||||
| |
| |||||||||||||||||||||||||
| $8,475,245 | $ — | $8,475,245 | ||||||||||||||||||||||||
| |
| |||||||||||||||||||||||||
| Counterparty | Contracts to Deliver |
In Exchange For |
Settlement Date |
Unrealized Appreciation (Depreciation) |
||||||||||||||||
| Brown Brothers Harriman |
EUR | 885,646 | USD | 945,870 | 7/5/23 | $ | (20,547 | ) | ||||||||||||
| Brown Brothers Harriman |
GBP | 1,140,479 | USD | 1,414,319 | 7/5/23 | (34,088 | ) | |||||||||||||
| Brown Brothers Harriman |
GBP | 500,000 | USD | 615,894 | 7/5/23 | (19,106 | ) | |||||||||||||
| Brown Brothers Harriman |
USD | 898,547 | GBP | 700,000 | 7/5/23 | (9,547 | ) | |||||||||||||
| Brown Brothers Harriman |
USD | 967,090 | EUR | 885,646 | 7/5/23 | (673 | ) | |||||||||||||
| Brown Brothers Harriman |
USD | 941,060 | GBP | 740,479 | 7/5/23 | (652 | ) | |||||||||||||
| Brown Brothers Harriman |
USD | 254,025 | GBP | 200,000 | 7/5/23 | (25 | ) | |||||||||||||
| Brown Brothers Harriman |
EUR | 895,393 | USD | 978,996 | 8/2/23 | 604 | ||||||||||||||
| Brown Brothers Harriman |
GBP | 727,276 | USD | 924,390 | 8/2/23 | 565 | ||||||||||||||
| $ | (83,469 | ) | ||||||||||||||||||
| |
||||||||||||||||||||
| EMTN |
Euro Medium Term Note | |
| ETF |
Exchange-Traded Fund | |
| EUR |
Euro Currency | |
| GBP |
Great British Pound | |
| LIBOR |
London Interbank Offered Rate | |
| OIS |
Overnight Indexed Swap | |
| REIT |
Real Estate Investment Trust | |
| SOFR |
Secured Overnight Financing Rate | |
| USD |
United States Dollar |
| (a) | All or a portion of the security is pledged as collateral in connection with the Fund’s revolving credit agreement. $295,522,818 in aggregate has been pledged as collateral. |
| (b) | All or a portion of the security is pledged in connection with written option contracts. $38,653,671 in aggregate has been pledged as collateral. |
| (c) | Perpetual security. Perpetual securities have no stated maturity date, but they may be called/redeemed by the issuer. |
| (d) | Security converts to floating rate after the indicated fixed-rate coupon period. |
| (e) | Securities exempt from registration under Regulation S of the Securities Act of 1933. These securities are subject to resale restrictions. Aggregate holdings amounted to $11,989,577 which represents 4.5% of the net assets of the Fund, of which 0.0% are illiquid. |
| (f) | Contingent Capital security (CoCo). CoCos are debt or preferred securities with loss absorption characteristics built into the terms of the security for the benefit of the issuer. Aggregate holdings amounted to $32,761,971 which represents 12.2% of the net assets of the Fund (7.9% of the managed assets of the Fund). |
| (g) | Securities exempt from registration under Rule 144A of the Securities Act of 1933. These securities may only be resold to qualified institutional buyers. Aggregate holdings amounted to $16,461,967 which represents 6.2% of the net assets of the Fund, of which 0.0% are illiquid. |
| (h) | Variable rate. Rate shown is in effect at June 30, 2023. |
| (i) | Security is in default. |
| (j) | Non‑income producing security. |
| (k) | Rate quoted represents the annualized seven‑day yield. |
| (l) | Represents the number of contracts multiplied by notional contract size multiplied by the underlying price. |
| (m) | Based on 1-Month USD‑SOFR‑OIS. Represents rate in effect at June 30, 2023. |
| ASSETS: |
| |||
| Investments in securities, at value (Identified cost—$445,357,302) |
$ | 417,977,277 | ||
| Cash collateral pledged for interest rate swap contracts |
2,596,072 | |||
| Cash collateral pledged for over‑the‑counter option contracts |
420,000 | |||
| Foreign currency, at value (Identified cost—$34,741) |
34,669 | |||
| Receivable for: |
||||
| Investment securities sold |
25,223,509 | |||
| Dividends and interest |
2,232,566 | |||
| Variation margin on interest rate swap contracts |
25,531 | |||
| Unrealized appreciation on forward foreign currency exchange contracts |
1,169 | |||
| Other assets |
22,606 | |||
| |
|
|||
| Total Assets |
448,533,399 | |||
| |
|
|||
| LIABILITIES: |
| |||
| Written option contracts, at value (Premiums received—$1,052,197) |
1,138,046 | |||
| Unrealized depreciation on forward foreign currency exchange contracts |
84,638 | |||
| Payable for: |
||||
| Credit agreement |
147,000,000 | |||
| Investment securities purchased |
30,881,962 | |||
| Interest expense |
754,069 | |||
| Investment management fees |
335,184 | |||
| Dividends and distributions declared |
190,737 | |||
| Administration fees |
20,111 | |||
| Other liabilities |
330,246 | |||
| |
|
|||
| Total Liabilities |
180,734,993 | |||
| |
|
|||
| NET ASSETS |
$ | 267,798,406 | ||
| |
|
|||
| NET ASSETS consist of: |
| |||
| Paid‑in capital |
$ | 324,352,642 | ||
| Total distributable earnings/(accumulated loss) |
(56,554,236 | ) | ||
| |
|
|||
| $ | 267,798,406 | |||
| |
|
|||
| NET ASSET VALUE PER SHARE: |
| |||
| ($ |
$ | |||
| |
|
|||
| MARKET PRICE PER SHARE |
$ | |||
| |
|
|||
| MARKET PRICE PREMIUM (DISCOUNT) TO NET ASSET VALUE PER SHARE |
( |
)% | ||
| |
|
|||
| Investment Income: |
| |||
| Dividend income |
$ | 5,573,171 | ||
| Interest income (net of $6,240 of foreign withholding tax) |
2,814,407 | |||
| |
|
|||
| Total Investment Income |
8,387,578 | |||
| |
|
|||
| Expenses: |
| |||
| Interest expense |
4,157,732 | |||
| Investment management fees |
2,042,829 | |||
| Administration fees |
158,085 | |||
| Professional fees |
71,156 | |||
| Shareholder reporting expenses |
49,589 | |||
| Custodian fees and expenses |
22,771 | |||
| Transfer agent fees and expenses |
12,751 | |||
| Trustees’ fees and expenses |
3,809 | |||
| Miscellaneous |
22,560 | |||
| |
|
|||
| Total Expenses |
6,541,282 | |||
| |
|
|||
| Net Investment Income (Loss) |
1,846,296 | |||
| |
|
|||
| Net Realized and Unrealized Gain (Loss): |
| |||
| Net realized gain (loss) on: |
| |||
| Investments in securities |
(19,744,368 | ) | ||
| Written option contracts |
3,126,478 | |||
| Interest rate swap contracts |
1,666,898 | |||
| Forward foreign currency exchange contracts |
(34,368 | ) | ||
| Foreign currency transactions |
4,848 | |||
| |
|
|||
| Net realized gain (loss) |
(14,980,512 | ) | ||
| |
|
|||
| Net change in unrealized appreciation (depreciation) on: |
| |||
| Investments in securities |
31,165,161 | |||
| Written option contracts |
(643,076 | ) | ||
| Interest rate swap contracts |
475,737 | |||
| Forward foreign currency exchange contracts |
(66,410 | ) | ||
| Foreign currency translations |
440 | |||
| |
|
|||
| Net change in unrealized appreciation (depreciation) |
30,931,852 | |||
| |
|
|||
| Net Realized and Unrealized Gain (Loss) |
15,951,340 | |||
| |
|
|||
| Net Increase (Decrease) in Net Assets Resulting from Operations |
17,797,636 | |||
| |
|
|||
| For the Six Month Ended June 30, 2023 |
For the Period February 24, 2022(a) through December 31, 2022 |
|||||||
| Change in Net Assets: |
| |||||||
| From Operations: |
||||||||
| Net investment income (loss) |
$ | 1,846,296 | $ | 5,755,044 | ||||
| Net realized gain (loss) |
(14,980,512 | ) | (14,710,246 | ) | ||||
| Net change in unrealized appreciation (depreciation) |
30,931,852 | (50,006,228 | ) | |||||
| |
|
|
|
|||||
| Net increase (decrease) in net assets resulting from operations |
17,797,636 | (58,961,430 | ) | |||||
| |
|
|
|
|||||
| Distributions to shareholders |
(10,455,120 | ) | (6,149,815 | ) | ||||
| Tax return of capital to shareholders |
— | (9,532,865 | ) | |||||
| |
|
|
|
|||||
| Total Distributions |
(10,455,120 | ) | (15,682,680 | ) | ||||
| |
|
|
|
|||||
| Capital Stock Transactions: |
||||||||
| Increase (decrease) in net assets from Fund share transactions |
— | 335,000,000 | ||||||
| |
|
|
|
|||||
| Total increase (decrease) in net assets |
7,342,516 | 260,355,890 | ||||||
| Net Assets: |
||||||||
| Beginning of period |
260,455,890 | 100,000 | ||||||
| |
|
|
|
|||||
| End of period |
$ | 267,798,406 | $ | 260,455,890 | ||||
| |
|
|
|
|||||
| (a) | Commencement of investment operations. |
| Increase (Decrease) in Cash: |
| |||
| Cash Flows from Operating Activities: |
| |||
| Net increase (decrease) in net assets resulting from operations |
$ | 17,797,636 | ||
| Adjustments to reconcile net increase (decrease) in net assets resulting from operations to net cash provided by operating activities: |
||||
| Purchases of long-term investments |
(115,009,009 | ) | ||
| Proceeds from sales and maturities of long-term investments |
113,738,258 | |||
| Net purchases, sales and maturities of short-term investments |
3,751,807 | |||
| Net amortization of premium on investments in securities |
474,801 | |||
| Net decrease in dividends and interest receivable and other assets |
372,219 | |||
| Net increase in interest expense payable, accrued expenses and other liabilities |
122,145 | |||
| Net decrease in payable for variation margin on interest rate swap contracts |
(18,329 | ) | ||
| Net decrease in premiums received from written option contracts |
(12,336 | ) | ||
| Net change in unrealized depreciation on written option contracts |
643,076 | |||
| Net change in unrealized appreciation on investments in securities |
(31,165,161 | ) | ||
| Net change in unrealized depreciation on forward foreign currency exchange contracts |
66,410 | |||
| Net realized loss on investments in securities |
19,744,368 | |||
| |
|
|||
| Cash provided by operating activities |
10,505,885 | |||
| |
|
|||
| Cash Flows from Financing Activities: |
| |||
| Dividends and distributions paid |
(10,495,179 | ) | ||
| |
|
|||
| Increase (decrease) in cash and restricted cash |
10,706 | |||
| Cash and restricted cash at beginning of period (including foreign currency) |
3,040,035 | |||
| |
|
|||
| Cash and restricted cash at end of period (including foreign currency) |
$ | 3,050,741 | ||
| |
|
|||
| Restricted cash |
$ | 3,016,072 | ||
| Foreign currency |
34,669 | |||
| |
|
|||
| Total cash and restricted cash shown on the Statement of Cash Flows |
$ | 3,050,741 | ||
| |
|
| Per Share Operating Data: | For the Six Months Ended June 30, 2023 |
For the Period February 24, 2022(a) through December 31, 2022 |
||||||
| Net asset value, beginning of period |
$15.54 | $20.00 | ||||||
| |
|
|
|
|||||
| Income (loss) from investment operations: |
| |||||||
| Net investment income (loss)(b) |
0.11 | 0.40 | ||||||
| Net realized and unrealized gain (loss) |
0.95 | (3.92 | ) | |||||
| |
|
|
|
|||||
| Total from investment operations |
1.06 | (3.52 | ) | |||||
| |
|
|
|
|||||
| Less dividends and distributions to shareholders from: |
| |||||||
| Net investment income |
(0.62 | ) | (0.27 | ) | ||||
| Tax return of capital |
— | (0.67 | ) | |||||
| |
|
|
|
|||||
| Total dividends and distributions to shareholders |
(0.62 | ) | (0.94 | ) | ||||
| |
|
|
|
|||||
| Net increase (decrease) in net asset value |
0.44 | (4.46 | ) | |||||
| |
|
|
|
|||||
| Net asset value, end of period |
$15.98 | $15.54 | ||||||
| |
|
|
|
|||||
| Market value, end of period |
$13.78 | $13.48 | ||||||
| |
|
|
|
|||||
| Total net asset value return(c) |
7.50 | %(d) | –17.52 | %(d) | ||||
| |
|
|
|
|||||
| Total market value return(c) |
6.87 | %(d) | –28.46 | %(d) | ||||
| |
|
|
|
|||||
| Ratios/Supplemental Data: |
||||||||
| Net assets, end of period (in millions) |
$267.8 | $260.5 | ||||||
| |
|
|
|
|||||
| Ratios to average daily net assets: |
| |||||||
| Expenses |
4.98 | %(e) | 3.14 | %(e) | ||||
| |
|
|
|
|||||
| Ratio of expenses to average daily net assets (excluding interest expense) |
1.81 | %(e) | 1.74 | %(e) | ||||
| |
|
|
|
|||||
| Ratio of net investment income (loss) to average daily net assets |
1.41 | %(e) | 2.32 | %(e) | ||||
| |
|
|
|
|||||
| Ratio of expenses to average daily managed assets(f) |
3.20 | %(e) | 2.13 | %(e) | ||||
| |
|
|
|
|||||
| Portfolio turnover rate |
34 | %(d) | 38 | %(d) | ||||
| |
|
|
|
|||||
| Revolving Credit Agreement | For the Six Months Ended June 30, 2023 |
For the Period February 24, 2022(a) through December 31, 2022 |
||||||
| Asset coverage ratio for revolving credit agreement |
282 | % | 277 | % | ||||
| |
|
|
|
|||||
| Asset coverage per $1,000 for revolving credit agreement |
$2,822 | $2,772 | ||||||
| |
|
|
|
|||||
| Amount of loan outstanding (in millions) |
$147.0 | $147.0 | ||||||
| |
|
|
|
|||||
| (a) | Commencement of investment operations. |
| (b) | Calculation based on average shares outstanding. |
| (c) | Total net asset value return measures the change in net asset value per share over the year indicated. Total market value return is computed based upon the Fund’s market price per share and excludes the effects of brokerage commissions. Dividends and distributions are assumed, for purposes of these calculations, to be reinvested at prices obtained under the Fund’s dividend reinvestment plan. |
| (d) | Not annualized. |
| (e) | Ratios for periods less than one year are annualized. |
| (f) | Average daily managed assets represent net assets plus the outstanding balance of the credit agreement. |
| • | Level 1—quoted prices in active markets for identical investments |
| • | Level 2—other significant observable inputs (including quoted prices for similar investments, interest rates, credit risk, etc.) |
| • | Level 3—significant unobservable inputs (including the Fund’s own assumptions in determining the fair value of investments) |
| Quoted Prices in Active Markets for Identical Investments (Level 1) |
Other Significant Observable Inputs (Level 2) |
Significant Unobservable Inputs (Level 3) |
Total | |||||||||||||
| Common Stock |
$ | 281,579,025 | $ | — | $ | — | $ | 281,579,025 | ||||||||
| Exchange-Traded Funds |
2,269,800 | — | — | 2,269,800 | ||||||||||||
| Preferred Securities— Exchange-Traded |
21,640,464 | — | — | 21,640,464 | ||||||||||||
| Preferred Securities— Over‑the‑Counter |
— | 89,676,863 | — | 89,676,863 | ||||||||||||
| Corporate Bonds |
— | 10,188,037 | — | 10,188,037 | ||||||||||||
| Short-Term Investments |
— | 12,623,088 | — | 12,623,088 | ||||||||||||
| |
|
|
|
|
|
|
|
|||||||||
| Total Investments in Securitiesa |
$ | 305,489,289 | $ | 112,487,988 | $ | — | $ | 417,977,277 | ||||||||
| |
|
|
|
|
|
|
|
|||||||||
| Forward Foreign Currency Exchange Contracts |
$ | — | $ | 1,169 | $ | — | $ | 1,169 | ||||||||
| Interest Rate Swap Contracts |
— | 8,475,245 | — | 8,475,245 | ||||||||||||
| |
|
|
|
|
|
|
|
|||||||||
| Total Derivative Assets(a) |
$ | — | $ | 8,476,414 | $ | — | $ | 8,476,414 | ||||||||
| |
|
|
|
|
|
|
|
|||||||||
| Forward Foreign Currency Exchange Contracts |
$ | — | $ | (84,638 | ) | $ | — | $ | (84,638 | ) | ||||||
| Written Option Contracts |
(526,000 | ) | (612,046 | ) | — | (1,138,046 | ) | |||||||||
| |
|
|
|
|
|
|
|
|||||||||
| Total Derivative Liabilities(a) |
$ | (526,000 | ) | $ | (696,684 | ) | $ | — | $ | (1,222,684 | ) | |||||
| |
|
|
|
|
|
|
|
|||||||||
| (a) | Portfolio holdings are disclosed individually on the Schedule of Investments. |
| Ex‑Date | Record Date | Payable Date | Amount | |||||||||||
| 7/11/23 | 7/12/23 | 7/31/23 | $ | 0.110 | ||||||||||
| 8/15/23 | 8/16/23 | 8/31/23 | $ | 0.110 | ||||||||||
| 9/12/23 | 9/13/23 | 9/29/23 | $ | 0.110 | ||||||||||
| Assets |
Liabilities |
|||||||||||
| Derivatives |
Location |
Fair Value | Location |
Fair Value | ||||||||
| Equity Risk: |
||||||||||||
| Written Option Contracts— Exchange-Traded(a) |
— | $ | — | Written option contracts, at value |
$ | 526,000 | ||||||
| Written Option Contracts— Over‑the‑Counter |
— | — | Written option contracts, at value |
612,046 | ||||||||
| Foreign Currency Exchange Risk: | ||||||||||||
| Forward Foreign Currency Exchange Contracts(b) |
Unrealized appreciation | 1,169 | Unrealized depreciation | 84,638 | ||||||||
| Interest Rate Risk: |
||||||||||||
| Interest Rate Swap Contractsa |
Receivable for variation margin on interest rate swap contracts | 8,475,245 | (c) | — | — | |||||||
| (a) | Not subject to a master netting agreement or another similar arrangement. |
| (b) | Forward foreign currency exchange contracts executed with Brown Brothers Harriman are not subject to a master netting agreement or another similar arrangement. |
| (c) | Amount represents the cumulative net appreciation on interest rate swap contracts as reported on the Schedule of Investments. The Statement of Assets and Liabilities only reflects the current day variation margin receivable from the broker. |
| Derivatives |
Location |
Realized Gain (Loss) |
Change in Unrealized Appreciation (Depreciation) |
|||||||
| Equity Risk: |
||||||||||
| Purchased Option Contracts(a) |
Net Realized and Unrealized Gain (Loss) | $ | (34,287 | ) | $ | — | ||||
| Written Option Contracts |
Net Realized and Unrealized Gain (Loss) | 3,126,478 | (643,076 | ) | ||||||
| Foreign Currency Exchange Risk: | ||||||||||
| Forward Foreign Currency Exchange Contracts |
Net Realized and Unrealized Gain (Loss) | (34,368 | ) | (66,410 | ) | |||||
| Interest Rate Risk: |
||||||||||
| Interest Rate Swap Contracts |
Net Realized and Unrealized Gain (Loss) | 1,666,898 | 475,737 | |||||||
| (a) | Purchased option contracts are included in net realized gain (loss) and change in unrealized appreciation (depreciation) on investments in securities. |
| Derivative Financial Instruments | Assets | Liabilities | ||||||
| Equity Risk: |
||||||||
| Written Option Contracts—Over‑the‑Counter |
$ | — | $ | 612,046 | ||||
| Counterparty | Gross Amount of Liabilities Presented in the Statement of Assets and Liabilities |
Financial Instruments and Derivatives Available for Offset |
Collateral Received(a) |
Net Amount of Derivative Liabilities(b) |
||||||||||||
| Goldman Sachs International |
$ | 612,046 | $ | — | $ | (420,000 | ) | $ | 192,046 | |||||||
| (a) | Collateral received or pledged is limited to the net derivative asset or net derivative liability amounts. Actual collateral amounts received or pledged may be higher than amounts above. |
| (b) | Net amount represents the net receivable from the counterparty or net payable due to the counterparty in the event of default. |
| Purchased Option Contracts(a)(b) |
Written Option Contracts(b) |
Interest Rate Swap Contracts |
Forward Foreign Currency Exchange Contracts |
|||||||||||||
| Average Notional Amount |
$ | 1,177,430 | $ | 75,126,306 | $ | 125,500,000 | $ | 2,077,778 | ||||||||
| (a) | Average notional amounts represent the average for all months in which the Fund had option contracts. For purchased option contracts, this represents the period March 24, 2023 through March 30, 2023. |
| (b) | Notional amount is calculated using the number of contracts multiplied by notional contract size multiplied by the underlying price. |
| Cost of investments in securities for federal income tax purposes |
$ | 445,357,302 | ||
| |
|
|||
| Gross unrealized appreciation on investments |
$ | 13,539,920 | ||
| Gross unrealized depreciation on investments |
(32,614,018 | ) | ||
| |
|
|||
| Net unrealized appreciation (depreciation) on investments |
$ | (19,074,098 | ) | |
| |
|
| Common Shares | Shares Voted For |
Authority Withheld |
||||||
| To elect Trustees: |
||||||||
| Michael G. Clark |
12,840,081 | 1,616,896 | ||||||
| Dean A. Junkans |
13,850,702 | 606,275 | ||||||
| Ramona Rogers-Windsor |
12,846,670 | 1,610,307 | ||||||
| Facts | What Does Cohen & Steers Do With Your Personal Information? | |
| Why? | Financial companies choose how they share your personal information. Federal law gives consumers the right to limit some but not all sharing. Federal law also requires us to tell you how we collect, share, and protect your personal information. Please read this notice carefully to understand what we do. | |
| What? | The types of personal information we collect and share depend on the product or service you have with us. This information can include: • Social Security number and account balances • Transaction history and account transactions • Purchase history and wire transfer instructions | |
| How? | All financial companies need to share customers’ personal information to run their everyday business. In the section below, we list the reasons financial companies can share their customers’ personal information; the reasons Cohen & Steers chooses to share; and whether you can limit this sharing. | |
| Reasons we can share your personal information | Does Cohen & Steers share? |
Can you limit this sharing? | ||
| For our everyday business purposes— such as to process your transactions, maintain your account(s), respond to court orders and legal investigations, or reports to credit bureaus |
Yes | No | ||
| For our marketing purposes— to offer our products and services to you |
Yes | No | ||
| For joint marketing with other financial companies— | No | We don’t share | ||
| For our affiliates’ everyday business purposes— information about your transactions and experiences |
No | We don’t share | ||
| For our affiliates’ everyday business purposes— information about your creditworthiness |
No | We don’t share | ||
| For our affiliates to market to you— | No | We don’t share | ||
| For non‑affiliates to market to you— | No | We don’t share | ||
| Questions? Call 800.330.7348 | ||||
| Who we are | ||
| Who is providing this notice? | Cohen & Steers Capital Management, Inc., Cohen & Steers Asia Limited, Cohen & Steers Japan Limited, Cohen & Steers UK Limited, Cohen & Steers Ireland Limited, Cohen & Steers Singapore Private Limited, Cohen & Steers Securities, LLC, Cohen & Steers Private Funds and Cohen & Steers Open and Closed‑End Funds (collectively, Cohen & Steers). | |
| What we do | ||
| How does Cohen & Steers protect my personal information? | To protect your personal information from unauthorized access and use, we use security measures that comply with federal law. These measures include computer safeguards and secured files and buildings. We restrict access to your information to those employees who need it to perform their jobs, and also require companies that provide services on our behalf to protect your information. | |
| How does Cohen & Steers collect my personal information? | We collect your personal information, for example, when you: • Open an account or buy securities from us • Provide account information or give us your contact information • Make deposits or withdrawals from your account We also collect your personal information from other companies. | |
| Why can’t I limit all sharing? | Federal law gives you the right to limit only: • sharing for affiliates’ everyday business purposes—information about your creditworthiness • affiliates from using your information to market to you • sharing for non‑affiliates to market to you State law and individual companies may give you additional rights to limit sharing. | |
| Definitions | ||
| Affiliates | Companies related by common ownership or control. They can be financial and nonfinancial companies. • Cohen & Steers does not share with affiliates. | |
| Non‑affiliates | Companies not related by common ownership or control. They can be financial and nonfinancial companies. • Cohen & Steers does not share with non‑affiliates. | |
| Joint marketing | A formal agreement between non‑affiliated financial companies that together market financial products or services to you. • Cohen & Steers does not jointly market. | |
| • | Designed for investors seeking total return, investing primarily in U.S. real estate securities |
| • | Symbols: CSJAX, CSJCX, CSJIX, CSRSX, CSJRX, CSJZX |
| • | Designed for investors seeking total return, investing primarily in U.S. real estate securities |
| • | Symbols: CSEIX, CSCIX, CREFX, CSDIX, CIRRX, CSZIX |
| • | Designed for institutional investors seeking total return, investing primarily in U.S. real estate securities |
| • | Symbol: CSRIX |
| • | Designed for investors seeking total return, investing primarily in global real estate equity securities |
| • | Symbols: CSFAX, CSFCX, CSSPX, GRSRX, CSFZX |
| • | Designed for investors seeking total return, investing primarily in international (non‑U.S.) real estate securities |
| • | Symbols: IRFAX, IRFCX, IRFIX, IRFRX, IRFZX |
| • | Designed for investors seeking total return and the maximization of real returns during inflationary environments by investing primarily in real assets |
| • | Symbols: RAPAX, RAPCX, RAPIX, RAPRX, RAPZX |
| • | Designed for investors seeking total return (high current income and capital appreciation), investing primarily in preferred and debt securities issued by U.S. and non‑U.S. companies |
| • | Symbols: CPXAX, CPXCX, CPXFX, CPXIX, CPRRX, CPXZX |
| • | Designed for investors seeking high current income and capital preservation by investing in low‑duration preferred and other income securities issued by U.S. and non‑U.S. companies |
| • | Symbols: LPXAX, LPXCX, LPXFX, LPXIX, LPXRX, LPXZX |
| • | Designed for investors seeking total return, investing primarily in midstream energy master limited partnership (MLP) units and related stocks |
| • | Symbols: MLOAX, MLOCX, MLOIX, MLORX, MLOZX |
| • | Designed for investors seeking total return, investing primarily in global infrastructure securities |
| • | Symbols: CSUAX, CSUCX, CSUIX, CSURX, CSUZX |
| • | Designed for investors seeking high current income and capital appreciation, investing in equity, preferred and debt securities, focused on real assets and alternative income strategies |
| • | Symbols: DVFAX, DVFCX, DVFIX, DVFRX, DVFZX |
| New York Stock Exchange Symbol: | RLTY |

Item 2. Code of Ethics.
Not applicable.
Item 3. Audit Committee Financial Expert.
Not applicable.
Item 4. Principal Accountant Fees and Services.
Not applicable.
Item 5. Audit Committee of Listed Registrants.
Not applicable.
Item 6. Schedule of Investments.
Included in Item 1 above.
Item 7. Disclosure of Proxy Voting Policies and Procedures for Closed-End Management Investment Companies.
Not Applicable.
Item 8. Portfolio Managers of Closed-End Investment Companies.
(a) Not Applicable.
(b) The registrant has not had any change in the portfolio managers identified in response to paragraph (a)(1) of this item in the registrant’s most recent annual report on Form N-CSR.
Item 9. Purchases of Equity Securities by Closed-End Management Investment Company and Affiliated Purchasers.
None.
Item 10. Submission of Matters to a Vote of Security Holders.
None.
Item 11. Controls and Procedures.
(a) The registrant’s principal executive officer and principal financial officer have concluded that the registrant’s disclosure controls and procedures are reasonably designed to ensure that information required to be disclosed by the registrant in this Form N-CSR was recorded,
processed, summarized and reported within the time periods specified in the Securities and Exchange Commission’s rules and forms, based upon such officers’ evaluation of these controls and procedures as of a date within 90 days of the filing date of this report.
(b) There were no changes in the registrant’s internal control over financial reporting that occurred during the period covered by this report that have materially affected, or are reasonably likely to materially affect, the registrant’s internal control over financial reporting.
Item 12. Disclosure of Securities Lending Activities for Closed-End Management Investment Companies.
(a) The Fund did not engage in any securities lending activity during the fiscal year ended December 31, 2022.
(b) The Fund did not engage in any securities lending activity and did not engage a securities lending agent during the fiscal year ended December 31, 2022.
Item 13. Exhibits.
(a)(1) Not Applicable.
(a)(3) Not applicable.
(a)(4) Not applicable.
(c) Not applicable.
SIGNATURES
Pursuant to the requirements of the Securities Exchange Act of 1934 and the Investment Company Act of 1940, the registrant has duly caused this report to be signed on its behalf by the undersigned, thereunto duly authorized.
COHEN & STEERS REAL ESTATE OPPORTUNITIES AND INCOME FUND
| By: | /s/ James Giallanza | |||
| Name: James Giallanza Title: Principal Executive Officer (President and Chief Executive Officer) | ||||
| Date: | September 1, 2023 | |||
Pursuant to the requirements of the Securities Exchange Act of 1934 and the Investment Company Act of 1940, this report has been signed below by the following persons on behalf of the registrant and in the capacities and on the dates indicated.
| By: | /s/ James Giallanza | |||
| Name: James Giallanza Title: Principal Executive Officer (President and Chief Executive Officer) | ||||
| By: | /s/ Albert Laskaj | |||
| Name: Albert Laskaj Title: Principal Financial Officer (Treasurer and Chief Financial Officer) | ||||
| Date: | September 1, 2023 | |||
EX-99.CERT
EXHIBIT 13 (a)(2)
RULE 30a-2(a) CERTIFICATIONS
I, James Giallanza, certify that:
| 1. | I have reviewed this report on Form N-CSR of Cohen & Steers Real Estate Opportunities and Income Fund; |
| 2. | Based on my knowledge, this report does not contain any untrue statement of a material fact or omit to state a material fact necessary to make the statements made, in light of the circumstances under which such statements were made, not misleading with respect to the period covered by this report; |
| 3. | Based on my knowledge, the financial statements, and other financial information included in this report, fairly present in all material respects the financial condition, results of operations, changes in net assets, and cash flows (if the financial statements are required to include a statement of cash flows) of the registrant as of, and for, the periods presented in this report; |
| 4. | The registrant’s other certifying officer and I are responsible for establishing and maintaining disclosure controls and procedures (as defined in Rule 30a-3(c) under the Investment Company Act of 1940) and internal control over financial reporting (as defined in Rule 30a-3(d) under the Investment Company Act of 1940) for the registrant and have: |
| (a) | designed such disclosure controls and procedures, or caused such disclosure controls and procedures to be designed under our supervision, to ensure that material information relating to the registrant, including its consolidated subsidiaries, is made known to us by others within those entities, particularly during the period in which this report is being prepared; |
| (b) | designed such internal control over financial reporting, or caused such internal control over financial reporting to be designed under our supervision, to provide reasonable assurance regarding the reliability of financial reporting and the preparation of financial statements for external purposes in accordance with generally accepted accounting principles; |
| (c) | evaluated the effectiveness of the registrant’s disclosure controls and procedures and presented in this report our conclusions about the effectiveness of the disclosure controls and procedures, as of a date within 90 days prior to the filing date of this report based on such evaluation; and |
| (d) | disclosed in this report any change in the registrant’s internal control over financial reporting that occurred during the period covered by this report that has materially affected, or is reasonably likely to materially affect, the registrant’s internal control over financial reporting; and |
| 5. | The registrant’s other certifying officer and I have disclosed to the registrant’s auditors and the audit committee of the registrant’s board of directors (or persons performing the equivalent functions): |
| (a) | all significant deficiencies and material weaknesses in the design or operation of internal control over financial reporting which are reasonably likely to adversely affect the registrant’s ability to record, process, summarize, and report financial information; and |
| (b) | any fraud, whether or not material, that involves management or other employees who have a significant role in the registrant’s internal control over financial reporting. |
| Date: September 1, 2023 |
| /s/ James Giallanza |
| James Giallanza |
| Principal Executive Officer |
| (President and Chief Executive Officer) |
EX-99.CERT
EXHIBIT 13 (a)(2)
RULE 30a-2(a) CERTIFICATIONS
I, Albert Laskaj, certify that:
| 1. | I have reviewed this report on Form N-CSR of Cohen & Steers Real Estate Opportunities and Income Fund; |
| 2. | Based on my knowledge, this report does not contain any untrue statement of a material fact or omit to state a material fact necessary to make the statements made, in light of the circumstances under which such statements were made, not misleading with respect to the period covered by this report; |
| 3. | Based on my knowledge, the financial statements, and other financial information included in this report, fairly present in all material respects the financial condition, results of operations, changes in net assets, and cash flows (if the financial statements are required to include a statement of cash flows) of the registrant as of, and for, the periods presented in this report; |
| 4. | The registrant’s other certifying officer and I are responsible for establishing and maintaining disclosure controls and procedures (as defined in Rule 30a-3(c) under the Investment Company Act of 1940) and internal control over financial reporting (as defined in Rule 30a-3(d) under the Investment Company Act of 1940) for the registrant and have: |
| (a) | designed such disclosure controls and procedures, or caused such disclosure controls and procedures to be designed under our supervision, to ensure that material information relating to the registrant, including its consolidated subsidiaries, is made known to us by others within those entities, particularly during the period in which this report is being prepared; |
| (b) | designed such internal control over financial reporting, or caused such internal control over financial reporting to be designed under our supervision, to provide reasonable assurance regarding the reliability of financial reporting and the preparation of financial statements for external purposes in accordance with generally accepted accounting principles; |
| (c) | evaluated the effectiveness of the registrant’s disclosure controls and procedures and presented in this report our conclusions about the effectiveness of the disclosure controls and procedures, as of a date within 90 days prior to the filing date of this report based on such evaluation; and |
| (d) | disclosed in this report any change in the registrant’s internal control over financial reporting that occurred during the period covered by this report that has materially affected, or is reasonably likely to materially affect, the registrant’s internal control over financial reporting; and |
| 5. | The registrant’s other certifying officer and I have disclosed to the registrant’s auditors and the audit committee of the registrant’s board of directors (or persons performing the equivalent functions): |
| (a) | all significant deficiencies and material weaknesses in the design or operation of internal control over financial reporting which are reasonably likely to adversely affect the registrant’s ability to record, process, summarize, and report financial information; and |
| (b) | any fraud, whether or not material, that involves management or other employees who have a significant role in the registrant’s internal control over financial reporting. |
| Date: September 1, 2023 |
| /s/ Albert Laskaj |
| Albert Laskaj |
| Principal Financial Officer |
| (Treasurer and Chief Financial Officer) |
EX-99.906CERT
EXHIBIT 13 (b)
RULE 30a-2(b) CERTIFICATIONS
In connection with the Report of Cohen & Steers Real Estate Opportunities and Income Fund (the “Company”) on Form N-CSR as filed with the Securities and Exchange Commission on the date hereof (the “Report”), I, James Giallanza, Principal Executive Officer of the Company, certify, pursuant to 18 U.S.C. §1350, as adopted pursuant to Section 906 of the Sarbanes-Oxley Act of 2002, that:
| (1) | The Report fully complies with the requirements of Section 13(a) or 15(d) of the Securities Exchange Act of 1934, as applicable; and |
| (2) | The information contained in the Report fairly presents, in all material respects, the financial condition and results of operations of the Company. |
| /s/ James Giallanza |
| James Giallanza Principal Executive Officer (President and Chief Executive Officer) |
| Date: September 1, 2023 |
EX-99.906CERT
EXHIBIT 13 (b)
RULE 30a-2(b) CERTIFICATIONS
In connection with the Report of Cohen & Steers Real Estate Opportunities and Income Fund (the “Company”) on Form N-CSR as filed with the Securities and Exchange Commission on the date hereof (the “Report”), I, Albert Laskaj, Principal Financial Officer of the Company, certify, pursuant to 18 U.S.C. §1350, as adopted pursuant to Section 906 of the Sarbanes-Oxley Act of 2002, that:
| (1) | The Report fully complies with the requirements of Section 13(a) or 15(d) of the Securities Exchange Act of 1934, as applicable; and |
| (2) | The information contained in the Report fairly presents, in all material respects, the financial condition and results of operations of the Company. |
| /s/ Albert Laskaj |
| Albert Laskaj Principal Financial Officer (Treasurer and Chief Financial Officer) |
| Date: September 1, 2023 |
N-2 |
6 Months Ended |
|---|---|
|
Jun. 30, 2023
$ / shares
shares
| |
| Cover [Abstract] | |
| Entity Central Index Key | 0001866874 |
| Amendment Flag | false |
| Document Type | N-CSRS |
| Entity Registrant Name | Cohen & Steers Real Estate Opportunities & Income Fund |
| General Description of Registrant [Abstract] | |
| Investment Objectives and Practices [Text Block] | The Fund’s primary investment objective is high current income. The Fund’s secondary investment objective is capital appreciation. |
| Risk Factors [Table Text Block] | Note 8. Other Risks Market Price Discount from Net Asset Value Risk: Shares of closed‑end investment companies frequently trade at a discount from their NAV. This characteristic is a risk separate and distinct from the risk that NAV could decrease as a result of investment activities. Whether investors will realize gains or losses upon the sale of the shares will depend not upon the Fund’s NAV but entirely upon whether the market price of the shares at the time of sale is above or below the investor’s purchase price for the shares. Because the market price of the shares is determined by factors such as relative supply of and demand for shares in the market, general market and economic conditions, and other factors beyond the control of the Fund, Fund shares may trade at, above or below NAV. Non‑Diversified Status Risk: Because the Fund, as a non‑diversified investment company, may invest in a smaller number of individual issuers than a diversified investment company, an investment in the Fund presents greater risk to you than an investment in a diversified company. Investing in Real Estate Securities Risk: Risks of investing in real estate securities are similar to those associated with direct investments in real estate, including falling property values due to increasing vacancies or declining rents resulting from economic, legal, political or technological developments, lack of liquidity, limited diversification and sensitivity to certain economic factors such as interest rate changes and market recessions. Foreign securities involve special risks, including currency fluctuations, lower liquidity, political and economic uncertainties, and differences in accounting standards. Some international securities may represent small- and medium‑sized companies, which may be more susceptible to price volatility and less liquidity than larger companies. Common Stock Risk: While common stocks have historically generated higher average returns than fixed-income securities over the long-term, common stocks have also experienced significantly more volatility in those returns, although under certain market conditions, fixed-income investments may have comparable or greater price volatility. The value of common stocks and other equity securities will fluctuate in response to developments concerning the company, political and regulatory circumstances, the stock market, and the economy. In the short term, stock prices can fluctuate dramatically in response to these developments. Different parts of the market and different types of equity securities can react differently to these developments. For example, stocks of large companies can react differently than stocks of smaller companies, and value stocks (stocks of companies that are undervalued by various measures and have potential for long-term capital appreciation), can react differently from growth stocks (stocks of companies with attractive cash flow returns on invested capital and earnings that are expected to grow). These developments can affect a single company, all companies within the same industry, economic sector or geographic region, or the stock market as a whole. Real Estate Market Risk: Since the Fund concentrates its assets in companies in the real estate industry, an investment in the Fund will be closely linked to the performance of the real estate markets. Risks of investing in real estate securities include falling property values due to increasing vacancies, declining rents resulting from economic, legal, tax, political or technological developments, lack of liquidity, limited diversification, and sensitivity to certain economic factors such as interest-rate changes and market recessions. Real estate company prices also may drop because of the failure of borrowers to pay their loans and poor management, and residential developers, in particular, could be negatively impacted by falling home prices, slower mortgage origination and rising construction costs. The risks of investing in REITs are similar to those associated with direct investments in real estate securities. REIT Risk: In addition to the risks of securities linked to the real estate industry, REITs are subject to certain other risks related to their structure and focus. REITs are dependent upon management skills and generally may not be diversified. REITs are also subject to heavy cash flow dependency, defaults by borrowers and self-liquidation. In addition, REITs could possibly fail to (i) qualify for pass-through of income under applicable tax law, or (ii) maintain their exemptions from registration under the 1940 Act. The above factors may also adversely affect a borrower’s or a lessee’s ability to meet its obligations to the REIT. In the event of a default by a borrower or lessee, the REIT may experience delays in enforcing its rights as a mortgagee or lessor and may incur substantial costs associated with protecting its investments. Small- and Medium‑Sized Companies Risk: Real estate companies in the industry tend to be small- to medium‑sized companies in relation to the equity markets as a whole. There may be less trading in a smaller company’s stock, which means that buy and sell transactions in that stock could have a larger impact on the stock’s price than is the case with larger company stocks. Smaller companies also may have fewer lines of business so that changes in any one line of business may have a greater impact on a smaller company’s stock price than is the case for a larger company. Further, smaller company stocks may perform differently in different cycles than larger company stocks. Accordingly, real estate company shares can, and at times will, perform differently than large company stocks. Preferred Securities Risk: Preferred securities are subject to credit risk, which is the risk that a security will decline in price, or the issuer of the security will fail to make dividend, interest or principal payments when due, because the issuer experiences a decline in its financial status. Preferred securities are also subject to interest rate risk and may decline in value because of changes in market interest rates. The Fund may be subject to a greater risk of rising interest rates than would normally be the case in an environment of low interest rates and the effect of potential government fiscal policy initiatives and resulting market reaction to those initiatives. In addition, an issuer may be permitted to defer or omit distributions. Preferred securities are also generally subordinated to bonds and other debt instruments in a company’s capital structure. During periods of declining interest rates, an issuer maybe able to exercise an option to redeem (call) its issue at par earlier than scheduled, and the Fund maybe forced to reinvest in lower yielding securities. Certain preferred securities may be substantially less liquid than many other securities, such as common stocks. Generally, preferred security holders have no voting rights with respect to the issuing company unless certain events occur. Certain preferred securities may give the issuers special redemption rights allowing the securities to be redeemed prior to a specified date if certain events occur, such as changes to tax or securities laws. Contingent Capital Securities Risk: Contingent capital securities (sometimes referred to as “CoCos”) are debt or preferred securities with loss absorption characteristics built into the terms of the security, for example, a mandatory conversion into common stock of the issuer under certain circumstances, such as the issuer’s capital ratio falling below a certain level. Since the common stock of the issuer may not pay a dividend, investors in these instruments could experience a reduced income rate, potentially to zero, and conversion would deepen the subordination of the investor, hence worsening the investor’s standing in a bankruptcy. Some CoCos provide for a reduction in the value or principal amount of the security (potentially to zero) under such circumstances. In March 2023, a Swiss regulator required a write-down of outstanding CoCos to zero notwithstanding the fact that the equity shares continued to exist and have economic value. It is currently unclear whether regulators of issuers in other jurisdictions will take similar actions. Notwithstanding these risks, the Fund intends to continue to invest in CoCos issued by Swiss companies and by companies in other jurisdictions. In addition, most CoCos are considered to be high yield or “junk” securities and are therefore subject to the risks of investing in below investment-grade securities. Finally, CoCo issuers can, at their discretion, suspend dividend distributions on their CoCo securities and are more likely to do so in response to negative economic conditions and/or government regulation. Omitted distributions are typically non‑cumulative and will not be paid on a future date. Any omitted distribution may negatively impact the returns or distribution rate of the Fund. Concentration Risk: Because the Fund invests at least 25% of its net assets in the financials sector, it will be more susceptible to adverse economic or regulatory occurrences affecting this sector, such as changes in interest rates, loan concentration and competition. In addition, the Fund will also be subject to the risks of investing in the individual industries and securities that comprise the financials sector, including the bank, diversified financials, real estate (including REITs) and insurance industries. To the extent that the Fund focuses its investments in other sectors or industries, such as (but not limited to) energy, industrials, utilities, pipelines, health care and telecommunications, the Fund will be subject to the risks associated with these particular sectors and industries. These sectors and industries may be adversely affected by, among others, changes in government regulation, world events and economic conditions. Credit and Below-Investment-Grade Securities Risk: Preferred securities may be rated below investment grade or may be unrated. Below-investment-grade securities, or equivalent unrated securities, which are commonly known as “high-yield bonds” or “junk bonds,” generally involve greater volatility of price and risk of loss of income and principal, and may be more susceptible to real or perceived adverse economic and competitive industry conditions than higher grade securities. It is reasonable to expect that any adverse economic conditions could disrupt the market for lower-rated securities, have an adverse impact on the value of those securities and adversely affect the ability of the issuers of those securities to repay principal and interest on those securities. Leverage Risk: The use of leverage is a speculative technique and there are special risks and costs associated with leverage. The NAV of the Fund’s shares may be reduced by the issuance and ongoing costs of leverage. So long as the Fund is able to invest in securities that produce an investment yield that is greater than the total cost of leverage, the leverage strategy will produce higher current net investment income for the shareholders. On the other hand, to the extent that the total cost of leverage exceeds the incremental income gained from employing such leverage, shareholders would realize lower net investment income. In addition to the impact on net income, the use of leverage will have an effect of magnifying capital appreciation or depreciation for shareholders. Specifically, in an up market, leverage will typically generate greater capital appreciation than if the Fund were not employing leverage. Conversely, in down markets, the use of leverage will generally result in greater capital depreciation than if the Fund had been unlevered. To the extent that the Fund is required or elects to reduce its leverage, the Fund may incur applicable breakage fees under the Fund’s credit arrangement and may need to liquidate investments, including under adverse economic conditions which may result in capital losses potentially reducing returns to shareholders. The use of leverage also results in the investment management fees payable to the investment manager being higher than if the Fund did not use leverage and can increase operating costs, which may reduce total return. There can be no assurance that a leveraging strategy will be successful during any period in which it is employed. Liquidity Risk: Liquidity risk is the risk that particular investments of the Fund may become difficult to sell or purchase. The market for certain investments may become less liquid or illiquid due to adverse changes in the conditions of a particular issuer or due to adverse market or economic conditions. In addition, dealer inventories of certain securities, which provide an indication of the ability of dealers to engage in “market making,” are at, or near, historic lows in relation to market size, which has the potential to increase price volatility in the fixed income markets in which the Fund invests. Federal banking regulations may also cause certain dealers to reduce their inventories of certain securities, which may further decrease the Fund’s ability to buy or sell such securities. As a result of this decreased liquidity, the Fund may have to accept a lower price to sell a security, sell other securities to raise cash, or give up an investment opportunity, any of which could have a negative effect on performance. Further, transactions in less liquid or illiquid securities may entail transaction costs that are higher than those for transactions in liquid securities. Foreign (Non‑U.S.) Securities Risk: The Fund directly purchases securities of foreign issuers. Risks of investing in foreign securities include currency risks, future political and economic developments and possible imposition of foreign withholding taxes on income or proceeds payable on the securities. In addition, there may be less publicly available information about a foreign issuer than about a domestic issuer, and foreign issuers may not be subject to the same accounting, auditing and financial recordkeeping standards and requirements as domestic issuers. Moreover, securities of many foreign issuers and their markets may be less liquid and their prices more volatile than securities of comparable U.S. issuers. Foreign Currency Risk: Although the Fund will report its NAV and pay dividends in U.S. dollars, foreign securities often are purchased with and make any dividend and interest payments in foreign currencies. Therefore, the Fund’s investments in foreign securities will be subject to foreign currency risk, which means that the Fund’s NAV could decline solely as a result of changes in the exchange rates between foreign currencies and the U.S. dollar. Certain foreign countries may impose restrictions on the ability of issuers of foreign securities to make payment of principal, dividends and interest to investors located outside the country, due to blockage of foreign currency exchanges or otherwise. The Fund may, but is not required to, engage in various investments that are designed to hedge the Fund’s foreign currency risks, and such investments are subject to the risks described under “Derivatives and Hedging Transactions Risk” below. Derivatives and Hedging Transactions Risk: The Fund’s use of derivatives, including for the purpose of hedging interest rate or foreign currency risks, presents risks different from, and possibly greater than, the risks associated with investing directly in traditional securities. Among the risks presented are counterparty risk, financial leverage risk, liquidity risk, OTC trading risk and tracking risk. The use of derivatives can lead to losses because of adverse movements in the price or value of the underlying asset, index or rate, which may be magnified by certain features of the derivatives. Options Risk: Gains on options transactions depend on the investment manager’s ability to predict correctly the direction of stock prices, indexes, interest rates, and other economic factors, and unanticipated changes may cause poorer overall performance for the Fund than if it had not engaged in such transactions. A rise in the value of the security or index underlying a call option written by the Fund exposes the Fund to possible loss or loss of opportunity to realize appreciation in the value of any portfolio securities underlying or otherwise related to the call option. By writing a put option, the Fund assumes the risk of a decline in the underlying security or index. There can be no assurance that a liquid market will exist when the Fund seeks to close out an option position, and for certain options not traded on an exchange no market usually exists. Trading could be interrupted, for example, because of supply and demand imbalances arising from a lack of either buyers or sellers, or an options exchange could suspend trading after the price has risen or fallen more than the maximum specified by the exchange. Although the Fund may be able to offset to some extent any adverse effects of being unable to liquidate an option position, that Fund may experience losses in some cases as a result of such inability, may not be able to close its position and, in such an event would be unable to control its losses. Geopolitical Risk: Occurrence of global events similar to those in recent years, such as war (including Russia’s military invasion of Ukraine), terrorist attacks, natural or environmental disasters, country instability, infectious disease epidemics or pandemics, such as that caused by COVID‑19, market instability, debt crises and downgrades, embargoes, tariffs, sanctions and other trade barriers and other governmental trade or market control programs, the potential exit of a country from its respective union and related geopolitical events, may result in market volatility and may have long-lasting impacts on U.S. and global economies and financial markets. Supply chain disruptions or significant changes in the supply or prices of commodities or other economic inputs may have material and unexpected effects on both global securities markets and individual countries, regions, sectors, companies or industries. Events occurring in one region of the world may negatively impact industries and regions that are not otherwise directly impacted by the events. Additionally, those events, as well as other changes in foreign and domestic political and economic conditions, could adversely affect individual issuers or related groups of issuers, securities markets, interest rates, secondary trading, credit ratings, inflation, investor sentiment and other factors affecting the value of the Fund’s investments. Although the long-term economic fallout of COVID‑19 is difficult to predict, it has contributed to, and may continue to contribute to, market volatility, inflation and systemic economic weakness. COVID‑19 and efforts to contain its spread may also exacerbate other pre‑existing political, social, economic, market and financial risks. In addition, the U.S. government and other central banks across Europe, Asia, and elsewhere announced and/or adopted economic relief packages in response to COVID‑19. The end of any such program could cause market downturns, disruptions and volatility, particularly if markets view the ending as premature. The U.S. federal government ended the COVID‑19 public health emergency declaration on May 11, 2023; however, the effects of the COVID‑19 pandemic are expected to continue and the risk that new variants of COVID‑19 may emerge remains. Therefore the economic outlook, particularly for certain industries and businesses, remains inherently uncertain. On January 31, 2020, the United Kingdom (UK) withdrew from the European Union (EU) (referred to as Brexit), commencing a transition period that ended on December 31, 2020. The EU‑UK Trade and Cooperation Agreement, a bilateral trade and cooperation deal governing the future relationship between the UK and the EU (TCA), provisionally went into effect on January 1, 2021, and entered into force officially on May 1, 2021, but critical aspects of the relationship remain unresolved and subject to further negotiation and agreement. Brexit has resulted in volatility in European and global markets and could have negative long-term impacts on financial markets in the UK and throughout Europe. There is still considerable uncertainty relating to the potential consequences of the exit, how the negotiations for new trade agreements will be conducted, and whether the UK’s exit will increase the likelihood of other countries also departing the EU. During this period of uncertainty, the negative impact on the UK, European and broader global economies, could be significant, potentially resulting in increased market volatility and illiquidity, political, economic, and legal uncertainty, and lower economic growth for companies that rely significantly on Europe for their business activities and revenues. On February 24, 2022, Russia launched a large-scale invasion of Ukraine significantly amplifying already existing geopolitical tensions. The United States and many other countries have instituted various economic sanctions against Russia, Russian individuals and entities and Belarus. The extent and duration of the military action, sanctions imposed and other punitive actions taken (including any Russian retaliatory responses to such sanctions and actions), and resulting disruptions in Europe and globally cannot be predicted, but could be significant and have a severe adverse effect on the global economy, securities markets and commodities markets globally, including through global supply chain disruptions, increased inflationary pressures and reduced economic activity. To the extent the Fund has exposure to the energy sector, the Fund may be especially susceptible to these risks. Furthermore, in March 2023, the shut-down of certain financial institutions raised economic concerns over disruption in the U.S. banking system. There can be no certainty that the actions taken by the U.S. government to strengthen public confidence in the U.S. banking system will be effective in mitigating the effects of financial institution failures on the economy and restoring public confidence in the U.S. banking system. These disruptions may also make it difficult to value the Fund’s portfolio investments and cause certain of the Fund’s investments to become illiquid. The strengthening or weakening of the U.S. dollar relative to other currencies may, among other things, adversely affect the Fund’s investments denominated in non‑U.S. dollar currencies. It is difficult to predict when similar events affecting the U.S. or global financial markets may occur, the effects that such events may have, and the duration of those effects. Regulatory Risk: The U.S. government has proposed and adopted multiple regulations that could have a long-lasting impact on the Fund and on the mutual fund industry in general. The SEC’s final rules, related requirements and amendments to modernize reporting and disclosure, along with other potential upcoming regulations, could, among other things, restrict the Fund’s ability to engage in transactions, and/or increase overall expenses of the Fund. In addition to Rule 18f‑4, which governs the way derivatives are used by registered investment companies, the SEC, Congress, various exchanges and regulatory and self-regulatory authorities, both domestic and foreign, have undertaken reviews of the use of derivatives by registered investment companies, which could affect the nature and extent of instruments used by the Fund. While the full extent of all of these regulations is still unclear, these regulations and actions may adversely affect both the Fund and the instruments in which the Fund invests and its ability to execute its investment strategy. For example, climate change regulation (such as decarbonization legislation, other mandatory controls to reduce emissions of greenhouse gases, or related disclosure requirements) could significantly affect the Fund or its investments by, among other things, increasing compliance costs or underlying companies’ operating costs and capital expenditures. Similarly, regulatory developments in other countries may have an unpredictable and adverse impact on the Fund. LIBOR Risk: Many financial instruments are tied to the London Interbank Offered Rate, or “LIBOR,” to determine payment obligations, financing terms, hedging strategies, or investment value. LIBOR is the offered rate for short-term Eurodollar deposits between major international banks. The Head of the UK Financial Conduct Authority the (FCA) and LIBOR’s administrator, ICE Benchmark Administration (IBA) ceased publication of most LIBOR settings at the end of 2021 and the IBA ceased publication of a majority of U.S. dollar LIBOR settings after June 30, 2023. In addition, global regulators have announced that, with limited exceptions, no new LIBOR-based contracts should be entered into after 2021. Actions by regulators have resulted in the establishment of alternative reference rates to LIBOR in most major currencies (e.g., the Secured Overnight Financing Rate (SOFR) for U.S. dollar LIBOR and the Sterling Overnight Index Average Rate for GBP LIBOR). Other countries are introducing their own local-currency-denominated alternative reference rates for short-term lending and global consensus on alternative rates is lacking. In March 2022, the U.S. federal government enacted the Adjustable Interest Rate (LIBOR) Act (the LIBOR Act) to establish a process for replacing LIBOR in certain existing contracts that do not already provide for the use of a clearly defined and practicable replacement benchmark rate as described in the LIBOR Act. Generally, for contracts that do not contain clear and practicable fallback provisions as described in the LIBOR Act, a benchmark replacement recommended by the Federal Reserve Board will effectively replace the U.S. dollar LIBOR benchmark after June 30, 2023. The recommended benchmark replacement will be based on SOFR, which is published by the Federal Reserve Bank of New York, and will include certain spread adjustments and benchmark replacement conforming changes. On December 16, 2022, the Federal Reserve Board adopted a final rule that implements the LIBOR Act. The final rule restates safe harbor protections contained in the LIBOR Act for selection or use of the replacement benchmark rate selected by the Federal Reserve Board. Consistent with the LIBOR Act, the final rule is also intended to ensure that LIBOR contracts adopting a benchmark rate selected by the Federal Reserve Board will not be interrupted or terminated following LIBOR’s replacement. The transition away from LIBOR may lead to increased volatility and illiquidity in markets that are tied to LIBOR, reduced values of, inaccurate valuations of, and miscalculations of payment amounts for LIBOR-related investments or investments in issuers that utilize LIBOR, increased difficulty in borrowing or refinancing and reduced effectiveness of hedging strategies, adversely affecting the Fund’s performance or NAV. In addition, any alternative reference rate may be a less effective substitute resulting in prolonged adverse market conditions for the Fund.
|
| Share Price | $ / shares | $ 13.78 |
| NAV Per Share | $ / shares | $ 15.98 |
| Latest Premium (Discount) to NAV [Percent] | (13.77%) |
| Capital Stock, Long-Term Debt, and Other Securities [Abstract] | |
| Outstanding Security, Authorized [Shares] | shares | 267,798,406 |
| Outstanding Security, Held [Shares] | shares | 16,755,000 |
| Market Price Discount from Net Asset Value Risk [Member] | |
| General Description of Registrant [Abstract] | |
| Risk [Text Block] | Market Price Discount from Net Asset Value Risk: Shares of closed‑end investment companies frequently trade at a discount from their NAV. This characteristic is a risk separate and distinct from the risk that NAV could decrease as a result of investment activities. Whether investors will realize gains or losses upon the sale of the shares will depend not upon the Fund’s NAV but entirely upon whether the market price of the shares at the time of sale is above or below the investor’s purchase price for the shares. Because the market price of the shares is determined by factors such as relative supply of and demand for shares in the market, general market and economic conditions, and other factors beyond the control of the Fund, Fund shares may trade at, above or below NAV.
|
| Non Diversified Status Risk [Member] | |
| General Description of Registrant [Abstract] | |
| Risk [Text Block] | Non‑Diversified Status Risk: Because the Fund, as a non‑diversified investment company, may invest in a smaller number of individual issuers than a diversified investment company, an investment in the Fund presents greater risk to you than an investment in a diversified company.
|
| Investing in Real Estate Securities Risk [Member] | |
| General Description of Registrant [Abstract] | |
| Risk [Text Block] | Investing in Real Estate Securities Risk: Risks of investing in real estate securities are similar to those associated with direct investments in real estate, including falling property values due to increasing vacancies or declining rents resulting from economic, legal, political or technological developments, lack of liquidity, limited diversification and sensitivity to certain economic factors such as interest rate changes and market recessions. Foreign securities involve special risks, including currency fluctuations, lower liquidity, political and economic uncertainties, and differences in accounting standards. Some international securities may represent small- and medium‑sized companies, which may be more susceptible to price volatility and less liquidity than larger companies.
|
| Common Stock Risk [Member] | |
| General Description of Registrant [Abstract] | |
| Risk [Text Block] | Common Stock Risk: While common stocks have historically generated higher average returns than fixed-income securities over the long-term, common stocks have also experienced significantly more volatility in those returns, although under certain market conditions, fixed-income investments may have comparable or greater price volatility. The value of common stocks and other equity securities will fluctuate in response to developments concerning the company, political and regulatory circumstances, the stock market, and the economy. In the short term, stock prices can fluctuate dramatically in response to these developments. Different parts of the market and different types of equity securities can react differently to these developments. For example, stocks of large companies can react differently than stocks of smaller companies, and value stocks (stocks of companies that are undervalued by various measures and have potential for long-term capital appreciation), can react differently from growth stocks (stocks of companies with attractive cash flow returns on invested capital and earnings that are expected to grow). These developments can affect a single company, all companies within the same industry, economic sector or geographic region, or the stock market as a whole.
|
| Real Estate Market Risk [Member] | |
| General Description of Registrant [Abstract] | |
| Risk [Text Block] | Real Estate Market Risk: Since the Fund concentrates its assets in companies in the real estate industry, an investment in the Fund will be closely linked to the performance of the real estate markets. Risks of investing in real estate securities include falling property values due to increasing vacancies, declining rents resulting from economic, legal, tax, political or technological developments, lack of liquidity, limited diversification, and sensitivity to certain economic factors such as interest-rate changes and market recessions. Real estate company prices also may drop because of the failure of borrowers to pay their loans and poor management, and residential developers, in particular, could be negatively impacted by falling home prices, slower mortgage origination and rising construction costs. The risks of investing in REITs are similar to those associated with direct investments in real estate securities.
|
| REIT Risk [Member] | |
| General Description of Registrant [Abstract] | |
| Risk [Text Block] | REIT Risk: In addition to the risks of securities linked to the real estate industry, REITs are subject to certain other risks related to their structure and focus. REITs are dependent upon management skills and generally may not be diversified. REITs are also subject to heavy cash flow dependency, defaults by borrowers and self-liquidation. In addition, REITs could possibly fail to (i) qualify for pass-through of income under applicable tax law, or (ii) maintain their exemptions from registration under the 1940 Act. The above factors may also adversely affect a borrower’s or a lessee’s ability to meet its obligations to the REIT. In the event of a default by a borrower or lessee, the REIT may experience delays in enforcing its rights as a mortgagee or lessor and may incur substantial costs associated with protecting its investments.
|
| Small and Medium Sized Companies Risk [Member] | |
| General Description of Registrant [Abstract] | |
| Risk [Text Block] | Small- and Medium‑Sized Companies Risk: Real estate companies in the industry tend to be small- to medium‑sized companies in relation to the equity markets as a whole. There may be less trading in a smaller company’s stock, which means that buy and sell transactions in that stock could have a larger impact on the stock’s price than is the case with larger company stocks. Smaller companies also may have fewer lines of business so that changes in any one line of business may have a greater impact on a smaller company’s stock price than is the case for a larger company. Further, smaller company stocks may perform differently in different cycles than larger company stocks. Accordingly, real estate company shares can, and at times will, perform differently than large company stocks.
|
| Preferred Securities Risk [Member] | |
| General Description of Registrant [Abstract] | |
| Risk [Text Block] | Preferred Securities Risk: Preferred securities are subject to credit risk, which is the risk that a security will decline in price, or the issuer of the security will fail to make dividend, interest or principal payments when due, because the issuer experiences a decline in its financial status. Preferred securities are also subject to interest rate risk and may decline in value because of changes in market interest rates. The Fund may be subject to a greater risk of rising interest rates than would normally be the case in an environment of low interest rates and the effect of potential government fiscal policy initiatives and resulting market reaction to those initiatives. In addition, an issuer may be permitted to defer or omit distributions. Preferred securities are also generally subordinated to bonds and other debt instruments in a company’s capital structure. During periods of declining interest rates, an issuer maybe able to exercise an option to redeem (call) its issue at par earlier than scheduled, and the Fund maybe forced to reinvest in lower yielding securities. Certain preferred securities may be substantially less liquid than many other securities, such as common stocks. Generally, preferred security holders have no voting rights with respect to the issuing company unless certain events occur. Certain preferred securities may give the issuers special redemption rights allowing the securities to be redeemed prior to a specified date if certain events occur, such as changes to tax or securities laws.
|
| Contingent Capital Securities Risk [Member] | |
| General Description of Registrant [Abstract] | |
| Risk [Text Block] | Contingent Capital Securities Risk: Contingent capital securities (sometimes referred to as “CoCos”) are debt or preferred securities with loss absorption characteristics built into the terms of the security, for example, a mandatory conversion into common stock of the issuer under certain circumstances, such as the issuer’s capital ratio falling below a certain level. Since the common stock of the issuer may not pay a dividend, investors in these instruments could experience a reduced income rate, potentially to zero, and conversion would deepen the subordination of the investor, hence worsening the investor’s standing in a bankruptcy. Some CoCos provide for a reduction in the value or principal amount of the security (potentially to zero) under such circumstances. In March 2023, a Swiss regulator required a write-down of outstanding CoCos to zero notwithstanding the fact that the equity shares continued to exist and have economic value. It is currently unclear whether regulators of issuers in other jurisdictions will take similar actions. Notwithstanding these risks, the Fund intends to continue to invest in CoCos issued by Swiss companies and by companies in other jurisdictions. In addition, most CoCos are considered to be high yield or “junk” securities and are therefore subject to the risks of investing in below investment-grade securities. Finally, CoCo issuers can, at their discretion, suspend dividend distributions on their CoCo securities and are more likely to do so in response to negative economic conditions and/or government regulation. Omitted distributions are typically non‑cumulative and will not be paid on a future date. Any omitted distribution may negatively impact the returns or distribution rate of the Fund.
|
| Concentration Risk [Member] | |
| General Description of Registrant [Abstract] | |
| Risk [Text Block] | Concentration Risk: Because the Fund invests at least 25% of its net assets in the financials sector, it will be more susceptible to adverse economic or regulatory occurrences affecting this sector, such as changes in interest rates, loan concentration and competition. In addition, the Fund will also be subject to the risks of investing in the individual industries and securities that comprise the financials sector, including the bank, diversified financials, real estate (including REITs) and insurance industries. To the extent that the Fund focuses its investments in other sectors or industries, such as (but not limited to) energy, industrials, utilities, pipelines, health care and telecommunications, the Fund will be subject to the risks associated with these particular sectors and industries. These sectors and industries may be adversely affected by, among others, changes in government regulation, world events and economic conditions.
|
| Credit and Below Investment Grade Securities Risk [Member] | |
| General Description of Registrant [Abstract] | |
| Risk [Text Block] | Credit and Below-Investment-Grade Securities Risk: Preferred securities may be rated below investment grade or may be unrated. Below-investment-grade securities, or equivalent unrated securities, which are commonly known as “high-yield bonds” or “junk bonds,” generally involve greater volatility of price and risk of loss of income and principal, and may be more susceptible to real or perceived adverse economic and competitive industry conditions than higher grade securities. It is reasonable to expect that any adverse economic conditions could disrupt the market for lower-rated securities, have an adverse impact on the value of those securities and adversely affect the ability of the issuers of those securities to repay principal and interest on those securities.
|
| Leverage Risk [Member] | |
| General Description of Registrant [Abstract] | |
| Risk [Text Block] | Leverage Risk: The use of leverage is a speculative technique and there are special risks and costs associated with leverage. The NAV of the Fund’s shares may be reduced by the issuance and ongoing costs of leverage. So long as the Fund is able to invest in securities that produce an investment yield that is greater than the total cost of leverage, the leverage strategy will produce higher current net investment income for the shareholders. On the other hand, to the extent that the total cost of leverage exceeds the incremental income gained from employing such leverage, shareholders would realize lower net investment income. In addition to the impact on net income, the use of leverage will have an effect of magnifying capital appreciation or depreciation for shareholders. Specifically, in an up market, leverage will typically generate greater capital appreciation than if the Fund were not employing leverage. Conversely, in down markets, the use of leverage will generally result in greater capital depreciation than if the Fund had been unlevered. To the extent that the Fund is required or elects to reduce its leverage, the Fund may incur applicable breakage fees under the Fund’s credit arrangement and may need to liquidate investments, including under adverse economic conditions which may result in capital losses potentially reducing returns to shareholders. The use of leverage also results in the investment management fees payable to the investment manager being higher than if the Fund did not use leverage and can increase operating costs, which may reduce total return. There can be no assurance that a leveraging strategy will be successful during any period in which it is employed.
|
| Liquidity Risk [Member] | |
| General Description of Registrant [Abstract] | |
| Risk [Text Block] | Liquidity Risk: Liquidity risk is the risk that particular investments of the Fund may become difficult to sell or purchase. The market for certain investments may become less liquid or illiquid due to adverse changes in the conditions of a particular issuer or due to adverse market or economic conditions. In addition, dealer inventories of certain securities, which provide an indication of the ability of dealers to engage in “market making,” are at, or near, historic lows in relation to market size, which has the potential to increase price volatility in the fixed income markets in which the Fund invests. Federal banking regulations may also cause certain dealers to reduce their inventories of certain securities, which may further decrease the Fund’s ability to buy or sell such securities. As a result of this decreased liquidity, the Fund may have to accept a lower price to sell a security, sell other securities to raise cash, or give up an investment opportunity, any of which could have a negative effect on performance. Further, transactions in less liquid or illiquid securities may entail transaction costs that are higher than those for transactions in liquid securities.
|
| Foreign Non US Securities Risk [Member] | |
| General Description of Registrant [Abstract] | |
| Risk [Text Block] | Foreign (Non‑U.S.) Securities Risk: The Fund directly purchases securities of foreign issuers. Risks of investing in foreign securities include currency risks, future political and economic developments and possible imposition of foreign withholding taxes on income or proceeds payable on the securities. In addition, there may be less publicly available information about a foreign issuer than about a domestic issuer, and foreign issuers may not be subject to the same accounting, auditing and financial recordkeeping standards and requirements as domestic issuers. Moreover, securities of many foreign issuers and their markets may be less liquid and their prices more volatile than securities of comparable U.S. issuers.
|
| Foreign Currency Risk [Member] | |
| General Description of Registrant [Abstract] | |
| Risk [Text Block] | Foreign Currency Risk: Although the Fund will report its NAV and pay dividends in U.S. dollars, foreign securities often are purchased with and make any dividend and interest payments in foreign currencies. Therefore, the Fund’s investments in foreign securities will be subject to foreign currency risk, which means that the Fund’s NAV could decline solely as a result of changes in the exchange rates between foreign currencies and the U.S. dollar. Certain foreign countries may impose restrictions on the ability of issuers of foreign securities to make payment of principal, dividends and interest to investors located outside the country, due to blockage of foreign currency exchanges or otherwise. The Fund may, but is not required to, engage in various investments that are designed to hedge the Fund’s foreign currency risks, and such investments are subject to the risks described under “Derivatives and Hedging Transactions Risk” below.
|
| Derivatives and Hedging Transactions Risk [Member] | |
| General Description of Registrant [Abstract] | |
| Risk [Text Block] | Derivatives and Hedging Transactions Risk: The Fund’s use of derivatives, including for the purpose of hedging interest rate or foreign currency risks, presents risks different from, and possibly greater than, the risks associated with investing directly in traditional securities. Among the risks presented are counterparty risk, financial leverage risk, liquidity risk, OTC trading risk and tracking risk. The use of derivatives can lead to losses because of adverse movements in the price or value of the underlying asset, index or rate, which may be magnified by certain features of the derivatives.
|
| Options Risk [Member] | |
| General Description of Registrant [Abstract] | |
| Risk [Text Block] | Options Risk: Gains on options transactions depend on the investment manager’s ability to predict correctly the direction of stock prices, indexes, interest rates, and other economic factors, and unanticipated changes may cause poorer overall performance for the Fund than if it had not engaged in such transactions. A rise in the value of the security or index underlying a call option written by the Fund exposes the Fund to possible loss or loss of opportunity to realize appreciation in the value of any portfolio securities underlying or otherwise related to the call option. By writing a put option, the Fund assumes the risk of a decline in the underlying security or index. There can be no assurance that a liquid market will exist when the Fund seeks to close out an option position, and for certain options not traded on an exchange no market usually exists. Trading could be interrupted, for example, because of supply and demand imbalances arising from a lack of either buyers or sellers, or an options exchange could suspend trading after the price has risen or fallen more than the maximum specified by the exchange. Although the Fund may be able to offset to some extent any adverse effects of being unable to liquidate an option position, that Fund may experience losses in some cases as a result of such inability, may not be able to close its position and, in such an event would be unable to control its losses.
|
| Geopolitical Risk [Member] | |
| General Description of Registrant [Abstract] | |
| Risk [Text Block] | Geopolitical Risk: Occurrence of global events similar to those in recent years, such as war (including Russia’s military invasion of Ukraine), terrorist attacks, natural or environmental disasters, country instability, infectious disease epidemics or pandemics, such as that caused by COVID‑19, market instability, debt crises and downgrades, embargoes, tariffs, sanctions and other trade barriers and other governmental trade or market control programs, the potential exit of a country from its respective union and related geopolitical events, may result in market volatility and may have long-lasting impacts on U.S. and global economies and financial markets. Supply chain disruptions or significant changes in the supply or prices of commodities or other economic inputs may have material and unexpected effects on both global securities markets and individual countries, regions, sectors, companies or industries. Events occurring in one region of the world may negatively impact industries and regions that are not otherwise directly impacted by the events. Additionally, those events, as well as other changes in foreign and domestic political and economic conditions, could adversely affect individual issuers or related groups of issuers, securities markets, interest rates, secondary trading, credit ratings, inflation, investor sentiment and other factors affecting the value of the Fund’s investments. Although the long-term economic fallout of COVID‑19 is difficult to predict, it has contributed to, and may continue to contribute to, market volatility, inflation and systemic economic weakness. COVID‑19 and efforts to contain its spread may also exacerbate other pre‑existing political, social, economic, market and financial risks. In addition, the U.S. government and other central banks across Europe, Asia, and elsewhere announced and/or adopted economic relief packages in response to COVID‑19. The end of any such program could cause market downturns, disruptions and volatility, particularly if markets view the ending as premature. The U.S. federal government ended the COVID‑19 public health emergency declaration on May 11, 2023; however, the effects of the COVID‑19 pandemic are expected to continue and the risk that new variants of COVID‑19 may emerge remains. Therefore the economic outlook, particularly for certain industries and businesses, remains inherently uncertain. On January 31, 2020, the United Kingdom (UK) withdrew from the European Union (EU) (referred to as Brexit), commencing a transition period that ended on December 31, 2020. The EU‑UK Trade and Cooperation Agreement, a bilateral trade and cooperation deal governing the future relationship between the UK and the EU (TCA), provisionally went into effect on January 1, 2021, and entered into force officially on May 1, 2021, but critical aspects of the relationship remain unresolved and subject to further negotiation and agreement. Brexit has resulted in volatility in European and global markets and could have negative long-term impacts on financial markets in the UK and throughout Europe. There is still considerable uncertainty relating to the potential consequences of the exit, how the negotiations for new trade agreements will be conducted, and whether the UK’s exit will increase the likelihood of other countries also departing the EU. During this period of uncertainty, the negative impact on the UK, European and broader global economies, could be significant, potentially resulting in increased market volatility and illiquidity, political, economic, and legal uncertainty, and lower economic growth for companies that rely significantly on Europe for their business activities and revenues. On February 24, 2022, Russia launched a large-scale invasion of Ukraine significantly amplifying already existing geopolitical tensions. The United States and many other countries have instituted various economic sanctions against Russia, Russian individuals and entities and Belarus. The extent and duration of the military action, sanctions imposed and other punitive actions taken (including any Russian retaliatory responses to such sanctions and actions), and resulting disruptions in Europe and globally cannot be predicted, but could be significant and have a severe adverse effect on the global economy, securities markets and commodities markets globally, including through global supply chain disruptions, increased inflationary pressures and reduced economic activity. To the extent the Fund has exposure to the energy sector, the Fund may be especially susceptible to these risks. Furthermore, in March 2023, the shut-down of certain financial institutions raised economic concerns over disruption in the U.S. banking system. There can be no certainty that the actions taken by the U.S. government to strengthen public confidence in the U.S. banking system will be effective in mitigating the effects of financial institution failures on the economy and restoring public confidence in the U.S. banking system. These disruptions may also make it difficult to value the Fund’s portfolio investments and cause certain of the Fund’s investments to become illiquid. The strengthening or weakening of the U.S. dollar relative to other currencies may, among other things, adversely affect the Fund’s investments denominated in non‑U.S. dollar currencies. It is difficult to predict when similar events affecting the U.S. or global financial markets may occur, the effects that such events may have, and the duration of those effects.
|
| Regulatory Risk [Member] | |
| General Description of Registrant [Abstract] | |
| Risk [Text Block] | Regulatory Risk: The U.S. government has proposed and adopted multiple regulations that could have a long-lasting impact on the Fund and on the mutual fund industry in general. The SEC’s final rules, related requirements and amendments to modernize reporting and disclosure, along with other potential upcoming regulations, could, among other things, restrict the Fund’s ability to engage in transactions, and/or increase overall expenses of the Fund. In addition to Rule 18f‑4, which governs the way derivatives are used by registered investment companies, the SEC, Congress, various exchanges and regulatory and self-regulatory authorities, both domestic and foreign, have undertaken reviews of the use of derivatives by registered investment companies, which could affect the nature and extent of instruments used by the Fund. While the full extent of all of these regulations is still unclear, these regulations and actions may adversely affect both the Fund and the instruments in which the Fund invests and its ability to execute its investment strategy. For example, climate change regulation (such as decarbonization legislation, other mandatory controls to reduce emissions of greenhouse gases, or related disclosure requirements) could significantly affect the Fund or its investments by, among other things, increasing compliance costs or underlying companies’ operating costs and capital expenditures. Similarly, regulatory developments in other countries may have an unpredictable and adverse impact on the Fund.
|
| LIBOR Risk [Member] | |
| General Description of Registrant [Abstract] | |
| Risk [Text Block] | LIBOR Risk: Many financial instruments are tied to the London Interbank Offered Rate, or “LIBOR,” to determine payment obligations, financing terms, hedging strategies, or investment value. LIBOR is the offered rate for short-term Eurodollar deposits between major international banks. The Head of the UK Financial Conduct Authority the (FCA) and LIBOR’s administrator, ICE Benchmark Administration (IBA) ceased publication of most LIBOR settings at the end of 2021 and the IBA ceased publication of a majority of U.S. dollar LIBOR settings after June 30, 2023. In addition, global regulators have announced that, with limited exceptions, no new LIBOR-based contracts should be entered into after 2021. Actions by regulators have resulted in the establishment of alternative reference rates to LIBOR in most major currencies (e.g., the Secured Overnight Financing Rate (SOFR) for U.S. dollar LIBOR and the Sterling Overnight Index Average Rate for GBP LIBOR). Other countries are introducing their own local-currency-denominated alternative reference rates for short-term lending and global consensus on alternative rates is lacking. In March 2022, the U.S. federal government enacted the Adjustable Interest Rate (LIBOR) Act (the LIBOR Act) to establish a process for replacing LIBOR in certain existing contracts that do not already provide for the use of a clearly defined and practicable replacement benchmark rate as described in the LIBOR Act. Generally, for contracts that do not contain clear and practicable fallback provisions as described in the LIBOR Act, a benchmark replacement recommended by the Federal Reserve Board will effectively replace the U.S. dollar LIBOR benchmark after June 30, 2023. The recommended benchmark replacement will be based on SOFR, which is published by the Federal Reserve Bank of New York, and will include certain spread adjustments and benchmark replacement conforming changes. On December 16, 2022, the Federal Reserve Board adopted a final rule that implements the LIBOR Act. The final rule restates safe harbor protections contained in the LIBOR Act for selection or use of the replacement benchmark rate selected by the Federal Reserve Board. Consistent with the LIBOR Act, the final rule is also intended to ensure that LIBOR contracts adopting a benchmark rate selected by the Federal Reserve Board will not be interrupted or terminated following LIBOR’s replacement. The transition away from LIBOR may lead to increased volatility and illiquidity in markets that are tied to LIBOR, reduced values of, inaccurate valuations of, and miscalculations of payment amounts for LIBOR-related investments or investments in issuers that utilize LIBOR, increased difficulty in borrowing or refinancing and reduced effectiveness of hedging strategies, adversely affecting the Fund’s performance or NAV. In addition, any alternative reference rate may be a less effective substitute resulting in prolonged adverse market conditions for the Fund.
|
1 Year Cohen & Steers Real Esta... Chart |
1 Month Cohen & Steers Real Esta... Chart |

It looks like you are not logged in. Click the button below to log in and keep track of your recent history.
Support: +44 (0) 203 8794 460 | support@advfn.com
By accessing the services available at ADVFN you are agreeing to be bound by ADVFN's Terms & Conditions
 Hot Features
