Radian (NYSE:RDN)
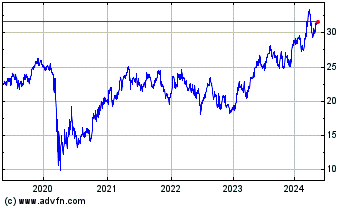
Historical Stock Chart
From Jan 2020 to Jan 2025
Net income driven by lower provision for MI losses and unrealized gains on derivatives
PHILADELPHIA, Aug. 5 /PRNewswire-FirstCall/ -- Radian Group Inc. (NYSE: RDN) today reported net income for the quarter ended June 30, 2009, of $231.9 million, or $2.82 per diluted share. This compares to a net loss of $392.5 million, or $4.91 per diluted share, for the prior-year quarter. Book value per share at June 30, 2009, was $25.12.
"We are pleased that Radian generated net income in the second quarter, despite a difficult environment with rising delinquencies. These earnings were driven primarily by loss management efforts that positively impacted our provision for mortgage insurance losses and by unrealized gains on derivatives," said Chief Executive Officer S. A. Ibrahim. "While there are positive signs in today's economy, we remain aware of the challenges and uncertainties Radian continues to face in the near term, and the condition of the U.S. housing market. Our primary focus is on increasing our capital strength and financial flexibility, continuing to write high-quality new business, and positioning Radian for growth and success when markets recover."
SECOND QUARTER HIGHLIGHTS
-- The mortgage insurance provision for losses of $142.8 million reflects
higher delinquency counts, offset significantly by Radian's ongoing
loss management efforts.
-- Mortgage insurance claims paid of $167.7 million again were lower than
the company's forecast and consisted of $149.4 million of first liens
and $18.3 million of second liens. In the third quarter, total first-
and second-lien claims paid are expected to be approximately $275
million to $300 million. For the full year 2009, Radian has reduced
its expectations from $1.2 billion to $1.4 billion, to a current
estimate in the $1.1 billion range.
-- Radian is encouraged by the many government and private initiatives to
help borrowers and has programs in place to provide assistance to
lenders and their borrowers who are struggling with mortgage payments.
The company is ready to handle the anticipated increase in volume from
government-sponsored programs and through other lender-initiated
refinance or modification programs. Radian continues to expect an
increase in delinquencies throughout the remainder of 2009, which could
result in a higher provision and reserve for losses.
-- Over the past year, Radian has successfully transformed its mortgage
insurance business, producing a 2009 book that consists of loans with
excellent risk characteristics. For example, of the total primary new
mortgage insurance written in the quarter of $5.5 billion:
-- 99.9 percent was prime credit quality;
-- 98.4 percent had a FICO score of 680 or greater, with 72.9 percent
at 740 or above;
-- all had loan-to-value (LTV) ratios of 95 percent or below, and 73
percent had LTV ratios of 90 percent or below;
-- 99.5 percent were fixed-rate mortgages; and
-- we have observed a significant decrease in early default activity
in the 2009 vintage, which is an example of improved underwriting.
In addition, Radian's market share has grown steadily in 2009 and
represents a significant increase over historical levels.
-- Unrealized gains on derivatives were $272.3 million on total pre-tax
income of $353.7 million.
-- Radian's current cash position is strong, with approximately $480
million immediately available to the parent company after having
received a $105 million tax refund in May.
-- Radian Asset Assurance Inc. the company's principal financial guaranty
subsidiary, continues to serve as an important source of capital
support for Radian Guaranty Inc., the company's mortgage insurance
subsidiary, and is expected to continue to provide Radian Guaranty with
cash infusions over time.
-- As of June 30, 2009, Radian Asset had more than $900 million in
statutory capital with an additional $1.84 billion in total claims-
paying resources.
-- At the end of June, Radian Asset paid an ordinary dividend of
approximately $100 million to Radian Guaranty.
RECENT EVENTS
-- On July 17, the Company filed a $1 billion securities shelf
registration.
-- On July 20, Radian Asset entered into a Commutation and Release
Agreement, effective as of July 1, 2009, with Ambac Assurance
Corporation and Ambac Assurance UK Limited to commute $9.8 billion of
Radian Asset's reinsurance portfolio assumed from Ambac, decreasing
Radian Asset's total insured portfolio by 10 percent.
As a result, the statutory surplus of Radian Asset (and Radian
Guaranty) will be positively impacted in the third quarter 2009 by
approximately $40 million.
CONFERENCE CALL
Radian will discuss each of these items in its conference call today, Wednesday, August 5, 2009, at 10:00 a.m. Eastern time. The conference call will be broadcast live over the Internet at http://www.ir.radian.biz/phoenix.zhtml?c=112301&p=irol-audioarchives or at http://www.radian.biz/. The call may also be accessed by dialing 800-553-0288 inside the U.S., or 612-332-0530 for international callers, using passcode 108853 or by referencing Radian.
A replay of the Web cast will be available on the Radian Web site approximately two hours after the live broadcast ends for a period of one year. A replay of the conference call will be available two and a half hours after the call ends for one week, using the following dial-in numbers and passcode: 800-475-6701 inside the U.S., or 320-365-3844 for international callers, passcode 108853.
In addition to the information provided in the company's earnings news release, other statistical and financial information, which is expected to be referred to during the conference call, will be available on Radian's Web site under Investors >Quarterly Results, or by clicking on http://www.ir.radian.biz/phoenix.zhtml?c=112301&p=irol-earnings.
About Radian
Radian Group Inc. (NYSE:RDN), headquartered in Philadelphia, provides private mortgage insurance and related risk mitigation products and services to mortgage lenders nationwide through its principal operating subsidiary, Radian Guaranty Inc. These services help promote and preserve homeownership opportunities for homebuyers, while protecting lenders from default-related losses on residential first mortgages and facilitating the sale of low-downpayment mortgages in the secondary market. Additional information may be found at http://www.radian.biz/.
Financial Results and Supplemental Information Contents (Unaudited)
For trend information on all schedules, refer to Radian's quarterly financial statistics at http://www.radian.biz/investors/financial/corporate.aspx.
Exhibit A: Condensed Consolidated Statements of Income
Exhibit B: Condensed Consolidated Balance Sheets
Exhibit C: Segment Information Quarter Ended June 30, 2009
Exhibit D: Segment Information Quarter Ended June 30, 2008
Exhibit E: Segment Information Six Months Ended June 30, 2009
Exhibit F: Segment Information Six Months Ended June 30, 2008
Exhibit G: Financial Guaranty Supplemental Information -
For the Quarter and Six Months Ended and as of June 30, 2009
Exhibit H: Financial Guaranty Supplemental Information -
For the Quarter and Six Months Ended and as of June 30, 2009
Exhibit I: Mortgage Insurance Supplemental Information -
For the Quarter and Six Months Ended and as of June 30, 2009
New Insurance Written and Risk Written
Exhibit J: Mortgage Insurance Supplemental Information -
For the Quarter and Six Months Ended and as of June 30, 2009
Insurance in Force and Risk in Force
Exhibit K: Mortgage Insurance Supplemental Information -
For the Quarter and Six Months Ended and as of June 30, 2009
Risk in Force by LTV and Policy Year and other Risk in Force
Exhibit L: Mortgage Insurance Supplemental Information -
For the Quarter and Six Months Ended and as of June 30, 2009
Claims and Reserves
Exhibit M: Mortgage Insurance Supplemental Information -
For the Quarter and Six Months Ended and as of June 30, 2009
Default Statistics
Exhibit N: Mortgage Insurance Supplemental Information -
For the Quarter and Six Months Ended and as of June 30, 2009
Net Premiums Written and Earned, Smart Home, Captives and
Persistency
Exhibit O: Mortgage Insurance Supplemental Information -
For the Quarter Ended and as of June 30, 2009
Reinsurance Progression Toward Attachment - Summary by Book
Year
Exhibit P: Mortgage Insurance Supplemental Information -
For the Quarter Ended and as of June 30, 2009
Modified Pool Risk in Force
Exhibit Q: Mortgage Insurance Supplemental Information -
For the Quarter and Six Months Ended and as of June 30, 2009
Alt-A Risk in Force
Exhibit R: Financial Services Supplemental Information -
For the Quarter and Six Months Ended and as of June 30, 2009
Radian Group Inc. and Subsidiaries
Condensed Consolidated Statements of Income
Exhibit A
Quarter Ended Six Months Ended
June 30 June 30
--------------- ---------------
2009 2008 2009 2008
---- ---- ---- ----
(In thousands, except
per-share data)
Revenues:
Net premiums written -
insurance $161,901 $222,645 $318,657 $466,951
======== ======== ======== ========
Net premiums earned -
insurance $193,629 $249,137 $404,844 $491,058
Net investment income 53,251 65,128 109,534 131,107
Change in fair value of
derivative instruments 272,318 56,226 (12,098) 764,035
Net gains (losses) on other
financial instruments 54,384 14,801 79,264 (26,040)
Total other-than-temporary
impairment losses (46) (23,052) (680) (37,095)
Losses recognized in other
comprehensive loss - - - -
-- -- -- --
Net impairment losses
recognized in earnings (46) (23,052) (680) (37,095)
Other income 3,888 3,221 8,020 6,835
----- ----- ----- -----
Total revenues 577,424 365,461 588,884 1,329,900
------- ------- ------- ---------
Expenses:
Provision for losses 132,750 458,879 459,504 1,041,590
Provision for premium
deficiency 2,184 369,807 (1) (46,000) 387,897 (1)
Policy acquisition costs 25,967 75,952 (2) 39,921 99,858 (2)
Other operating expenses 55,635 63,849 107,237 118,990
Interest expense 12,295 13,832 24,594 26,325
------ ------ ------ ------
Total expenses 228,831 982,319 585,256 1,674,660
------- ------- ------- ---------
Equity in net income of
affiliates 5,110 15,704 15,662 28,230
----- ------ ------ ------
Pretax income (loss) 353,703 (601,154) 19,290 (316,530)
Income tax provision
(benefit) 121,828 (208,630) 4,852 (119,644)
------- -------- ----- --------
Net income (loss) $231,875 $(392,524) $14,438 $(196,886)
======== ========= ======= =========
Diluted net income (loss)
per share (3) $2.82 $(4.91) $0.18 $(2.46)
===== ====== ===== ======
(1) Includes $421.8 million for first-lien and $(52.0) million for second-
lien in the second quarter of 2008, and $421.8 million for first-lien and
$(33.9) million for second-lien for the six months of 2008.
(2) Includes the acceleration of $50.8 million of deferred policy
acquisition cost amortization, as a result of the establishment of a
first-lien premium deficiency reserve in the second quarter of 2008.
(3) Weighted average shares outstanding (In thousands)
Average common shares
outstanding 81,396 79,967 81,400 79,960
Increase in shares-
potential exercise of
options-diluted basis 844 - 836 -
--- -- --- --
Weighted average shares
outstanding 82,240 79,967 82,236 79,960
====== ====== ====== ======
For Trend Information, refer to our Quarterly Financial Statistics on
Radian's (RDN) website.
Radian Group Inc. and Subsidiaries
Condensed Consolidated Balance Sheets
Exhibit B
(In thousands, except per-share data) June 30 December 31 June 30
2009 2008 2008
------- ----------- -------
Assets:
Cash and investments $6,459,233 $6,060,601 $6,535,397
Investments in affiliates 108,767 99,712 112,683
Deferred policy acquisition costs 208,882 160,526 184,765
Prepaid federal income taxes - 248,828 536,343
Derivative assets 179,837 179,515 251,003
Deferred income taxes, net 368,281 446,102 171,577
Reinsurance recoverables 570,245 492,359 176,686
Other assets 560,257 428,476 440,963
------- ------- -------
Total assets $8,455,502 $8,116,119 $8,409,417
========== ========== ==========
Liabilities and stockholders' equity:
Unearned premiums $1,120,359 $916,724 $1,048,064
Reserve for losses and loss
adjustment expenses 3,304,236 3,224,542 2,287,742
Reserve for premium deficiency 40,861 86,861 583,543
Long-term debt and other borrowings 856,848 857,802 958,762
Variable interest entity debt 283,242 160,035 85,739
Derivative liabilities 379,270 519,260 657,426
Other liabilities 404,432 320,185 332,234
------- ------- -------
Total liabilities 6,389,248 6,085,409 5,953,510
--------- --------- ---------
Common stock 99 98 98
Additional paid-in capital 469,298 462,647 448,010
Retained earnings 1,764,878 1,766,946 1,981,046
Accumulated other comprehensive income (168,021) (198,981) 26,753
-------- -------- ------
Total common stockholders' equity 2,066,254 2,030,710 2,455,907
--------- --------- ---------
Total liabilities and stockholders'
equity $8,455,502 $8,116,119 $8,409,417
========== ========== ==========
Book value per share $25.12 $25.06 $30.54
Radian Group Inc. and Subsidiaries
Segment Information
Quarter Ended June 30, 2009
Exhibit C
Mortgage Financial Financial
(In thousands) Insurance Guaranty Services Total
-------------- --------- --------- --------- -----
Revenues:
Net premiums written -
insurance $154,919 $6,982 $- $161,901
======== ====== == ========
Net premiums earned -
insurance $170,047 $23,582 $- $193,629
Net investment income 32,298 20,951 2 53,251
Change in fair value of
derivative instruments (6,557) 278,875 - 272,318
Net gains on other
financial instruments 12,590 41,794 - 54,384
Net impairment losses
recognized in earnings (46) - - (46)
Other income 3,748 66 74 3,888
----- -- -- -----
Total revenues 212,080 365,268 76 577,424
------- ------- -- -------
Expenses:
Provision for losses 142,802 (10,052) - 132,750
Provision for premium
deficiency 2,184 - - 2,184
Policy acquisition costs 7,921 18,046 - 25,967
Other operating expenses 35,590 19,909 136 55,635
Interest expense 2,619 9,676 - 12,295
----- ----- -- ------
Total expenses 191,116 37,579 136 228,831
------- ------ --- -------
Equity in net income of
affiliates - - 5,110 5,110
-- -- ----- -----
Pretax income 20,964 327,689 5,050 353,703
Income tax provision 7,948 112,019 1,861 121,828
----- ------- ----- -------
Net income $13,016 $215,670 $3,189 $231,875
======= ======== ====== ========
Cash and investments $3,919,403 $2,539,830 $- $6,459,233
Deferred policy
acquisition costs 28,674 180,208 - 208,882
Total assets 5,073,729 3,259,249 122,524 8,455,502
Unearned premiums 304,336 816,023 - 1,120,359
Reserve for losses and
loss adjustment expenses 3,122,444 181,792 - 3,304,236
Derivative liabilities 23,086 356,184 - 379,270
Radian Group Inc. and Subsidiaries
Segment Information
Quarter Ended June 30, 2008
Exhibit D
Mortgage Financial Financial
(In thousands) Insurance Guaranty Services Total
-------------- --------- --------- --------- -----
Revenues:
Net premiums written -
insurance $199,030 $23,615 $- $222,645
======== ======= == ========
Net premiums earned -
insurance $205,096 $44,041 $- $249,137
Net investment income 38,941 26,187 - 65,128
Change in fair value of
derivative instruments 25,173 31,053 - 56,226
Net gains (losses) on
other financial instruments 18,155 (3,393) 39 14,801
Net impairment losses
recognized in earnings (7,711) (15,341) - (23,052)
Other income 2,999 58 164 3,221
----- -- --- -----
Total revenues 282,653 82,605 203 365,461
------- ------ --- -------
Expenses:
Provision for losses 449,296 9,583 - 458,879
Provision for premium
deficiency 369,807 - - 369,807
Policy acquisition costs 63,686 12,266 - 75,952
Other operating expenses 48,703 15,019 127 63,849
Interest expense 7,332 6,500 - 13,832
----- ----- -- ------
Total expenses 938,824 43,368 127 982,319
------- ------ --- -------
Equity in net income of
affiliates - - 15,704 15,704
-- -- ------ ------
Pretax (loss) income (656,171) 39,237 15,780 (601,154)
Income tax (benefit)
provision (221,988) 6,768 6,590 (208,630)
-------- ----- ----- --------
Net (loss) income $(434,183) $32,469 $9,190 $(392,524)
========= ======= ====== =========
Cash and investments $4,054,264 $2,481,133 $- $6,535,397
Deferred policy
acquisition costs 11,554 173,211 - 184,765
Total assets 5,037,309 3,166,316 205,792 8,409,417
Unearned premiums 359,080 688,984 - 1,048,064
Reserve for losses and
loss adjustment expenses 2,120,577 167,165 - 2,287,742
Derivative liabilities 308,543 348,883 - 657,426
Radian Group Inc. and Subsidiaries
Segment Information
Six Months Ended June 30, 2009
Exhibit E
Mortgage Financial Financial
(In thousands) Insurance Guaranty Services Total
-------------- --------- --------- --------- -----
Revenues:
Net premiums written -
insurance $316,878 $1,779 $- $318,657
======== ====== == ========
Net premiums earned -
insurance $347,930 $56,914 $- $404,844
Net investment income 63,643 45,889 2 109,534
Change in fair value of
derivative instruments (35,133) 23,035 - (12,098)
Net gains on other
financial instruments 25,500 53,764 - 79,264
Net impairment losses
recognized in earnings (680) - - (680)
Other income 7,566 219 235 8,020
----- --- --- -----
Total revenues 408,826 179,821 237 588,884
------- ------- --- -------
Expenses:
Provision for losses 464,486 (4,982) - 459,504
Provision for premium
deficiency (46,000) - - (46,000)
Policy acquisition costs 13,660 26,261 - 39,921
Other operating expenses 71,284 35,742 211 107,237
Interest expense 8,313 16,281 - 24,594
----- ------ -- ------
Total expenses 511,743 73,302 211 585,256
------- ------ --- -------
Equity in net income of
affiliates - - 15,662 15,662
-- -- ------ ------
Pretax (loss) income (102,917) 106,519 15,688 19,290
Income tax (benefit) provision (27,136) 26,249 5,739 4,852
------- ------ ----- -----
Net (loss) income $(75,781) $80,270 $9,949 $14,438
======== ======= ====== =======
Radian Group Inc. and Subsidiaries
Segment Information
Six Months Ended June 30, 2008
Exhibit F
Mortgage Financial Financial
(In thousands) Insurance Guaranty Services Total
-------------- --------- --------- --------- -----
Revenues:
Net premiums written -
insurance $410,281 $56,670 $- $466,951
======== ======= == ========
Net premiums earned -
insurance $409,361 $81,697 $- $491,058
Net investment income 77,786 53,307 14 131,107
Change in fair value of
derivative instruments 96,942 667,093 - 764,035
Net (losses) gains on
other financial
instruments (11,404) (14,673) 37 (26,040)
Net impairment losses
recognized in earnings (14,885) (22,210) - (37,095)
Other income 6,490 179 166 6,835
----- --- --- -----
Total revenues 564,290 765,393 217 1,329,900
------- ------- --- ---------
Expenses:
Provision for losses 1,020,304 21,286 - 1,041,590
Provision for premium
deficiency 387,897 - - 387,897
Policy acquisition costs 77,146 22,712 - 99,858
Other operating expenses 82,873 35,757 360 118,990
Interest expense 14,422 11,654 249 26,325
------ ------ --- ------
Total expenses 1,582,642 91,409 609 1,674,660
--------- ------ --- ---------
Equity in net income of
affiliates - - 28,230 28,230
-- -- ------ ------
Pretax (loss) income (1,018,352) 673,984 27,838 (316,530)
Income tax (benefit)
provision (357,713) 225,987 12,082 (119,644)
-------- ------- ------ --------
Net (loss) income $(660,639) $447,997 $15,756 $(196,886)
========= ======== ======= =========
Radian Group Inc.
Financial Guaranty Supplemental Information
For the Quarter and Six Months Ended and as of June 30, 2009
Exhibit G
Quarter Ended
(In thousands) June 30
--------------
2009 2008
---- ----
Net Premiums Earned:
Public finance direct $11,935 $12,004
Public finance reinsurance 18,949 22,965
Structured direct 2,058 3,760
Structured reinsurance 5,655 5,092
Trade credit reinsurance 39 220
-- ---
Net Premiums Earned - insurance 38,636 44,041
Impact of commutations (15,054) -
------- --
Total Net Premiums Earned - insurance $23,582 $44,041
======= =======
Refundings included in earned premium $10,479 $16,664
======= =======
Claims paid:
Trade credit reinsurance $693 $397
Financial Guaranty 23,876 4,066
------ -----
Total $24,569 $4,463
======= ======
Six Months Ended
(In thousands) June 30
----------------
2009 2008
---- ----
Net Premiums Earned:
Public finance direct $26,387 $29,814
Public finance reinsurance 27,226 32,835
Structured direct 3,835 7,642
Structured reinsurance 14,296 10,691
Trade credit reinsurance 135 715
--- ---
Net Premiums Earned - insurance 71,879 81,697
Impact of commutations (14,965) -
------- --
Total Net Premiums Earned - insurance $56,914 $81,697
======= =======
Refundings included in earned premium $23,523 $28,321
======= =======
Claims paid:
Trade credit reinsurance $871 $983
Financial Guaranty 38,785 107,590 (1)
------ -------
Total $39,656 $108,573
======= ========
Balance Sheet impact of initial adoption of SFAS No. 163 on January 1,
2009:
--------------------------------------------------------------------------
Increase in unearned premiums $(292,816)
Increase in premiums receivable 161,422
Increase in deferred acquisition costs 66,006
Decrease in reserves for losses 8,163
Decrease in deferred taxes, net 20,239
Increase in premium taxes payable (602)
----
Decrease in equity $(37,588)
========
Pre-tax Income Statement impact of Ambac Commutation:
($ in millions)
Decrease in premiums earned $(15.3)
Decrease in provision for losses 38.6
Increase in amortization of policy acquisition costs (8.9)
----
Increase in pre-tax income $14.4
=====
(1) Includes a $100 million payment related to one credit that is a CDO
of an ABS that was fully reserved for in 2007.
Radian Group Inc.
Financial Guaranty Supplemental Information
For the Quarter and Six Months Ended and as of June 30, 2009
Exhibit H
($ in thousands, except ratios) June 30 December 31 June 30
2009 2008 2008
------- ----------- -------
Statutory Information:
----------------------
Capital and surplus $914,458 $968,197 $982,340
Contingency reserve 504,464 515,023 485,972
------- ------- -------
Qualified statutory capital 1,418,922 1,483,220 1,468,312
Unearned premium reserve 690,512 729,274 866,504
Loss and loss expense reserve 104,441 82,340 54,391
------- ------ ------
Total statutory
policyholders' reserves 2,213,875 2,294,834 2,389,207
Present value of installment
premiums 389,730 380,666 430,450
Soft capital facilities 150,000 150,000 150,000
------- ------- -------
Total statutory claims
paying resources $2,753,605 $2,825,500 $2,969,657
========== ========== ==========
Net debt service outstanding $131,821,119 $138,430,925 $163,252,124
------------ ------------ ------------
Capital leverage ratio (1) 93 93 111
Claims paying leverage ratio (2) 48 49 55
Net par outstanding by product:
Public finance direct $18,329,451 $17,836,221 $18,824,907
Public finance reinsurance 32,830,674 31,578,163 43,114,460
Structured direct 44,679,632 46,001,355 47,235,046
Structured reinsurance 4,816,874 5,310,004 6,010,331
--------- --------- ---------
Total $100,656,631(3) $100,725,743 $115,184,744
============ ============ ============
Reserve for losses and LAE-GAAP Basis:
--------------------------------------
Financial Guaranty $171,459 $219,671 $143,790
Trade Credit 10,333 14,877 23,375
------ ------ ------
Total $181,792 $234,548 $167,165
======== ======== ========
(1) Net debt service outstanding divided by qualified statutory capital.
(2) Net debt service outstanding divided by total statutory claims paying
Resources.
(3) Includes $9.8 billion of par that was commuted with Ambac in July
2009. Also included in public finance net par outstanding is $3.1 billion
for legally defeased bond issues where our financial guaranty policy has
not been extinguished but cash or securities have been deposited in an
escrow account for the benefit of bondholders. SFAS No. 163 requires
that these contracts continue to be accounted for as outstanding
contracts despite the elimination of substantially all risk.
Radian Group Inc.
Mortgage Insurance Supplemental Information
For the Quarter and Six Months Ended and as of June 30, 2009
Exhibit I
Quarter Ended
($ in millions) June 30
---------------------------
2009 % 2008 %
---- - ---- -
Primary new insurance written
-----------------------------
Flow $5,499 100.0% $9,432 97.9%
Structured - - 205 2.1%
-- -- --- ---
Total Primary $5,499 100.0% $9,637 100.0%
====== ===== ====== =====
Flow
Prime $5,492 99.9% $8,743 92.7%
Alt-A 1 - 475 5.0%
A minus and below 6 0.1% 214 2.3%
-- --- --- ---
Total Flow $5,499 100.0% $9,432 100.0%
====== ===== ====== =====
Structured
Prime $- - $204 99.5%
Alt-A - - 1 0.5%
- - -- ---
Total Structured $- - $205 100.0%
== == ==== =====
Total
Prime $5,492 99.9% $8,947 92.8%
Alt-A 1 - 476 5.0%
A minus and below 6 0.1% 214 2.2%
-- --- --- ---
Total Primary $5,499 100.0% $9,637 100.0%
====== ===== ====== =====
Total primary new insurance written by FICO score
-------------------------------------------------
Flow
>=740 $4,009 72.9% $4,364 46.3%
680-739 1,402 25.5% 3,452 36.6%
620-679 87 1.6% 1,512 16.0%
=740 $- - $134 65.4%
680-739 - - 64 31.2%
620-679 - - 7 3.4%
-- -- -- ---
Total Structured $- - $205 100.0%
== == ==== =====
Total
------
>=740 $4,009 72.9% $4,498 46.7%
680-739 1,402 25.5% 3,516 36.4%
620-679 87 1.6% 1,519 15.8%
=740 $7,894 71.1% $7,830 41.8%
680-739 2,991 26.9% 7,067 37.8%
620-679 223 2.0% 3,450 18.4%
=740 $- - $768 63.1%
680-739 - - 433 35.5%
620-679 - - 17 1.4%
-- -- -- ---
Total Structured $- - $1,218 100.0%
== == ====== =====
Total
------
>=740 $7,894 71.1% $8,598 43.1%
680-739 2,991 26.9% 7,500 37.6%
620-679 223 2.0% 3,467 17.4%
=740 $10,225 33.4% $8,287 28.6%
680-739 11,152 36.5% 10,744 37.0%
620-679 7,780 25.5% 8,365 28.9%
=740 $1,153 27.0% $1,291 26.5%
680-739 1,349 31.6% 1,492 30.5%
620-679 1,125 26.3% 1,312 26.9%
=740 $11,378 32.7% $9,578 28.3%
680-739 12,501 35.9% 12,236 36.1%
620-679 8,905 25.6% 9,677 28.6%
=740 1,156 24.5% $1,287 24.5%
680-739 2,271 48.2% 2,509 47.7%
660-679 691 14.7% 772 14.7%
620-659 562 11.9% 654 12.4%