SECURITIES AND EXCHANGE COMMISSION
Washington, D.C. 20549
FORM 6-K
REPORT OF FOREIGN ISSUER
Pursuant to Rule 13a-16 or 15d-16 of the
Securities Exchange Act of 1934
January 26, 2016
KONINKLIJKE
PHILIPS N.V.
(Exact name of registrant as specified in its charter)
Royal Philips
(Translation of registrant’s name into English)
The Netherlands
(Jurisdiction of incorporation or organization)
Breitner Center, Amstelplein 2, 1096 BC Amsterdam, The Netherlands
(Address of principal executive offices)
Indicate by check mark whether the registrant files or will file annual reports under cover Form 20-F or Form 40-F.
Form 20-F þ Form
40-F ¨
Indicate by check mark if the registrant is submitting the Form 6-K in
paper as permitted by Regulation S-T Rule101(b)(1): ¨
Indicate by check mark if
the registrant is submitting the Form 6-K in paper as permitted by Regulation S-T Rule101(b)(7): ¨
Indicate by check mark whether the registrant by furnishing the information contained in this Form is also thereby furnishing the information to the Commission pursuant to Rule 12g3-2(b) under the
Securities Exchange Act of 1934.
Yes ¨
No þ
Name and address of person authorized to receive notices
and communications from the Securities and Exchange Commission:
M.J. van Ginneken
Koninklijke Philips N.V.
Amstelplein 2
1096 BC Amsterdam – The Netherlands
This report comprises a copy of the following press release:
“Philips’ Fourth Quarter and Annual Results 2015”, dated January 26, 2016.
Pursuant to the requirements of the Securities Exchange Act of 1934, the registrant has duly caused this report to be signed on its
behalf, by the undersigned, thereunto duly authorized at Amsterdam, on the 26th of January, 2016.
KONINKLIJKE PHILIPS N.V.
/s/ M.J. van Ginneken
(General Secretary)

Philips reports Q4 comparable sales growth of 2% to EUR 7.1 billion and a 13% improvement in Adjusted EBITA to EUR
842 million
Fourth-quarter highlights
| • |
|
Comparable sales up 2%, driven by 4% growth in the HealthTech portfolio |
| • |
|
Currency-comparable order intake up 15%, driven by North America, China and Western Europe |
| • |
|
Adjusted EBITA1) improved 50 basis points to 11.9% of sales and amounted to EUR 842 million |
| • |
|
EBITA amounted to EUR 263 million, or 3.7% of sales |
| • |
|
Net loss of EUR 39 million, impacted by one-time charges including previously announced pension de-risking, compared to net income of EUR 134 million in Q4 2014 |
| • |
|
Free cash flow of EUR 740 million, compared to EUR 559 million in Q4 2014 |
| • |
|
Philips Lighting separation process on track |
Full-year highlights
| • |
|
Comparable sales up 2% to EUR 24.2 billion, driven by above 4% growth in the HealthTech portfolio |
| • |
|
Currency-comparable order intake up 5%, driven by North America and Western Europe |
| • |
|
Adjusted EBITA improved 20 basis points to 9.2% of sales and amounted to EUR 2.2 billion |
| • |
|
EBITA totaled EUR 1.4 billion, or 5.7% of sales, compared to EUR 821 million, or 3.8% of sales, in 2014 |
| • |
|
Net income amounted to EUR 659 million, compared to EUR 411 million in 2014 |
| • |
|
Free cash flow of EUR 325 million, compared to EUR 497 million in 2014 |
| • |
|
Return on invested capital increased to 7.0%, compared to 4.5% in 2014 |
| • |
|
Proposal to maintain dividend at EUR 0.80 per share |
Frans van Houten,
CEO:
“The fourth quarter of 2015 was another quarter in which Philips delivered year-on-year operational improvements. We
increased Adjusted EBITA across all three sectors and generated close to EUR 1 billion of cash from operations.
In the fourth quarter, we saw
continued sales growth and strong 15% currency-comparable order intake growth in Healthcare, with margins also improving year-on-year. Consumer Lifestyle showed continued robust growth across all businesses, most notably Health & Wellness, while
productivity and product mix improvements resulted in significantly higher margins. Lighting again delivered year-on-year performance improvements, driven by sustained comparable sales and margin growth in the LED business and our effective
management of the market decline in conventional lamps.
Overall, 2015 was a solid year for Philips, as illustrated by consistent performance
improvements in the face of ongoing challenging macroeconomic circumstances. Lighting showed another year of operational improvements, and our HealthTech portfolio, which combines the Healthcare and Consumer Lifestyle businesses, delivered promising
comparable sales growth of more than 4% overall for the year, demonstrating our progress in capitalizing on opportunities in this large and growing market. Order intake growth of 5% in Healthcare was encouraging.
For 2016, we continue to expect modest comparable sales growth and we will build on our 2015 operational performance improvement. Taking into account
ongoing macro-economic headwinds and the phasing of costs and sales, we expect improvements in the year to be back-end loaded.”
| 1) |
Adjusted EBITA is defined as Income from operations (EBIT) excluding amortization of acquired intangible assets, impairment of goodwill and other intangible assets, restructuring charges, acquisition-related costs and
other significant items. A reconciliation of Adjusted EBITA to EBIT is provided in the section ‘Reconciliation of non-GAAP performance measures’ of this release. |
Accelerate! and Separation Update
“Our Accelerate! program continues to drive strong operational improvements across the organization. In Healthcare, for example, we increased sales of
ClarityIQ upgrades for interventional X-ray systems by 50% in 2015 compared to 2013, by automating our system upgrade sales process. In Consumer Lifestyle, we virtually doubled sales on ‘Double 11’ day in China compared to 2014, by
customizing our propositions and leveraging our digital capabilities. In Lighting, we delivered solid sales growth for Consumer Luminaires in the Benelux and Iberia by adapting the portfolio of this business to locally relevant value
propositions.”
Philips’ three cost savings programs all delivered ahead of plan in 2015. The company achieved EUR 290 million of gross
savings in overhead costs, EUR 379 million of gross savings in procurement, and EUR 187 million of productivity savings from the End2End process improvement program.
Philips is on schedule to be able to complete the separation of the Lighting business in the first half of this year. As previously stated, Philips is
reviewing all strategic options for Philips Lighting, including an initial public offering and a private sale. Costs related to the separation amounted to EUR 183 million in 2015. For 2016, the company continues to expect separation costs to be
in the range of EUR 200-300 million.
Q4 2015 Financial and Operational Overview
Healthcare
Healthcare comparable sales grew 3%
year-on-year and currency-comparable order intake grew by 15%. The Adjusted EBITA margin increased by 100 basis points to 15.8%, driven by cost productivity improvements and positive currency impacts.
“We are encouraged by 15% order intake growth in Healthcare, which was driven by strong growth in North America, Western Europe and a substantial
rebound in China. Our focus on multi-year strategic partnerships continued to pay off, as illustrated by three new partnerships based on a managed services model to optimize the delivery of care: with Mackenzie Health in Canada, Granada’s
Clinical Hospital in Spain, and Hospices Civils de Lyon in France.”
Consumer Lifestyle
Consumer Lifestyle comparable sales increased by 6% year-on-year, driven by double-digit growth in Health & Wellness and low-single-digit growth in
Personal Care and Domestic Appliances. The Adjusted EBITA margin increased by 180 basis points to 17.8% year-on-year.
“Consumer Lifestyle once
again delivered a strong top and bottom-line performance, with double-digit growth in growth geographies. In India, for instance, strong sales of the Philips Airfryer, juicers, soup makers and mixer grinders drove double-digit growth. Oral
Healthcare continued its strong trajectory, with a very solid performance in North America, China, and Germany, Austria & Switzerland.”
Lighting
Lighting again improved its operational
results, with the Adjusted EBITA margin increasing by 150 basis points to 10.5% year-on-year. LED lighting comparable sales grew 26% and LED margins continued to improve. LED sales now represent 48% of total Lighting sales, compared to 37% in Q4
2014. Conventional lamps sales decreased by 16%, in line with industry trends, resulting in an overall comparable sales decline of 2% year-on-year.
“The sustained strong performance of our LED business was encouraging, with both sales and margin increasing simultaneously despite significant
technology-driven price erosion. In the quarter, Lighting showcased its leadership in connected lighting by teaming up with companies including Cisco and SAP to address opportunities in the office and street lighting markets respectively. We aim to
further improve Lighting margins by driving growth and margin expansion in LED and maintaining high profitability in the declining conventional lamps market.”
Innovation, Group & Services
Strong comparable
sales growth from emerging businesses was more than offset by lower revenue from IP Royalties and as a result of the divestment of the OEM remote controls business in 2014, resulting in an overall IG&S sales decline of EUR 48 million. Adjusted
EBITA was a net cost of EUR 183 million, compared to a net cost of EUR 100 million in the fourth quarter of 2014.
“We continued to
drive leadership positions in emerging business areas such as digital pathology and handheld diagnostics. For example, Philips and Banyan Biomarkers entered into a joint development agreement to develop and commercialize a new handheld blood test to
rapidly detect traumatic brain injury, such as concussion. The partnership will broaden the application of Philips’ handheld diagnostics system and will strengthen its competitive position in point-of-care diagnostics for acute care settings, a
new growth market for Philips.”
Conference call and audio webcast
A conference call with Frans van Houten, CEO, and Abhijit Bhattacharya, CFO, to discuss the results will start at 10:00AM CET, January 26, 2016. A live
audio webcast of the conference call will be available through the link below.
Philips Q4 2015 Earnings call
Amsterdam, January 26, 2016
Philips Group
Net income
in millions of EUR unless otherwise stated
|
|
|
|
|
|
|
|
|
| |
|
Q4
2014 |
|
|
Q4
2015 |
|
|
|
|
| Sales |
|
|
6,536 |
|
|
|
7,095 |
|
| Adjusted EBITA |
|
|
743 |
|
|
|
842 |
|
| as a % of sales |
|
|
11.4 |
% |
|
|
11.9 |
% |
| EBITA |
|
|
262 |
|
|
|
263 |
|
| as a % of sales |
|
|
4.0 |
% |
|
|
3.7 |
% |
| EBIT |
|
|
162 |
|
|
|
162 |
|
| as a % of sales |
|
|
2.5 |
% |
|
|
2.3 |
% |
| Financial expenses, net |
|
|
(78 |
) |
|
|
(128 |
) |
| Income taxes |
|
|
(16 |
) |
|
|
(152 |
) |
| Results investments in associates |
|
|
(1 |
) |
|
|
6 |
|
| Net income (loss) from continuing operations |
|
|
67 |
|
|
|
(112 |
) |
| Discontinued operations |
|
|
67 |
|
|
|
73 |
|
| Net income (loss) |
|
|
134 |
|
|
|
(39 |
) |
| Net income (loss) attributable to shareholders per common share (in EUR) - diluted |
|
|
0.15 |
|
|
|
(0.05 |
) |
Net income
| • |
|
Net income was a loss of EUR 39 million, compared to a gain of EUR 134 million in Q4 2014. Net income in Q4 2015 was impacted by pension de-risking settlement costs, and higher financial expenses and income
tax charges. |
| • |
|
Adjusted EBITA was EUR 842 million, or 11.9% of sales, compared to EUR 743 million, or 11.4% of sales, in Q4 2014. The increase was mainly driven by cost productivity, partly offset by a negative currency
effect of -0.5 percentage points of sales. |
| • |
|
EBITA amounted to EUR 263 million, or 3.7% of sales, compared to EUR 262 million, or 4.0% of sales, in Q4 2014. Restructuring and acquisition-related charges amounted to EUR 150 million, which included
the acquisition of Volcano, compared to EUR 279 million in Q4 2014. EBITA also included charges of EUR 345 million for settlements mainly related to pension de-risking, EUR 86 million relating to the separation of the Lighting
business, EUR 35 million related to the devaluation of the Argentine peso, and a EUR 37 million gain on the sale of real estate assets. EBITA in Q4 2014 included charges of EUR 201 million related to the Cathode-Ray Tubes (CRT)
antitrust litigation, EUR 68 million of impairment and other charges related to industrial assets at Lighting, and a EUR 67 million past-service pension cost gain. |
| • |
|
Net financial expenses were EUR 128 million, compared to EUR 78 million in Q4 2014. The increase was mainly driven by valuation allowances. |
| • |
|
Income tax expense amounted to EUR 152 million, compared to EUR 16 million in Q4 2014, largely due to lower non-taxable income and changes in tax rates and assets.
|
|
|
|
|
|

|
|
Press Release Q4 2015 |
|
3 |
|
|
|
|
|
|
|
|
|
|
|
|
|
|
|
|
|
| Sales by sector
in millions of EUR unless otherwise stated |
|
| |
|
Q4 |
|
|
Q4 |
|
|
% change |
|
| |
|
2014 |
|
|
2015 |
|
|
nominal |
|
|
comparable |
|
|
|
|
|
|
| Healthcare |
|
|
2,849 |
|
|
|
3,270 |
|
|
|
15 |
% |
|
|
3 |
% |
| Consumer Lifestyle |
|
|
1,528 |
|
|
|
1,663 |
|
|
|
9 |
% |
|
|
6 |
% |
| Lighting |
|
|
1,975 |
|
|
|
2,026 |
|
|
|
3 |
% |
|
|
(2 |
)% |
| Innovation, Group & Services |
|
|
184 |
|
|
|
136 |
|
|
|
(26 |
)% |
|
|
(11 |
)% |
|
|
|
|
|
|
|
|
|
|
|
|
|
|
|
|
|
| Philips Group |
|
|
6,536 |
|
|
|
7,095 |
|
|
|
9 |
% |
|
|
2 |
% |
|
|
|
|
|
|
|
|
|
|
|
|
|
|
|
|
|
| Sales per geographic cluster |
|
|
|
|
|
|
|
|
|
| in millions of EUR unless otherwise stated |
|
|
|
|
|
| |
|
Q4 |
|
|
Q4 |
|
|
% change |
|
| |
|
2014 |
|
|
2015 |
|
|
nominal |
|
|
comparable |
|
|
|
|
|
|
| Western Europe |
|
|
1,776 |
|
|
|
1,767 |
|
|
|
(1 |
)% |
|
|
(3 |
)% |
| North America |
|
|
1,981 |
|
|
|
2,327 |
|
|
|
17 |
% |
|
|
2 |
% |
| Other mature geographies |
|
|
451 |
|
|
|
493 |
|
|
|
9 |
% |
|
|
1 |
% |
|
|
|
|
|
|
|
|
|
|
|
|
|
|
|
|
|
| Total mature geographies |
|
|
4,208 |
|
|
|
4,587 |
|
|
|
9 |
% |
|
|
0 |
% |
| Growth geographies |
|
|
2,328 |
|
|
|
2,508 |
|
|
|
8 |
% |
|
|
6 |
% |
|
|
|
|
|
|
|
|
|
|
|
|
|
|
|
|
|
| Philips Group |
|
|
6,536 |
|
|
|
7,095 |
|
|
|
9 |
% |
|
|
2 |
% |
Sales per sector
| • |
|
Group sales amounted to EUR 7,095 million, an increase of 2% on a comparable basis. Group nominal sales increased by 9%, mainly due to positive currency effects and portfolio changes. |
| • |
|
Healthcare comparable sales grew 3% year-on-year. Healthcare Informatics, Solutions & Services achieved double-digit growth, Imaging Systems recorded mid-single-digit growth and Patient Care &
Monitoring Solutions posted low-single-digit growth. Customer Services was in line with Q4 2014. |
| • |
|
Consumer Lifestyle comparable sales increased by 6%. Health & Wellness achieved double-digit growth while Personal Care and Domestic Appliances recorded low-single-digit growth. |
| • |
|
Lighting comparable sales showed a 2% decline year-on-year. Consumer Luminaires recorded mid-single-digit growth, while Professional Lighting Solutions and Light Sources & Electronics posted a low-single-digit
decline. |
Sales per geographic cluster
| • |
|
Comparable sales in mature geographies were in line with Q4 2014. Western Europe posted a 3% decline, largely driven by the United Kingdom, France and Germany. North America recorded 2% growth and other mature
geographies posted 1% growth. |
| • |
|
Comparable sales in growth geographies showed 6% growth, largely driven by China, India and Middle East & Turkey.
|
|
|
|
|
|
| 4 |
|
Press Release Q4 2015 |
|
|
|
|
|
|
|
|
|
|
|
|
|
|
|
|
|
|
|
| Adjusted EBITA
in millions of EUR unless otherwise stated |
|
| |
|
Q4 2014 |
|
|
Q4 2015 |
|
| |
|
amount |
|
|
% |
|
|
amount |
|
|
% |
|
|
|
|
|
|
| Healthcare |
|
|
421 |
|
|
|
14.8 |
% |
|
|
516 |
|
|
|
15.8 |
% |
| Consumer Lifestyle |
|
|
244 |
|
|
|
16.0 |
% |
|
|
296 |
|
|
|
17.8 |
% |
| Lighting |
|
|
178 |
|
|
|
9.0 |
% |
|
|
213 |
|
|
|
10.5 |
% |
| Innovation, Group & Services |
|
|
(100 |
) |
|
|
— |
|
|
|
(183 |
) |
|
|
— |
|
|
|
|
|
|
|
|
|
|
|
|
|
|
|
|
|
|
| Philips Group |
|
|
743 |
|
|
|
11.4 |
% |
|
|
842 |
|
|
|
11.9 |
% |
|
| EBITA
in millions of EUR unless otherwise stated |
|
|
|
|
| |
|
Q4 2014 |
|
|
Q4 2015 |
|
| |
|
amount |
|
|
% |
|
|
amount |
|
|
% |
|
|
|
|
|
|
| Healthcare |
|
|
390 |
|
|
|
13.7 |
% |
|
|
431 |
|
|
|
13.2 |
% |
| Consumer Lifestyle |
|
|
251 |
|
|
|
16.4 |
% |
|
|
247 |
|
|
|
14.9 |
% |
| Lighting |
|
|
(40 |
) |
|
|
(2.0 |
)% |
|
|
152 |
|
|
|
7.5 |
% |
| Innovation, Group & Services |
|
|
(339 |
) |
|
|
— |
|
|
|
(567 |
) |
|
|
— |
|
|
|
|
|
|
|
|
|
|
|
|
|
|
|
|
|
|
| Philips Group |
|
|
262 |
|
|
|
4.0 |
% |
|
|
263 |
|
|
|
3.7 |
% |
EBIT
in millions of EUR unless otherwise stated
|
|
|
|
|
|
|
|
|
| |
|
Q4
2014 |
|
|
Q4
2015 |
|
|
|
|
| Healthcare |
|
|
351 |
|
|
|
374 |
|
| Consumer Lifestyle |
|
|
237 |
|
|
|
235 |
|
| Lighting |
|
|
(83 |
) |
|
|
125 |
|
| Innovation, Group & Services |
|
|
(343 |
) |
|
|
(572 |
) |
|
|
|
|
|
|
|
|
|
| Philips Group |
|
|
162 |
|
|
|
162 |
|
| as a % of sales |
|
|
2.5 |
% |
|
|
2.3 |
% |
Earnings per sector
| • |
|
Healthcare Adjusted EBITA amounted to EUR 516 million, or 15.8% of sales, compared to EUR 421 million, or 14.8% of sales, in Q4 2014. The improvement was mainly driven by cost productivity and positive
currency impacts, partly offset by price and product mix. |
| • |
|
Consumer Lifestyle Adjusted EBITA was EUR 296 million, or 17.8% of sales, compared to EUR 244 million, or 16.0% of sales, in Q4 2014. The improvement was mainly driven by cost productivity, higher volumes and
product mix. |
| • |
|
Lighting Adjusted EBITA improved to EUR 213 million, or 10.5% of sales, compared to EUR 178 million, or 9.0% of sales, in Q4 2014. The increase was mainly driven by cost productivity and an improvement in LED
and conventional gross margins. |
| • |
|
Innovation, Group & Services Adjusted EBITA was a net cost of EUR 183 million, compared to a net cost of EUR 100 million in Q4 2014. The Adjusted EBITA decrease was mainly due to lower revenues from
IP Royalties, investments in emerging business areas and an increase in Group and Regional Costs. |
|
|
|
|
|
|
|
|
Press Release Q4 2015 |
|
5 |
Cash balance
in millions of EUR
|
|
|
|
|
|
|
|
|
| |
|
Q4
2014 |
|
|
Q4
2015 |
|
|
|
|
| Beginning cash balance |
|
|
1,716 |
|
|
|
1,025 |
|
| Free cash flow |
|
|
559 |
|
|
|
740 |
|
| Net cash flow from operating activities |
|
|
841 |
|
|
|
956 |
|
| Net capital expenditures |
|
|
(282 |
) |
|
|
(216 |
) |
| Acquisitions and divestments of businesses |
|
|
26 |
|
|
|
(16 |
) |
| Other cash flow from investing activities |
|
|
(5 |
) |
|
|
16 |
|
| Treasury shares transactions |
|
|
(134 |
) |
|
|
(101 |
) |
| Changes in debt |
|
|
(366 |
) |
|
|
44 |
|
| Effect of change in exchange rates on cash |
|
|
39 |
|
|
|
(9 |
) |
| Net cash flow discontinued operations |
|
|
38 |
|
|
|
67 |
|
|
|
|
|
|
|
|
|
|
| Ending cash balance |
|
|
1,873 |
|
|
|
1,766 |
|
Cash flows from operating activities
in millions of EUR
Gross capital expenditures1)
in millions of EUR
| 1) |
Capital expenditures on property, plant and equipment only
|
Cash balance
| • |
|
In Q4 2015 the cash balance increased to EUR 1,766 million, with a free cash inflow of EUR 740 million, which included an outflow of EUR 446 million mainly related to pension de-risking settlements in the
United States and the United Kingdom. The cash balance was also impacted by the use of EUR 101 million in treasury shares transactions, primarily for the share buy-back program, and by a EUR 67 million inflow related to cash flows from
discontinued operations. |
| • |
|
The cash balance increased during Q4 2014 to EUR 1,873 million, with a free cash inflow of EUR 559 million, which included an outflow of EUR 49 million in the form of a pension contribution related to the
de-risking of the Dutch pension plan. The cash balance was also impacted by the use of EUR 134 million in treasury shares transactions, primarily for the share buy-back program, and EUR 366 million mainly related to debt repayment.
|
| • |
|
As of December 31, 2015, Philips had completed 74% of the 3-year EUR 1.5 billion share buy-back program. |
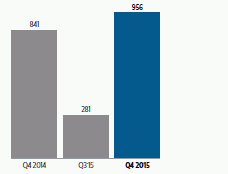
Cash flows from operating activities
| • |
|
Operating activities resulted in a cash flow of EUR 956 million, compared to EUR 841 million in Q4 2014. An improvement in working capital was partly offset by lower earnings. |
Gross capital expenditures
| • |
|
Gross capital expenditures on property, plant and equipment were EUR 25 million above the level of Q4 2014, mainly due to higher investments in real estate refurbishments to increase building capacity and reduce
the overall real estate footprint. |
|
|
|
|
|
| 6 |
|
Press Release Q4 2015 |
|
|
Inventories
in millions of EUR unless otherwise stated
| 1) |
Sales is calculated over the preceding 12 months |
| 2) |
Inventories as a % of sales excludes inventories and sales related to acquisitions, divestments and discontinued operations |
Net debt and Group equity
in billions of EUR unless
otherwise stated

Number of employees
in FTEs
| 1) |
Number of employees excludes discontinued operations. Discontinued operations had 8,755 employees in Q4 2015 (Q3 2015:8,812, Q4 2014: 8,313). The year-on-year increase was mainly due to the transfer of employees to the
combined businesses of Lumileds and Automotive as it operates as a stand-alone company. |
| 2) |
Number of employees includes 12,189 third-party workers in Q4 2015 (Q3 2015:13,338 , Q4 2014:12,867 ).
|
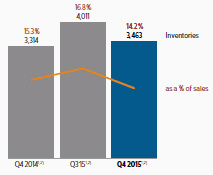
Inventories
| • |
|
Inventory value at the end of Q4 2015 was EUR 3.5 billion as reported and amounted to 14.2% of sales.* |
| • |
|
Compared to Q4 2014, inventories as a percentage of sales decreased by 1.1 percentage points. The decrease was mainly driven by reductions in all sectors and currency impacts. |
Net debt and Group equity
| • |
|
At the end of Q4 2015, Philips had a net debt position of EUR 4.0 billion, compared to EUR 2.2 billion at the end of Q4 2014, mainly due to the acquisition of Volcano. During the quarter, the net debt position decreased
by EUR 528 million, reflecting a EUR 213 million increase in debt and a EUR 741 million increase in liquidity. |
| • |
|
Group equity increased in the quarter to EUR 11.8 billion. The increase was largely a result of currency effects, partly offset by the net loss realized during the period. |
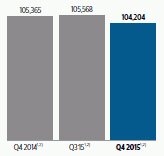
Employees
| • |
|
The number of employees decreased by 1,161 year-on-year. Reductions in headcount at Consumer Lifestyle and industrial footprint rationalization at Lighting were partly offset by increases at Healthcare, mainly related
to the Volcano acquisition. |
| • |
|
The number of employees decreased by 1,364 compared to Q3 2015. Industrial footprint rationalization at Lighting and reductions at Consumer Lifestyle were partly offset by increases at Healthcare. |
| * |
Inventories as a % of sales excludes inventories and sales related to acquisitions, divestments and discontinued operations
|
|
|
|
|
|
|
|
|
Press Release Q4 2015 |
|
7 |
Healthcare
Key data
in millions of EUR unless otherwise stated
|
|
|
|
|
|
|
|
|
| |
|
Q4
2014 |
|
|
Q4
2015 |
|
|
|
|
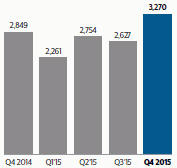
| Sales |
|
|
2,849 |
|
|
|
3,270 |
|
| Sales growth |
|
|
|
|
|
|
|
|
| % nominal |
|
|
1 |
% |
|
|
15 |
% |
| % comparable |
|
|
(3 |
)% |
|
|
3 |
% |
| Adjusted EBITA |
|
|
421 |
|
|
|
516 |
|
| as a % of sales |
|
|
14.8 |
% |
|
|
15.8 |
% |
| EBITA |
|
|
390 |
|
|
|
431 |
|
| as a % of sales |
|
|
13.7 |
% |
|
|
13.2 |
% |
| EBIT |
|
|
351 |
|
|
|
374 |
|
| as a % of sales |
|
|
12.3 |
% |
|
|
11.4 |
% |
| Net operating capital (NOC) |
|
|
7,565 |
|
|
|
9,212 |
|
| Number of employees (FTEs)1) |
|
|
37,065 |
|
|
|
40,099 |
|
| 1) |
Number of employees includes 2,642 third-party workers in Q4 2015 (Q4 2014: 2,443). |
Sales
in millions of EUR
Adjusted EBITA
in
millions of EUR unless otherwise stated

Business highlights
| • |
|
Philips entered into three multi-year strategic partnerships based on a managed services model to optimize the delivery of care: with Mackenzie Health in Canada, Granada’s Clinical Hospital in Spain, and Hospices
Civils de Lyon in France. |
| • |
|
Philips and UCHealth, an integrated delivery network (IDN) in Colorado, USA, signed a multi-year agreement for the implementation of Philips’ IntelliSpace Picture Archiving and Communications Systems across the IDN
to optimize its image sharing workflow, thereby enhancing patient care and driving projected USD 11 million cost savings over five years. |
| • |
|
Delivering on its commitment to provide access to high-quality care at affordable cost around the globe, Philips expanded its portfolio to also reach remote areas, with the new range of Efficia patient monitors in
Tanzania as well as a new diagnostic device to help improve the diagnosis and treatment of pneumonia. |
| • |
|
Reinforcing its innovation strength in image-guided therapy, Philips established a new in-house simulation facility for more efficient design validation and end-user testing of its new propositions. In addition, teams
from the University of Texas MD Anderson Cancer Center, Elekta and Philips completed the installation of the first high-field MRI-guided linear accelerator in the US to drive innovation in MRI-guided radiation therapy. |
Financial performance
| • |
|
Currency-comparable order intake showed 15% growth year-on-year. Imaging Systems and Healthcare Informatics, Solutions & Services achieved double-digit growth, while Patient Care & Monitoring Solutions
was in line with Q4 2014. |
| • |
|
Currency-comparable order intake in mature geographies showed double-digit growth, driven by strong growth in North America and Western Europe and low-single-digit growth in other mature geographies. Growth geographies
recorded double-digit growth, mainly due to double-digit growth in China. |
|
|
|
|
|
| 8 |
|
Press Release Q4 2015 |
|
|
EBITA
in
millions of EUR unless otherwise stated
| • |
|
Comparable sales grew 3% year-on-year. Healthcare Informatics, Solutions & Services achieved double-digit growth, Imaging Systems recorded mid-single-digit growth and Patient Care & Monitoring
Solutions posted low-single-digit growth. Customer Services remained in line with Q4 2014. |
| • |
|
Comparable sales in mature geographies showed low-single-digit growth. North America achieved low-single-digit growth and other mature geographies posted mid-single-digit growth, while Western Europe recorded a
low-single-digit decline. Growth geographies achieved double-digit growth, mainly driven by strong growth in China and Middle East & Turkey. |
| • |
|
Adjusted EBITA amounted to EUR 516 million, or 15.8% of sales, compared to EUR 421 million, or 14.8% of sales, in Q4 2014. The improvement was mainly driven by cost productivity and positive currency impacts,
partly offset by price and product mix. |
| • |
|
EBITA amounted to EUR 431 million, or 13.2% of sales, compared to EUR 390 million, or 13.7% of sales, in Q4 2014. EBITA in Q4 2015 included charges of EUR 8 million related to the devaluation of the
Argentine peso, as well as restructuring and acquisition-related charges of EUR 77 million, which included the Volcano acquisition. In Q4 2014, EBITA included a EUR 16 million past-service pension cost gain and restructuring and
acquisition-related charges of EUR 47 million. |
| • |
|
Net operating capital, excluding a currency translation effect of EUR 732 million, increased by EUR 915 million year-on-year. The increase was mainly due to the Volcano acquisition. |
| • |
|
Inventories as a percentage of sales* decreased by 1.4 percentage points year-on-year, largely driven by currency impacts. |
| • |
|
Compared to Q4 2014, the number of employees increased by 3,034, mainly driven by the Volcano acquisition, increases at Healthcare Informatics, Solutions & Services, and Cleveland production ramp-up at Imaging
Systems. Compared to Q3 2015, the number of employees increased by 322, mainly due to increases at Healthcare Informatics, Solutions & Services. |
Miscellaneous
| • |
|
Restructuring and acquisition-related charges in Q1 2016 are expected to total approximately EUR 20 million. |
| * |
Inventories as a % of sales excludes inventories and sales related to acquisitions, divestments and discontinued operations
|
|
|
|
|
|
|
|
|
Press Release Q4 2015 |
|
9 |
Consumer Lifestyle
Key data
in millions of EUR unless otherwise stated
|
|
|
|
|
|
|
|
|
| |
|
Q4
2014 |
|
|
Q4
2015 |
|
|
|
|
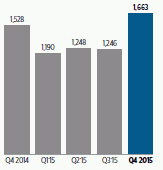
| Sales |
|
|
1,528 |
|
|
|
1,663 |
|
| Sales growth |
|
|
|
|
|
|
|
|
| % nominal |
|
|
7 |
% |
|
|
9 |
% |
| % comparable |
|
|
6 |
% |
|
|
6 |
% |
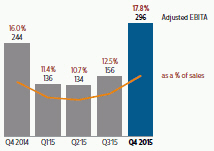
| Adjusted EBITA |
|
|
244 |
|
|
|
296 |
|
| as a % of sales |
|
|
16.0 |
% |
|
|
17.8 |
% |
| EBITA |
|
|
251 |
|
|
|
247 |
|
| as a % of sales |
|
|
16.4 |
% |
|
|
14.9 |
% |
| EBIT |
|
|
237 |
|
|
|
235 |
|
| as a % of sales |
|
|
15.5 |
% |
|
|
14.1 |
% |
| Net operating capital (NOC) |
|
|
1,353 |
|
|
|
1,453 |
|
| Number of employees (FTEs)1) |
|
|
16,639 |
|
|
|
16,254 |
|
| 1) |
Number of employees includes 3,517 third-party workers in Q4 2015 (Q4 2014: 3,351). |
Sales
in millions of EUR
Adjusted EBITA
in
millions of EUR unless otherwise stated
Business highlights
| • |
|
Meaningful innovation for the home, coupled with impactful marketing, delivered double-digit growth in India, with strong sales of the Philips Airfryer, juicers, soup makers and mixer grinders. Male Grooming and Beauty
also performed very well, with 100,000 groomers sold in the newly launched male body-grooming category. |
| • |
|
On China’s biggest day for online shopping, ‘Double 11’, Philips was a leading brand in categories like Male Grooming, Beauty, Garment Care, Kitchen Appliances and Oral Healthcare, with some product
ranges selling out within minutes. Male shaving products were particularly popular, with over half a million Philips shavers sold in 24 hours. |
| • |
|
European markets continue to perform well, with strong performance in the Benelux and Germany, Austria & Switzerland. In the Benelux, the success of the Philips Airfryer continues with strong advocacy from
consumers. In Germany, Austria & Switzerland, additional investments in advertising and promotion drove double-digit growth across almost all categories. |
| • |
|
Oral Healthcare experienced double-digit growth, with very strong performance in North America, China and Germany, Austria & Switzerland. The Philips Sonicare 2 electric toothbrush range was cited by US
retailer Target as one of the most popular items in their Black Friday pre-sale. |
| • |
|
Driven by strong growth especially in North America, China and several European markets, Mother & Child Care achieved double-digit growth globally. This was largely thanks to the continued success of the
Philips Avent Natural Infant Feeding and Comfort ranges. |
Financial performance
| • |
|
Comparable sales increased by 6% year-on-year. Health & Wellness achieved double-digit growth, while Personal Care and Domestic Appliances recorded low-single-digit growth. |
| • |
|
Comparable sales in growth geographies showed double-digit growth, mainly driven by Asia Pacific and Central & Eastern Europe. Mature geographies achieved low-single-digit growth, driven by North America and
Western Europe. Other mature geographies were in line with Q4 2014. |
|
|
|
|
|
| 10 |
|
Press Release Q4 2015 |
|
|
EBITA
in
millions of EUR unless otherwise stated
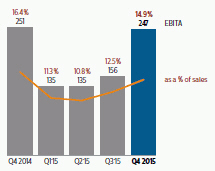
| • |
|
Adjusted EBITA was EUR 296 million, or 17.8% of sales, compared to EUR 244 million, or 16.0% of sales, in Q4 2014. The improvement was mainly driven by cost productivity, higher volumes and product mix.
|
| • |
|
EBITA amounted to EUR 247 million, or 14.9% of sales, compared to EUR 251 million, or 16.4% of sales, in Q4 2014. Restructuring and acquisition-related charges were EUR 36 million in Q4 2015, compared to
EUR 4 million in Q4 2014. EBITA in Q4 2015 also included EUR 13 million of charges related to the devaluation of the Argentine peso, while Q4 2014 included a EUR 11 million past-service pension cost gain. |
| • |
|
Net operating capital, excluding a currency translation effect of EUR 56 million, increased by EUR 44 million year-on-year. |
| • |
|
Inventories as a percentage of sales* were 1.7 percentage points lower than in Q4 2014, mainly driven by reductions in all businesses. |
| • |
|
The number of employees decreased by 385 compared to Q4 2014 and 509 compared to Q3 2015, mainly due to reductions in manufacturing in Asia Pacific. |
Miscellaneous
| • |
|
Restructuring and acquisition-related charges in Q1 2016 are expected to be nil. |
| * |
Inventories as a % of sales excludes inventories and sales related to acquisitions, divestments and discontinued operations
|
|
|
|
|
|
|
|
|
Press Release Q4 2015 |
|
11 |
Lighting
(Excluding the combined businesses of Lumileds and Automotive)
Key data
in millions of EUR unless otherwise stated
|
|
|
|
|
|
|
|
|
| |
|
Q4
2014 |
|
|
Q4
2015 |
|
|
|
|
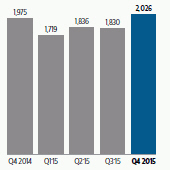
| Sales |
|
|
1,975 |
|
|
|
2,026 |
|
| Sales growth |
|
|
|
|
|
|
|
|
| % nominal |
|
|
3 |
% |
|
|
3 |
% |
| % comparable |
|
|
(3 |
)% |
|
|
(2 |
)% |
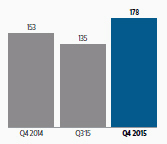
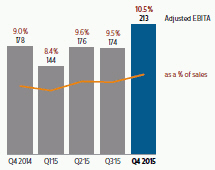
| Adjusted EBITA |
|
|
178 |
|
|
|
213 |
|
| as a % of sales |
|
|
9.0 |
% |
|
|
10.5 |
% |
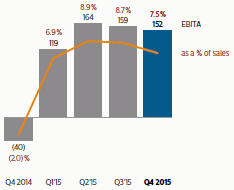
| EBITA |
|
|
(40 |
) |
|
|
152 |
|
| as a % of sales |
|
|
(2.0 |
)% |
|
|
7.5 |
% |
| EBIT |
|
|
(83 |
) |
|
|
125 |
|
| as a % of sales |
|
|
(4.2 |
)% |
|
|
6.2 |
% |
| Net operating capital (NOC) |
|
|
3,638 |
|
|
|
3,813 |
|
| Number of employees (FTEs)1) |
|
|
37,808 |
|
|
|
33,618 |
|
| 1) |
Number of employees includes 4,052 third-party workers in Q4 2015 (Q4 2014: 5,463) |
Sales
in millions of EUR
Adjusted EBITA
in
millions of EUR unless otherwise stated
Business highlights
| • |
|
Building on the company’s leadership in connected lighting, Philips entered into a global strategic alliance with Cisco to address the growing worldwide office market. Integrating Philips’ connected LED
lighting system with Cisco’s IT network will save energy, improve building efficiency, and enhance employee well-being and productivity. |
| • |
|
Leveraging the expansion of Philips’ smart street lighting offering, Los Angeles and San Jose are the first cities to benefit from Philips LED street lighting combined with wireless broadband technology from
Ericsson. Philips SmartPoles will expand wireless broadband coverage, reduce energy usage by more than 50%, and provide brighter, safer streets at night. |
| • |
|
Philips is collaborating with SAP to allow data from Philips CityTouch connected LED street lighting to be integrated with data from sensors in the SAP HANA business platform on one dashboard. City planners can manage
data from assets such as street lighting, bus stops and traffic controls, allowing them to better plan and manage cost. The system is being rolled-out in Buenos Aires, integrating data from more than 700,000 assets, including 91,000 updated street
lights. |
| • |
|
As the pioneer in the shift to connected lighting for the home, Philips teamed up with Xiaomi, a leading Chinese smartphone operator, to launch the Philips EyeCare desk lamp. When connected to an app through the Xiaomi
smartphone, the light from the desk lamp adjusts according to the environment, ensuring the right light for the task at hand as well as optimum visual comfort. |
| • |
|
Applying its expertise in energy-efficient and colorful, dynamic LED lighting, Philips lit up a range of iconic buildings and landmarks, revitalizing the Cairo Opera House, transforming Europe’s largest butterfly
sanctuary in Turkey, enabling night play at a renowned golf course in Antalya, Turkey, and revamping Paris’ City Hall. |
Financial
performance
| • |
|
Comparable sales showed a 2% decline year-on-year. Professional Lighting Solutions and Light Sources & Electronics posted a low-single-digit decline, while Consumer Luminaires recorded mid-single-digit growth.
|
| • |
|
Comparable sales in mature geographies showed a low-single-digit decline compared to Q4 2014. Growth geographies recorded a low-single-digit decline, mainly due to Latin America, partly offset by India and
Central & Eastern Europe. |
|
|
|
|
|
| 12 |
|
Press Release Q4 2015 |
|
|
EBITA
in
millions of EUR unless otherwise stated
| • |
|
LED lighting sales grew 26% year-on-year and now represent 48% of total Lighting sales, compared to 37% in Q4 2014. Conventional lighting sales declined 20% year-on-year, in line with the industry trend, mainly due to a
16% decline in lamps sales, and now represent 52% of total Lighting sales, compared to 63% in Q4 2014. |
| • |
|
Adjusted EBITA improved to EUR 213 million, or 10.5% of sales, compared to EUR 178 million, or 9.0% of sales, in Q4 2014. The increase was mainly driven by cost productivity and an improvement in LED and
conventional gross margins. |
| • |
|
EBITA improved to EUR 152 million, or 7.5% of sales, compared to a EUR 40 million loss in Q4 2014. Restructuring and acquisition-related charges amounted to EUR 47 million, compared to EUR
163 million in Q4 2014. EBITA in Q4 2015 also included EUR 14 million of charges related to the devaluation of the Argentine peso, while EBITA in Q4 2014 included a past-service pension cost gain of EUR 13 million and EUR
68 million of impairment and other charges related to industrial assets. |
| • |
|
Net operating capital, excluding a currency translation effect of EUR 283 million, decreased by EUR 108 million year-on-year. |
| • |
|
Inventories as a percentage of sales* decreased by 0.9 percentage points year-on-year, mainly driven by currency impacts. |
| • |
|
Compared to Q4 2014, the number of employees decreased by 4,190, reflecting rationalization of the industrial footprint. Compared to Q3 2015, the number of employees decreased by 1,390. |
Miscellaneous
| • |
|
Restructuring and acquisition-related charges in Q1 2016 are expected to total approximately EUR 30 million. |
| * |
Inventories as a % of sales excludes inventories and sales related to acquisitions, divestments and discontinued operations
|
|
|
|
|
|
|
|
|
Press Release Q4 2015 |
|
13 |
Additional information on the combined businesses of Lumileds and Automotive
The combined businesses of Lumileds and Automotive are reported as discontinued operations in the Consolidated
statements of income and cash flows. As a result, Lumileds and Automotive sales and EBITA are no longer included in the Lighting and Group results of continuing operations. The applicable assets and liabilities of the combined businesses are
reported under Assets and Liabilities classified as held for sale in the Condensed consolidated balance sheets as per November 2014.
EBITA was EUR
12 million, compared to EUR 44 million in Q4 2014. The decrease in operational performance was mainly due to lower gross margins and higher expenditures for growth initiatives. In Q4 2015, the net income of discontinued operations
attributable to the combined businesses of Lumileds and Automotive increased to EUR 74 million from EUR 28 million in Q4 2014, mainly due to lower income tax charges, predominantly relating to higher tax incentives.
The number of employees increased by 442 year-on-year, mainly driven by manufacturing in Asia Pacific and increases in support functions, as the businesses are
being set up as a stand-alone company.
Overhead and other indirect costs of Philips that were previously allocated to Lumileds and Automotive and were not
affected by the transfer to Discontinued operations have been allocated to Lighting and IG&S (Former net costs allocated to Lighting and IG&S).
As
announced on January 22, 2016, Philips and GO Scale Capital have withdrawn their filing with the Committee on Foreign Investment in the United States (CFIUS) and terminated the agreement pursuant to which the consortium led by GO Scale Capital
would acquire an 80.1% interest in the combined businesses of Lumileds and Automotive. Despite the parties’ extensive efforts to mitigate CFIUS’ concern, regulatory clearance has not been granted for this particular transaction. Philips is
now actively engaging with other parties that have expressed an interest in the businesses and will continue to report the Lumileds and Automotive businesses as discontinued operations.
Results of combined Lumileds and Automotive businesses
in millions of EUR
|
|
|
|
|
|
|
|
|
| |
|
Q4
2014 |
|
|
Q4
2015 |
|
|
|
|
| EBITA |
|
|
44 |
|
|
|
12 |
|
| Adjustment of amortization and depreciation following assets held for sale reclassification |
|
|
16 |
|
|
|
49 |
|
|
|
|
| Disentanglement costs |
|
|
(9 |
) |
|
|
(3 |
) |
|
|
|
| Former net costs allocated to Lighting |
|
|
— |
|
|
|
— |
|
| Former net costs allocated to IG&S |
|
|
23 |
|
|
|
16 |
|
|
|
|
| Amortization of other intangibles added back |
|
|
(4 |
) |
|
|
— |
|
|
|
|
|
|
|
|
|
|
|
|
|
| EBIT of discontinued operations |
|
|
70 |
|
|
|
74 |
|
|
|
|
| Financial income and expenses |
|
|
— |
|
|
|
1 |
|
|
|
|
| Income taxes |
|
|
(42 |
) |
|
|
(1 |
) |
|
|
|
|
|
|
|
|
|
|
|
|
| Net income of discontinued operations |
|
|
28 |
|
|
|
74 |
|
|
|
|
| Number of employees (FTEs) |
|
|
8,313 |
|
|
|
8,755 |
|
|
|
|
|
|
| 14 |
|
Press Release Q4 2015 |
|
|
Innovation, Group & Services
Key data
in millions of EUR unless otherwise stated
|
|
|
|
|
|
|
|
|
| |
|
Q4
2014 |
|
|
Q4
2015 |
|
|
|
|
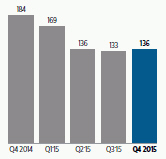
| Sales |
|
|
184 |
|
|
|
136 |
|
| Sales growth |
|
|
|
|
|
|
|
|
| % nominal |
|
|
(18 |
)% |
|
|
(26 |
)% |
| % comparable |
|
|
(21 |
)% |
|
|
(11 |
)% |
| Adjusted EBITA of: |
|
|
|
|
|
|
|
|
| Group Innovation |
|
|
(42 |
) |
|
|
(61 |
) |
| IP Royalties |
|
|
94 |
|
|
|
55 |
|
| Group and Regional Costs |
|
|
(60 |
) |
|
|
(108 |
) |
| Accelerate! investments |
|
|
(40 |
) |
|
|
(26 |
) |
| Pensions |
|
|
(5 |
) |
|
|
(3 |
) |
| Service Units and Other |
|
|
(47 |
) |
|
|
(40 |
) |
|
|
|
|
|
|
|
|
|
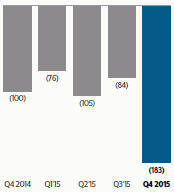
| Adjusted EBITA |
|
|
(100 |
) |
|
|
(183 |
) |
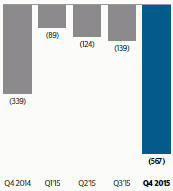
| EBITA |
|
|
(339 |
) |
|
|
(567 |
) |
| EBIT |
|
|
(343 |
) |
|
|
(572 |
) |
| Net operating capital (NOC) |
|
|
(3,718 |
) |
|
|
(3,382 |
) |
| Number of employees (FTEs)1) |
|
|
13,853 |
|
|
|
14,233 |
|
| 1) |
Number of employees includes 1,978 third-party workers in Q4 2015 (Q4 2014: 1,610) |
Sales
in millions of EUR
Adjusted EBITA
in
millions of EUR
Business highlights
| • |
|
Philips and Banyan Biomarkers entered into a joint development agreement to develop and commercialize a new handheld blood test to detect concussion. The partnership will broaden the application of Philips’
handheld diagnostics system and will strengthen its competitive position in point-of-care diagnostics for acute care settings, a new growth market for Philips. |
| • |
|
Philips welcomed the 600th member to its LED Luminaires and Retrofit Bulbs Licensing Program, which gives licensees access to its wide portfolio of patented LED system technologies and solutions. Philips has fostered
the adoption of LED technology and LED industry growth through the licensing program since its inception in 2008. |
| • |
|
For the third consecutive time, Philips received the Thomson Reuters 2015 Top 100 Global Innovator Award, highlighting Philips’ achievements in innovation and the creation and protection of intellectual property.
|
| • |
|
At the 2015 Paris climate conference, Philips committed to becoming carbon-neutral by 2020. In North America, Philips will already use 100% renewable energy for its operations by the end of 2016. |
Financial performance
| • |
|
Sales decreased from EUR 184 million in Q4 2014 to EUR 136 million. Higher revenues from Philips’ emerging businesses like Photonics were more than offset by lower revenues from IP Royalties related to Optical
and Audio/Video and the divestment of the OEM remote controls business in 2014. |
| • |
|
Adjusted EBITA was a net cost of EUR 183 million, compared to a net cost of EUR 100 million in Q4 2014. The Adjusted EBITA decrease was mainly due to lower revenues from IP Royalties, investments in emerging
business areas and an increase in Group and Regional Costs. |
| • |
|
EBITA amounted to a net cost of EUR 567 million, compared to a net cost of EUR 339 million in Q4 2014. EBITA in Q4 2015 included a EUR 10 million net release of restructuring charges, compared to EUR
65 million of restructuring charges in Q4 2014. In Q4 2015, EBITA also included charges of EUR 86 million related to the separation of the Lighting business, EUR 345 million of settlements mainly related to pension de-risking, and a
EUR 37 million gain related to the sale of real estate assets. EBITA in Q4 2014 also included EUR 201 million of charges related to the CRT antitrust litigation and a EUR 27 million past-service pension cost gain. |
| • |
|
Net operating capital, excluding a currency translation effect of EUR 179 million, increased by EUR 515 million year-on-year, mainly due to a decrease in provisions.
|
|
|
|
|
|
|
|
|
Press Release Q4 2015 |
|
15 |
EBITA
in
millions of EUR
| • |
|
Compared to Q4 2014, the number of employees increased by 380, primarily driven by growth at the Philips Innovation Campus in Bangalore. The number of employees increased by 213 compared to Q3 2015. |
Miscellaneous
| • |
|
Restructuring and separation charges in Q1 2016 are expected to total approximately EUR 90 million. |
| • |
|
In 2016, Philips expects a net reduction in sales of EUR 60 million, mainly reflecting lower royalty income due to the expiration of licenses. Of this amount, EUR 40 million is expected to be recognized in Q1
2016. |
|
|
|
|
|
| 16 |
|
Press Release Q4 2015 |
|
|
Proposed distribution
A proposal will be submitted to the General Meeting of Shareholders to declare a distribution of EUR
0.80 per common share (up to EUR 740 million), in cash or shares at the option of the shareholder, against net income and retained earnings. Further details will be given in the agenda for the General Meeting of Shareholders, to be held on
May 12, 2016.
|
|
|
|
|
|
|
|
Press Release Q4 2015 |
|
17 |
Full-year highlights
Net income
in millions of EUR unless otherwise stated
|
|
|
|
|
|
|
|
|
| |
|
January to December |
|
| |
|
2014 |
|
|
2015 |
|
|
|
|
| Sales |
|
|
21,391 |
|
|
|
24,244 |
|
| Adjusted EBITA |
|
|
1,915 |
|
|
|
2,240 |
|
| as a % of sales |
|
|
9.0 |
% |
|
|
9.2 |
% |
| EBITA |
|
|
821 |
|
|
|
1,372 |
|
| as a % of sales |
|
|
3.8 |
% |
|
|
5.7 |
% |
| EBIT |
|
|
486 |
|
|
|
992 |
|
| as a % of sales |
|
|
2.3 |
% |
|
|
4.1 |
% |
| Financial income and expenses |
|
|
(301 |
) |
|
|
(369 |
) |
| Income taxes |
|
|
(26 |
) |
|
|
(239 |
) |
| Results investments in associates |
|
|
62 |
|
|
|
30 |
|
| Net income from continuing operations |
|
|
221 |
|
|
|
414 |
|
| Discontinued operations |
|
|
190 |
|
|
|
245 |
|
| Net income |
|
|
411 |
|
|
|
659 |
|
| Net income attributable to shareholders per common share (in EUR) - diluted |
|
|
0.45 |
|
|
|
0.70 |
|
Performance of the Group
| • |
|
Group sales amounted to EUR 24.2 billion, EUR 2.9 billion higher than in 2014. Adjusted for currency impacts and consolidation changes, sales were 2% higher year-on-year. |
| • |
|
Adjusted EBITA increased by EUR 325 million compared to 2014. The year-on-year increase was mainly driven by improved performance in all operating sectors. |
| • |
|
Group EBITA amounted to EUR 1.4 billion, or 5.7% of sales, an increase of EUR 551 million compared to 2014. Restructuring and acquisition-related charges amounted to EUR 283 million, which included the Volcano
acquisition, compared to EUR 434 million in 2014. EBITA also included charges of EUR 345 million mainly related to settlements for pension de-risking, EUR 183 million relating to the separation of the Lighting business, EUR
35 million related to the devaluation of the Argentine peso, EUR 31 million relating to legal provisions, EUR 28 million related to the currency revaluation of the provision for the Masimo litigation, and a EUR 37 million gain
related to the sale of real estate assets. EBITA in 2014 included charges of EUR 366 million related to the provision for the Masimo litigation, EUR 244 million related to the CRT antitrust litigation, EUR 68 million of impairment and
other charges related to industrial assets at Lighting, EUR 49 million of mainly inventory write-downs related to the Cleveland facility, and a EUR 67 million past-service pension cost gain. |
| • |
|
Net income of EUR 659 million increased by EUR 248 million year-on-year, driven by higher results from the operating sectors and discontinued operations, partly offset by higher income tax charges and
financial expenses. The increase in income tax expense was mainly due to higher taxable profit and the absence of various items that reduced the charge in the prior year, in particular favorable tax regulations relating to R&D investments in
2014. |
| • |
|
Cash flow from operating activities was EUR 1,167 million, compared to EUR 1,303 million in 2014. The cash flow in 2015 included a working capital decrease of EUR 67 million, compared to EUR
312 million in 2014. |
|
|
|
|
|
| 18 |
|
Press Release Q4 2015 |
|
|
Sales by sector
in millions of EUR unless otherwise stated
|
|
|
|
|
|
|
|
|
|
|
|
|
|
|
|
|
| |
|
January to December |
|
|
% change |
|
| |
|
2014 |
|
|
2015 |
|
|
nominal |
|
|
comparable |
|
| Healthcare |
|
|
9,186 |
|
|
|
10,912 |
|
|
|
19 |
% |
|
|
4 |
% |
| Consumer Lifestyle |
|
|
4,731 |
|
|
|
5,347 |
|
|
|
13 |
% |
|
|
6 |
% |
| Lighting |
|
|
6,869 |
|
|
|
7,411 |
|
|
|
8 |
% |
|
|
(3 |
)% |
| Innovation, Group & Services |
|
|
605 |
|
|
|
574 |
|
|
|
(5 |
)% |
|
|
5 |
% |
|
|
|
|
|
|
|
|
|
|
|
|
|
|
|
|
|
| Philips Group |
|
|
21,391 |
|
|
|
24,244 |
|
|
|
13 |
% |
|
|
2 |
% |
|
| Adjusted EBITA
in millions of EUR unless otherwise stated |
|
| |
|
2014 |
|
|
2015 |
|
| |
|
amount |
|
|
% |
|
|
amount |
|
|
% |
|
| Healthcare |
|
|
1,085 |
|
|
|
11.8 |
% |
|
|
1,259 |
|
|
|
11.5 |
% |
| Consumer Lifestyle |
|
|
571 |
|
|
|
12.1 |
% |
|
|
722 |
|
|
|
13.5 |
% |
| Lighting |
|
|
593 |
|
|
|
8.6 |
% |
|
|
707 |
|
|
|
9.5 |
% |
| Innovation, Group & Services |
|
|
(334 |
) |
|
|
— |
|
|
|
(448 |
) |
|
|
— |
|
|
|
|
|
|
|
|
|
|
|
|
|
|
|
|
|
|
| Philips Group |
|
|
1,915 |
|
|
|
9.0 |
% |
|
|
2,240 |
|
|
|
9.2 |
% |
|
| EBITA
in millions of EUR unless otherwise stated |
|
| |
|
2014 |
|
|
2015 |
|
| |
|
amount |
|
|
% |
|
|
amount |
|
|
% |
|
| Healthcare |
|
|
616 |
|
|
|
6.7 |
% |
|
|
1,024 |
|
|
|
9.4 |
% |
| Consumer Lifestyle |
|
|
573 |
|
|
|
12.1 |
% |
|
|
673 |
|
|
|
12.6 |
% |
| Lighting |
|
|
293 |
|
|
|
4.3 |
% |
|
|
594 |
|
|
|
8.0 |
% |
| Innovation, Group & Services |
|
|
(661 |
) |
|
|
— |
|
|
|
(919 |
) |
|
|
— |
|
|
|
|
|
|
|
|
|
|
|
|
|
|
|
|
|
|
| Philips Group |
|
|
821 |
|
|
|
3.8 |
% |
|
|
1,372 |
|
|
|
5.7 |
% |
Philips sectors
Healthcare
| • |
|
Currency-comparable order intake showed 5% growth year-on-year. Healthcare Informatics, Solutions & Services achieved double-digit growth, Imaging Systems posted mid-single-digit growth and Patient
Care & Monitoring Solutions recorded low-single-digit growth. North America equipment order intake showed double-digit growth, Western Europe posted high-single-digit growth, and other mature geographies reported low-single-digit growth.
Growth geographies reported a mid-single-digit decline, mainly due to China and Latin America, with China showing some recovery towards the end of 2015. |
| • |
|
Sales amounted to EUR 10,912 million. Excluding currency effects and portfolio changes, comparable sales increased by 4% year-on-year. Imaging Systems achieved high-single-digit growth, Healthcare Informatics,
Solutions & Services posted mid-single-digit growth, Customer Services reported low-single-digit growth, while Patient Care & Monitoring Solutions was in line with 2014. From a geographical perspective, comparable sales in growth
geographies showed high-single-digit growth, and mature geographies recorded low-single-digit growth. |
| • |
|
Adjusted EBITA amounted to EUR 1,259 million, or 11.5% of sales, compared to EUR 1,085 million, or 11.8% of sales, in 2014. The increase was largely driven by higher volumes, partly offset by an increase in
Quality & Regulatory spend and higher planned expenditure for growth initiatives. |
| • |
|
EBITA amounted to EUR 1,024 million, or 9.4% of sales, compared to EUR 616 million, or 6.7% of sales, in 2014. EBITA in 2015 included restructuring and acquisition-related charges of EUR 168 million,
which included the Volcano acquisition, compared to EUR 70 million in 2014. 2015 EBITA also included charges of EUR 28 million related to the currency revaluation of the provision for the Masimo litigation, EUR 8 million related to
the devaluation of the Argentine peso, and a EUR 31 million legal provision. EBITA in 2014 included charges of EUR 366 million related to the provision for the Masimo litigation, charges of EUR 49 million of mainly inventory
write-downs related to Cleveland, and a EUR 16 million past-service pension cost gain. |
Consumer Lifestyle
| • |
|
Sales amounted to EUR 5,347 million. Excluding currency effects and portfolio changes, comparable sales increased by 6% year-on-year. Health & Wellness achieved double-digit growth, Personal Care reported
high-single-digit growth, while Domestic Appliances was in line with 2014. From a geographical perspective, growth geographies achieved high-single-digit growth and mature geographies registered low-single-digit growth.
|
|
|
|
|
|
|
|
|
Press Release Q4 2015 |
|
19 |
| • |
|
Adjusted EBITA amounted to EUR 722 million, or 13.5% of sales, compared to EUR 571 million, or 12.1% of sales, in 2014. The year-on-year increase of EUR 151 million was mainly driven by cost productivity,
higher volumes and product mix. |
| • |
|
EBITA amounted to EUR 673 million, or 12.6% of sales, a year-on-year increase of EUR 100 million. 2015 EBITA included restructuring and acquisition-related charges of EUR 36 million and charges related to the
devaluation of the Argentine peso of EUR 13 million. 2014 EBITA included restructuring and acquisition-related charges of EUR 9 million and a EUR 11 million past-service pension cost gain. |
Lighting
| • |
|
Sales amounted to EUR 7,411 million, a year-on-year increase of EUR 542 million. Excluding currency effects and portfolio changes, comparable sales decreased 3% year-on-year. LED lighting sales grew 25%, with 30%
growth in lamps, while conventional lighting declined 18%, with a 14% decline in lamps. Both Light Sources & Electronics and Consumer Luminaires recorded a mid-single-digit decline, while Professional Lighting Solutions remained flat
year-on-year. From a geographical perspective, comparable sales showed a mid-single-digit decline in growth geographies and a low-single-digit decline in mature geographies. |
| • |
|
Adjusted EBITA amounted to EUR 707 million, or 9.5% of sales, compared to EUR 593 million, or 8.6% of sales, in 2014. The increase was mainly driven by cost productivity and improved LED gross margins.
|
| • |
|
EBITA amounted to EUR 594 million, or 8.0% of sales, a year-on-year increase of EUR 301 million. 2015 EBITA included EUR 99 million of restructuring and acquisition-related charges and EUR 14 million of
charges related to the devaluation of the Argentine peso. 2014 EBITA included EUR 245 million of restructuring and acquisition-related charges, EUR 68 million of impairment and other charges related to industrial assets, and a EUR
13 million past-service pension cost gain. |
Innovation, Group & Services
| • |
|
Adjusted EBITA was a net cost of EUR 448 million, compared to a net cost of EUR 334 million in 2014. The Adjusted EBITA decrease was mainly due to higher Group and Regional Costs, mainly related to information
security and Quality & Regulatory spend, investments in emerging business areas, and lower licensing revenue in IP Royalties. |
| • |
|
EBITA amounted to a net cost of EUR 919 million, compared to EUR 661 million in 2014. EBITA in 2015 included a EUR 20 million net release of restructuring charges, compared to EUR 110 million
restructuring charges in 2014. EBITA in 2015 also included charges |
|
|
|
|
|
| 20 |
|
Press Release Q4 2015 |
|
|
of EUR 183 million related to the separation of the Lighting business, EUR
345 million mainly related to settlements for pension de-risking, and a EUR 37 million gain related to the sale of real estate assets. EBITA in Q4 2014 also included EUR 244 million of charges related to the CRT antitrust litigation
and a EUR 27 million past-service pension cost gain.
|
|
|
|
|
|
|
|
Press Release Q4 2015 |
|
21 |
Forward-looking statements
Forward-looking statements
This document and the related
oral presentation, including responses to questions following the presentation, contain certain forward-looking statements with respect to the financial condition, results of operations and business of Philips and certain of the plans and objectives
of Philips with respect to these items. Examples of forward-looking statements include statements made about the strategy, estimates of sales growth, future EBITA, future developments in Philips’ organic business the timing of the separation of
the Lighting business and related costs and nature of the disposition by Philips of its interest in the Lighting business, developments with respect to the disposition of the Lu mileds and Automotive business, and the completion of acquisitions and
divestments. By their nature, these statements involve risk and uncertainty because they relate to future events and circumstances and there are many factors that could cause actual results and developments to differ materially from those expressed
or implied by these statements.
These factors include but are not limited to domestic and global economic and business conditions, developments within the
euro zone, the successful implementation of Philips’ strategy and the ability to realize the benefits of this strategy, the ability to develop and market new products, changes in legislation, legal claims, changes in exchange and interest
rates, changes in tax rates, pension costs and actuarial assumptions, raw materials and employee costs, the ability to identify and complete successful acquisitions, and to integrate those acquisitions into the business, the ability to successfully
exit certain businesses or restructure the operations, the rate of technological changes, political, economic and other developments in countries where Philips operates, industry consolidation and competition, and the state of international capital
markets as they may affect the timing and nature of the dispositions by Philips of its interests in the Lighting business and the Lumileds and Automotive business. As a result, Philips’ actual future results may differ materially from the
plans, goals and expectations set forth in such forward-looking statements. For a discussion of factors that could cause future results to differ from such forward-looking statements, see the Risk management chapter included in the Annual Report
2014 and the “Risk and uncertainties” section in the semi-annual financial report for the six months ended June 30, 2015.
Third-party
market share data
Statements regarding market share, including those regarding Philips’ competitive position, contained in this document are
based on outside sources such as research institutes, industry and dealer panels in
combination with management estimates. Where information is not yet available to Philips, those statements may
also be based on estimates and projections prepared by outside sources or management. Rankings are based on sales unless otherwise stated.
Use of
non-GAAP information
In presenting and discussing the Philips Group financial position, operating results and cash flows, management uses certain
non-GAAP financial measures. These non-GAAP financial measures should not be viewed in isolation as alternatives to the equivalent IFRS measures and should be used in conjunction with the most directly comparable IFRS measures. Non-GAAP financial
measures do not have standardized meaning under IFRS and therefore may not be comparable to similar measures presented by other issuers. A reconciliation of these non-GAAP measures to the most directly comparable IFRS measures is contained in this
document. Further information on non-GAAP measures can be found in the Annual Report 2014.
Use of fair-value measurements
In presenting the Philips Group financial position, fair values are used for the measurement of various items in accordance with the applicable accounting
standards. These fair values are based on market prices, where available, and are obtained from sources that are deemed to be reliable. Readers are cautioned that these values are subject to changes over time and are only valid at the balance sheet
date. When quoted prices or observable market data are not readily available, fair values are estimated using appropriate valuation models and unobservable inputs. Such fair value estimates require management to make significant assumptions with
respect to future developments, which are inherently uncertain and may therefore deviate from actual developments. Critical assumptions used are disclosed in the Annual Report 2014. Independent valuations may have been obtained to support
management’s determination of fair values.
Presentation
All amounts are in millions of euros unless otherwise stated. All reported data is unaudited. Financial reporting is in accordance with the accounting policies
as stated in the Annual Report 2014, unless otherwise stated. The presentation of certain prior-year information has been reclassified to conform to the current-year presentation.
In 2014, we announced plans to establish two stand-alone companies focused on the HealthTech and Lighting opportunities. The proposed separation of the
Lighting business impacts all businesses and markets as well as all supporting functions and all assets and
|
|
|
|
|
| 22 |
|
Press Release Q4 2015 |
|
|
liabilities of the Group. Philips expects to complete the separation of the Lighting business in the first half
of 2016. We expect to continue reporting in the existing structure until the changes in the way we allocate resources and analyze performance in the new structure have been completed.
|
|
|
|
|
|
|
|
Press Release Q4 2015 |
|
23 |
Condensed consolidated statements of income
Condensed consolidated statements of income
in millions
of EUR unless otherwise stated
|
|
|
|
|
|
|
|
|
|
|
|
|
|
|
|
|
| |
|
Q4 |
|
|
January to December |
|
| |
|
2014 |
|
|
2015 |
|
|
2014 |
|
|
2015 |
|
|
|
|
|
|
| Sales |
|
|
6,536 |
|
|
|
7,095 |
|
|
|
21,391 |
|
|
|
24,244 |
|
| Cost of sales |
|
|
(4,007 |
) |
|
|
(4,272 |
) |
|
|
(13,185 |
) |
|
|
(14,388 |
) |
|
|
|
|
|
|
|
|
|
|
|
|
|
|
|
|
|
| Gross margin |
|
|
2,529 |
|
|
|
2,823 |
|
|
|
8,206 |
|
|
|
9,856 |
|
| Selling expenses |
|
|
(1,499 |
) |
|
|
(1,644 |
) |
|
|
(5,124 |
) |
|
|
(5,815 |
) |
| General and administrative expenses |
|
|
(213 |
) |
|
|
(530 |
) |
|
|
(747 |
) |
|
|
(1,209 |
) |
| Research and development expenses |
|
|
(467 |
) |
|
|
(537 |
) |
|
|
(1,635 |
) |
|
|
(1,927 |
) |
| Impairment of goodwill |
|
|
|
|
|
|
1 |
|
|
|
(3 |
) |
|
|
|
|
| Other business income |
|
|
23 |
|
|
|
64 |
|
|
|
63 |
|
|
|
137 |
|
| Other business expenses |
|
|
(211 |
) |
|
|
(15 |
) |
|
|
(274 |
) |
|
|
(50 |
) |
|
|
|
|
|
|
|
|
|
|
|
|
|
|
|
|
|
| Income from operations |
|
|
162 |
|
|
|
162 |
|
|
|
486 |
|
|
|
992 |
|
| Financial income |
|
|
19 |
|
|
|
27 |
|
|
|
114 |
|
|
|
98 |
|
| Financial expenses |
|
|
(97 |
) |
|
|
(155 |
) |
|
|
(415 |
) |
|
|
(467 |
) |
|
|
|
|
|
|
|
|
|
|
|
|
|
|
|
|
|
| Income before taxes |
|
|
84 |
|
|
|
34 |
|
|
|
185 |
|
|
|
623 |
|
| Income taxes |
|
|
(16 |
) |
|
|
(152 |
) |
|
|
(26 |
) |
|
|
(239 |
) |
|
|
|
|
|
|
|
|
|
|
|
|
|
|
|
|
|
| Income (loss) after taxes |
|
|
68 |
|
|
|
(118 |
) |
|
|
159 |
|
|
|
384 |
|
| Results relating to investments in associates |
|
|
(1 |
) |
|
|
6 |
|
|
|
62 |
|
|
|
30 |
|
|
|
|
|
|
|
|
|
|
|
|
|
|
|
|
|
|
| Net income (loss) from continuing operations |
|
|
67 |
|
|
|
(112) |
|
|
|
221 |
|
|
|
414 |
|
| Discontinued operations - net of income tax |
|
|
67 |
|
|
|
73 |
|
|
|
190 |
|
|
|
245 |
|
|
|
|
|
|
|
|
|
|
|
|
|
|
|
|
|
|
|
|
|
|
|
| Net income (loss) |
|
|
134 |
|
|
|
(39 |
) |
|
|
411 |
|
|
|
659 |
|
| Attribution of net income for the period |
|
|
|
|
|
|
|
|
|
|
|
|
|
|
|
|
| Net income (loss) attributable to Koninklijke Philips N.V. shareholders |
|
|
139 |
|
|
|
(45 |
) |
|
|
415 |
|
|
|
645 |
|
|
|
|
|
|
| Net income attributable to non-controlling interests |
|
|
(5 |
) |
|
|
6 |
|
|
|
(4 |
) |
|
|
14 |
|
| Earnings per common share attributable to shareholders |
|
|
|
|
|
|
|
|
|
|
|
|
|
|
|
|
| Weighted average number of common shares outstanding (after deduction of treasury shares) during the period (in thousands): |
|
|
|
|
|
|
|
|
|
|
|
|
|
|
|
|
| - basic |
|
|
916,767 |
|
|
|
919,297 |
|
|
|
915,193 |
|
|
|
916,087 |
|
| - diluted |
|
|
922,270 |
|
|
|
926,260 |
|
|
|
922,714 |
|
|
|
923,625 |
|
| Net income (loss) attributable to shareholders per common share in EUR: |
|
|
|
|
|
|
|
|
|
|
|
|
|
|
|
|
| - basic |
|
|
0.15 |
|
|
|
(0.05 |
) |
|
|
0.45 |
|
|
|
0.70 |
|
| - diluted |
|
|
0.15 |
|
|
|
(0.05 |
) |
|
|
0.45 |
|
|
|
0.70 |
|
|
|
|
|
|
| 24 |
|
Press Release Q4 2015 |
|
|
Condensed consolidated balance sheets
Condensed consolidated balance sheets
in millions of EUR
|
|
|
|
|
|
|
|
|
| |
|
December 31,
2014 |
|
|
December 31,
2015 |
|
|
|
|
| Non-current assets: |
|
|
|
|
|
|
|
|
| Property, plant and equipment |
|
|
2,095 |
|
|
|
2,322 |
|
| Goodwill |
|
|
7,158 |
|
|
|
8,523 |
|
| Intangible assets excluding goodwill |
|
|
3,368 |
|
|
|
3,693 |
|
| Non-current receivables |
|
|
177 |
|
|
|
191 |
|
| Investments in associates |
|
|
157 |
|
|
|
181 |
|
| Other non-current financial assets |
|
|
462 |
|
|
|
489 |
|
| Non-current derivative financial assets |
|
|
15 |
|
|
|
58 |
|
| Deferred tax assets |
|
|
2,460 |
|
|
|
2,758 |
|
| Other non-current assets |
|
|
69 |
|
|
|
68 |
|
|
|
|
|
|
|
|
|
|
| Total non-current assets |
|
|
15,961 |
|
|
|
18,283 |
|
|
|
|
| Current assets: |
|
|
|
|
|
|
|
|
| Inventories |
|
|
3,314 |
|
|
|
3,463 |
|
| Other current financial assets |
|
|
125 |
|
|
|
12 |
|
| Other current assets |
|
|
411 |
|
|
|
444 |
|
| Current derivative financial assets |
|
|
192 |
|
|
|
103 |
|
| Income tax receivable |
|
|
140 |
|
|
|
114 |
|
| Receivables |
|
|
4,723 |
|
|
|
4,982 |
|
| Assets classified as held for sale |
|
|
1,613 |
|
|
|
1,809 |
|
| Cash and cash equivalents |
|
|
1,873 |
|
|
|
1,766 |
|
|
|
|
|
|
|
|
|
|
| Total current assets |
|
|
12,391 |
|
|
|
12,693 |
|
|
|
|
|
|
|
|
|
|
| Total assets |
|
|
28,352 |
|
|
|
30,976 |
|
|
|
|
|
|
|
|
|
|
|
|
|
| Equity |
|
|
|
|
|
|
|
|
| Shareholders’ equity |
|
|
10,867 |
|
|
|
11,662 |
|
| Non-controlling interests |
|
|
101 |
|
|
|
118 |
|
|
|
|
|
|
|
|
|
|
| Group equity |
|
|
10,968 |
|
|
|
11,780 |
|
|
|
|
| Non-current liabilities: |
|
|
|
|
|
|
|
|
| Long-term debt |
|
|
3,712 |
|
|
|
4,095 |
|
| Non-current derivative financial liabilities |
|
|
551 |
|
|
|
695 |
|
| Long-term provisions |
|
|
2,500 |
|
|
|
2,392 |
|
| Deferred tax liabilities |
|
|
107 |
|
|
|
164 |
|
| Other non-current liabilities |
|
|
1,838 |
|
|
|
1,782 |
|
|
|
|
|
|
|
|
|
|
| Total non-current liabilities |
|
|
8,708 |
|
|
|
9,128 |
|
|
|
|
| Current liabilities: |
|
|
|
|
|
|
|
|
| Short-term debt |
|
|
392 |
|
|
|
1,665 |
|
| Current derivative financial liabilities |
|
|
306 |
|
|
|
238 |
|
| Income tax payable |
|
|
102 |
|
|
|
116 |
|
| Accounts payable |
|
|
2,499 |
|
|
|
2,673 |
|
| Accrued liabilities |
|
|
2,692 |
|
|
|
2,863 |
|
| Short-term provisions |
|
|
945 |
|
|
|
833 |
|
| Liabilities directly associated with assets held for sale |
|
|
349 |
|
|
|
407 |
|
| Other current liabilities |
|
|
1,391 |
|
|
|
1,273 |
|
|
|
|
|
|
|
|
|
|
| Total current liabilities |
|
|
8,676 |
|
|
|
10,068 |
|
|
|
|
|
|
|
|
|
|
| Total liabilities and group equity |
|
|
28,352 |
|
|
|
30,976 |
|
|
|
|
|
|
|
|
|
Press Release Q4 2015 |
|
25 |
Condensed consolidated statements of cash flows
Condensed consolidated statements of cash flows
in
millions of EUR
|
|
|
|
|
|
|
|
|
|
|
|
|
|
|
|
|
| |
|
Q4 |
|
|
January to December |
|
| |
|
2014 |
|
|
2015 |
|
|
2014 |
|
|
2015 |
|
| Cash flows from operating activities |
|
|
|
|
|
|
|
|
|
|
|
|
|
|
|
|
| Net income (loss) |
|
|
134 |
|
|
|
(39 |
) |
|
|
411 |
|
|
|
659 |
|
| Results of discontinued operations - net of income tax |
|
|
(67 |
) |
|
|
(73 |
) |
|
|
(190 |
) |
|
|
(245 |
) |
| Adjustments to reconcile net income (loss) to net cash of operating activities: |
|
|
|
|
|
|
|
|
|
|
|
|
|
|
|
|
| Depreciation, amortization, and impairments of fixed assets |
|
|
393 |
|
|
|
355 |
|
|
|
1,187 |
|
|
|
1,281 |
|
| Impairment of goodwill and other non-current financial assets |
|
|
3 |
|
|
|
43 |
|
|
|
21 |
|
|
|
48 |
|
| Net gain on sale of assets |
|
|
(9 |
) |
|
|
(47 |
) |
|
|
(83 |
) |
|
|
(110 |
) |
| Interest income |
|
|
(11 |
) |
|
|
(13 |
) |
|
|
(39 |
) |
|
|
(48 |
) |
| Interest expense on debt, borrowings and other liabilities |
|
|
63 |
|
|
|
72 |
|
|
|
231 |
|
|
|
278 |
|
| Income taxes |
|
|
16 |
|
|
|
152 |
|
|
|
26 |
|
|
|
239 |
|
| Results from investments in associates |
|
|
2 |
|
|
|
(7 |
) |
|
|
(62 |
) |
|
|
(10 |
) |
| Decrease in working capital: |
|
|
221 |
|
|
|
680 |
|
|
|
312 |
|
|
|
67 |
|
| Decrease (increase) in receivables and other current assets |
|
|
28 |
|
|
|
(67 |
) |
|
|
(75 |
) |
|
|
161 |
|
| Decrease (increase) in inventories |
|
|
399 |
|
|
|
618 |
|
|
|
(77 |
) |
|
|
22 |
|
| Increase (decrease) in accounts payable, accrued and other liabilities |
|
|
(206 |
) |
|
|
129 |
|
|
|
464 |
|
|
|
(116 |
) |
| Decrease (increase) in non-current receivables, other assets, other liabilities |
|
|
14 |
|
|
|
(80 |
) |
|
|
(412 |
) |
|
|
(135 |
) |
| Increase (decrease) in provisions |
|
|
230 |
|
|
|
32 |
|
|
|
640 |
|
|
|
(278 |
) |
| Other items |
|
|
(85 |
) |
|
|
(69 |
) |
|
|
(242 |
) |
|
|
(99 |
) |
| Interest paid |
|
|
(26 |
) |
|
|
(29 |
) |
|
|
(232 |
) |
|
|
(265 |
) |
| Interest received |
|
|
11 |
|
|
|
12 |
|
|
|
38 |
|
|
|
48 |
|
| Dividends received from investments in associates |
|
|
8 |
|
|
|
11 |
|
|
|
41 |
|
|
|
17 |
|
| Income taxes paid |
|
|
(56 |
) |
|
|
(44 |
) |
|
|
(344 |
) |
|
|
(280 |
) |
|
|
|
|
|
|
|
|
|
|
|
|
|
|
|
|
|
| Net cash provided by operating activities |
|
|
841 |
|
|
|
956 |
|
|
|
1,303 |
|
|
|
1,167 |
|
|
|
|
|
|
| Cash flows from investing activities |
|
|
|
|
|
|
|
|
|
|
|
|
|
|
|
|
| Net capital expenditures |
|
|
(282 |
) |
|
|
(216 |
) |
|
|
(806 |
) |
|
|
(842 |
) |
| Purchase of intangible assets |
|
|
(56 |
) |
|
|
(24 |
) |
|
|
(114 |
) |
|
|
(121 |
) |
| Expenditures on development assets |
|
|
(88 |
) |
|
|
(85 |
) |
|
|
(295 |
) |
|
|
(314 |
) |
| Capital expenditures on property, plant and equipment |
|
|
(153 |
) |
|
|
(178 |
) |
|
|
(437 |
) |
|
|
(522 |
) |
| Proceeds from sale of property, plant and equipment |
|
|
15 |
|
|
|
71 |
|
|
|
40 |
|
|
|
115 |
|
| Net proceeds from (used for) derivatives and current financial assets |
|
|
(12 |
) |
|
|
6 |
|
|
|
(7 |
) |
|
|
(72 |
) |
| Purchase of other non-current financial assets |
|
|
(7 |
) |
|
|
(5 |
) |
|
|
(81 |
) |
|
|
(21 |
) |
| Proceeds from other non-current financial assets |
|
|
14 |
|
|
|
15 |
|
|
|
107 |
|
|
|
53 |
|
| Purchase of businesses, net of cash acquired |
|
|
(13 |
) |
|
|
(12 |
) |
|
|
(177 |
) |
|
|
(1,116 |
) |
| Net proceeds (used for) from sale of interest in businesses |
|
|
39 |
|
|
|
(4 |
) |
|
|
(20 |
) |
|
|
57 |
|
|
|
|
|
|
|
|
|
|
|
|
|
|
|
|
|
|
| Net cash used for investing activities |
|
|
(261 |
) |
|
|
(216 |
) |
|
|
(984 |
) |
|
|
(1,941 |
) |
|
|
|
|
|
| Cash flows from financing activities |
|
|
|
|
|
|
|
|
|
|
|
|
|
|
|
|
| Proceeds from issuance (payments) of short-term debt |
|
|
(371 |
) |
|
|
37 |
|
|
|
(37 |
) |
|
|
1,241 |
|
| Principal payments on long-term debt |
|
|
(19 |
) |
|
|
(23 |
) |
|
|
(333 |
) |
|
|
(104 |
) |
| Proceeds from issuance of long-term debt |
|
|
24 |
|
|
|
30 |
|
|
|
69 |
|
|
|
94 |
|
| Re-issuance of treasury shares |
|
|
9 |
|
|
|
7 |
|
|
|
117 |
|
|
|
81 |
|
| Purchase of treasury shares |
|
|
(143 |
) |
|
|
(108 |
) |
|
|
(713 |
) |
|
|
(506 |
) |
| Dividend paid |
|
|
|
|
|
|
|
|
|
|
(292 |
) |
|
|
(298 |
) |
|
|
|
|
|
|
|
|
|
|
|
|
|
|
|
|
|
| Net cash provided by (used for) financing activities |
|
|
(500 |
) |
|
|
(57 |
) |
|
|
(1,189 |
) |
|
|
508 |
|
|
|
|
|
|
|
|
|
|
|
|
|
|
|
|
|
|
| Net cash provided by (used for) continuing operations |
|
|
80 |
|
|
|
683 |
|
|
|
(870 |
) |
|
|
(266 |
) |
|
|
|
|
|
| Cash flows from discontinued operations |
|
|
|
|
|
|
|
|
|
|
|
|
|
|
|
|
| Net cash provided by operating activities |
|
|
49 |
|
|
|
67 |
|
|
|
105 |
|
|
|
79 |
|
| Net cash provided (used for) by investing activities |
|
|
(11 |
) |
|
|
– |
|
|
|
88 |
|
|
|
– |
|
|
|
|
|
|
|
|
|
|
|
|
|
|
|
|
|
|
| Net cash provided by discontinued operations |
|
|
38 |
|
|
|
67 |
|
|
|
193 |
|
|
|
79 |
|
|
|
|
|
|
|
|
|
|
|
|
|
|
|
|
|
|
|
|
|
|
|
| Net cash provided by (used for) continuing and discontinued operations |
|
|
118 |
|
|
|
750 |
|
|
|
(677 |
) |
|
|
(187 |
) |
| Effect of change in exchange rates on cash and cash equivalents |
|
|
39 |
|
|
|
(9 |
) |
|
|
85 |
|
|
|
80 |
|
| Cash and cash equivalents at the beginning of the period |
|
|
1,716 |
|
|
|
1,025 |
|
|
|
2,465 |
|
|
|
1,873 |
|
|
|
|
|
|
|
|
|
|
|
|
|
|
|
|
|
|
| Cash and cash equivalents at the end of the period |
|
|
1,873 |
|
|
|
1,766 |
|
|
|
1,873 |
|
|
|
1,766 |
|
For a number of reasons, principally the effects of translation differences, certain items in the statements of cash flows do
not correspond to the differences between the balance sheet amounts for the respective items.
|
|
|
|
|
| 26 |
|
Press Release Q4 2015 |
|
|
Condensed consolidated statement of changes in equity
Condensed consolidated statement of changes in equity
in
millions of EUR
|
|
|
|
|
|
|
|
|
|
|
|
|
|
|
|
|
|
|
|
|
|
|
|
|
|
|
|
|
|
|
|
|
|
|
|
|
|
|
|
|
|
|
|
|
| |
|
common
shares |
|
|
capital
in
excess
of par
value |
|
|
retained
earnings |
|
|
revaluation
reserve |
|
|
currency
translation
differences |
|
|
available-
for-sale
financial
assets |
|
|
cash
flow
hedges |
|
|
treasury
shares
at cost |
|
|
total
shareholder’s
equity |
|
|
non-controlling
interests |
|
|
Group
equity |
|
|
|
|
|
|
|
|
|
|
|
|
|
| January to December 2015 |
|
|
|
|
|
|
|
|
|
|
|
|
|
|
|
|
|
|
|
|
|
|
|
|
|
|
|
|
|
|
|
|
|
|
|
|
|
|
|
|
|
|
|
|
|
|
|
|
|
|
|
|
|
|
|
|
| Balance as of December 31, 2014 |
|
|
187 |
|
|
|
2,181 |
|
|
|
8,790 |
|
|
|
13 |
|
|
|
229 |
|
|
|
27 |
|
|
|
(13 |
) |
|
|
(547 |
) |
|
|
10,867 |
|
|
|
101 |
|
|
|
10,968 |
|
|
|
|
|
|
|
|
|
|
|
|
|
| Total comprehensive income |
|
|
|
|
|
|
|
|
|
|
562 |
|
|
|
(9 |
) |
|
|
829 |
|
|
|
29 |
|
|
|
25 |
|
|
|
|
|
|
|
1,436 |
|
|
|
14 |
|
|
|
1,450 |
|
|
|
|
|
|
|
|
|
|
|
|
|
| Dividend distributed |
|
|
3 |
|
|
|
429 |
|
|
|
(730 |
) |
|
|
|
|
|
|
|
|
|
|
|
|
|
|
|
|
|
|
|
|
|
|
(298 |
) |
|
|
|
|
|
|
(298 |
) |
| Movement non-controlling interest |
|
|
|
|
|
|
|
|
|
|
|
|
|
|
|
|
|
|
|
|
|
|
|
|
|
|
|
|
|
|
|
|
|
|
— |
|
|
|
3 |
|
|
|
3 |
|
| Purchase of treasury shares |
|
|
|
|
|
|
|
|
|
|
(12 |
) |
|
|
|
|
|
|
|
|
|
|
|
|
|
|
|
|
|
|
(495 |
) |
|
|
(507 |
) |
|
|
|
|
|
|
(507 |
) |
| Re-issuance of treasury shares |
|
|
|
|
|
|
(23 |
) |
|
|
(57 |
) |
|
|
|
|
|
|
|
|
|
|
|
|
|
|
|
|
|
|
162 |
|
|
|
82 |
|
|
|
|
|
|
|
82 |
|
| Cancelation of treasury shares |
|
|
(4 |
) |
|
|
|
|
|
|
(513 |
) |
|
|
|
|
|
|
|
|
|
|
|
|
|
|
|
|
|
|
517 |
|
|
|
— |
|
|
|
|
|
|
|
— |
|
| Share-based compensation plans |
|
|
|
|
|
|
101 |
|
|
|
|
|
|
|
|
|
|
|
|
|
|
|
|
|
|
|
|
|
|
|
|
|
|
|
101 |
|
|
|
|
|
|
|
101 |
|
| Income tax share-based compensation plans |
|
|
|
|
|
|
(19 |
) |
|
|
|
|
|
|
|
|
|
|
|
|
|
|
|
|
|
|
|
|
|
|
|
|
|
|
(19 |
) |
|
|
|
|
|
|
(19 |
) |
|
|
|
|
|
|
|
|
|
|
|
|
|
|
|
|
|
|
|
|
|
|
|
|
|
|
|
|
|
|
|
|
|
|
|
|
|
|
|
|
|
|
|
|
|
| Total other equity movements |
|
|
(1 |
) |
|
|
488 |
|
|
|
(1,312 |
) |
|
|
|
|
|
|
|
|
|
|
|
|
|
|
|
|
|
|
184 |
|
|
|
(641 |
) |
|
|
3 |
|
|
|
(638 |
) |
|
|
|
|
|
|
|
|
|
|
|
|
|
|
|
|
|
|
|
|
|
|
|
|
|
|
|
|
|
|
|
|
|
|
|
|
|
|
|
|
|
|
|
|
|
| Balance as of December 31, 2015 |
|
|
186 |
|
|
|
2,669 |
|
|
|
8,040 |
|
|
|
4 |
|
|
|
1,058 |
|
|
|
56 |
|
|
|
12 |
|
|
|
(363 |
) |
|
|
11,662 |
|
|
|
118 |
|
|
|
11,780 |
|
|
|
|
|
|
|
|
|
Press Release Q4 2015 |
|
27 |
Pension costs and cash flows
Specification of pension costs
in millions of EUR
|
|
|
|
|
|
|
|
|
|
|
|
|
|
|
|
|
|
|
|
|
|
|
|
|
| |
|
Q4 2014 |
|
|
Q4 2015 |
|
| |
|
Netherlands |
|
|
other |
|
|
total |
|
|
Netherlands |
|
|
other |
|
|
total |
|
| Defined-benefit plans |
|
|
|
|
|
|
|
|
|
|
|
|
|
|
|
|
|
|
|
|
|
|
|
|
| Pensions |
|
|
|
|
|
|
|
|
|
|
|
|
|
|
|
|
|
|
|
|
|
|
|
|
| Current service cost |
|
|
44 |
|
|
|
17 |
|
|
|
61 |
|
|
|
|
|
|
|
12 |
|
|
|
12 |
|
| Past service cost (incl. curtailments) |
|
|
(68 |
) |
|
|
(1 |
) |
|
|
(69 |
) |
|
|
|
|
|
|
16 |
|
|
|
16 |
1) |
| Settlements |
|
|
|
|
|
|
(1 |
) |
|
|
(1 |
) |
|
|
|
|
|
|
329 |
|
|
|
329 |
1) |
| Interest expense |
|
|
|
|
|
|
17 |
|
|
|
17 |
|
|
|
|
|
|
|
19 |
|
|
|
19 |
|
| Interest income |
|
|
(3 |
) |
|
|
|
|
|
|
(3 |
) |
|
|
|
|
|
|
|
|
|
|
|
|
|
|
|
|
|
|
|
|
|
|
|
|
|
|
|
|
|
|
|
|
|
|
|
|
|
| Total |
|
|
(27 |
) |
|
|
32 |
|
|
|
5 |
|
|
|
|
|
|
|
376 |
|
|
|
376 |
|
| of which discontinued operations |
|
|
|
|
|
|
1 |
|
|
|
1 |
|
|
|
|
|
|
|
|
|
|
|
|
|
| Retiree Medical |
|
|
|
|
|
|
|
|
|
|
|
|
|
|
|
|
|
|
|
|
|
|
|
|
| Current service cost |
|
|
|
|
|
|
1 |
|
|
|
1 |
|
|
|
|
|
|
|
(1 |
) |
|
|
(1 |
) |
| Interest expense |
|
|
|
|
|
|
2 |
|
|
|
2 |
|
|
|
|
|
|
|
4 |
|
|
|
4 |
|
| Total |
|
|
|
|
|
|
3 |
|
|
|
3 |
|
|
|
|
|
|
|
3 |
|
|
|
3 |
|
| Defined-contribution plans |
|
|
|
|
|
|
|
|
|
|
|
|
|
|
|
|
|
|
|
|
|
|
|
|
| Cost |
|
|
10 |
|
|
|
31 |
|
|
|
41 |
|
|
|
52 |
|
|
|
38 |
|
|
|
90 |
|
| of which discontinued operations |
|
|
|
|
|
|
1 |
|
|
|
1 |
|
|
|
1 |
|
|
|
|
|
|
|
1 |
|
Specification of
pension costs
in millions of EUR
|
|
|
|
|
|
|
|
|
|
|
|
|
|
|
|
|
|
|
|
|
|
|
|
|
| |
|
January to December |
|
| |
|
2014 |
|
|
2015 |
|
| |
|
Netherlands |
|
|
other |
|
|
total |
|
|
Netherlands |
|
|
other |
|
|
total |
|
| Defined-benefit plans |
|
|
|
|
|
|
|
|
|
|
|
|
|
|
|
|
|
|
|
|
|
|
|
|
| Pensions |
|
|
|
|
|
|
|
|
|
|
|
|
|
|
|
|
|
|
|
|
|
|
|
|
| Current service cost |
|
|
183 |
|
|
|
71 |
|
|
|
254 |
|
|
|
80 |
|
|
|
66 |
|
|
|
146 |
|
| Past service cost (incl. curtailments) |
|
|
(68 |
) |
|
|
(1 |
) |
|
|
(69 |
) |
|
|
|
|
|
|
14 |
|
|
|
14 |
1) |
| Settlements |
|
|
|
|
|
|
(1 |
) |
|
|
(1 |
) |
|
|
|
|
|
|
329 |
|
|
|
329 |
1) |
| Interest expense |
|
|
|
|
|
|
59 |
|
|
|
59 |
|
|
|
|
|
|
|
61 |
|
|
|
61 |
|
| Interest income |
|
|
(11 |
) |
|
|
|
|
|
|
(11 |
) |
|
|
(1 |
) |
|
|
|
|
|
|
(1 |
) |
|
|
|
|
|
|
|
|
|
|
|
|
|
|
|
|
|
|
|
|
|
|
|
|
|
| Total |
|
|
104 |
|
|
|
128 |
|
|
|
232 |
|
|
|
79 |
|
|
|
470 |
|
|
|
549 |
|
| of which discontinued operations |
|
|
1 |
|
|
|
3 |
|
|
|
4 |
|
|
|
1 |
|
|
|
1 |
|
|
|
2 |
|
| Retiree Medical |
|
|
|
|
|
|
|
|
|
|
|
|
|
|
|
|
|
|
|
|
|
|
|
|
| Current service cost |
|
|
|
|
|
|
2 |
|
|
|
2 |
|
|
|
|
|
|
|
|
|
|
|
|
|
| Interest expense |
|
|
|
|
|
|
11 |
|
|
|
11 |
|
|
|
|
|
|
|
12 |
|
|
|
12 |
|
|
|
|
|
|
|
|
|
|
|
|
|
|
|
|
|
|
|
|
|
|
|
|
|
|
| Total |
|
|
|
|
|
|
13 |
|
|
|
13 |
|
|
|
|
|
|
|
12 |
|
|
|
12 |
|
| Defined-contribution plans |
|
|
|
|
|
|
|
|
|
|
|
|
|
|
|
|
|
|
|
|
|
|
|
|
| Costs |
|
|
16 |
|
|
|
132 |
|
|
|
148 |
|
|
|
140 |
|
|
|
159 |
|
|
|
299 |
|
| of which discontinued operations |
|
|
1 |
|
|
|
3 |
|
|
|
4 |
|
|
|
2 |
|
|
|
4 |
|
|
|
6 |
|
Pension cash
flows
in millions of EUR
|
|
|
|
|
|
|
|
|
|
|
|
|
|
|
|
|
| |
|
Q4 |
|
|
January to December |
|
| |
|
2014 |
|
|
2015 |
|
|
2014 |
|
|
2015 |
|
| Contributions and benefits paid by the Company |
|
|
205 |
|
|
|
564 |
1) |
|
|
1,050 |
|
|
|
1,189 |
|
| 1) |
Includes a EUR 305 million cash payment related to the UK plan settlement, recognized as a cost in the lines Past service cost for EUR 31 million and Settlements for EUR 274 million, and a EUR
141 million cash payment related to the realized settlement of a part of the US plan |
|
|
|
|
|
| 28 |
|
Press Release Q4 2015 |
|
|
Sectors
Sales and income (loss) from operations
in millions of
EUR unless otherwise stated
|
|
|
|
|
|
|
|
|
|
|
|
|
|
|
|
|
|
|
|
|
|
|
|
|
| |
|
Q4 2014 |
|
|
Q4 2015 |
|
| |
|
sales |
|
|
income from operations |
|
|
sales |
|
|
income from operations |
|
| |
|
|
|
|
|
|
|
as a % of sales |
|
|
|
|
|
|
|
|
as a % of sales |
|
| Healthcare |
|
|
2,849 |
|
|
|
351 |
|
|
|
12.3 |
% |
|
|
3,270 |
|
|
|
374 |
|
|
|
11.4 |
% |
| Consumer Lifestyle |
|
|
1,528 |
|
|
|
237 |
|
|
|
15.5 |
% |
|
|
1,663 |
|
|
|
235 |
|
|
|
14.1 |
% |
| Lighting |
|
|
1,975 |
|
|
|
(83 |
) |
|
|
(4.2 |
)% |
|
|
2,026 |
|
|
|
125 |
|
|
|
6.2 |
% |
| Innovation, Group & Services |
|
|
184 |
|
|
|
(343 |
) |
|
|
— |
|
|
|
136 |
|
|
|
(572 |
) |
|
|
— |
|
|
|
|
|
|
|
|
|
|
|
|
|
|
|
|
|
|
|
|
|
|
|
|
|
|
| Philips Group |
|
|
6,536 |
|
|
|
162 |
|
|
|
2.5 |
% |
|
|
7,095 |
|
|
|
162 |
|
|
|
2.3 |
% |
Sales and income (loss) from
operations
in millions of EUR unless otherwise stated
|
|
|
|
|
|
|
|
|
|
|
|
|
|
|
|
|
|
|
|
|
|
|
|
|
| |
|
January to December |
|
| |
|
|
|
|
2014 |
|
|
|
|
|
|
|
|
2015 |
|
|
|
|
| |
|
sales |
|
|
income from operations |
|
|
sales |
|
|
income from operations |
|
| |
|
|
|
|
|
|
|
as a % of sales |
|
|
|
|
|
|
|
|
as a % of sales |
|
| Healthcare |
|
|
9,186 |
|
|
|
456 |
|
|
|
5.0 |
% |
|
|
10,912 |
|
|
|
819 |
|
|
|
7.5 |
% |
| Consumer Lifestyle |
|
|
4,731 |
|
|
|
520 |
|
|
|
11.0 |
% |
|
|
5,347 |
|
|
|
621 |
|
|
|
11.6 |
% |
| Lighting |
|
|
6,869 |
|
|
|
185 |
|
|
|
2.7 |
% |
|
|
7,411 |
|
|
|
486 |
|
|
|
6.6 |
% |
| Innovation, Group & Services |
|
|
605 |
|
|
|
(675 |
) |
|
|
– |
|
|
|
574 |
|
|
|
(934 |
) |
|
|
— |
|
|
|
|
|
|
|
|
|
|
|
|
|
|
|
|
|
|
|
|
|
|
|
|
|
|
| Philips Group |
|
|
21,391 |
|
|
|
486 |
|
|
|
2.3 |
% |
|
|
24,244 |
|
|
|
992 |
|
|
|
4.1 |
% |
|
|
|
|
|
|
|
|
Press Release Q4 2015 |
|
29 |
Sectors and main countries
Sales, total assets and total liabilities excluding debt
in millions of EUR
|
|
|
|
|
|
|
|
|
|
|
|
|
|
|
|
|
|
|
|
|
|
|
|
|
| |
|
sales |
|
|
total assets |
|
|
total liabilities excluding debt |
|
| |
|
January to December |
|
|
December 31, |
|
|
December 31, |
|
|
December 31, |
|
|
December 31, |
|
| |
|
2014 |
|
|
2015 |
|
|
2014 |
|
|
2015 |
|
|
2014 |
|
|
2015 |
|
| Healthcare |
|
|
9,186 |
|
|
|
10,912 |
|
|
|
11,274 |
|
|
|
13,363 |
|
|
|
3,629 |
|
|
|
4,095 |
|
| Consumer Lifestyle |
|
|
4,731 |
|
|
|
5,347 |
|
|
|
3,049 |
|
|
|
3,080 |
|
|
|
1,696 |
|
|
|
1,627 |
|
| Lighting |
|
|
6,869 |
|
|
|
7,411 |
|
|
|
5,739 |
|
|
|
5,875 |
|
|
|
2,081 |
|
|
|
2,043 |
|
| Innovation, Group & Services |
|
|
605 |
|
|
|
574 |
|
|
|
6,677 |
|
|
|
6,849 |
|
|
|
5,525 |
|
|
|
5,264 |
|
|
|
|
|
|
|
|
|
|
|
|
|
|
|
|
|
|
|
|
|
|
|
|
|
|
| Sector totals |
|
|
|
|
|
|
|
|
|
|
26,739 |
|
|
|
29,167 |
|
|
|
12,931 |
|
|
|
13,029 |
|
| Assets classified as held for sale |
|
|
|
|
|
|
|
|
|
|
1,613 |
|
|
|
1,809 |
|
|
|
349 |
|
|
|
407 |
|
|
|
|
|
|
|
|
|
|
|
|
|
|
|
|
|
|
|
|
|
|
|
|
|
|
| Philips Group |
|
|
21,391 |
|
|
|
24,244 |
|
|
|
28,352 |
|
|
|
30,976 |
|
|
|
13,280 |
|
|
|
13,436 |
|
Sales and
tangible and intangible assets
in millions of EUR
|
|
|
|
|
|
|
|
|
|
|
|
|
|
|
|
|
| |
|
sales |
|
|
tangible and intangible assets1) |
|
| |
|
January to December |
|
|
December 31, |
|
|
December 31, |
|
| |
|
2014 |
|
|
2015 |
|
|
2014 |
|
|
2015 |
|
| Netherlands |
|
|
594 |
|
|
|
639 |
|
|
|
937 |
|
|
|
970 |
|
| United States |
|
|
6,160 |
|
|
|
7,522 |
|
|
|
7,649 |
|
|
|
9,291 |
|
| China |
|
|
2,362 |
|
|
|
2,774 |
|
|
|
1,135 |
|
|
|
1,194 |
|
| Germany |
|
|
1,351 |
|
|
|
1,357 |
|
|
|
153 |
|
|
|
170 |
|
| Japan |
|
|
908 |
|
|
|
992 |
|
|
|
379 |
|
|
|
455 |
|
| India |
|
|
684 |
|
|
|
845 |
|
|
|
123 |
|
|
|
134 |
|
| France |
|
|
839 |
|
|
|
806 |
|
|
|
52 |
|
|
|
48 |
|
| Other countries |
|
|
8,493 |
|
|
|
9,309 |
|
|
|
2,193 |
|
|
|
2,276 |
|
|
|
|
|
|
|
|
|
|
|
|
|
|
|
|
|
|
| Philips Group |
|
|
21,391 |
|
|
|
24,244 |
|
|
|
12,621 |
|
|
|
14,538 |
|
| 1) |
Includes property, plant and equipment, intangible assets excluding goodwill, and goodwill |
|
|
|
|
|
| 30 |
|
Press Release Q4 2015 |
|
|
Reconciliation of non-GAAP performance measures
Certain non-GAAP financial measures are presented when discussing the Philips Group’s performance. In the following tables, reconciliations to the most
directly comparable IFRS measures are presented.
Sales growth composition
in %
|
|
|
|
|
|
|
|
|
|
|
|
|
|
|
|
|
|
|
|
|
|
|
|
|
|
|
|
|
|
|
|
|
| |
|
Q4 |
|
|
January to December |
|
| |
|
comparable
growth |
|
|
currency
effects |
|
|
consolidation
changes |
|
|
nominal
growth |
|
|
comparable
growth |
|
|
currency
effects |
|
|
consolidation
changes |
|
|
nominal
growth |
|
|
|
|
|
|
|
|
|
|
| 2015 versus 2014 |
|
|
|
|
|
|
|
|
|
|
|
|
|
|
|
|
|
|
|
|
|
|
|
|
|
|
|
|
|
|
|
|
| Healthcare |
|
|
3.4 |
|
|
|
8.3 |
|
|
|
3.1 |
|
|
|
14.8 |
|
|
|
3.8 |
|
|
|
11.7 |
|
|
|
3.3 |
|
|
|
18.8 |
|
| Consumer Lifestyle |
|
|
5.5 |
|
|
|
3.3 |
|
|
|
0.0 |
|
|
|
8.8 |
|
|
|
5.8 |
|
|
|
7.2 |
|
|
|
0.0 |
|
|
|
13.0 |
|
| Lighting |
|
|
(2.4 |
) |
|
|
5.0 |
|
|
|
0.0 |
|
|
|
2.6 |
|
|
|
(2.8 |
) |
|
|
8.5 |
|
|
|
2.2 |
|
|
|
7.9 |
|
| IG&S |
|
|
(10.6 |
) |
|
|
(0.3 |
) |
|
|
(15.2 |
) |
|
|
(26.1 |
) |
|
|
5.4 |
|
|
|
1.7 |
|
|
|
(12.2 |
) |
|
|
(5.1 |
) |
|
|
|
|
|
|
|
|
|
|
|
|
|
|
|
|
|
|
|
|
|
|
|
|
|
|
|
|
|
|
|
|
|
| Philips Group |
|
|
1.8 |
|
|
|
6.0 |
|
|
|
0.8 |
|
|
|
8.6 |
|
|
|
2.2 |
|
|
|
9.4 |
|
|
|
1.7 |
|
|
|
13.3 |
|
Adjusted
EBITA1)
in millions of EUR
|
|
|
|
|
|
|
|
|
|
|
|
|
|
|
|
|
|
|
|
|
|
|
|
|
|
|
|
|
|
|
|
|
|
|
|
|
|
|
|
|
| |
|
Q4 |
|
|
January to December |
|
| |
|
Philips
Group |
|
|
Healthcare |
|
|
Consumer
Lifestyle |
|
|
Lighting |
|
|
Innovation,
Group &
Services |
|
|
Philips
Group |
|
|
Healthcare |
|
|
Consumer
Lifestyle |
|
|
Lighting |
|
|
Innovation,
Group &
Services |
|
| 2015 |
|
|
|
|
|
|
|
|
|
|
|
|
|
|
|
|
|
|
|
|
|
|
|
|
|
|
|
|
|
|
|
|
|
|
|
|
|
|
|
|
| Adjusted EBITA |
|
|
842 |
|
|
|
516 |
|
|
|
296 |
|
|
|
213 |
|
|
|
(183 |
) |
|
|
2,240 |
|
|
|
1,259 |
|
|
|
722 |
|
|
|
707 |
|
|
|
(448 |
) |
|
|
|
|
|
|
|
|
|
|
|
|
|
|
|
|
|
|
|
|
|
|
|
|
|
|
|
|
|
|
|
|
|
|
|
|
|
|
|
|
|
| Other items |
|
|
(429 |
) |
|
|
(8 |
) |
|
|
(13 |
) |
|
|
(14 |
) |
|
|
(394 |
) |
|
|
(585 |
) |
|
|
(67 |
) |
|
|
(13 |
) |
|
|
(14 |
) |
|
|
(491 |
) |
| Restructuring and acquisition-related charges |
|
|
(150 |
) |
|
|
(77 |
) |
|
|
(36 |
) |
|
|
(47 |
) |
|
|
10 |
|
|
|
(283 |
) |
|
|
(168 |
) |
|
|
(36 |
) |
|
|
(99 |
) |
|
|
20 |
|
| EBITA (or Adjusted income from operations) |
|
|
263 |
|
|
|
431 |
|
|
|
247 |
|
|
|
152 |
|
|
|
(567 |
) |
|
|
1,372 |
|
|
|
1,024 |
|
|
|
673 |
|
|
|
594 |
|
|
|
(919 |
) |
|
|
|
|
|
|
|
|
|
|
|
|
|
|
|
|
|
|
|
|
|
|
|
|
|
|
|
|
|
|
|
|
|
|
|
|
|
|
|
|
|
| Amortization of acquired intangibles2) |
|
|
(102 |
) |
|
|
(57 |
) |
|
|
(12 |
) |
|
|
(28 |
) |
|
|
(5 |
) |
|
|
(380 |
) |
|
|
(205 |
) |
|
|
(52 |
) |
|
|
(108 |
) |
|
|
(15 |
) |
| Impairment of goodwill |
|
|
1 |
|
|
|
|
|
|
|
|
|
|
|
1 |
|
|
|
|
|
|
|
|
|
|
|
|
|
|
|
|
|
|
|
|
|
|
|
|
|
|
|
|
|
|
|
|
|
|
|
|
|
|
|
|
|
|
|
|
|
|
|
|
|
|
|
|
|
|
|
|
|
|
|
|
|
|
|
|
|
|
| Income from operations (or EBIT) |
|
|
162 |
|
|
|
374 |
|
|
|
235 |
|
|
|
125 |
|
|
|
(572 |
) |
|
|
992 |
|
|
|
819 |
|
|
|
621 |
|
|
|
486 |
|
|
|
(934 |
) |
| 2014 |
|
|
|
|
|
|
|
|
|
|
|
|
|
|
|
|
|
|
|
|
|
|
|
|
|
|
|
|
|
|
|
|
|
|
|
|
|
|
|
|
| Adjusted EBITA |
|
|
743 |
|
|
|
421 |
|
|
|
244 |
|
|
|
178 |
|
|
|
(100 |
) |
|
|
1,915 |
|
|
|
1,085 |
|
|
|
571 |
|
|
|
593 |
|
|
|
(334 |
) |
|
|
|
|
|
|
|
|
|
|
|
|
|
|
|
|
|
|
|
|
|
|
|
|
|
|
|
|
|
|
|
|
|
|
|
|
|
|
|
|
|
| Other items |
|
|
(202 |
) |
|
|
16 |
|
|
|
11 |
|
|
|
(55 |
) |
|
|
(174 |
) |
|
|
(660 |
) |
|
|
(399 |
) |
|
|
11 |
|
|
|
(55 |
) |
|
|
(217 |
) |
| Restructuring and acquisition-related charges |
|
|
(279 |
) |
|
|
(47 |
) |
|
|
(4 |
) |
|
|
(163 |
) |
|
|
(65 |
) |
|
|
(434 |
) |
|
|
(70 |
) |
|
|
(9 |
) |
|
|
(245 |
) |
|
|
(110 |
) |
| EBITA (or Adjusted income from operations) |
|
|
262 |
|
|
|
390 |
|
|
|
251 |
|
|
|
(40 |
) |
|
|
(339 |
) |
|
|
821 |
|
|
|
616 |
|
|
|
573 |
|
|
|
293 |
|
|
|
(661 |
) |
|
|
|
|
|
|
|
|
|
|
|
|
|
|
|
|
|
|
|
|
|
|
|
|
|
|
|
|
|
|
|
|
|
|
|
|
|
|
|
|
|
| Amortization of acquired intangibles2) |
|
|
(100 |
) |
|
|
(39 |
) |
|
|
(14 |
) |
|
|
(43 |
) |
|
|
(4 |
) |
|
|
(332 |
) |
|
|
(159 |
) |
|
|
(53 |
) |
|
|
(106 |
) |
|
|
(14 |
) |
| Impairment of goodwill |
|
|
|
|
|
|
|
|
|
|
|
|
|
|
|
|
|
|
|
|
|
|
(3 |
) |
|
|
(1 |
) |
|
|
|
|
|
|
(2 |
) |
|
|
|
|
|
|
|
|
|
|
|
|
|
|
|
|
|
|
|
|
|
|
|
|
|
|
|
|
|
|
|
|
|
|
|
|
|
|
|
|
|
|
|
|
|
| Income from operations (or EBIT) |
|
|
162 |
|
|
|
351 |
|
|
|
237 |
|
|
|
(83 |
) |
|
|
(343 |
) |
|
|
486 |
|
|
|
456 |
|
|
|
520 |
|
|
|
185 |
|
|
|
(675 |
) |
| 1) |
Adjusted EBITA is defined as Income from operations (EBIT) excluding amortization of acquired intangible assets, impairment of goodwill and other intangible assets,
restructuring charges, acquisition-related costs and other significant items |
| 2) |
Excluding amortization of software and product development |
|
|
|
|
|
|
|
|
Press Release Q4 2015 |
|
31 |
Reconciliation of non-GAAP performance measures (continued)
Net operating capital to total assets
in millions of EUR
|
|
|
|
|
|
|
|
|
|
|
|
|
|
|
|
|
|
|
|
|
| |
|
Philips Group |
|
|
Healthcare |
|
|
Consumer
Lifestyle |
|
|
Lighting |
|
|
IG&S |
|
|
|
|
|
|
|
| December 31, 2015 |
|
|
|
|
|
|
|
|
|
|
|
|
|
|
|
|
|
|
|
|
| Net operating capital (NOC) |
|
|
11,096 |
|
|
|
9,212 |
|
|
|
1,453 |
|
|
|
3,813 |
|
|
|
(3,382 |
) |
| Exclude liabilities comprised in NOC: |
|
|
|
|
|
|
|
|
|
|
|
|
|
|
|
|
|
|
|
|
| - payables/liabilities |
|
|
9,640 |
|
|
|
3,064 |
|
|
|
1,356 |
|
|
|
1,510 |
|
|
|
3,710 |
|
| - intercompany accounts |
|
|
— |
|
|
|
128 |
|
|
|
36 |
|
|
|
87 |
|
|
|
(251 |
) |
| - provisions |
|
|
3,225 |
|
|
|
903 |
|
|
|
235 |
|
|
|
446 |
|
|
|
1,641 |
|
| Include assets not comprised in NOC: |
|
|
|
|
|
|
|
|
|
|
|
|
|
|
|
|
|
|
|
|
| - investments in associates |
|
|
181 |
|
|
|
56 |
|
|
|
— |
|
|
|
19 |
|
|
|
106 |
|
| - other current financial assets |
|
|
12 |
|
|
|
|
|
|
|
|
|
|
|
|
|
|
|
12 |
|
| - other non-current financial assets |
|
|
489 |
|
|
|
|
|
|
|
|
|
|
|
|
|
|
|
489 |
|
| - deferred tax assets |
|
|
2,758 |
|
|
|
|
|
|
|
|
|
|
|
|
|
|
|
2,758 |
|
| - cash and cash equivalents |
|
|
1,766 |
|
|
|
|
|
|
|
|
|
|
|
|
|
|
|
1,766 |
|
|
|
|
|
|
|
|
|
|
|
|
|
|
|
|
|
|
|
|
|
|
| Total assets excluding assets classified as held for sale |
|
|
29,167 |
|
|
|
13,363 |
|
|
|
3,080 |
|
|
|
5,875 |
|
|
|
6,849 |
|
| Assets classified as held for sale |
|
|
1,809 |
|
|
|
|
|
|
|
|
|
|
|
|
|
|
|
|
|
|
|
|
|
|
|
|
|
|
|
|
|
|
|
|
|
|
|
|
|
|
| Total assets |
|
|
30,976 |
|
|
|
|
|
|
|
|
|
|
|
|
|
|
|
|
|
|
|
|
|
|
|
| December 31, 2014 |
|
|
|
|
|
|
|
|
|
|
|
|
|
|
|
|
|
|
|
|
| Net operating capital (NOC) |
|
|
8,838 |
|
|
|
7,565 |
|
|
|
1,353 |
|
|
|
3,638 |
|
|
|
(3,718 |
) |
| Exclude liabilities comprised in NOC: |
|
|
|
|
|
|
|
|
|
|
|
|
|
|
|
|
|
|
|
|
| - payables/liabilities |
|
|
9,379 |
|
|
|
2,711 |
|
|
|
1,411 |
|
|
|
1,422 |
|
|
|
3,835 |
|
| - intercompany accounts |
|
|
— |
|
|
|
125 |
|
|
|
65 |
|
|
|
129 |
|
|
|
(319 |
) |
| - provisions |
|
|
3,445 |
|
|
|
793 |
|
|
|
220 |
|
|
|
530 |
|
|
|
1,902 |
|
| Include assets not comprised in NOC: |
|
|
|
|
|
|
|
|
|
|
|
|
|
|
|
|
|
|
|
|
| - investments in associates |
|
|
157 |
|
|
|
80 |
|
|
|
— |
|
|
|
20 |
|
|
|
57 |
|
| - other current financial assets |
|
|
125 |
|
|
|
|
|
|
|
|
|
|
|
|
|
|
|
125 |
|
| - other non-current financial assets |
|
|
462 |
|
|
|
|
|
|
|
|
|
|
|
|
|
|
|
462 |
|
| - deferred tax assets |
|
|
2,460 |
|
|
|
|
|
|
|
|
|
|
|
|
|
|
|
2,460 |
|
| - cash and cash equivalents |
|
|
1,873 |
|
|
|
|
|
|
|
|
|
|
|
|
|
|
|
1,873 |
|
|
|
|
|
|
|
|
|
|
|
|
|
|
|
|
|
|
|
|
|
|
| Total assets excluding assets classified as held for sale |
|
|
26,739 |
|
|
|
11,274 |
|
|
|
3,049 |
|
|
|
5,739 |
|
|
|
6,677 |
|
| Assets classified as held for sale |
|
|
1,613 |
|
|
|
|
|
|
|
|
|
|
|
|
|
|
|
|
|
|
|
|
|
|
|
|
|
|
|
|
|
|
|
|
|
|
|
|
|
|
| Total assets |
|
|
28,352 |
|
|
|
|
|
|
|
|
|
|
|
|
|
|
|
|
|
|
|
|
|
|
| 32 |
|
Press Release Q4 2015 |
|
|
Reconciliation of non-GAAP performance measures (continued)
Composition of net debt to group equity
in millions of
EUR unless otherwise stated
|
|
|
|
|
|
|
|
|
| |
|
December 31,
2014 |
|
|
December 31,
2015 |
|
|
|
|
| Long-term debt |
|
|
3,712 |
|
|
|
4,095 |
|
| Short-term debt |
|
|
392 |
|
|
|
1,665 |
|
|
|
|
|
|
|
|
|
|
| Total debt |
|
|
4,104 |
|
|
|
5,760 |
|
| Cash and cash equivalents |
|
|
1,873 |
|
|
|
1,766 |
|
|
|
|
|
|
|
|
|
|
| Net debt (total debt less cash and cash equivalents) |
|
|
2,231 |
|
|
|
3,994 |
|
|
|
|
| Shareholders’ equity |
|
|
10,867 |
|
|
|
11,662 |
|
| Non-controlling interests |
|
|
101 |
|
|
|
118 |
|
|
|
|
|
|
|
|
|
|
| Group equity |
|
|
10,968 |
|
|
|
11,780 |
|
|
|
|
| Net debt and group equity |
|
|
13,199 |
|
|
|
15,774 |
|
|
|
|
| Net debt divided by net debt and group equity (in %) |
|
|
17 |
% |
|
|
25 |
% |
| Group equity divided by net debt and group equity (in %) |
|
|
83 |
% |
|
|
75 |
% |
Composition of cash
flows
in millions of EUR
|
|
|
|
|
|
|
|
|
|
|
|
|
|
|
|
|
| |
|
Q4 |
|
|
January to December |
|
| |
|
2014 |
|
|
2015 |
|
|
2014 |
|
|
2015 |
|
| Cash flows provided by operating activities |
|
|
841 |
|
|
|
956 |
|
|
|
1,303 |
|
|
|
1,167 |
|
| Cash flows used for investing activities |
|
|
(261 |
) |
|
|
(216 |
) |
|
|
(984 |
) |
|
|
(1,941 |
) |
|
|
|
|
|
|
|
|
|
|
|
|
|
|
|
|
|
| Cash flows before financing activities |
|
|
580 |
|
|
|
740 |
|
|
|
319 |
|
|
|
(774 |
) |
|
|
|
|
|
| Cash flows provided by operating activities |
|
|
841 |
|
|
|
956 |
|
|
|
1,303 |
|
|
|
1,167 |
|
| Net capital expenditures: |
|
|
(282 |
) |
|
|
(216 |
) |
|
|
(806 |
) |
|
|
(842 |
) |
| Purchase of intangible assets |
|
|
(56 |
) |
|
|
(24 |
) |
|
|
(114 |
) |
|
|
(121 |
) |
| Expenditures on development assets |
|
|
(88 |
) |
|
|
(85 |
) |
|
|
(295 |
) |
|
|
(314 |
) |
| Capital expenditures on property, plant and equipment |
|
|
(153 |
) |
|
|
(178 |
) |
|
|
(437 |
) |
|
|
(522 |
) |
| Proceeds from sale of property, plant and equipment |
|
|
15 |
|
|
|
71 |
|
|
|
40 |
|
|
|
115 |
|
|
|
|
|
|
|
|
|
|
|
|
|
|
|
|
|
|
| Free cash flows |
|
|
559 |
|
|
|
740 |
|
|
|
497 |
|
|
|
325 |
|
|
|
|
|
|
|
|
|
Press Release Q4 2015 |
|
33 |
Philips statistics
in millions of EUR unless otherwise stated
|
|
|
|
|
|
|
|
|
|
|
|
|
|
|
|
|
|
|
|
|
|
|
|
|
|
|
|
|
|
|
|
|
| |
|
2014 |
|
|
2015 |
|
| |
|
Q1 |
|
|
Q2 |
|
|
Q3 |
|
|
Q4 |
|
|
Q1 |
|
|
Q2 |
|
|
Q3 |
|
|
Q4 |
|
|
|
|
|
|
|
|
|
|
| Sales |
|
|
4,692 |
|
|
|
4,969 |
|
|
|
5,194 |
|
|
|
6,536 |
|
|
|
5,339 |
|
|
|
5,974 |
|
|
|
5,836 |
|
|
|
7,095 |
|
| comparable sales
growth % |
|
|
(1 |
)% |
|
|
(1 |
)% |
|
|
0 |
% |
|
|
(2 |
)% |
|
|
2 |
% |
|
|
3 |
% |
|
|
2 |
% |
|
|
2 |
% |
|
|
|
|
|
|
|
|
|
| Gross margin |
|
|
1,900 |
|
|
|
2,075 |
|
|
|
1,702 |
|
|
|
2,529 |
|
|
|
2,116 |
|
|
|
2,495 |
|
|
|
2,422 |
|
|
|
2,823 |
|
| as a % of sales |
|
|
40.5 |
% |
|
|
41.8 |
% |
|
|
32.8 |
% |
|
|
38.7 |
% |
|
|
39.6 |
% |
|
|
41.8 |
% |
|
|
41.5 |
% |
|
|
39.8 |
% |
|
|
|
|
|
|
|
|
|
| Selling expenses |
|
|
(1,166 |
) |
|
|
(1,214 |
) |
|
|
(1,245 |
) |
|
|
(1,499 |
) |
|
|
(1,341 |
) |
|
|
(1,440 |
) |
|
|
(1,390 |
) |
|
|
(1,644 |
) |
| as a % of sales |
|
|
(24.9 |
)% |
|
|
(24.4 |
)% |
|
|
(24.0 |
)% |
|
|
(22.9 |
)% |
|
|
(25.1 |
)% |
|
|
(24.1 |
)% |
|
|
(23.8 |
)% |
|
|
(23.2 |
)% |
|
|
|
|
|
|
|
|
|
| G&A expenses |
|
|
(167 |
) |
|
|
(176 |
) |
|
|
(191 |
) |
|
|
(213 |
) |
|
|
(214 |
) |
|
|
(224 |
) |
|
|
(241 |
) |
|
|
(530 |
) |
| as a % of sales |
|
|
(3.6 |
)% |
|
|
(3.5 |
)% |
|
|
(3.7 |
)% |
|
|
(3.3 |
)% |
|
|
(4.0 |
)% |
|
|
(3.7 |
)% |
|
|
(4.1 |
)% |
|
|
(7.5 |
)% |
|
|
|
|
|
|
|
|
|
| R&D expenses |
|
|
(396 |
) |
|
|
(400 |
) |
|
|
(372 |
) |
|
|
(467 |
) |
|
|
(436 |
) |
|
|
(483 |
) |
|
|
(471 |
) |
|
|
(537 |
) |
| as a % of sales |
|
|
(8.4 |
)% |
|
|
(8.0 |
)% |
|
|
(7.2 |
)% |
|
|
(7.1 |
)% |
|
|
(8.2 |
)% |
|
|
(8.1 |
)% |
|
|
(8.1 |
)% |
|
|
(7.6 |
)% |
|
|
|
|
|
|
|
|
|
| EBIT |
|
|
172 |
|
|
|
291 |
|
|
|
(139 |
) |
|
|
162 |
|
|
|
139 |
|
|
|
349 |
|
|
|
342 |
|
|
|
162 |
|
| as a % of sales |
|
|
3.7 |
% |
|
|
5.9 |
% |
|
|
(2.7 |
)% |
|
|
2.5 |
% |
|
|
2.6 |
% |
|
|
5.8 |
% |
|
|
5.9 |
% |
|
|
2.3 |
% |
|
|
|
|
|
|
|
|
|
| EBITA |
|
|
253 |
|
|
|
368 |
|
|
|
(62 |
) |
|
|
262 |
|
|
|
230 |
|
|
|
450 |
|
|
|
429 |
|
|
|
263 |
|
| as a % of sales |
|
|
5.4 |
% |
|
|
7.4 |
% |
|
|
(1.2 |
)% |
|
|
4.0 |
% |
|
|
4.3 |
% |
|
|
7.5 |
% |
|
|
7.4 |
% |
|
|
3.7 |
% |
|
|
|
|
|
|
|
|
|
| Net income (loss) |
|
|
137 |
|
|
|
243 |
|
|
|
(103 |
) |
|
|
134 |
|
|
|
100 |
|
|
|
274 |
|
|
|
324 |
|
|
|
(39 |
) |
|
|
|
|
|
|
|
|
|
| Net income (loss) attributable to shareholders |
|
|
138 |
|
|
|
242 |
|
|
|
(104 |
) |
|
|
139 |
|
|
|
99 |
|
|
|
272 |
|
|
|
319 |
|
|
|
(45 |
) |
|
|
|
|
|
|
|
|
|
| Net income (loss) - shareholders per common share in EUR - diluted |
|
|
0.15 |
|
|
|
0.26 |
|
|
|
(0.11 |
) |
|
|
0.15 |
|
|
|
0.11 |
|
|
|
0.30 |
|
|
|
0.34 |
|
|
|
(0.05 |
) |
|
|
|
|
|
|
|
|
|
|
|
|
|
|
|
|
|
|
|
|
|
|
|
|
|
|
|
|
|
|
|
|
|
| |
|
2014 |
|
|
2015 |
|
| |
|
January-
March |
|
|
January-
June |
|
|
January-
September |
|
|
January-
December |
|
|
January-
March |
|
|
January-
June |
|
|
January-
September |
|
|
January-
December |
|
|
|
|
|
|
|
|
|
|
| Sales |
|
|
4,692 |
|
|
|
9,661 |
|
|
|
14,855 |
|
|
|
21,391 |
|
|
|
5,339 |
|
|
|
11,313 |
|
|
|
17,149 |
|
|
|
24,244 |
|
| comparable sales
growth % |
|
|
(1 |
)% |
|
|
(1 |
)% |
|
|
(1 |
)% |
|
|
(1 |
)% |
|
|
2 |
% |
|
|
3 |
% |
|
|
2 |
% |
|
|
2 |
% |
|
|
|
|
|
|
|
|
|
| Gross margin |
|
|
1,900 |
|
|
|
3,975 |
|
|
|
5,677 |
|
|
|
8,206 |
|
|
|
2,116 |
|
|
|
4,611 |
|
|
|
7,033 |
|
|
|
9,856 |
|
| as a % of sales |
|
|
40.5 |
% |
|
|
41.1 |
% |
|
|
38.2 |
% |
|
|
38.4 |
% |
|
|
39.6 |
% |
|
|
40.8 |
% |
|
|
41.0 |
% |
|
|
40.7 |
% |
|
|
|
|
|
|
|
|
|
| Selling expenses |
|
|
(1,166 |
) |
|
|
(2,380 |
) |
|
|
(3,625 |
) |
|
|
(5,124 |
) |
|
|
(1,341 |
) |
|
|
(2,781 |
) |
|
|
(4,171 |
) |
|
|
(5,815 |
) |
| as a % of sales |
|
|
(24.9 |
)% |
|
|
(24.6 |
)% |
|
|
(24.4 |
)% |
|
|
(24.0 |
)% |
|
|
(25.1 |
)% |
|
|
(24.6 |
)% |
|
|
(24.3 |
)% |
|
|
(24.0 |
)% |
|
|
|
|
|
|
|
|
|
| G&A expenses |
|
|
(167 |
) |
|
|
(343 |
) |
|
|
(534 |
) |
|
|
(747 |
) |
|
|
(214 |
) |
|
|
(438 |
) |
|
|
(679 |
) |
|
|
(1,209 |
) |
| as a % of sales |
|
|
(3.6 |
)% |
|
|
(3.6 |
)% |
|
|
(3.6 |
)% |
|
|
(3.5 |
)% |
|
|
(4.0 |
)% |
|
|
(3.9 |
)% |
|
|
(4.0 |
)% |
|
|
(5.0 |
)% |
|
|
|
|
|
|
|
|
|
| R&D expenses |
|
|
(396 |
) |
|
|
(796 |
) |
|
|
(1,168 |
) |
|
|
(1,635 |
) |
|
|
(436 |
) |
|
|
(919 |
) |
|
|
(1,390 |
) |
|
|
(1,927 |
) |
| as a % sales |
|
|
(8.4 |
)% |
|
|
(8.2 |
)% |
|
|
(7.9 |
)% |
|
|
(7.6 |
)% |
|
|
(8.2 |
)% |
|
|
(8.1 |
)% |
|
|
(8.1 |
)% |
|
|
(7.9 |
)% |
|
|
|
|
|
|
|
|
|
| EBIT |
|
|
172 |
|
|
|
463 |
|
|
|
324 |
|
|
|
486 |
|
|
|
139 |
|
|
|
488 |
|
|
|
830 |
|
|
|
992 |
|
| as a % of sales |
|
|
3.7 |
% |
|
|
4.8 |
% |
|
|
2.2 |
% |
|
|
2.3 |
% |
|
|
2.6 |
% |
|
|
4.3 |
% |
|
|
4.8 |
% |
|
|
4.1 |
% |
|
|
|
|
|
|
|
|
|
| EBITA |
|
|
253 |
|
|
|
621 |
|
|
|
559 |
|
|
|
821 |
|
|
|
230 |
|
|
|
680 |
|
|
|
1,109 |
|
|
|
1,372 |
|
| as a % of sales |
|
|
5.4 |
% |
|
|
6.4 |
% |
|
|
3.8 |
% |
|
|
3.8 |
% |
|
|
4.3 |
% |
|
|
6.0 |
% |
|
|
6.5 |
% |
|
|
5.7 |
% |
|
|
|
|
|
|
|
|
|
| Net income |
|
|
137 |
|
|
|
380 |
|
|
|
277 |
|
|
|
411 |
|
|
|
100 |
|
|
|
374 |
|
|
|
698 |
|
|
|
659 |
|
|
|
|
|
|
|
|
|
|
| Net income attributable to shareholders |
|
|
138 |
|
|
|
380 |
|
|
|
276 |
|
|
|
415 |
|
|
|
99 |
|
|
|
371 |
|
|
|
690 |
|
|
|
645 |
|
|
|
|
|
|
|
|
|
|
| Net income - shareholders per common share in EUR - diluted |
|
|
0.15 |
|
|
|
0.41 |
|
|
|
0.30 |
|
|
|
0.45 |
|
|
|
0.11 |
|
|
|
0.40 |
|
|
|
0.75 |
|
|
|
0.70 |
|
|
|
|
|
|
|
|
|
|
| Net income from continuing operations as a % of shareholders’ equity |
|
|
4.0 |
% |
|
|
5.7 |
% |
|
|
2.0 |
% |
|
|
2.0 |
% |
|
|
2.4 |
% |
|
|
5.3 |
% |
|
|
6.5 |
% |
|
|
3.6 |
% |
|
|
|
|
|
|
|
|
|
| Number of common shares outstanding (after deduction of treasury shares) at the end of period (in thousands) |
|
|
913,485 |
|
|
|
923,933 |
|
|
|
919,973 |
|
|
|
914,389 |
|
|
|
910,616 |
|
|
|
925,277 |
|
|
|
921,181 |
|
|
|
917,104 |
|
|
|
|
|
|
|
|
|
|
| Shareholders’ equity per common share in EUR |
|
|
12.06 |
|
|
|
11.63 |
|
|
|
11.86 |
|
|
|
11.88 |
|
|
|
12.50 |
|
|
|
12.32 |
|
|
|
12.43 |
|
|
|
12.72 |
|
|
|
|
|
|
|
|
|
|
| Inventories as a % of sales 1,2) |
|
|
14.8 |
% |
|
|
15.9 |
% |
|
|
17.1 |
% |
|
|
15.3 |
% |
|
|
17.3 |
% |
|
|
17.0 |
% |
|
|
16.8 |
% |
|
|
14.2 |
% |
|
|
|
|
|
|
|
|
|
| Net debt : group equity ratio |
|
|
15:85 |
|
|
|
18:82 |
|
|
|
19:81 |
|
|
|
17:83 |
|
|
|
26:74 |
|
|
|
28:72 |
|
|
|
28:72 |
|
|
|
25:75 |
|
|
|
|
|
|
|
|
|
|
| Net operating capital |
|
|
10,381 |
|
|
|
10,500 |
|
|
|
10,841 |
|
|
|
8,838 |
|
|
|
10,977 |
|
|
|
11,397 |
|
|
|
11,427 |
|
|
|
11,096 |
|
| Total employees |
|
|
114,268 |
|
|
|
112,834 |
|
|
|
115,261 |
|
|
|
113,678 |
|
|
|
115,970 |
|
|
|
114,606 |
|
|
|
114,380 |
|
|
|
112,959 |
|
| of which discontinued operations |
|
|
9,957 |
|
|
|
8,256 |
|
|
|
8,489 |
|
|
|
8,313 |
|
|
|
8,334 |
|
|
|
8,689 |
|
|
|
8,812 |
|
|
|
8,755 |
|
| 1) |
Sales is calculated over the preceding 12 months |
| 2) |
Inventories as a % of sales excludes inventories and sales related to acquisitions, divestments and discontinued operations |
|
|
|
|
|
| 34 |
|
Press Release Q4 2015 |
|
|

http://www.philips.com/investorrelations
© 2016 Koninklijke Philips N.V. All rights reserved.


 Hot Features