ADVFN Logo ADVFN

We could not find any results for:
Make sure your spelling is correct or try broadening your search.

Trending Now

Toplists

It looks like you aren't logged in.
Click the button below to log in and view your recent history.

Hot Features

Registration Strip Icon for discussion Register to chat with like-minded investors on our interactive forums.

OPY Oppenheimer Holdings Inc

64.61
-0.63 (-0.97%)
Last Updated: 15:46:19
Delayed by 15 minutes
Share Name Share Symbol Market Type
Oppenheimer Holdings Inc NYSE:OPY NYSE Common Stock
  Price Change % Change Share Price High Price Low Price Open Price Shares Traded Last Trade
  -0.63 -0.97% 64.61 64.90 64.08 64.57 2,221 15:46:19

Oppenheimer Holdings Inc. - Fourth Quarter 2009 Earnings and Dividend Announcement

29/01/2010 1:00pm

PR Newswire (US)


Oppenheimer (NYSE:OPY)
Historical Stock Chart


From Dec 2019 to Dec 2024
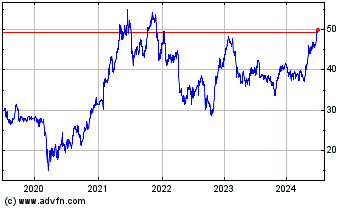
Click Here for more Oppenheimer Charts.
NYSE - OPY NEW YORK, Jan. 29 /PRNewswire-FirstCall/ -- Expressed in thousands of dollars, except share and per share amounts Three Months ended Year ended December 31, December 31, ------------------------------------------------------------------------- ------------------------------------------------------------------------- (unaudited) 2009 2008 2009 2008 Revenue $273,377 $209,767 $991,433 $920,070 Expenses $262,768 $217,496 $956,620 $956,113 Profit (loss) before taxes $10,609 $(7,729) $34,813 $(36,043) Net profit (loss) $6,463 $(3,824) $19,487 $(20,770) Basic earnings (loss) per share $0.49 $(0.29) $1.49 $(1.57) Diluted earnings (loss) per share $0.48 $(0.29) $1.45 $(1.57) Book value per share $34.15 $32.75 Business Review Oppenheimer Holdings Inc. reported a net profit of $6.5 million or $0.49 per share for the fourth quarter of 2009, compared to a net loss of $3.8 million or $0.29 per share in the fourth quarter of 2008. Revenue for the fourth quarter of 2009 was $273.4 million, compared to revenue of $209.8 million in the fourth quarter of 2008, an increase of 30%. The net profit for the year ended December 31, 2009 was $19.5 million or $1.49 per share compared to a net loss of $20.8 million or $1.57 per share for the year ended December 31, 2008. Revenue for the year ended December 31, 2009 was $991.4 million, compared to revenue of $920.1 million for the same period in 2008, an increase of 8%. At year-end, the U.S. economy has emerged from the longest contraction since the Great Depression. Unemployment continues at very high levels and uncertainty continues to plague the economy as we await the reversal of stimulative policies from the Federal Reserve and a determination of national policies for major segments of the economy including healthcare and the financial system. Other economic indicators are showing improvement including: increased manufacturing activity, higher commodity prices and higher end sales to consumers and businesses. The real estate markets are sending mixed signals with significant deterioration in commercial real estate prices but improvements in the housing market across most of the country. Improving market conditions since March 2009, buoyed by low interest rates and discretionary funds for investment, have led to overall revenue improvements for the Company in each successive quarter of 2009. Revenue from commissions and principal transactions in the three and twelve months ended December 31, 2009 surpassed levels achieved in comparable periods in 2008 as a result of the effects of rising equity prices and the credit markets recovery from distressed levels. The strength in revenue from principal transactions was largely due to the Company's significant progress in building its fixed income division as well as strong debt markets throughout the year. Revenue for the Company from investment banking activities remains disappointing as many mid-sized and smaller companies continue to face restricted access to the capital markets, although there were significant signs of improvement in that sector in the fourth quarter of 2009. Net interest revenue for the Company, as well as fees derived from money market funds and FDIC insured deposits of clients, continue to be significantly and adversely affected by the low interest rate policies that have been designed to stimulate the economy. Asset management advisory fees increased in the fourth quarter of 2009 due to incentive fees earned on certain managed funds compared to the prior year. While most expense categories showed significant decreases compared to the prior year, the Company's compensation levels as a percentage of revenue remained at high levels as a result of: 1) increased stock-based and deferred compensation which reflected the significant improvement in the Company's stock price as well as increases in the value of assets directly tied to deferred compensation plans (totaling $33.7 million), 2) the remaining costs of compensation associated with the CIBC Capital Markets acquisition ($25.7 million), and 3) short term guaranteed compensation to new employees (while down substantially from the prior year) as the Company significantly expanded its professional work force across all areas of its business during 2009. In commenting on the Company's results, Albert Lowenthal, Chairman remarked," Oppenheimer made considerable progress in 2009. We were able to bring costs, excluding compensation, to normalized levels. We are pleased with our ability to expand our business opportunities including the addition of branch offices in the U.S., significant increases to our professional workforces internationally and increased Capital Markets capabilities in fixed income as a result of dislocations in this business. We look forward to reaping the benefits of these strategic initiatives." Highlights of the Company's results for the three and twelve months ended December 31, 2009 follow: Revenue and Expenses Revenue -Fourth Quarter 2009 ---------------------------- - Commission revenue was $142.7 million in the fourth quarter of 2009 which was flat compared to $141.3 million in the fourth quarter of 2008. - Principal transactions revenue was significantly higher in the fourth quarter of 2009 at $22.4 million compared to a loss of $7.6 million in the fourth quarter of 2008 due to profits in fixed income trading of $20.7 million in the fourth quarter 2009 (versus $3.7 million in the fourth quarter of 2008) and gains of $1.5 million in the value of firm investments in the fourth quarter of 2009 (versus a loss of $9.1 million in the fourth quarter of 2008). - Interest revenue was $10.6 million in the fourth quarter of 2009 which was flat compared to $10.6 million in the fourth quarter of 2008. - Investment banking revenue increased 139% to $35.4 million in the fourth quarter of 2009, compared to $14.8 million in the fourth quarter of 2008 with equity issuances accounting for $17.8 million of the variance. - Advisory fees were $50.8 million in the fourth quarter of 2009 compared to $41.3 million in the fourth quarter of 2008, an increase of 23% as a result of an increase in assets under management of 4.2% during the period and incentive fees earned from general partnership interests in alternative investments of $10.7 million ($nil in fourth quarter of 2008), net of a decrease of $6.3 million in fees derived from money market funds. - Other revenue increased 24% to $11.6 million in the fourth quarter of 2009 compared to the fourth quarter of 2008 as a result of a legal settlement award of $2 million. Revenue - Year-to-Date 2009 --------------------------- - Commission revenue was $555.6 million in the year ended December 31, 2009 compared to $532.7 million in the same period in 2008, representing an increase of 4%, reflecting improved market conditions in 2009 compared to 2008. - Principal transactions revenue was significantly higher in the year ended December 31, 2009 at $107.1 million compared to $20.7 million in the same period in 2008 due to significant improvement in fixed income trading in 2009 representing a $61.8 million increase when compared to 2008 as well as gains of $9.8 million in the value of firm investments in 2009 (versus a loss of $17.8 million in 2008). - Interest revenue declined 42% to $36.0 million in the year ended December 31, 2009 from $61.8 million in the same period in 2008 due to decreases in interest earned on customer margin debits of $19.1 million and on securities borrowed positions of $6.2 million. - Investment banking revenue increased 9% to $91.0 million in the year ended December 31, 2009 compared to $83.5 million in the same period in 2008 as fees earned on equity underwriting participations increased $23.0 million offset by a decrease of $11.4 million in corporate finance advisory fees. - Advisory fees were $160.7 million in the in the year ended December 31, 2009, a decrease of 19% compared to $199.0 million in the same period in 2008 as a result of a decrease in average assets under management during the period of 10.7%. It also includes a decrease of $21.1 million in fees derived from money market funds. The Company earned incentive fees from general partnership interests in alternative investments of $10.7 million in 2009 ($nil in 2008). - Other revenue increased 83% to $41.1 million for the year ended December 31, 2009 from $22.4 million in the same period in 2008 primarily as a result of increases to the value of Company owned life insurance of $14.3 million, increased fees of $5.0 million related to the Company's mortgage brokerage business, and a legal settlement award of $2 million, partially offset by a decrease of $3.9 million in fees derived from FDIC insured client deposits. Expenses - Fourth Quarter 2009 ------------------------------ - Compensation and related expenses increased 31% in the fourth quarter of 2009 to $188.3 million from $144.0 million during the fourth quarter 2008 as production and incentive-related compensation increased $27.2 million, deferred compensation costs increased $6.0 million, and share-based compensation, directly related to an increased share price during the quarter, increased $6.6 million. - Clearing and exchange fees decreased 6% to $7.2 million in the fourth quarter of 2009 compared to $7.7 million in the same period of 2008. - Communications and technology expenses decreased 26% to $14.4 million in the fourth quarter of 2009 from $19.4 million in the same period of 2008 as a result of a reduction, or elimination, of many costs associated with the January 2008 acquisition of a major part of CIBC World Markets' U.S. Capital Markets Business. - Occupancy and equipment costs increased 7% to $18.9 million in the fourth quarter of 2009 from $17.7 million in the fourth quarter of 2008 due to escalation provisions increasing rental costs, as well as the opening of new branch offices around the country. - Interest expenses increased 14% to $5.6 million in the fourth quarter of 2009 from $4.9 million in the same period in 2008 due to interest expense incurred on positions and repurchase agreements held by the new government trading desk. - Other expenses increased 19% to $28.3 million in the fourth quarter of 2009 from $23.7 million in the same period in 2008 due to increased legal costs of approximately $4.8 million, offset by the elimination of $1.2 million in non-recurring transitional support costs related to the CIBC capital markets business acquired in January 2008 Expenses - Year-to-Date 2009 ---------------------------- - Compensation and related expenses were $672.3 million for the year ended December 31, 2009 compared with $626 million for the same period in 2008, an increase of 7%. Production and incentive-related compensation increased $35.1 million, deferred compensation costs increased $16.3 million, and share-based compensation, directly related to an increased share price during the period, increased $17.4 million. These increases were offset by a decrease of $25.7 million for expenses related to deferred compensation obligations to former CIBC employees. - Clearing and exchange fees decreased 14% to $26.7 million for the year ended December 31, 2009 compared to $31.0 million in the same period in 2008 primarily reflecting the economies of transitioning the acquired businesses to the Company's platform. - Communications and technology expenses decreased 17% to $62.7 million for the year ended December 31, 2009 from $75.4 million for the same period of 2008 as a result of a reduction, or elimination, of many costs associated with our January 2008 acquisition. - Occupancy and equipment costs increased 6% to $74.4 million for the year ended December 31, 2009 from $69.9 million in the same period in 2008 due to escalation provisions increasing rental costs, as well as the opening of new branch offices around the country. - Interest expenses declined 46% to $21.1 million in the year ended December 31, 2009 from $39.0 million for the same period in 2008 due to declining interest rates resulting in lower interest incurred on securities loaned and bank loans totaling $13.5 million. - Other expenses decreased 13% to $99.4 million in the year ended December 31, 2009 from $114.8 million for the same period in 2008 largely as a result of the elimination of $33.5 million in non- recurring transitional support costs related to the CIBC capital markets business acquired in January 2008 offset by an increase in legal costs of approximately $14.7 million and a departure tax of approximately $2.0 million which was paid to the government of Canada in connection with the move of the Company's domicile to the United States. Shareholders' Equity and Dividend Declaration - At December 31, 2009, shareholders' equity was $451.4 million compared to $425.7 million at December 31, 2008. - At December 31, 2009, book value per share was $34.15 compared to $32.75 at December 31, 2008. - During the fourth quarter of 2009, the Company did not make any purchases pursuant to its stock buy-back program. - The Company announced today a quarterly dividend in the amount of U.S. $0.11 per share, payable on February 26, 2010 to holders of Class A non-voting and Class B voting common stock of record on February 12, 2010. ------------------------------------------------------------------------- OPPENHEIMER HOLDINGS INC. SUMMARY STATEMENT OF OPERATIONS (UNAUDITED) $ in thousands, except share and per share amounts ----------------------------------------------------------- Three Months Ended Year Ended % % 12/31/09 12/31/08 delta 12/31/09 12/31/08 delta ----------------------------------------------------------- REVENUE Commissions $142,661 $141,338 1% $555,574 $532,682 4% Principal transactions, net 22,374 (7,594) n/a 107,094 20,651 419% Interest 10,625 10,560 1% 35,960 61,793 -42% Investment banking 35,363 14,805 139% 90,960 83,541 9% Advisory fees 50,762 41,319 23% 160,705 198,960 -19% Other 11,592 9,339 24% 41,140 22,443 83% ----------------------------- --------------------------- 273,377 209,767 30% 991,433 920,070 8% ----------------------------- --------------------------- EXPENSES Compensation & related expenses 188,257 143,978 31% 672,325 626,030 7% Clearing & exchange fees 7,244 7,733 -6% 26,748 31,007 -14% Communications & technology 14,435 19,448 -26% 62,724 75,359 -17% Occupancy & equipment costs 18,869 17,678 7% 74,372 69,945 6% Interest 5,618 4,936 14% 21,050 38,998 -46% Other 28,345 23,723 19% 99,401 114,774 -13% ----------------------------- --------------------------- 262,768 217,496 21% 956,620 956,113 0% ----------------------------- --------------------------- Profit (loss) before taxes 10,609 (7,729) n/a 34,813 (36,043) n/a Income tax provision (benefit) 4,146 (3,905) n/a 15,326 (15,273) n/a ----------------------------- --------------------------- ----------------------------- --------------------------- Net profit (loss) for the period $6,463 ($3,824) n/a $19,487 ($20,770) n/a ----------------------------- --------------------------- ----------------------------- --------------------------- Profit (loss) per share Basic $0.49 ($0.29) $1.49 ($1.57) Diluted $0.48 ($0.29) $1.45 ($1.57) Basic weighted average shares outstanding 13,116,107 13,022,155 13,110,647 13,199,580 Actual shares outstanding 13,217,681 12,999,145 13,217,681 12,999,145 ------------------------------------------------------------------------- Company Information Oppenheimer, through its principal subsidiaries, Oppenheimer & Co. Inc. (a U.S. broker-dealer) and Oppenheimer Asset Management Inc., offers a wide range of investment banking, securities, investment management and wealth management services from over 94 offices in 26 states and through local broker-dealers in 4 foreign jurisdictions. Oppenheimer employs over 3,500 people. The Company offers trust and estate services through Oppenheimer Trust Company. OPY Credit Corp. offers syndication as well as trading of issued corporate loans. Evanston Financial Corporation is engaged in mortgage brokerage and servicing. In addition, through Freedom Investments, Inc. and the BUYandHOLD division of Freedom, Oppenheimer offers online discount brokerage and dollar-based investing services. Forward-Looking Statements This press release includes certain "forward-looking statements" relating to anticipated future performance. For a discussion of the factors that could cause future performance to be different than anticipated, reference is made to Oppenheimer's Annual Report on Form 10-K for the year ended December 31, 2008. DATASOURCE: Oppenheimer Holdings Inc. CONTACT: A.G. Lowenthal, (212) 668-8000; or E.K. Roberts, (416) 322-1515

Copyright

1 Year Oppenheimer Chart

1 Year Oppenheimer Chart

1 Month Oppenheimer Chart

1 Month Oppenheimer Chart

Your Recent History

Delayed Upgrade Clock