
We could not find any results for:
Make sure your spelling is correct or try broadening your search.
| Share Name | Share Symbol | Market | Type |
|---|---|---|---|
| NexPoint Residential Trust Inc | NYSE:NXRT | NYSE | Common Stock |
| Price Change | % Change | Share Price | High Price | Low Price | Open Price | Shares Traded | Last Trade | |
|---|---|---|---|---|---|---|---|---|
| 0.00 | 0.00% | 40.79 | 2 | 12:00:26 |
UNITED STATES
SECURITIES AND EXCHANGE COMMISSION
WASHINGTON, D.C. 20549
FORM
CURRENT REPORT
Pursuant to Section 13 or 15(d) of the
Securities Exchange Act of 1934
Date of report (Date of earliest event reported):
(Exact Name Of Registrant As Specified In Charter)
| (State or Other Jurisdiction of Incorporation) |
(Commission File Number) |
(IRS Employer Identification No.) |
(Address of Principal Executive Offices) (Zip Code)
Registrant’s telephone number, including area code:
Check the appropriate box below if the Form 8-K filing is intended to simultaneously satisfy the filing obligation of the registrant under any of the following provisions (see General Instruction A.2. below):
Securities registered pursuant to Section 12(b) of the Act:
| Title of each class | Trading Symbol(s) |
Name of each exchange on which registered | ||
|
|
|
| ||
Indicate by check mark whether the registrant is an emerging growth company as defined in Rule 405 of the Securities Act of 1933 (§230.405 of this chapter) or Rule 12b-2 of the Securities Exchange Act of 1934 (§240.12b-2 of this chapter).
Emerging growth company
If an emerging growth company, indicate by check mark if the registrant has elected not to use the extended transition period for complying with any new or revised financial accounting standards provided pursuant to Section 13(a) of the Exchange Act. ☐
Item 2.02. Results of Operations and Financial Condition.
The following information is intended to be furnished under Item 2.02 of Form 8-K, “Results of Operations and Financial Condition.” This information shall not be deemed “filed” for purposes of Section 18 of the Securities Exchange Act of 1934, as amended (the “Exchange Act”), or incorporated by reference in any filing under the Securities Act of 1933, as amended, or the Exchange Act, whether made before or after the date of this report, regardless of any general incorporation language in the filing. In a press release dated February 20, 2024, NexPoint Residential Trust, Inc. (the “Company”) announced financial results for the Company’s year ended December 31, 2023. The full text of the press release is furnished herewith as Exhibit 99.1 to this report.
Item 9.01. Financial Statements and Exhibits.
(d) Exhibits.
| Exhibit |
Exhibit Description | |
| 99.1 | ||
| 104 | Cover Page Interactive Data File (embedded within the Inline XBRL document) | |
SIGNATURES
Pursuant to the requirements of the Securities Exchange Act of 1934, the registrant has duly caused this report to be signed on its behalf by the undersigned hereunto duly authorized.
| NEXPOINT RESIDENTIAL TRUST, INC. | ||||||
|
|
By: |
/s/ Brian Mitts | ||||
| Name: Brian Mitts Title: Chief Financial Officer, Executive VP-Finance, Secretary and Treasurer | ||||||
Date: February 20, 2023
Exhibit 99.1
20 February 2024 | NYSE: NXRT
EARNINGS SUPPLEMENT: FOURTH QUARTER & FULL YEAR 2023

NEXPOINT RESIDENTIAL TRUST, INC.
300 CRESCENT COURT, SUITE 700
DALLAS, TX 75201
INVESTOR RELATIONS:
KRISTEN THOMAS
| NXRT.NEXPOINT.COM |
NEXPOINT RESIDENTIAL TRUST, INC. [NYSE:NXRT]
TABLE OF CONTENTS
| Earnings Release |
1 | |||
| Cautionary Statement Regarding Forward-Looking Statements |
3 | |||
| Overview |
4 | |||
| Highlights of Fourth Quarter and FY 2023 Activity |
5 | |||
| Financial Summary |
8 | |||
| 2024 Full Year Guidance Summary |
9 | |||
| Components of Net Asset Value |
10 | |||
| Consolidated Balance Sheets |
11 | |||
| Consolidated Statements of Operations |
12 | |||
| NOI and Same Store NOI |
13 | |||
| 2022-2023 Same Store Results |
15 | |||
| 2022-2023 Same Store Properties Operating Metrics |
17 | |||
| QoQ Same Store Properties Operating Metrics |
18 | |||
| 2021-2023 Same Store Results |
19 | |||
| Q4 Same Store Results |
22 | |||
| FFO, Core FFO and AFFO |
24 | |||
| Historical Capital Expenditures |
25 | |||
| Value-Add Program Details |
26 | |||
| Outstanding Debt Details |
29 | |||
| Debt Maturity Schedule |
32 | |||
| Historical Acquisition Details |
33 | |||
| Historical Disposition Details |
34 | |||
| Definitions and Reconciliations of Non-GAAP Measures |
35 | |||
THE ADAIR APARTMENT HOMES: SANDY SPRINGS, GA

REVAMPED FITNESS CENTER
COMMUNITY GARDEN AMENITY AREA
NEXPOINT RESIDENTIAL TRUST, INC. [NYSE:NXRT]
FOR IMMEDIATE RELEASE
Contact:
Investor Relations
Kristen Thomas
IR@nexpoint.com
(214) 276-6300
Media inquiries: Pro-Nexpoint@prosek.com
NEXPOINT RESIDENTIAL TRUST, INC. REPORTS FOURTH QUARTER AND FULL YEAR 2023 RESULTS
NXRT Recaps Disposition Activity, Value-Add Results and Issues 2024 Full Year Guidance
Dallas, TX, February 20, 2024 – NexPoint Residential Trust, Inc. (NYSE:NXRT) reported financial results for the fourth quarter and year ended December 31, 2023.
Highlights
| ● | NXRT1 reported net income, FFO2, Core FFO2 and AFFO2 of $44.3M, $71.4M, $73.5M and $84.4M, respectively, attributable to common stockholders for the year ended December 31, 2023, compared to net loss, FFO, Core FFO, and AFFO of $(9.3)M, $73.4M, $81.8M and $91.4M, respectively, attributable to common stockholders for the year ended December 31, 2022. |
| ● | For the year ended December 31, 2023, 2022-2023 Same Store properties3 average effective rent, total revenue and NOI2 increased 0.1%, 7.1% and 8.2%, respectively, and occupancy increased 60 bps over the prior year period. |
| ● | During the year ended December 31, 2023, the Company completed the sales of Silverbrook and Timber Creek for a combined sales price of $119.0 million. |
| ● | The weighted average effective monthly rent per unit across all 38 properties held as of December 31, 2023 (the “Portfolio”), consisting of 14,133 units4, was $1,502, while physical occupancy was 94.7%. |
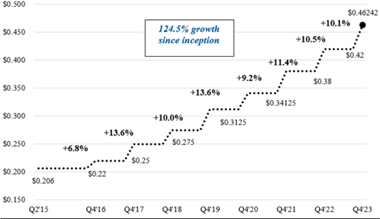
| ● | NXRT paid a fourth quarter dividend of $0.46242 per share of common stock on December 29, 2023; this cash dividend represented a $0.04242 per share, or 10.1% increase, over the prior quarter’s dividend. Since inception, NXRT has increased the dividend per share by 124.5%. |
| ● | During 2023, for the properties in the Portfolio, NXRT completed 2,073 full/partial upgrades and washer/dryer installation, achieving an average monthly rent premium of $190 and a 21.4% ROI5. |
| ● | Since inception, NXRT has completed installation of 8,534 full and partial upgrades, 4,761 kitchen and laundry appliances and 12,348 technology packages, resulting in $169, $49 and $43 average monthly rental increase per unit and 20.9%, 64.7% and 37.8% ROI, respectively. |
| ● | During the year ended December 31, 2023, the Company paid down $50.5 million of principal on its corporate credit facility. |
| (1) | In this release, “we,” “us,” “our,” the “Company,” “NexPoint Residential Trust,” and “NXRT” each refer to NexPoint Residential Trust, Inc., a Maryland corporation. |
| (2) | FFO, Core FFO, AFFO and NOI are non-GAAP measures. For a discussion of why we consider these non-GAAP measures useful and reconciliations of FFO, Core FFO, AFFO and NOI to net income (loss), see the “Definitions and Reconciliations of Non-GAAP Measures” and “FFO, Core FFO and AFFO” sections of this release. |
| (3) | We define “Same Store” properties as properties that were in our Portfolio for the entirety of the periods being compared. There are 33 properties encompassing 12,378 units of apartment space in our Same Store pool for the year ended December 31, 2023 (our “2022-2023” Same Store” properties). There are 35 properties encompassing 12,940 units of apartment space in our Q4 Same Store pool for the three months ended December 31, 2023 (our “Q4 Same Store” properties). The same store unit count excludes 44 units that are currently down due to fires (Rockledge: 20 units, Bella Solara: 8 units, Six Forks Station: 8 units, Versailles II: 7 units and Bloom: 1 unit). |
| (4) | Total number of units owned as of December 31, 2023 is 14,133, however 45 units are currently down due to fires and water damage (Rockledge: 20 units, Bella Solara: 8 units, Six Forks Station: 8 units, Versailles II: 7 units, Bloom: 1 unit and Old Farm: 1 unit). |
| (5) | We define Return on Investment (“ROI”) as the sum of the actual rent premium divided by the sum of the total cost. |
| NXRT.NEXPOINT.COM | Page 1 |
NEXPOINT RESIDENTIAL TRUST, INC. [NYSE:NXRT]
Full Year 2023 Financial Results
| ● | Total revenues were $277.5 million for the full year 2023, compared to $264.0 million for the full year 2022. |
| ● | Net income for the full year 2023 totaled $44.3 million, or income of $1.69 per diluted share, which included a gain on sales of real estate of $67.9 million and $95.2 million of depreciation and amortization expense. This compared to net loss of $(9.3) million, or loss of $(0.36) per diluted share, which included a gain on sales of real estate of $14.7 million and $97.6 million of depreciation and amortization expense for the full year 2022. |
| ● | The change in our net income of $44.4 million for the year ended December 31, 2023 as compared to our net loss of $(9.3) million for the year ended December 31, 2022 primarily relates to increases in gains on sales of real estate and total revenues, partially offset by an increase in interest expense. |
| ● | For the full year 2023, NOI was $167.4 million on 38 properties, compared to $157.4 million for the full year 2022 on 40 properties. |
| ● | For the full year 2023, Same Store NOI increased 8.2% to $145.0 million, compared to $134.0 million for the full year 2022. |
| ● | For the full year 2023, FFO totaled $71.4 million, or $2.72 per diluted share, compared to $73.4 million, or $2.81 per diluted share, for the full year 2022. For the full year 2023, Core FFO totaled $73.5 million, or $2.80 per diluted share, compared to $81.8 million, or $3.13 per diluted share, for the full year 2022. For the full year 2023, AFFO totaled $84.4 million, or $3.22 per diluted share, compared to $91.4 million, or $3.49 per diluted share, for the full year 2022. |
Fourth Quarter 2023 Financial Results
| ● | Total revenues were $68.9 million for the fourth quarter of 2023, compared to $69.3 million for the fourth quarter of 2022. |
| ● | Net income for the fourth quarter of 2023 totaled $18.4 million, or income of $0.70 per diluted share, which included $24.3 million of depreciation and amortization expense and $18.3 million of interest expense. This compared to net income of $3.8 million, or income of $0.15 per diluted share, for the fourth quarter of 2022, which included $23.2 million of depreciation and amortization expense and $15.8 million of interest expense. |
| ● | The change in our net income of $18.4 million for the fourth quarter of 2023 as compared to our net income of $3.8 primarily relates to increases in gains on sales of real estate, partially offset by an increase in interest expense. |
| ● | For the fourth quarter of 2023, NOI was $42.2 million on 38 properties, compared to $41.8 million for the fourth quarter of 2022 on 40 properties. |
| ● | For the fourth quarter of 2023, Q4 Same Store NOI increased 4.5% to $39.1 million, compared to $37.4 million for the fourth quarter of 2022. |
| ● | For the fourth quarter of 2023, FFO totaled $17.8 million, or $0.68 per diluted share, compared to $12.2 million, or $0.47 per diluted share, for the fourth quarter of 2022. For the fourth quarter of 2023, Core FFO totaled $17.4 million, or $0.66 per diluted share, compared to $19.5 million, or $0.75 per diluted share, for the fourth quarter of 2022. For the fourth quarter of 2023, AFFO totaled $20.1 million, or $0.77 per diluted share, compared to $22.0 million, or $0.84 per diluted share, for the fourth quarter of 2022. |
Fourth Quarter Earnings Conference Call
NXRT will host a call on Tuesday, February 20, 2024, at 11:00 a.m. ET (10:00 a.m. CT), to discuss its full year and fourth quarter 2023 financial results. The conference call can be accessed live over the phone by dialing 888-660-4430 or, for international callers, +1 646-960-0537 and using passcode Conference ID: 5001576. A live audio webcast of the call will be available online at the Company’s website, nxrt.nexpoint.com (under “Resources”). An online replay will be available shortly after the call on the Company’s website and continue to be available for 60 days.
A replay of the conference call will also be available through Tuesday, March 5, 2024, by dialing 800- 770- 2030 or, for international callers, +1 647-362-9199 and entering passcode 5001576.
About NXRT
NexPoint Residential Trust is a publicly traded REIT, with its shares listed on the New York Stock Exchange under the symbol “NXRT,” primarily focused on acquiring, owning and operating well-located middle-income multifamily properties with “value-add” potential in large cities and suburban submarkets of large cities, primarily in the Southeastern and Southwestern United States. NXRT is externally advised by NexPoint Real Estate Advisors, L.P., an affiliate of NexPoint Advisors, L.P., an SEC-registered investment advisor, which has extensive real estate experience. Our filings with the Securities and Exchange Commission (the “SEC”) are available on our website, nxrt.nexpoint.com, under the “Financials” tab.
| NXRT.NEXPOINT.COM | Page 2 |
NEXPOINT RESIDENTIAL TRUST, INC. [NYSE:NXRT]
Cautionary Statement Regarding Forward-Looking Statements
This release contains forward-looking statements within the meaning of the Private Securities Litigation Reform Act of 1995 that are based on management’s current expectations, assumptions and beliefs. Forward-looking statements can often be identified by words such as “expect,” “anticipate,” “estimate,” “may,” “plan,” “believe” and similar expressions, and variations or negatives of these words. These forward-looking statements include, but are not limited to, statements regarding NXRT’s business and industry in general, pro-forma debt allocation and capital structure and related assumptions, including paydowns of property level debt in connection with dispositions and the paydown of the Company’s Corporate Credit Facility (as defined below) in Q1 2024 with the net proceeds from the sale of Old Farm, forecasted submarket deliveries, 2024 full year guidance and the related components and assumptions, including acquisitions and dispositions, shares outstanding, interest expense and the related components and same store growth projections, NXRT’s net asset value and the related components and assumptions, estimated value-add expenditures, estimated proceeds from dispositions, debt payments, dispositions, outstanding debt and shares outstanding, guidance for the first quarter 2024 and the related assumptions, planned value-add programs, including projected average rehab costs, rent change and return on investment, expected settlement of interest rate swaps and the effect on the debt maturity schedule, rehab budgets, and expected acquisitions and dispositions, related timing, expected sales prices, estimated investment returns and net cash proceeds. They are not guarantees of future results and are subject to risks, uncertainties and assumptions that could cause actual results to differ materially from those expressed in any forward-looking statement, including those described in greater detail in our filings with the Securities and Exchange Commission, particularly those described in our Annual Report on Form 10-K. Readers should not place undue reliance on any forward-looking statements and are encouraged to review the Company’s most recent Annual Report on Form 10-K and other filings with the SEC for a more complete discussion of the risks and other factors that could affect any forward-looking statements. The statements made herein speak only as of the date of this release and except as required by law, NXRT does not undertake any obligation to publicly update or revise any forward-looking statements.
| NXRT.NEXPOINT.COM | Page 3 |
NEXPOINT RESIDENTIAL TRUST, INC. [NYSE:NXRT]
NEXPOINT RESIDENTIAL TRUST, INC: FOURTH QUARTER & FULL YEAR 2023 OVERVIEW
|
Company Profile |
| (share counts in thousands) | ||
| Exchange/Ticker |
NYSE: NXRT | |
| Share Price (1) |
$31.08 | |
| Insider Ownership (2) |
13.49% | |
| 2024 Q1 Dividend Per Share |
$0.46242 | |
| Dividend Yield (1) |
5.95% | |
| Shares outstanding - basic (3) |
25,654 | |
| Shares outstanding - diluted (3) |
26,245 |
| (1) | As of the close of market trading on February 16, 2024. |
| (2) | As of the close of market trading on December 29, 2023. |
| (3) | Weighted average for the year ended December 31, 2023. |
|
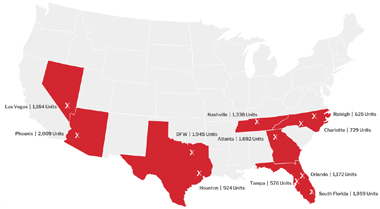
Portfolio Composition by Market |
| Market |
% of Units | |
| Phoenix |
14.2% | |
| South Florida |
13.9% | |
| Dallas/Fort Worth |
13.8% | |
| Atlanta |
12.0% | |
| Nashville |
9.5% | |
| Orlando |
8.3% | |
| Las Vegas |
8.2% | |
| Houston |
6.4% | |
| Charlotte |
5.2% | |
| Raleigh |
4.4% | |
| Tampa |
4.1% | |
|
| ||
| Total |
100.0% | |
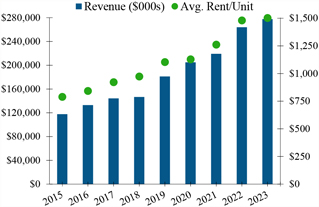
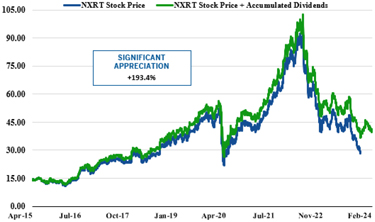
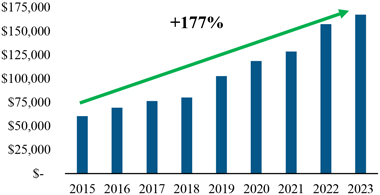
| Revenue & Average Rent Per Unit | Stock Price Performance (Since Inception; 4/1/2015) |
|
| |||
| NXRT.NEXPOINT.COM | Page 4 |
NEXPOINT RESIDENTIAL TRUST, INC. [NYSE:NXRT]
Highlights of Fourth Quarter and Full Year 2023 Activity
COMPLETED DISPOSITIONS
| Property Name |
Location |
Date of Sale |
Sales Price |
IRR | Multiple on Invested Capital |
Net Cash Proceeds (1) |
||||||||||||||
| Silverbrook |
Grand Prairie, TX | September 22, 2023 | $ | 70,000 | 34.0% | 6.14x | $ | 21,499 | ||||||||||||
| Timber Creek |
Charlotte, NC | December 13, 2023 | 49,000 | 25.8% | 4.45x | 24,007 | ||||||||||||||
|
|
|
|
|
|||||||||||||||||
| $ | 119,000 | $ | 45,506 | |||||||||||||||||
|
|
|
|
|
|||||||||||||||||
| (1) | Net Cash Proceeds includes sale prices less debt paydown and closing costs. |
| (*) | 2023 | 2022 | 2021 | 2020 | 2019 | 2018 | 2017 | 2016 | 2015 | |||||||||||||||||||||||||||
| Net income (loss) |
$ | 44,433 | $ | (9,291 | ) | $ | 23,106 | $ | 44,150 | $ | 99,438 | $ | (1,614 | ) | $ | 56,359 | $ | 25,888 | $ | (10,992 | ) | |||||||||||||||
NOI GROWTH*
DIVIDEND GROWTH
SAME STORE GROWTH
2021 to 2023
| 2023 vs 2021 | 2023 vs 2021 | |||||||||||||||||||
| FY 2023 | FY 2022 | FY 2021 | $ Change | % Change | ||||||||||||||||
| Same Store Ending Occupancy |
94.7 | % | 94.1 | % | 94.3 | % | 0.4 | % | ||||||||||||
| Same Store Average Rent per Unit |
$ | 1,520 | $ | 1,520 | $ | 1,288 | $ | 232 | 18.0 | % | ||||||||||
| Same Store Revenues |
||||||||||||||||||||
| Same Store Rental Income |
$ | 207,034 | $ | 193,060 | $ | 167,971 | $ | 39,063 | 23.3 | % | ||||||||||
| Same Store Other Income |
5,278 | 5,017 | 5,033 | 245 | 4.9 | % | ||||||||||||||
|
|
|
|
|
|
|
|
|
|
|
|||||||||||
| Total Same Store Revenues |
$ | 212,312 | $ | 198,077 | $ | 173,004 | $ | 39,308 | 22.7 | % | ||||||||||
|
|
|
|
|
|
|
|
|
|
|
|||||||||||
| Total Same Store Operating Expenses |
$ | 82,607 | $ | 78,682 | $ | 70,862 | $ | 11,745 | 16.6 | % | ||||||||||
| Same Store Operating Income |
||||||||||||||||||||
| Miscellaneous income |
$ | 886 | $ | 340 | $ | 321 | 565 | 176.0 | % | |||||||||||
|
|
|
|
|
|
|
|
|
|
|
|||||||||||
| Total Same Store Operating Income |
$ | 886 | $ | 340 | $ | 321 | $ | 565 | 176.0 | % | ||||||||||
|
|
|
|
|
|
|
|
|
|
|
|||||||||||
| 2021-2023 Same Store NOI |
$ | 130,591 | $ | 119,735 | $ | 102,463 | $ | 28,128 | 27.5 | % | ||||||||||
|
|
|
|
|
|
|
|
|
|
|
|||||||||||
| NXRT.NEXPOINT.COM | Page 5 |
NEXPOINT RESIDENTIAL TRUST, INC. [NYSE:NXRT]
DISPOSITIONS IN PROCESS (1)
| Property Name |
Location |
Date of Sale |
Sales Price |
IRR | Multiple on Invested Capital |
Net Cash Proceeds (2) |
||||||||||||||
| Old Farm |
Houston, TX | Q1 2024 Expected | $ | 103,000 | 21.9% | 2.92x | $ | 48,000 | ||||||||||||
| Radbourne Lake |
Charlotte, NC | Q2 2024 Expected | 39,250 | 19.2% | 3.60x | 18,100 | ||||||||||||||
|
|
|
|
|
|||||||||||||||||
| $ | 142,250 | $ | 66,100 | |||||||||||||||||
|
|
|
|
|
|||||||||||||||||
| (1) | The Old Farm and Radbourne Lake assets are both under contract for sale with material earnest money deposits. We expect to execute on these dispositions in the first half of 2024. Investment returns are estimated above and subject to change until the sales are finalized. |
| (2) | Net Cash Proceeds includes sale prices less debt paydown and closing costs. |
UPDATES TO CAPITAL STRUCTURE
|
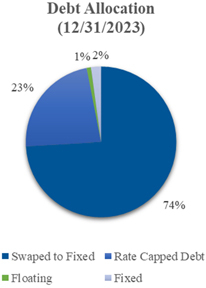
Current Debt Allocation |
|
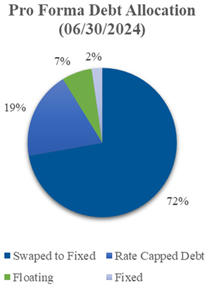
Pro Forma Debt Allocation |
| |||||||||
| As of: |
12/31/2023 | As of: | 6/30/2024 | |||||||||
| Property Level Debt |
1,551,235,411 | Property Level Debt(2) | 1,478,648,432 | |||||||||
| Corporate Facility |
24,000,000 | Corporate Facility(3) | — | |||||||||
| Total Debt |
1,575,235,411 | Pro Forma Total Debt | 1,478,648,432 | |||||||||
| Swapped to Fixed |
1,167,500,000 | Swapped to Fixed | 1,067,500,000 | |||||||||
| Rate Capped Debt |
359,610,432 | Rate Capped Debt | 280,623,432 | |||||||||
| Fixed Debt |
33,817,000 | Fixed Debt | 33,817,000 | |||||||||
| Total Fixed |
1,560,927,432 | Total Fixed | 1,381,940,432 | |||||||||
| % of Portfolio Fixed |
99 | % | % of Portfolio Fixed | 93 | % | |||||||
|
|
|
| |||||||||
| (1) | Pro forma property level debt assumes the Old Farm and Radbourne Lake mortgage notes are retired at the sale of those assets, reducing property level debt by $72.9 million by June 30, 2024. |
| (2) | The Corporate Facility debt is expected to be retired using $24 million of net sales proceeds from the Old Farm sale, which is expected to close in the first quarter of 2024. |
| NXRT.NEXPOINT.COM | Page 6 |
NEXPOINT RESIDENTIAL TRUST, INC. [NYSE:NXRT]
FORECASTED SUBMARKET DELIVERIES (1)
| Market | Submarket (RealPage) | Property | NXRT Unit Exposure |
2023 Q3 Inventory |
Units Under Construction Completing in the Next Four Quarters |
2023 Deliveries |
2024 Deliveries |
2025 Deliveries |
2026 Deliveries |
3-year Deliveries |
3-year % Growth |
|||||||||||||||||||||||||||||
|
ATL |
Southeast Marietta | Rockledge | 708 | 14,110 | 0 | 0 | 0 | 0 | 0 | 0 | 0.0 | % | ||||||||||||||||||||||||||||
|
ATL |
Southeast Marietta | The Preserve at Terrell Mill | 752 | 14,110 | 0 | 0 | 0 | 0 | 0 | 0 | 0.0 | % | ||||||||||||||||||||||||||||
|
ATL |
Sandy Springs | The Adair | 232 | 20,205 | 286 | 0 | 286 | 0 | 0 | 286 | 1.4 | % | ||||||||||||||||||||||||||||
|
CHA |
Huntersville/Cornelius | The Verandas at Lake Norman | 264 | 7,779 | 1,070 | 216 | 1,070 | 1,147 | 0 | 3,364 | 43.2 | % | ||||||||||||||||||||||||||||
|
CHA |
Matthews/Southeast Charlotte | Creekside at Matthews | 240 | 11,736 | 343 | 416 | 320 | 402 | 0 | 1,124 | 9.6 | % | ||||||||||||||||||||||||||||
|
CHA |
North Charlotte | Radbourne Lake | 225 | 18,992 | 3,885 | 1,624 | 4,385 | 1,249 | 462 | 7,345 | 38.7 | % | ||||||||||||||||||||||||||||
|
DFW |
East Fort Worth | The Venue at 8651 | 333 | 13,057 | 0 | 0 | 0 | 0 | 0 | 0 | 0.0 | % | ||||||||||||||||||||||||||||
|
DFW |
Far North Dallas | Versailles | 388 | 29,558 | 897 | 0 | 897 | 0 | 0 | 897 | 3.0 | % | ||||||||||||||||||||||||||||
|
DFW |
Far North Dallas | Versailles II | 242 | 29,558 | 897 | 0 | 897 | 0 | 0 | 897 | 3.0 | % | ||||||||||||||||||||||||||||
|
DFW |
Hurst/Euless/Bedford | Arbors on Forest Ridge | 210 | 33,890 | 93 | 67 | 93 | 187 | 0 | 467 | 1.4 | % | ||||||||||||||||||||||||||||
|
DFW |
Hurst/Euless/Bedford | Summers Landing | 196 | 33,890 | 93 | 67 | 93 | 187 | 0 | 467 | 1.4 | % | ||||||||||||||||||||||||||||
|
DFW |
Oak Lawn/Park Cities | Atera | 380 | 20,594 | 152 | 117 | 152 | 856 | 503 | 2,367 | 11.5 | % | ||||||||||||||||||||||||||||
|
DFW |
Richardson | Cutters Point | 196 | 19,253 | 711 | 0 | 711 | 384 | 0 | 1,479 | 7.7 | % | ||||||||||||||||||||||||||||
|
HOU |
Westchase | Old Farm | 734 | 29,872 | 165 | 165 | 165 | 56 | 0 | 277 | 0.9 | % | ||||||||||||||||||||||||||||
|
HOU |
Westchase | Stone Creek at Old Farm | 190 | 29,872 | 165 | 165 | 165 | 56 | 0 | 277 | 0.9 | % | ||||||||||||||||||||||||||||
|
LSV |
Northwest Las Vegas | Bella Solara | 320 | 20,590 | 910 | 700 | 910 | 158 | 0 | 1,226 | 6.0 | % | ||||||||||||||||||||||||||||
|
LSV |
Northwest Las Vegas | Bloom | 528 | 20,590 | 910 | 700 | 910 | 158 | 0 | 1,226 | 6.0 | % | ||||||||||||||||||||||||||||
|
LSV |
Southwest Las Vegas | Torreyana | 316 | 19,531 | 2,028 | 937 | 2,083 | 426 | 0 | 2,935 | 15.0 | % | ||||||||||||||||||||||||||||
|
NASH |
East Nashville | Residences at Glenview Reserve | 360 | 14,177 | 706 | 419 | 674 | 651 | 0 | 1,976 | 13.9 | % | ||||||||||||||||||||||||||||
|
NASH |
South Nashville | Arbors of Brentwood | 346 | 17,102 | 623 | 840 | 623 | 116 | 0 | 855 | 5.0 | % | ||||||||||||||||||||||||||||
|
NASH |
South Nashville | Brandywine | 632 | 17,102 | 623 | 840 | 623 | 116 | 0 | 855 | 5.0 | % | ||||||||||||||||||||||||||||
|
ORL |
East Orlando | The Cornerstone | 430 | 21,867 | 725 | 307 | 590 | 279 | 0 | 1,148 | 5.2 | % | ||||||||||||||||||||||||||||
|
ORL |
Northwest Orlando | Residences at West Place | 342 | 16,988 | 659 | 319 | 296 | 820 | 0 | 1,936 | 11.4 | % | ||||||||||||||||||||||||||||
|
ORL |
South Orange County | Sabal Palm at Lake Buena Vista | 400 | 32,163 | 2,626 | 2,467 | 2,328 | 2,237 | 0 | 6,802 | 21.1 | % | ||||||||||||||||||||||||||||
|
PHX |
Chandler | Fairways at San Marcos | 352 | 25,503 | 1,175 | 881 | 979 | 415 | 0 | 1,809 | 7.1 | % | ||||||||||||||||||||||||||||
|
PHX |
North Central Phoenix | Heritage | 204 | 25,941 | 1,334 | 770 | 1,334 | 550 | 0 | 2,434 | 9.4 | % | ||||||||||||||||||||||||||||
|
PHX |
North Central Phoenix | The Venue on Camelback | 415 | 25,941 | 1,334 | 770 | 1,334 | 550 | 0 | 2,434 | 9.4 | % | ||||||||||||||||||||||||||||
|
PHX |
Northeast Phoenix | Bella Vista | 248 | 21,730 | 1,032 | 50 | 912 | 120 | 0 | 1,152 | 5.3 | % | ||||||||||||||||||||||||||||
|
PHX |
South Tempe | Enclave | 204 | 17,726 | 144 | 259 | 144 | 0 | 0 | 144 | 0.8 | % | ||||||||||||||||||||||||||||
|
PHX |
Southwest Mesa | Madera Point | 256 | 18,032 | 143 | 254 | 143 | 65 | 0 | 273 | 1.5 | % | ||||||||||||||||||||||||||||
|
PHX |
West Phoenix | Estates on Maryland | 330 | 15,570 | 0 | 0 | 0 | 0 | 0 | 0 | 0.0 | % | ||||||||||||||||||||||||||||
|
RDU |
Far North Raleigh | Six Forks Station | 323 | 12,224 | 983 | 1,414 | 948 | 0 | 0 | 948 | 7.8 | % | ||||||||||||||||||||||||||||
|
RDU |
North Cary/Morrisville | High House at Cary | 302 | 20,895 | 2,095 | 767 | 2,237 | 133 | 0 | 2,503 | 12.0 | % | ||||||||||||||||||||||||||||
|
SFL |
Pembroke Pines/Miramar | Avant at Pembroke Pines | 1,520 | 25,903 | 561 | 398 | 893 | 0 | 0 | 893 | 3.4 | % | ||||||||||||||||||||||||||||
|
SFL |
West Palm Beach | Parc500 | 217 | 32,232 | 2,060 | 1,282 | 1,933 | 0 | 0 | 1,933 | 6.0 | % | ||||||||||||||||||||||||||||
|
SFL |
West Palm Beach | Seasons 704 | 222 | 32,232 | 2,060 | 1,282 | 1,933 | 0 | 0 | 1,933 | 6.0 | % | ||||||||||||||||||||||||||||
|
TPA |
Egypt Lake/Lowry Park | Courtney Cove | 324 | 12,846 | 0 | 0 | 0 | 245 | 0 | 490 | 3.8 | % | ||||||||||||||||||||||||||||
|
TPA |
Temple Terrace | The Summit at Sabal Park | 252 | 16,002 | 0 | 0 | 0 | 0 | 0 | 0 | 0.0 | % | ||||||||||||||||||||||||||||
|
Totals/Averages |
Total | 14,133 | 606,068 | 25,406 | 14,669 | 25,106 | 10,496 | 965 | 47,063 | 7.8 | % | |||||||||||||||||||||||||||||
| (1) | Source: 2023 RealPage, Inc.; Data as of January 2024. |
| NXRT.NEXPOINT.COM | Page 7 |
NEXPOINT RESIDENTIAL TRUST, INC. [NYSE:NXRT]
Financial Summary
| FY 2023 | FY 2022 | FY 2021 | Q4 2023 | Q4 2022 | ||||||||||||||||
| (in thousands, except for per share and unit data) |
||||||||||||||||||||
| Company Profile |
||||||||||||||||||||
| Market Capitalization |
$ | 884,000 | $ | 1,112,000 | $ | 2,138,000 | ||||||||||||||
| Share Price (as of the last day of the period) |
$ | 34.43 | $ | 43.52 | $ | 83.83 | ||||||||||||||
| Weighted average common shares outstanding - basic |
25,654 | 25,610 | 25,170 | 25,674 | 25,549 | |||||||||||||||
| Weighted average common shares outstanding - diluted |
26,245 | 25,610 | 25,760 | 26,298 | 26,077 | |||||||||||||||
| Earnings Profile |
||||||||||||||||||||
| Total revenues |
$ | 277,526 | $ | 263,952 | $ | 219,240 | $ | 68,892 | $ | 69,349 | ||||||||||
| Net income (loss) attributable to common stockholders |
44,264 | (9,260 | ) | 23,037 | 18,351 | 3,787 | ||||||||||||||
| NOI (1) |
167,404 | 157,424 | 128,647 | 42,162 | 41,777 | |||||||||||||||
| Same Store NOI (2) |
144,999 | 134,020 | 39,060 | 37,392 | ||||||||||||||||
| Same Store NOI Growth (%) (2) |
8.2 | % | 4.5 | % | ||||||||||||||||
| Earnings Metrics Per Common Share (diluted basis) |
||||||||||||||||||||
| Earnings (loss) |
$ | 1.69 | $ | (0.36 | ) | $ | 0.89 | $ | 0.70 | $ | 0.15 | |||||||||
| FFO (1) |
$ | 2.72 | $ | 2.81 | $ | 2.47 | $ | 0.68 | $ | 0.47 | ||||||||||
| Core FFO (1) |
$ | 2.80 | $ | 3.13 | $ | 2.43 | $ | 0.66 | $ | 0.75 | ||||||||||
| AFFO (1) |
$ | 3.22 | $ | 3.49 | $ | 2.76 | $ | 0.77 | $ | 0.84 | ||||||||||
| Dividends declared per common share |
$ | 1.722 | $ | 1.56 | $ | 1.404 | $ | 0.462 | $ | 0.42 | ||||||||||
| Net Income (Loss) Coverage |
0.98x | -0.23x | 0.63x | 1.51x | 0.36x | |||||||||||||||
| FFO Coverage (3) |
1.58x | 1.80x | 1.76x | 1.46x | 1.12x | |||||||||||||||
| Core FFO Coverage (3) |
1.63x | 2.01x | 1.73x | 1.43x | 1.78x | |||||||||||||||
| AFFO Coverage (3) |
1.87x | 2.24x | 1.96x | 1.66x | 2.01x | |||||||||||||||
| Portfolio |
||||||||||||||||||||
| Total Properties |
38 | 40 | 39 | |||||||||||||||||
| Total Units (4) |
14,133 | 15,127 | 14,825 | |||||||||||||||||
| Occupancy |
94.7 | % | 94.1 | % | 94.3 | % | ||||||||||||||
| Average Effective Monthly Rent per Unit |
$ | 1,502 | $ | 1,480 | $ | 1,261 | ||||||||||||||
| Same Store Portfolio Metrics (2) |
||||||||||||||||||||
| Total Same Store Properties |
33 | 33 | 35 | 35 | ||||||||||||||||
| Total Same Store Units |
12,378 | 12,341 | 12,940 | 12,903 | ||||||||||||||||
| Occupancy |
94.7 | % | 94.1 | % | 94.7 | % | 94.1 | % | ||||||||||||
| Average Effective Monthly Rent per Unit |
$ | 1,509 | $ | 1,508 | $ | 1,516 | $ | 1,513 | ||||||||||||
| Value-Add Program |
||||||||||||||||||||
| Completed Full/Partial Interior Rehab Units |
2,073 | 2,409 | 1,264 | 198 | 579 | |||||||||||||||
| Cumulative Completed Rehab Units (5) |
8,534 | |||||||||||||||||||
| Average Increase to Effective Monthly Rent per Unit (Post-Rehab) |
$ | 169 | ||||||||||||||||||
| ROI on Post-Rehab Units |
20.9 | % | ||||||||||||||||||
| Outstanding Debt Summary |
||||||||||||||||||||
| Total Mortgage Debt |
$ | 1,551,236 | $ | 1,607,028 | $ | 1,281,146 | ||||||||||||||
| Credit Facilities |
24,000 | 74,500 | 280,000 | |||||||||||||||||
|
|
|
|
|
|
|
|||||||||||||||
| Total Debt Outstanding |
$ | 1,575,236 | $ | 1,681,528 | $ | 1,561,146 | ||||||||||||||
|
|
|
|
|
|
|
|||||||||||||||
| Leverage Ratio (Total Debt to Market Capitalization plus Total Debt) |
64 | % | 60 | % | 42 | % | ||||||||||||||
| Leverage Ratio (Net Debt to Enterprise Value) (6) |
64 | % | 60 | % | 41 | % | ||||||||||||||
| (1) | For more information and reconciliations of NOI, FFO, Core FFO and AFFO, see the “FFO, Core FFO and AFFO,” “NOI and Same Store NOI” and “Definitions and Reconciliations of Non-GAAP Measures” sections of this release. |
| (2) | We define “Same Store” properties as properties that were in our Portfolio for the entirety of the periods being compared. Full year results are shown for the 2022-2023 Same Store properties; Q4 results are shown for the Q4 Same Store properties. For additional information regarding our Q4 and 2022-2023 Same Store properties, see the “Q4 Same Store Results” and “2022-2023 Same Store Results” section of this release. |
| (3) | Indicates coverage ratio of Net Income (Loss)/FFO/Core FFO/AFFO per common share (diluted) over dividends declared per common share during the period. The Company uses actual diluted weighted average common shares outstanding when in a dilutive position for FFO, Core FFO and AFFO. |
| (4) | Total units owned is 14,133, however 45 units are currently down due to fires and water damage. |
| (5) | Inclusive of all full and partial interior upgrades completed through December 31, 2023. Cumulative results exclude rehabs completed for properties sold through December 31, 2023. |
| (6) | For more information and a reconciliation of debt to net debt, see the “Definitions and Reconciliations of Non-GAAP Measures” section of this release. |
| NXRT.NEXPOINT.COM | Page 8 |
NEXPOINT RESIDENTIAL TRUST, INC. [NYSE:NXRT]
2024 Full Year Guidance Summary
NXRT is providing initial 2024 guidance ranges for earnings per diluted share, Core FFO per diluted share, Same Store rental income, Same Store total revenue, Same Store total expenses, Same Store NOI, interest expense and its related components and Acquisitions and Dispositions as follows (dollars in millions, except per share amounts):
| Guidance Range (1) | ||||||||||||
| Low-End | Mid-Point | High-End | ||||||||||
| Earnings per diluted share (2) |
$ | 0.59 | $ | 0.72 | $ | 0.85 | ||||||
| Core FFO per diluted share (2) (3) |
$ | 2.60 | $ | 2.72 | $ | 2.85 | ||||||
| Same Store Growth: (4) |
||||||||||||
| Rental Income |
1.4 | % | 2.3 | % | 3.2 | % | ||||||
| Total Revenue |
1.1 | % | 2.0 | % | 2.9 | % | ||||||
| Total Expenses (5) |
6.0 | % | 5.1 | % | 4.3 | % | ||||||
| Same Store NOI (3) |
-2.0 | % | 0.0 | % | 2.0 | % | ||||||
| Components to Interest Expense: |
||||||||||||
| Interest Expense on Mortgage Debt |
$ | (98.9 | ) | $ | (99.8 | ) | $ | (100.7 | ) | |||
| Interest Expense on Revolver |
(1.1 | ) | (1.1 | ) | (1.1 | ) | ||||||
| Deferred Financing Cost & Discount Amortization |
(2.4 | ) | (2.4 | ) | (2.4 | ) | ||||||
| Interest Rate Swap Settlement |
45.0 | 45.7 | 46.3 | |||||||||
| Mark to Market – Fair Value of Rate Caps |
0.2 | 0.5 | 0.9 | |||||||||
|
|
|
|
|
|
|
|||||||
| Total Interest Expense |
$ | (57.2 | ) | $ | (57.1 | ) | $ | (57.0 | ) | |||
|
|
|
|
|
|
|
|||||||
| Other Considerations: (5) |
||||||||||||
| Acquisitions |
$ | — | $ | 100.0 | $ | 200.0 | ||||||
| Dispositions |
$ | 150.0 | $ | 225.0 | $ | 300.0 | ||||||
| (1) | Full Year 2024 guidance forecast includes Same Store growth projections presented above, which takes into effect the sale of the held for sale properties of Old Farm, Stone Creek at Old Farm and Radbourne Lake, thereby removing those assets from the Full Year 2024 Same Store pool. |
| (2) | Weighted average diluted share count estimate for full year 2024 is approximately 25.6 million. |
| (3) | Same Store NOI and Core FFO are non-GAAP measures. For reconciliations of Full Year 2024 Same Store NOI and Core FFO guidance to net income guidance, and a discussion of why we consider these non-GAAP measures useful, see the “Definitions and Reconciliations of Non-GAAP Measures” section of this release. |
| (4) | Year-over-year growth for the Full Year 2024 pro forma Same Store pool (35 properties). |
| (5) | We continue to evaluate our Portfolio for capital recycling opportunities. Transaction volumes presented are incorporated into the earnings per share and Core FFO guidance above. Actual acquisitions and dispositions could vary significantly from our projections. We undertake no duty to update these assumptions, except as required by law. |
Additional information on 2024 financial and earnings guidance is included in the following sections of this release.
| NXRT.NEXPOINT.COM | Page 9 |
NEXPOINT RESIDENTIAL TRUST, INC. [NYSE:NXRT]
Components of Net Asset Value
(dollar and share amounts in thousands, except per share and per unit data)
| REAL ESTATE VALUE BY MARKET | NAV SUMMARY |
| Property | NOI | Cap Rate Range (1) |
Value Range (2) | Component |
Min |
Max | ||||||||||||||||||
| Market | Contribution | Min | Max | Min | Max | Tangible Assets | ||||||||||||||||||
|
|
|
|
|
|
||||||||||||||||||||
| Texas |
Real Estate (2) | $ 2,556,591 | $ 2,903,972 | |||||||||||||||||||||
|
Dallas/Fort Worth |
10.8% | 5.5% | 6.0% | $ | 277,130 | $ | 314,785 | Cash | 12,367 | |||||||||||||||
| Houston |
1.0% | 5.5% | 6.0% | $ | 25,002 | $ | 28,399 | Restricted Cash - Renovation Reserves (4) | 2,929 | |||||||||||||||
| Renovation Expenditures (4) | (2,929) | |||||||||||||||||||||||
| North Carolina |
Cash Adjustments (5) | (292) | ||||||||||||||||||||||
| Raleigh |
4.2% | 5.5% | 6.0% | 107,558 | 122,173 | Fair Market Value of Interest Rate Swaps | 71,028 | |||||||||||||||||
| Charlotte |
3.8% | 5.5% | 6.0% | 96,899 | 110,065 | Other Assets | 53,221 | |||||||||||||||||
| Old Farm & Radbourne Lake Gross Sales Proceeds (6) | 142,250 | |||||||||||||||||||||||
|
|
| |||||||||||||||||||||||
| Value of Assets | $ 2,835,165 | $ 3,182,546 | ||||||||||||||||||||||
|
|
|
| ||||||||||||||||||||||
| Georgia |
||||||||||||||||||||||||
| Atlanta |
12.1% | 5.5% | 6.0% | 309,952 | 352,067 | Tangible Liabilities | ||||||||||||||||||
| Credit Facility (7) | $24,000 | |||||||||||||||||||||||
| Tennessee |
Mortgage Debt | 1,551,236 | ||||||||||||||||||||||
| Nashville |
9.5% | 5.5% | 6.0% | 242,166 | 275,071 | Total Outstanding Debt | 1,575,236 | |||||||||||||||||
| Forward 12-month Principal Payments (5) | (292) | |||||||||||||||||||||||
| Florida |
Total Outstanding Debt (FY 2024 Est.) | 1,574,944 | ||||||||||||||||||||||
| Orlando |
8.8% | 5.5% | 6.0% | 225,056 | 255,636 | Other Tangible Liabilities (at Book) | 42,701 | |||||||||||||||||
|
|
| |||||||||||||||||||||||
| Tampa |
3.8% | 5.5% | 6.0% | 95,952 | 108,990 | Value of Liabilities | $1,617,645 | |||||||||||||||||
|
|
| |||||||||||||||||||||||
| South Florida |
20.2% | 5.5% | 6.0% | 517,553 | 587,876 | Net Leverage (mid-point) | 54% | |||||||||||||||||
|
|
| |||||||||||||||||||||||
| Net Asset Value | $ 1,217,520 | $ 1,564,901 | ||||||||||||||||||||||
|
|
| |||||||||||||||||||||||
| Nevada |
Shares outstanding - diluted (FY 2024 Est.) | 25,559 | ||||||||||||||||||||||
|
|
| |||||||||||||||||||||||
| Las Vegas |
8.5% | 5.5% | 6.0% | 217,453 | 247,000 | Est. NAV / Share | $ 47.64 | $ 61.23 | ||||||||||||||||
|
|
| |||||||||||||||||||||||
| NAV / Share (mid-point) | $54.43 | |||||||||||||||||||||||
| Arizona |
||||||||||||||||||||||||
| Phoenix |
17.3% | 5.5% | 6.0% | 441,870 | 501,910 | |||||||||||||||||||
|
|
|
|
||||||||||||||||||||||
| Total / Ave |
100.0% | 5.5% | 6.0% | $ | 2,556,591 | $ | 2,903,972 | |||||||||||||||||
|
|
|
|
||||||||||||||||||||||
| NOI ESTIMATE | IMPLIED VALUATION METRICS |
|
|
||||||||||||||
| 4Q 2023 NOI Actual |
42,162 | Min | Max | |||||||||||
|
|
| |||||||||||||
| FY 2023 NOI Actual |
167,404 | Implied Real Estate Value | $2,556,591 | $2,903,972 | ||||||||||
|
|
|
| ||||||||||||
| No. of Units (December 31, 2023) (2) |
14,133 | |||||||||||||
|
|
|
| ||||||||||||
| Low | High | Implied Value/Apartment Unit | $ 180.9 | $ 205.5 | ||||||||||
|
|
|
|
|
|
| |||||||||
|
Estimated 1Q 2024 NOI Guidance (3) |
39,920 | 40,802 |
Implied Value/Apartment Unit (mid-point) |
$193.2 | ||||||||||
|
|
|
|
||||||||||||
| 2024 NOI Guidance (3) |
$ 153,395 | $ 159,718 | ||||||||||||
|
|
|
|
||||||||||||
| (1) | Management estimates based on independent third-party review of our properties. |
| (2) | Estimated value ranges are presented for the existing portfolio (38 properties at December 31, 2023). |
| (3) | The Company anticipates net income will be in the range between approximately $15.2 million and $21.8 million for the full year 2024 and between $21.8 million and $23.1 million for the first quarter of 2024. FY 2024 NOI Guidance considers the forecasted dispositions of Old Farm and Radbourne Lake, and considers a commensurate volume of capital recycling. |
| (4) | Includes approximately $2.9 million that is held for value-add upgrades; reduced by $2.9 million for estimated 2024 rehab expenditures. |
| (5) | Includes approximately $0.3 million in forward 12-month principal payments. |
| (6) | Old Farm and Radbourne Lake are under binding sales contracts and expected to close in the first half of the year. |
| (7) | Includes outstanding balance as of December 31, 2023. |
| NXRT.NEXPOINT.COM | Page 10 |
NEXPOINT RESIDENTIAL TRUST, INC. [NYSE:NXRT]
NEXPOINT RESIDENTIAL TRUST, INC. AND SUBSIDIARIES
CONSOLIDATED BALANCE SHEETS
(in thousands, except share and per share amounts)
| December 31, 2023 | December 31, 2022 | |||||||
| ASSETS |
||||||||
| Operating Real Estate Investments |
||||||||
| Land |
$ | 359,819 | $ | 378,438 | ||||
| Buildings and improvements |
1,719,864 | 1,760,782 | ||||||
| Construction in progress |
8,322 | 10,622 | ||||||
| Furniture, fixtures, and equipment |
180,435 | 152,529 | ||||||
|
|
|
|
|
|||||
| Total Gross Operating Real Estate Investments |
2,268,440 | 2,302,371 | ||||||
| Accumulated depreciation and amortization |
(411,087 | ) | (349,276 | ) | ||||
|
|
|
|
|
|||||
| Total Net Operating Real Estate Investments |
1,857,353 | 1,953,095 | ||||||
| Real estate held for sale, net of accumulated depreciation of $31,871 and $22,017, respectively |
110,747 | 89,457 | ||||||
|
|
|
|
|
|||||
| Total Net Real Estate Investments |
1,968,100 | 2,042,552 | ||||||
| Cash and cash equivalents |
12,367 | 16,762 | ||||||
| Restricted cash |
32,912 | 35,037 | ||||||
| Accounts receivable, net |
14,598 | 17,121 | ||||||
| Prepaid and other assets |
8,640 | 10,425 | ||||||
| Fair market value of interest rate swaps |
71,028 | 103,440 | ||||||
|
|
|
|
|
|||||
| TOTAL ASSETS |
$ | 2,107,645 | $ | 2,225,337 | ||||
|
|
|
|
|
|||||
| LIABILITIES AND STOCKHOLDERS’ EQUITY |
||||||||
| Liabilities: |
||||||||
| Mortgages payable, net |
$ | 1,453,787 | $ | 1,526,828 | ||||
| Mortgages payable held for sale, net |
88,044 | 68,016 | ||||||
| Credit facility, net |
23,243 | 72,644 | ||||||
| Accounts payable and other accrued liabilities |
17,140 | 12,325 | ||||||
| Accrued real estate taxes payable |
11,230 | 7,232 | ||||||
| Accrued interest payable |
9,399 | 7,946 | ||||||
| Security deposit liability |
3,159 | 3,200 | ||||||
| Prepaid rents |
1,773 | 1,849 | ||||||
|
|
|
|
|
|||||
| Total Liabilities |
$ | 1,607,775 | $ | 1,700,040 | ||||
|
|
|
|
|
|||||
| Redeemable noncontrolling interests in the Operating Partnership |
5,246 | 5,631 | ||||||
| Stockholders’ Equity: |
||||||||
| Preferred stock, $0.01 par value: 100,000,000 shares authorized; 0 shares issued |
— | — | ||||||
| Common stock, $0.01 par value: 500,000,000 shares authorized; 25,674,313 and 25,549,319 shares issued and outstanding, respectively |
256 | 255 | ||||||
| Additional paid-in capital |
413,010 | 405,376 | ||||||
| Accumulated earnings less dividends |
11,493 | 11,880 | ||||||
| Accumulated other comprehensive income |
69,865 | 102,155 | ||||||
|
|
|
|
|
|||||
| Total Stockholders’ Equity |
494,624 | 519,666 | ||||||
|
|
|
|
|
|||||
| TOTAL LIABILITIES AND STOCKHOLDERS’ EQUITY |
$ | 2,107,645 | $ | 2,225,337 | ||||
|
|
|
|
|
|||||
| NXRT.NEXPOINT.COM | Page 11 |
NEXPOINT RESIDENTIAL TRUST, INC. [NYSE:NXRT]
NEXPOINT RESIDENTIAL TRUST, INC. AND SUBSIDIARIES
CONSOLIDATED STATEMENTS OF OPERATIONS
AND COMPREHENSIVE INCOME
(in thousands, except per share amounts)
(Unaudited)
| For the Year Ended December 31, | ||||||||||||
| 2023 | 2022 | 2021 | ||||||||||
| Revenues |
||||||||||||
| Rental income |
$ | 270,078 | $ | 257,855 | $ | 213,505 | ||||||
| Other income |
7,448 | 6,097 | 5,735 | |||||||||
|
|
|
|
|
|
|
|||||||
| Total revenues |
277,526 | 263,952 | 219,240 | |||||||||
|
|
|
|
|
|
|
|||||||
| Expenses |
||||||||||||
| Property operating expenses |
57,838 | 58,151 | 47,739 | |||||||||
| Real estate taxes and insurance |
36,847 | 37,433 | 33,152 | |||||||||
| Property management fees (1) |
8,069 | 7,636 | 6,334 | |||||||||
| Advisory and administrative fees (2) |
7,645 | 7,547 | 7,631 | |||||||||
| Corporate general and administrative expenses |
17,146 | 14,670 | 11,966 | |||||||||
| Property general and administrative expenses |
9,543 | 9,298 | 7,332 | |||||||||
| Depreciation and amortization |
95,186 | 97,648 | 86,878 | |||||||||
|
|
|
|
|
|
|
|||||||
| Total expenses |
232,274 | 232,383 | 201,032 | |||||||||
|
|
|
|
|
|
|
|||||||
| Operating income before gain on sales of real estate |
45,252 | 31,569 | 18,208 | |||||||||
| Gain on sales of real estate |
67,926 | 14,684 | 46,214 | |||||||||
|
|
|
|
|
|
|
|||||||
| Operating income |
113,178 | 46,253 | 64,422 | |||||||||
| Interest expense |
(67,106 | ) | (50,587 | ) | (44,623 | ) | ||||||
| Loss on extinguishment of debt and modification costs |
(2,409 | ) | (8,734 | ) | (912 | ) | ||||||
| Casualty gain (loss) |
(856 | ) | 2,506 | 2,595 | ||||||||
| Gain on forfeited deposits |
250 | — | — | |||||||||
| Equity in earnings of affiliate |
205 | — | — | |||||||||
| Miscellaneous income |
1,171 | 1,271 | 1,624 | |||||||||
|
|
|
|
|
|
|
|||||||
| Net income (loss) |
44,433 | (9,291 | ) | 23,106 | ||||||||
| Net income (loss) attributable to redeemable noncontrolling interests in the Operating Partnership | 169 | (31 | ) | 69 | ||||||||
|
|
|
|
|
|
|
|||||||
| Net income (loss) attributable to common stockholders |
$ | 44,264 | $ | (9,260 | ) | $ | 23,037 | |||||
|
|
|
|
|
|
|
|||||||
| Other comprehensive income (loss) |
||||||||||||
| Unrealized gains (losses) on interest rate derivatives |
(32,413 | ) | 99,915 | 47,073 | ||||||||
|
|
|
|
|
|
|
|||||||
| Total comprehensive income |
12,020 | 90,624 | 70,179 | |||||||||
| Comprehensive income attributable to redeemable noncontrolling interests in the Operating Partnership | 46 | 307 | 210 | |||||||||
|
|
|
|
|
|
|
|||||||
| Comprehensive income attributable to common stockholders |
$ | 11,974 | $ | 90,317 | $ | 69,969 | ||||||
|
|
|
|
|
|
|
|||||||
| Weighted average common shares outstanding - basic |
25,654 | 25,610 | 25,170 | |||||||||
|
|
|
|
|
|
|
|||||||
| Weighted average common shares outstanding - diluted |
26,245 | 25,610 | 25,760 | |||||||||
|
|
|
|
|
|
|
|||||||
| Earnings (loss) per share - basic |
$ | 1.73 | $ | (0.36 | ) | $ | 0.92 | |||||
|
|
|
|
|
|
|
|||||||
| Earnings (loss) per share - diluted |
$ | 1.69 | $ | (0.36 | ) | $ | 0.89 | |||||
|
|
|
|
|
|
|
|||||||
| (1) | Fees incurred to an unaffiliated third party that is an affiliate of a noncontrolling limited partner of the Operating Partnership (the “OP”). |
| (2) | Fees incurred to the Company’s adviser. |
| NXRT.NEXPOINT.COM | Page 12 |
NEXPOINT RESIDENTIAL TRUST, INC. [NYSE:NXRT]
NOI and Same Store NOI
The following table, which has not been adjusted for the effects of noncontrolling interests, reconciles NOI and our 2022-2023 and our Q4 Same Store NOI for the years and three months ended December 31, 2023 and 2022 to net income (loss), the most directly comparable GAAP financial measure (in thousands):
| For the Year Ended December 31, |
For the Three Months Ended December 31, |
|||||||||||||||||||
| 2023 | 2022 | 2023 | 2022 | |||||||||||||||||
| Net income (loss) |
$ | 44,433 | $ | (9,291 | ) | $ | 18,421 | $ | 3,802 | |||||||||||
| Adjustments to reconcile net income (loss) to NOI |
||||||||||||||||||||
| Advisory and administrative fees |
7,645 | 7,547 | 1,863 | 1,932 | ||||||||||||||||
| Corporate general and administrative expenses |
16,663 | 14,670 | 3,920 | 3,554 | ||||||||||||||||
| Casualty-related expenses/(recoveries) |
(1) | (2,214 | ) | 1,119 | (882 | ) | 456 | |||||||||||||
| Casualty losses (gains) |
856 | (2,506 | ) | (124 | ) | (2,149 | ) | |||||||||||||
| Gain on forfeited deposits |
(250 | ) | — | — | — | |||||||||||||||
| Property general and administrative expenses |
(2) | 3,701 | 3,600 | 1,005 | 1,191 | |||||||||||||||
| Depreciation and amortization |
95,186 | 97,648 | 24,251 | 23,158 | ||||||||||||||||
| Interest expense |
67,106 | 50,587 | 18,256 | 15,783 | ||||||||||||||||
| Equity in earnings of affiliate |
(205 | ) | — | (28 | ) | — | ||||||||||||||
| Loss on extinguishment of debt and modification costs |
2,409 | 8,734 | 316 | 8,734 | ||||||||||||||||
| Gain on sales of real estate |
(67,926 | ) | (14,684 | ) | (24,836 | ) | (14,684 | ) | ||||||||||||
|
|
|
|
|
|
|
|
|
|||||||||||||
| NOI |
$ | 167,404 | $ | 157,424 | $ | 42,162 | $ | 41,777 | ||||||||||||
|
|
|
|
|
|
|
|
|
|||||||||||||
| Less Non-Same Store |
||||||||||||||||||||
| Revenues |
(41,581 | ) | (44,017 | ) | (6,071 | ) | (9,298 | ) | ||||||||||||
| Operating expenses |
19,327 | 21,101 | 2,974 | 5,073 | ||||||||||||||||
| Operating income |
(151 | ) | (488 | ) | (5 | ) | (160 | ) | ||||||||||||
|
|
|
|
|
|
|
|
|
|||||||||||||
| Same Store NOI |
$ | 144,999 | $ | 134,020 | $ | 39,060 | $ | 37,392 | ||||||||||||
|
|
|
|
|
|
|
|
|
|||||||||||||
| (1) | Adjustment to net income (loss) to exclude certain property operating expenses that are casualty-related expenses/(recoveries). |
| (2) | Adjustment to net income (loss) to exclude certain property general and administrative expenses that are not reflective of the continuing operations of the properties or are incurred on our behalf at the property for expenses such as legal, professional, centralized leasing service and franchise tax fees. |
| NXRT.NEXPOINT.COM | Page 13 |
NEXPOINT RESIDENTIAL TRUST, INC. [NYSE:NXRT]
The following table, which has not been adjusted for the effects of noncontrolling interests, reconciles our NOI and our 2021-2023 Same Store NOI for the years ended December 31, 2023, 2022 and 2021 to net income (loss), the most directly comparable GAAP financial measure (in thousands):
| For the Year Ended December 31, | ||||||||||||||||
| 2023 | 2022 | 2021 | ||||||||||||||
| Net income (loss) |
$ | 44,433 | $ | (9,291 | ) | $ | 23,106 | |||||||||
| Adjustments to reconcile net income (loss) to NOI: |
||||||||||||||||
| Advisory and administrative fees |
7,645 | 7,547 | 7,631 | |||||||||||||
| Corporate general and administrative expenses |
16,663 | 14,670 | 11,966 | |||||||||||||
| Casualty-related expenses/(recoveries) |
(1) | (2,214 | ) | 1,119 | (199 | ) | ||||||||||
| Casualty losses (gains) |
856 | (2,506 | ) | (2,595 | ) | |||||||||||
| Gain on forfeited deposits |
(250 | ) | — | — | ||||||||||||
| Property general and administrative expenses |
(2) | 3,701 | 3,600 | 2,539 | ||||||||||||
| Depreciation and amortization |
95,186 | 97,648 | 86,878 | |||||||||||||
| Interest expense |
67,106 | 50,587 | 44,623 | |||||||||||||
| Equity in earnings of affiliate |
(205 | ) | — | — | ||||||||||||
| Loss on extinguishment of debt and modification costs |
2,409 | 8,734 | 912 | |||||||||||||
| Gain on sales of real estate |
(67,926 | ) | (14,684 | ) | (46,214 | ) | ||||||||||
|
|
|
|
|
|
|
|||||||||||
| NOI |
$ | 167,404 | $ | 157,424 | $ | 128,647 | ||||||||||
|
|
|
|
|
|
|
|||||||||||
| Less Non-Same Store |
||||||||||||||||
| Revenues |
(64,731 | ) | (65,875 | ) | (46,236 | ) | ||||||||||
| Operating expenses |
28,203 | 29,116 | 21,355 | |||||||||||||
| Operating income |
(285 | ) | (930 | ) | (1,303 | ) | ||||||||||
|
|
|
|
|
|
|
|||||||||||
| Same Store NOI |
$ | 130,591 | $ | 119,735 | $ | 102,463 | ||||||||||
|
|
|
|
|
|
|
|||||||||||
| (1) | Adjustment to net income (loss) to exclude certain property operating expenses that are casualty-related expenses/(recoveries). |
| (2) | Adjustment to net income (loss) to exclude certain property general and administrative expenses that are not reflective of the continuing operations of the properties or are incurred on our behalf at the property for expenses such as legal, professional, centralized leasing service and franchise tax fees. |
| NXRT.NEXPOINT.COM | Page 14 |
NEXPOINT RESIDENTIAL TRUST, INC. [NYSE:NXRT]
2022-2023 Same Store Results of Operations for the Years Ended December 31, 2023 and 2022
There are 33 properties encompassing 12,378 units of apartment space, or approximately 88% of our Portfolio, in our 2022-2023 Same Store properties. Our 2022-2023 Same Store properties exclude the following 5 properties in our Portfolio as of December 31, 2023: Old Farm, Stone Creek at Old Farm, Radbourne Lake, The Adair, and Estates on Maryland as well as the 44 units mentioned on page 1 that are currently down.
As of December 31, 2023, our 2022-2023 Same Store properties were approximately 94.7% leased with a weighted average monthly effective rent per occupied apartment unit of $1,509, a year-over-year increase of 60 bps and an increase of $1, respectively.
The following table reflects the revenues, property operating expenses and NOI for the years ended December 31, 2023 and 2022 for our 2022-2023 Same Store and Non-Same Store properties (dollars in thousands):
| For the Year Ended December 31, | ||||||||||||||||
| 2023 | 2022 | $ Change | % Change | |||||||||||||
| Revenues |
||||||||||||||||
| Same Store |
||||||||||||||||
| Rental income |
$ | 229,801 | $ | 214,664 | $ | 15,137 | 7.1 | % | ||||||||
| Other income |
5,661 | 5,271 | 390 | 7.4 | % | |||||||||||
|
|
|
|
|
|
|
|
|
|||||||||
| Same Store revenues |
235,462 | 219,935 | 15,527 | 7.1 | % | |||||||||||
| Non-Same Store |
||||||||||||||||
| Rental income |
40,277 | 43,191 | (2,914 | ) | -6.7 | % | ||||||||||
| Other income |
1,304 | 826 | 478 | 57.9 | % | |||||||||||
|
|
|
|
|
|
|
|
|
|||||||||
| Non-Same Store revenues |
41,581 | 44,017 | (2,436 | ) | -5.5 | % | ||||||||||
|
|
|
|
|
|
|
|
|
|||||||||
| Total revenues |
277,043 | 263,952 | 13,091 | 5.0 | % | |||||||||||
|
|
|
|
|
|
|
|
|
|||||||||
| Operating expenses |
||||||||||||||||
| Same Store |
||||||||||||||||
| Property operating expenses (1) |
49,221 | 46,389 | 2,832 | 6.1 | % | |||||||||||
| Real estate taxes and insurance |
30,740 | 29,443 | 1,297 | 4.4 | % | |||||||||||
| Property management fees (2) |
6,820 | 6,333 | 487 | 7.7 | % | |||||||||||
| Property general and administrative expenses (3) |
4,702 | 4,533 | 169 | 3.7 | % | |||||||||||
|
|
|
|
|
|
|
|
|
|||||||||
| Same Store operating expenses |
91,483 | 86,698 | 4,785 | 5.5 | % | |||||||||||
| Non-Same Store |
||||||||||||||||
| Property operating expenses (4) |
10,831 | 10,643 | 188 | 1.8 | % | |||||||||||
| Real estate taxes and insurance |
6,107 | 7,990 | (1,883 | ) | -23.6 | % | ||||||||||
| Property management fees (2) |
1,249 | 1,303 | (54 | ) | -4.1 | % | ||||||||||
| Property general and administrative expenses (5) |
1,140 | 1,165 | (25 | ) | -2.1 | % | ||||||||||
|
|
|
|
|
|
|
|
|
|||||||||
| Non-Same Store operating expenses |
19,327 | 21,101 | (1,774 | ) | -8.4 | % | ||||||||||
|
|
|
|
|
|
|
|
|
|||||||||
| Total operating expenses |
110,810 | 107,799 | 3,011 | 2.8 | % | |||||||||||
|
|
|
|
|
|
|
|
|
|||||||||
| Operating income |
||||||||||||||||
| Same Store |
||||||||||||||||
| Miscellaneous income |
1,020 | 783 | 237 | 30.3 | % | |||||||||||
| Non-Same Store |
||||||||||||||||
| Miscellaneous income |
151 | 488 | (337 | ) | N/M | |||||||||||
|
|
|
|
|
|
|
|
|
|||||||||
| Total operating income |
1,171 | 1,271 | (100 | ) | -7.9 | % | ||||||||||
|
|
|
|
|
|
|
|
|
|||||||||
| NOI |
||||||||||||||||
| Same Store |
144,999 | 134,020 | 10,979 | 8.2 | % | |||||||||||
| Non-Same Store |
22,405 | 23,404 | (999 | ) | -4.3 | % | ||||||||||
|
|
|
|
|
|
|
|
|
|||||||||
| Total NOI (6) |
$ | 167,404 | $ | 157,424 | $ | 9,980 | 6.3 | % | ||||||||
|
|
|
|
|
|
|
|
|
|||||||||
| (1) | For the years ended December 31, 2023 and 2022, excludes approximately $2,268,000 and $614,000, respectively, of casualty-related recoveries. |
| (2) | Fees incurred to an unaffiliated third party that is an affiliate of a noncontrolling limited partner of the OP. |
| NXRT.NEXPOINT.COM | Page 15 |
NEXPOINT RESIDENTIAL TRUST, INC. [NYSE:NXRT]
| (3) | For the years ended December 31, 2023 and 2022, excludes approximately $2,909,000 and $2,914,000, respectively, of expenses that are not reflective of the continuing operations of the properties or are incurred on our behalf at the property for expenses such as legal, professional, centralized leasing service and franchise tax fees. |
| (4) | For the years ended December 31, 2023 and 2022, excludes approximately $54,000 and $(2,136,000), respectively, of casualty-related expenses/(recoveries). |
| (5) | For the years ended December 31, 2023 and 2022, excludes approximately $792,000 and $686,000, respectively, of expenses that are not reflective of the continuing operations of the properties or are incurred on our behalf at the property for expenses such as legal, professional, centralized leasing service and franchise tax fees. |
| (6) | For additional information regarding NOI, see the “Definitions and Reconciliations of Non-GAAP Measures” and “NOI and Same Store NOI” sections of this release. |
The following table contains additional information about our 2022-2023 Same Store properties rent and occupancy metrics, revenues, operating expenses and NOI for the years ended December 31, 2023 and 2022 (dollars in thousands, except for per unit data):
| FY 2023 | FY 2022 | % Change | ||||||||||
| Same Store Total Units |
12,378 | 12,341 | ||||||||||
| Same Store Occupied Units |
11,721 | 11,619 | ||||||||||
| Same Store Ending Occupancy |
94.7 | % | 94.1 | % | 0.6 | % | ||||||
| Same Store Average Rent per Unit |
$ | 1,509 | $ | 1,508 | 0.1 | % | ||||||
| Same Store Revenues |
||||||||||||
| Same Store Rental Income |
$ | 229,801 | $ | 214,664 | 7.1 | % | ||||||
| Same Store Other Income |
5,661 | 5,271 | 7.4 | % | ||||||||
|
|
|
|
|
|
|
|||||||
| Total Same Store Revenues |
235,462 | 219,935 | 7.1 | % | ||||||||
| Same Store Operating Expenses |
||||||||||||
| Payroll |
19,061 | 18,077 | 5.4 | % | ||||||||
| Repairs & Maintenance |
19,704 | 18,359 | 7.3 | % | ||||||||
| Utilities |
10,456 | 9,953 | 5.1 | % | ||||||||
| Real Estate Taxes |
25,249 | 24,225 | 4.2 | % | ||||||||
| Insurance |
5,491 | 5,218 | 5.2 | % | ||||||||
| Property Management Fees |
6,820 | 6,333 | 7.7 | % | ||||||||
| Office Operations |
3,363 | 3,202 | 5.0 | % | ||||||||
| Marketing |
1,339 | 1,331 | 0.6 | % | ||||||||
|
|
|
|
|
|
|
|||||||
| Total Same Store Operating Expenses |
91,483 | 86,698 | 5.5 | % | ||||||||
| Same Store Operating Income |
||||||||||||
| Miscellaneous income |
1,020 | 783 | 30.3 | % | ||||||||
|
|
|
|
|
|
|
|||||||
| Total Same Store Operating Income |
1,020 | 783 | 30.3 | % | ||||||||
|
|
|
|
|
|
|
|||||||
| 2022-2023 Same Store NOI |
$ | 144,999 | $ | 134,020 | 8.2 | % | ||||||
|
|
|
|
|
|
|
|||||||
| NXRT.NEXPOINT.COM | Page 16 |
NEXPOINT RESIDENTIAL TRUST, INC. [NYSE:NXRT]
2022-2023 Same Store Properties Operating Metrics
(dollars in thousands, except for per unit data)
| Properties by Market (1) |
Unit Count | Average Effective Rent | Occupancy | Total Rental Income | ||||||||||||||||||||||||||||||||||||
| Total | 2023 | 2022 | % Change |
2023 | 2022 | bps Δ | 2023 | 2022 | % Change | |||||||||||||||||||||||||||||||
| Texas |
||||||||||||||||||||||||||||||||||||||||
| Dallas |
1,742 | $1,270 | $1,261 | 0.7 | % | 93.1% | 95.0% | -190 | $28,193 | $26,138 | 7.9 | % | ||||||||||||||||||||||||||||
| Average/Total |
1,742 | 1,270 | 1,261 | 0.7 | % | 93.1% | 95.0% | -190 | 28,193 | 26,138 | 7.9 | % | ||||||||||||||||||||||||||||
| North Carolina |
||||||||||||||||||||||||||||||||||||||||
| Charlotte |
324 | 1,327 | 1,395 | -4.9 | % | 95.4% | 94.4% | 100 | 5,395 | 4,919 | 9.7 | % | ||||||||||||||||||||||||||||
| Average/Total |
324 | 1,327 | 1,395 | -4.9 | % | 95.4% | 94.4% | 100 | 5,395 | 4,919 | 9.7 | % | ||||||||||||||||||||||||||||
| Georgia |
||||||||||||||||||||||||||||||||||||||||
| Atlanta |
1,440 | 1,407 | 1,449 | -2.9 | % | 96.1% | 93.8% | 230 | 23,963 | 23,438 | 2.2 | % | ||||||||||||||||||||||||||||
| Average/Total |
1,440 | 1,407 | 1,449 | -2.9 | % | 96.1% | 93.8% | 230 | 23,963 | 23,438 | 2.2 | % | ||||||||||||||||||||||||||||
| Tennessee |
||||||||||||||||||||||||||||||||||||||||
| Nashville |
1,338 | 1,315 | 1,312 | 0.2 | % | 93.7% | 94.9% | -120 | 22,243 | 21,033 | 5.8 | % | ||||||||||||||||||||||||||||
| Average/Total |
1,338 | 1,315 | 1,312 | 0.2 | % | 93.7% | 94.9% | -120 | 22,243 | 21,033 | 5.8 | % | ||||||||||||||||||||||||||||
| Florida |
||||||||||||||||||||||||||||||||||||||||
| Orlando |
1,172 | 1,583 | 1,568 | 1.0 | % | 94.4% | 92.7% | 170 | 22,167 | 20,119 | 10.2 | % | ||||||||||||||||||||||||||||
| Tampa |
448 | 1,452 | 1,461 | -0.6 | % | 94.6% | 93.8% | 80 | 8,052 | 7,479 | 7.7 | % | ||||||||||||||||||||||||||||
| South Florida |
1,959 | 2,087 | 1,997 | 4.5 | % | 95.4% | 95.0% | 40 | 49,431 | 44,421 | 11.3 | % | ||||||||||||||||||||||||||||
| Average/Total |
3,579 | 1,842 | 1,789 | 3.0 | % | 95.0% | 94.1% | 90 | 79,650 | 72,019 | 10.6 | % | ||||||||||||||||||||||||||||
| Arizona |
||||||||||||||||||||||||||||||||||||||||
| Phoenix |
2,800 | 1,457 | 1,458 | -0.1 | % | 95.1% | 94.7% | 40 | 51,450 | 48,581 | 5.9 | % | ||||||||||||||||||||||||||||
| Average/Total |
2,800 | 1,457 | 1,458 | -0.1 | % | 95.1% | 94.7% | 40 | 51,450 | 48,581 | 5.9 | % | ||||||||||||||||||||||||||||
| Nevada |
||||||||||||||||||||||||||||||||||||||||
| Las Vegas |
1,155 | 1,354 | 1,455 | -6.9 | % | 94.5% | 91.1% | 340 | 18,907 | 18,536 | 2.0 | % | ||||||||||||||||||||||||||||
| Average/Total |
1,155 | 1,354 | 1,455 | -6.9 | % | 94.5% | 91.1% | 340 | 18,907 | 18,536 | 2.0 | % | ||||||||||||||||||||||||||||
|
Average/Total |
12,378 | $1,509 | $1,508 | 0.1 | % | 94.7% | 94.1% | 60 | $229,801 | $214,664 | 7.1 | % | ||||||||||||||||||||||||||||
| (1) | This table only includes the 33 properties in our 2022-2023 Same Store pool. |
| NXRT.NEXPOINT.COM | Page 17 |
NEXPOINT RESIDENTIAL TRUST, INC. [NYSE:NXRT]
QoQ Same Store Properties Operating Metrics
(dollars in thousands, except for per unit data)
| Properties by Market (1) |
Unit Count |
Average Effective Rent | Occupancy | Total Rental Income | ||||||||||||||||||||||||||||||||||||
| Total | Q4 2023 | Q3 2023 | % Change |
Q4 2023 | Q3 2023 | bps Δ | Q4 2023 | Q3 2023 | % Change | |||||||||||||||||||||||||||||||
| Texas |
||||||||||||||||||||||||||||||||||||||||
| Dallas |
1,938 | $1,287 | $1,291 | -0.3 | % | 93.1% | 94.6% | -150 | $7,912 | $7,941 | -0.4 | % | ||||||||||||||||||||||||||||
| Average/Total |
1,938 | 1,287 | 1,291 | -0.3 | % | 93.1% | 94.6% | -150 | 7,912 | 7,941 | -0.4 | % | ||||||||||||||||||||||||||||
| North Carolina |
||||||||||||||||||||||||||||||||||||||||
| Charlotte |
504 | 1,391 | 1,406 | -1.1 | % | 95.8% | 93.5% | 230 | 2,291 | 2,179 | 5.1 | % | ||||||||||||||||||||||||||||
| Raleigh Durham |
617 | 1,436 | 1,474 | -2.6 | % | 93.7% | 92.9% | 80 | 2,708 | 2,577 | 5.1 | % | ||||||||||||||||||||||||||||
| Average/Total |
1,121 | 1,416 | 1,443 | -1.9 | % | 94.6% | 93.1% | 150 | 4,999 | 4,756 | 5.1 | % | ||||||||||||||||||||||||||||
| Georgia |
||||||||||||||||||||||||||||||||||||||||
| Atlanta |
1,672 | 1,485 | 1,517 | -2.1 | % | 96.2% | 92.0% | 420 | 7,604 | 7,297 | 4.2 | % | ||||||||||||||||||||||||||||
| Average/Total |
1,672 | 1,485 | 1,517 | -2.1 | % | 96.2% | 92.0% | 420 | 7,604 | 7,297 | 4.2 | % | ||||||||||||||||||||||||||||
| Tennessee |
||||||||||||||||||||||||||||||||||||||||
| Nashville |
|
1,338 | 1,315 | 1,312 | 0.2 | % | 93.7% | 94.6% | -90 | 5,560 | 5,548 | 0.2 | % | |||||||||||||||||||||||||||
| Average/Total |
1,338 | 1,315 | 1,312 | 0.2 | % | 93.7% | 94.6% | -90 | 5,560 | 5,548 | 0.2 | % | ||||||||||||||||||||||||||||
| Florida |
||||||||||||||||||||||||||||||||||||||||
| Orlando |
1,172 | 1,583 | 1,588 | -0.3 | % | 94.4% | 92.7% | 170 | 5,551 | 5,535 | 0.3 | % | ||||||||||||||||||||||||||||
| Tampa |
576 | 1,385 | 1,433 | -3.3 | % | 95.3% | 92.5% | 280 | 2,486 | 2,407 | 3.3 | % | ||||||||||||||||||||||||||||
| South Florida |
1,959 | 2,087 | 2,095 | -0.4 | % | 95.4% | 95.5% | -10 | 12,502 | 12,556 | -0.4 | % | ||||||||||||||||||||||||||||
| Average/Total |
3,707 | 1,819 | 1,832 | -0.7 | % | 95.1% | 94.2% | 90 | 20,539 | 20,498 | 0.2 | % | ||||||||||||||||||||||||||||
| Arizona |
||||||||||||||||||||||||||||||||||||||||
| Phoenix |
2,009 | 1,477 | 1,487 | -0.7 | % | 95.3% | 95.0% | 30 | 9,521 | 9,663 | -1.5 | % | ||||||||||||||||||||||||||||
| Average/Total |
2,009 | 1,477 | 1,487 | -0.7 | % | 95.3% | 95.0% | 30 | 9,521 | 9,663 | -1.5 | % | ||||||||||||||||||||||||||||
| Nevada |
||||||||||||||||||||||||||||||||||||||||
| Las Vegas |
1,155 | 1,354 | 1,368 | -1.0 | % | 94.5% | 93.2% | 130 | 4,948 | 4,570 | 8.3 | % | ||||||||||||||||||||||||||||
| Average/Total |
1,155 | 1,354 | 1,368 | -1.0 | % | 94.5% | 93.2% | 130 | 4,948 | 4,570 | 8.3 | % | ||||||||||||||||||||||||||||
|
Average/Total |
12,940 | $1,516 | $1,529 | -0.9 | % | 94.7% | 93.9% | 80 | $61,083 | $60,273 | 1.3 | % | ||||||||||||||||||||||||||||
| (1) | This table only includes the 35 properties in our Q4 Same Store pool. |
| NXRT.NEXPOINT.COM | Page 18 |
NEXPOINT RESIDENTIAL TRUST, INC. [NYSE:NXRT]
2021-2023 Same Store Results of Operations for the Years Ended December 31, 2023, 2022 and 2021
There are 28 properties encompassing 11,061 units of apartment space, or approximately 78% of our Portfolio, in our same store pool for the years ended December 31, 2023, 2022 and 2021 (our “2021-2023 Same Store” properties). Our 2021-2023 Same Store properties exclude the following 10 properties in our Portfolio as of December 31, 2023: Old Farm, Stone Creek at Old Farm, Radbourne Lake, Cutter’s Point, The Verandas at Lake Norman, Creekside at Matthews, Six Forks Station, High House at Cary, The Adair, and Estates on Maryland as well as the 36 units mentioned on page 1 that are currently down.
As of December 31, 2023, our 2021-2023 Same Store properties were approximately 94.7% leased with a weighted average monthly effective rent per occupied apartment unit of $1,520. As of December 31, 2022, our 2021-2023 Same Store properties were approximately 94.1% leased with a weighted average monthly effective rent per occupied apartment unit of $1,520. As of December 31, 2021, our 2021-2023 Same Store properties were approximately 94.3% leased with a weighted average monthly effective rent per occupied apartment unit of $1,288.
| NXRT.NEXPOINT.COM | Page 19 |
NEXPOINT RESIDENTIAL TRUST, INC. [NYSE:NXRT]
The following table reflects the revenues, property operating expenses and NOI for the years ended December 31, 2023, 2022 and 2021 for our 2021-2023 Same Store and Non-Same Store properties (dollars in thousands):
| For the Year Ended December 31, | 2023 compared to 2022 | 2022 compared to 2021 | ||||||||||||||||||||||||||
| 2023 | 2022 | 2021 | $ Change | % Change | $ Change | % Change | ||||||||||||||||||||||
| Revenues |
||||||||||||||||||||||||||||
| Same Store |
||||||||||||||||||||||||||||
| Rental income |
$ | 207,034 | $ | 193,060 | $ | 167,971 | $ | 13,974 | 7.2 | % | $ | 25,089 | 14.9 | % | ||||||||||||||
| Other income |
5,278 | 5,017 | 5,033 | 261 | 5.2 | % | (16 | ) | -0.3 | % | ||||||||||||||||||
|
|
|
|
|
|
|
|
|
|
|
|
|
|
|
|||||||||||||||
| Same Store revenues |
212,312 | 198,077 | 173,004 | 14,235 | 7.2 | % | 25,073 | 14.5 | % | |||||||||||||||||||
| Non-Same Store |
||||||||||||||||||||||||||||
| Rental income |
63,044 | 64,795 | 45,534 | (1,751 | ) | -2.7 | % | 19,261 | 42.3 | % | ||||||||||||||||||
| Other income |
1,687 | 1,080 | 702 | 607 | 56.2 | % | 378 | 53.8 | % | |||||||||||||||||||
|
|
|
|
|
|
|
|
|
|
|
|
|
|
|
|||||||||||||||
| Non-Same Store revenues |
64,731 | 65,875 | 46,236 | (1,144 | ) | -1.7 | % | 19,639 | 42.5 | % | ||||||||||||||||||
|
|
|
|
|
|
|
|
|
|
|
|
|
|
|
|||||||||||||||
| Total revenues |
277,043 | 263,952 | 219,240 | 13,091 | 5.0 | % | 44,712 | 20.4 | % | |||||||||||||||||||
|
|
|
|
|
|
|
|
|
|
|
|
|
|
|
|||||||||||||||
| Operating expenses |
||||||||||||||||||||||||||||
| Same Store |
||||||||||||||||||||||||||||
| Property operating expenses (1) |
44,358 | 42,015 | 36,848 | 2,343 | 5.6 | % | 5,167 | 14.0 | % | |||||||||||||||||||
| Real estate taxes and insurance |
27,941 | 26,945 | 25,505 | 996 | 3.7 | % | 1,440 | 5.6 | % | |||||||||||||||||||
| Property management fees (2) |
6,151 | 5,705 | 4,946 | 446 | 7.8 | % | 759 | 15.3 | % | |||||||||||||||||||
| Property general and administrative expenses (3) |
4,157 | 4,017 | 3,563 | 140 | 3.5 | % | 454 | 12.7 | % | |||||||||||||||||||
|
|
|
|
|
|
|
|
|
|
|
|
|
|
|
|||||||||||||||
| Same Store operating expenses |
82,607 | 78,682 | 70,862 | 3,925 | 5.0 | % | 7,820 | 11.0 | % | |||||||||||||||||||
| Non-Same Store |
||||||||||||||||||||||||||||
| Property operating expenses (4) |
15,694 | 15,017 | 11,090 | 677 | 4.5 | % | 3,927 | 35.4 | % | |||||||||||||||||||
| Real estate taxes and insurance |
8,906 | 10,488 | 7,647 | (1,582 | ) | -15.1 | % | 2,841 | 37.2 | % | ||||||||||||||||||
| Property management fees (2) |
1,918 | 1,931 | 1,388 | (13 | ) | -0.7 | % | 543 | 39.1 | % | ||||||||||||||||||
| Property general and administrative expenses (5) |
1,685 | 1,680 | 1,230 | 5 | 0.3 | % | 450 | 36.6 | % | |||||||||||||||||||
|
|
|
|
|
|
|
|
|
|
|
|
|
|
|
|||||||||||||||
| Non-Same Store operating expenses |
28,203 | 29,116 | 21,355 | (913 | ) | -3.1 | % | 7,761 | 36.3 | % | ||||||||||||||||||
|
|
|
|
|
|
|
|
|
|
|
|
|
|
|
|||||||||||||||
| Total operating expenses |
110,810 | 107,798 | 92,217 | 3,012 | 2.8 | % | 15,581 | 16.9 | % | |||||||||||||||||||
|
|
|
|
|
|
|
|
|
|
|
|
|
|
|
|||||||||||||||
| Operating income |
||||||||||||||||||||||||||||
| Same Store |
||||||||||||||||||||||||||||
| Miscellaneous income |
886 | 340 | 322 | 546 | N/M | 18 | 5.6 | % | ||||||||||||||||||||
| Non-Same Store |
||||||||||||||||||||||||||||
| Miscellaneous income |
284 | 931 | 1,303 | (647 | ) | N/M | (372 | ) | -28.5 | % | ||||||||||||||||||
|
|
|
|
|
|
|
|
|
|
|
|
|
|
|
|||||||||||||||
| Total operating income |
1,170 | 1,271 | 1,625 | (101 | ) | -7.9 | % | (354 | ) | -21.8 | % | |||||||||||||||||
|
|
|
|
|
|
|
|
|
|
|
|
|
|
|
|||||||||||||||
| NOI |
||||||||||||||||||||||||||||
| Same Store |
130,591 | 119,735 | 102,463 | 10,856 | 9.1 | % | 17,272 | 16.9 | % | |||||||||||||||||||
| Non-Same Store |
36,813 | 37,689 | 26,184 | (876 | ) | -2.3 | % | 11,505 | 43.9 | % | ||||||||||||||||||
|
|
|
|
|
|
|
|
|
|
|
|
|
|
|
|||||||||||||||
| Total NOI (6) |
$ | 167,404 | $ | 157,424 | $ | 128,647 | $ | 9,980 | 6.3 | % | $ | 28,777 | 22.4 | % | ||||||||||||||
|
|
|
|
|
|
|
|
|
|
|
|
|
|
|
|||||||||||||||
| (1) | For the years ended December 31, 2023, 2022 and 2021, excludes approximately $(2,008,000), $(2,096,000) and $142,000, respectively, of casualty-related expenses/(recoveries). |
| (2) | Fees incurred to an unaffiliated third party that is an affiliate of a noncontrolling limited partner of the OP. |
| (3) | For the years ended December 31, 2023, 2022 and 2021, excludes approximately $2,619,000, $2,638,000 and $1,696,000, respectively, of expenses that are not reflective of the continuing operations of the properties or are incurred on our behalf at the property for expenses such as legal, professional, centralized leasing service and franchise tax fees. |
| (4) | For the years ended December 31, 2023, 2022 and 2021, excludes approximately $(206,000), $3,215,000 and $(341,000), respectively, of casualty-related expenses/(recoveries). |
| (5) | For the years ended December 31, 2023, 2022 and 2021, excludes approximately $1,082,000, $963,000 and $843,000, respectively, of expenses that are not reflective of the continuing operations of the properties or are incurred on our behalf at the property for expenses such as legal, professional, centralized leasing service and franchise tax fees. |
| NXRT.NEXPOINT.COM | Page 20 |
NEXPOINT RESIDENTIAL TRUST, INC. [NYSE:NXRT]
| (6) | For additional information regarding NOI, see the “Definitions and Reconciliations of Non-GAAP Measures” and “NOI and Same Store NOI” sections of this release. |
The following table contains additional information about our 2021-2023 Same Store properties rent and occupancy metrics, revenues, operating expenses and NOI for the years ended December 31, 2023, 2022 and 2021 (dollars in thousands, except for per unit data):
| FY 2023 | FY 2022 | FY 2021 | 2023 vs 2022 % Change |
2022 vs 2021 % Change |
||||||||||||||||
| Same Store Total Units |
11,061 | 11,023 | 11,082 | |||||||||||||||||
| Same Store Occupied Units |
10,476 | 10,373 | 10,445 | |||||||||||||||||
| Same Store Ending Occupancy |
94.7 | % | 94.1 | % | 94.3 | % | 0.6 | % | -0.2 | % | ||||||||||
| Same Store Average Rent per Unit |
$ | 1,520 | $ | 1,520 | $ | 1,288 | 0.0 | % | 18.0 | % | ||||||||||
| Same Store Revenues |
||||||||||||||||||||
| Same Store Rental Income |
$ | 207,034 | $ | 193,060 | $ | 167,971 | 7.2 | % | 14.9 | % | ||||||||||
| Same Store Other Income |
5,278 | 5,017 | 5,033 | 5.2 | % | -0.3 | % | |||||||||||||
|
|
|
|
|
|
|
|
|
|
|
|||||||||||
| Total Same Store Revenues |
212,312 | 198,077 | 173,004 | 7.2 | % | 14.5 | % | |||||||||||||
| Same Store Operating Expenses |
||||||||||||||||||||
| Payroll |
17,091 | 16,120 | 14,766 | 6.0 | % | 9.2 | % | |||||||||||||
| Repairs & Maintenance |
17,925 | 16,990 | 14,128 | 5.5 | % | 20.3 | % | |||||||||||||
| Utilities |
9,342 | 8,901 | 7,954 | 5.0 | % | 11.9 | % | |||||||||||||
| Real Estate Taxes |
23,214 | 22,374 | 21,411 | 3.8 | % | 4.5 | % | |||||||||||||
| Insurance |
4,727 | 4,572 | 4,094 | 3.4 | % | 11.7 | % | |||||||||||||
| Property Management Fees |
6,151 | 5,705 | 4,946 | 7.8 | % | 15.3 | % | |||||||||||||
| Office Operations |
3,008 | 2,860 | 2,434 | 5.2 | % | 17.5 | % | |||||||||||||
| Marketing |
1,149 | 1,160 | 1,129 | -0.9 | % | 2.7 | % | |||||||||||||
|
|
|
|
|
|
|
|
|
|
|
|||||||||||
| Total Same Store Operating Expenses |
82,607 | 78,682 | 70,862 | 5.0 | % | 11.0 | % | |||||||||||||
| Same Store Operating Income |
||||||||||||||||||||
| Miscellaneous income |
886 | 340 | 321 | 160.6 | % | 5.9 | % | |||||||||||||
|
|
|
|
|
|
|
|
|
|
|
|||||||||||
| Total Same Store Operating Income |
886 | 340 | 321 | 160.6 | % | 5.9 | % | |||||||||||||
|
|
|
|
|
|
|
|
|
|
|
|||||||||||
| 2021-2023 Same Store NOI |
$ | 130,591 | $ | 119,735 | $ | 102,463 | 9.1 | % | 16.9 | % | ||||||||||
|
|
|
|
|
|
|
|
|
|
|
|||||||||||
| NXRT.NEXPOINT.COM | Page 21 |
NEXPOINT RESIDENTIAL TRUST, INC. [NYSE:NXRT]
Q4 Same Store Results of Operations for the Three Months Ended December 31, 2023 and 2022
There are 35 properties encompassing 12,940 units of apartment space, or approximately 92% of our Portfolio, in our same store pool for the three months ended December 31, 2023 and 2022 (our “Q4 Same Store” properties). Our Q4 Same Store properties exclude the following 3 properties in our Portfolio as of December 31, 2023: Old Farm, Stone Creek at Old Farm and Radbourne Lake as well as the 44 units mentioned on page 1 that are currently down.
As of December 31, 2023, our Q4 Same Store properties were approximately 94.7% leased with a weighted average monthly effective rent per occupied apartment unit of $1,516, a year-over-year increase of 60 bps and an increase of $3, respectively.
The following table reflects the revenues, property operating expenses and NOI for the three months ended December 31, 2023 and 2022 for our Q4 Same Store and Non-Same Store properties (dollars in thousands):
| For the Three Months Ended December 31, | ||||||||||||||||
| 2023 | 2022 | $ Change | % Change | |||||||||||||
| Revenues |
||||||||||||||||
| Same Store |
||||||||||||||||
| Rental income |
$ | 61,083 | $ | 58,830 | $ | 2,253 | 3.8 | % | ||||||||
| Other income |
1,409 | 1,221 | 188 | 15.4 | % | |||||||||||
|
|
|
|
|
|
|
|
|
|||||||||
| Same Store revenues |
62,492 | 60,051 | 2,441 | 4.1 | % | |||||||||||
| Non-Same Store |
||||||||||||||||
| Rental income |
5,778 | 9,076 | (3,298 | ) | -36.3 | % | ||||||||||
| Other income |
293 | 222 | 71 | 32.0 | % | |||||||||||
|
|
|
|
|
|
|
|
|
|||||||||
| Non-Same Store revenues |
6,071 | 9,298 | (3,227 | ) | -34.7 | % | ||||||||||
|
|
|
|
|
|
|
|
|
|||||||||
| Total revenues |
68,563 | 69,349 | (786 | ) | -1.1 | % | ||||||||||
|
|
|
|
|
|
|
|
|
|||||||||
| Operating expenses |
||||||||||||||||
| Same Store |
||||||||||||||||
| Property operating expenses (1) |
12,911 | 12,610 | 301 | 2.4 | % | |||||||||||
| Real estate taxes and insurance |
7,761 | 7,658 | 103 | 1.3 | % | |||||||||||
| Property management fees (2) |
1,813 | 1,729 | 84 | 4.9 | % | |||||||||||
| Property general and administrative expenses (3) |
1,233 | 1,247 | (14 | ) | -1.1 | % | ||||||||||
|
|
|
|
|
|
|
|
|
|||||||||
| Same Store operating expenses |
23,718 | 23,244 | 474 | 2.0 | % | |||||||||||
| Non-Same Store |
||||||||||||||||
| Property operating expenses (4) |
1,729 | 2,416 | (687 | ) | -28.4 | % | ||||||||||
| Real estate taxes and insurance |
900 | 2,105 | (1,205 | ) | N/M | |||||||||||
| Property management fees (2) |
167 | 278 | (111 | ) | -39.9 | % | ||||||||||
| Property general and administrative expenses (5) |
178 | 274 | (96 | ) | -35.0 | % | ||||||||||
|
|
|
|
|
|
|
|
|
|||||||||
| Non-Same Store operating expenses |
2,974 | 5,073 | (2,099 | ) | -41.4 | % | ||||||||||
|
|
|
|
|
|
|
|
|
|||||||||
| Total operating expenses |
26,692 | 28,317 | (1,625 | ) | -5.7 | % | ||||||||||
|
|
|
|
|
|
|
|
|
|||||||||
| Operating income |
||||||||||||||||
| Same Store |
||||||||||||||||
| Miscellaneous income |
286 | 585 | (299 | ) | -51.1 | % | ||||||||||
| Non-Same Store |
||||||||||||||||
| Miscellaneous income |
5 | 160 | (155 | ) | N/M | |||||||||||
|
|
|
|
|
|
|
|
|
|||||||||
| Total operating income |
291 | 745 | (454 | ) | -60.9 | % | ||||||||||
|
|
|
|
|
|
|
|
|
|||||||||
| NOI |
||||||||||||||||
| Same Store |
39,060 | 37,392 | 1,668 | 4.5 | % | |||||||||||
| Non-Same Store |
3,102 | 4,385 | (1,283 | ) | -29.3 | % | ||||||||||
|
|
|
|
|
|
|
|
|
|||||||||
| Total NOI (6) |
$ | 42,162 | $ | 41,777 | $ | 385 | 0.9 | % | ||||||||
|
|
|
|
|
|
|
|
|
|||||||||
| (1) | For the three months ended December 31, 2023 and 2022, excludes approximately $(865,000) and $52,000, respectively, of casualty-related expenses/(recoveries). |
| (2) | Fees incurred to an unaffiliated third party that is an affiliate of a noncontrolling limited partner of the OP. |
| (3) | For the three months ended December 31, 2023 and 2022, excludes approximately $826,000 and $1,048,000, respectively, of expenses that are not reflective of the continuing operations of the properties or are incurred on our behalf at the property for expenses such as legal, professional, centralized leasing service and franchise tax fees. |
| NXRT.NEXPOINT.COM | Page 22 |
NEXPOINT RESIDENTIAL TRUST, INC. [NYSE:NXRT]
| (4) | For the three months ended December 31, 2023 and 2022, excludes approximately $(17,000) and $404,000, respectively, of casualty-related expenses/(recoveries). |
| (5) | For the three months ended December 31, 2023 and 2022, excludes approximately $179,000 and $143,000, respectively, of expenses that are not reflective of the continuing operations of the properties or are incurred on our behalf at the property for expenses such as legal, professional centralized leasing service and franchise tax fees. |
| (6) | For additional information regarding NOI, see the “Definitions and Reconciliations of Non-GAAP Measures” and “NOI and Same Store NOI” sections of this release. |
The following table contains additional information about our Q4 Same Store properties rent and occupancy metrics, revenues, operating expenses and NOI for the three months ended December 31, 2023 and 2022 (dollars in thousands, except for per unit data):
| Q4 2023 | Q4 2022 | % Change | ||||||||||
| Same Store Total Units |
12,940 | 12,903 | ||||||||||
| Same Store Occupied Units |
12,259 | 12,143 | ||||||||||
| Same Store Ending Occupancy |
94.7 | % | 94.1 | % | 0.6 | % | ||||||
| Same Store Average Rent per Unit |
$ | 1,516 | $ | 1,513 | 0.2 | % | ||||||
| Same Store Revenues |
||||||||||||
| Same Store Rental Income |
$ | 61,083 | $ | 58,830 | 3.8 | % | ||||||
| Same Store Other Income |
1,409 | 1,221 | 15.4 | % | ||||||||
|
|
|
|
|
|
|
|||||||
| Total Same Store Revenues |
62,492 | 60,051 | 4.1 | % | ||||||||
| Same Store Operating Expenses |
||||||||||||
| Payroll |
4,852 | 4,943 | -1.8 | % | ||||||||
| Repairs & Maintenance |
5,299 | 5,028 | 5.4 | % | ||||||||
| Utilities |
2,760 | 2,639 | 4.6 | % | ||||||||
| Real Estate Taxes |
6,326 | 6,276 | 0.8 | % | ||||||||
| Insurance |
1,435 | 1,382 | 3.8 | % | ||||||||
| Property Management Fees |
1,813 | 1,729 | 4.9 | % | ||||||||
| Office Operations |
886 | 929 | -4.6 | % | ||||||||
| Marketing |
347 | 318 | 9.1 | % | ||||||||
|
|
|
|
|
|
|
|||||||
| Total Same Store Operating Expenses |
23,718 | 23,244 | 2.0 | % | ||||||||
| Same Store Operating Income |
||||||||||||
| Miscellaneous income |
286 | 585 | N/M | |||||||||
|
|
|
|
|
|
|
|||||||
| Total Same Store Operating Income |
286 | 585 | N/M | |||||||||
|
|
|
|
|
|
|
|||||||
| Q4 Same Store NOI |
$ | 39,060 | $ | 37,392 | 4.5 | % | ||||||
|
|
|
|
|
|
|
|||||||
| NXRT.NEXPOINT.COM | Page 23 |
NEXPOINT RESIDENTIAL TRUST, INC. [NYSE:NXRT]
FFO, Core FFO and AFFO
The following table reconciles our calculations of FFO, Core FFO and AFFO to net income (loss), the most directly comparable GAAP financial measure, for the years ended December 31, 2023, 2022 and 2021 and for the three months ended December 31, 2023 and 2022 (in thousands, except per share amounts):
| For the Year Ended December 31, | For the Three Months Ended December 31, |
|||||||||||||||||||||
| 2023 | 2022 | 2021 | 2023 | 2022 | ||||||||||||||||||
| Net income (loss) | $ | 44,433 | $ | (9,291 | ) | $ | 23,106 | $ | 18,421 | $ | 3,802 | |||||||||||
| Depreciation and amortization | 95,186 | 97,648 | 86,878 | 24,251 | 23,158 | |||||||||||||||||
| Gain on sales of real estate | (67,926 | ) | (14,684 | ) | (46,214 | ) | (24,836 | ) | (14,684 | ) | ||||||||||||
| Adjustment for noncontrolling interests | (273 | ) | (276 | ) | (191 | ) | (68 | ) | (48 | ) | ||||||||||||
|
|
|
|
|
|
|
|
|
|
|
|||||||||||||
| FFO attributable to common stockholders | 71,420 | 73,397 | 63,579 | 17,768 | 12,228 | |||||||||||||||||
|
|
|
|
|
|
|
|
|
|
|
|||||||||||||
| FFO per share - basic | $ | 2.78 | $ | 2.87 | $ | 2.53 | $ | 0.69 | $ | 0.48 | ||||||||||||
|
|
|
|
|
|
|
|
|
|
|
|||||||||||||
| FFO per share - diluted | $ | 2.72 | $ | 2.81 | $ | 2.47 | $ | 0.68 | $ | 0.47 | ||||||||||||
|
|
|
|
|
|
|
|
|
|
|
|||||||||||||
| Loss on extinguishment of debt and modification costs | 2,409 | 8,734 | 912 | 316 | 8,734 | |||||||||||||||||
| Casualty-related expenses/(recoveries) | (2,214 | ) | 1,119 | (199 | ) | (882 | ) | 456 | ||||||||||||||
| Casualty losses (gains) | 856 | (2,506 | ) | (2,595 | ) | (124 | ) | (2,149 | ) | |||||||||||||
| Gain on forfeited deposits | (250 | ) | — | — | — | — | ||||||||||||||||
| Amortization of deferred financing costs - acquisition term notes | 1,321 | 1,083 | 737 | 330 | 297 | |||||||||||||||||
| Adjustment for noncontrolling interests | (8 | ) | (31 | ) | 4 | 1 | (28 | ) | ||||||||||||||
|
|
|
|
|
|
|
|
|
|
|
|||||||||||||
| Core FFO attributable to common stockholders | 73,534 | 81,796 | 62,438 | 17,409 | 19,538 | |||||||||||||||||
|
|
|
|
|
|
|
|
|
|
|
|||||||||||||
| Core FFO per share - basic | $ | 2.87 | $ | 3.19 | $ | 2.48 | $ | 0.68 | $ | 0.76 | ||||||||||||
|
|
|
|
|
|
|
|
|
|
|
|||||||||||||
| Core FFO per share - diluted | $ | 2.80 | $ | 3.13 | $ | 2.42 | $ | 0.66 | $ | 0.75 | ||||||||||||
|
|
|
|
|
|
|
|
|
|
|
|||||||||||||
| Amortization of deferred financing costs - long term debt | 1,624 | 1,696 | 1,460 | 402 | 449 | |||||||||||||||||
| Equity-based compensation expense | 9,287 | 7,911 | 6,997 | 2,332 | 2,005 | |||||||||||||||||
| Adjustment for noncontrolling interests | (41 | ) | (37 | ) | (25 | ) | (11 | ) | (10 | ) | ||||||||||||
|
|
|
|
|
|
|
|
|
|
|
|||||||||||||
| AFFO attributable to common stockholders | 84,404 | 91,366 | 70,870 | 20,132 | 21,982 | |||||||||||||||||
|
|
|
|
|
|
|
|
|
|
|
|||||||||||||
| AFFO per share - basic | $ | 3.29 | $ | 3.57 | $ | 2.82 | $ | 0.78 | $ | 0.86 | ||||||||||||
|
|
|
|
|
|
|
|
|
|
|
|||||||||||||
| AFFO per share - diluted | $ | 3.22 | $ | 3.49 | $ | 2.75 | $ | 0.77 | $ | 0.84 | ||||||||||||
|
|
|
|
|
|
|
|
|
|
|
|||||||||||||
| Weighted average common shares outstanding - basic | 25,654 | 25,610 | 25,170 | 25,674 | 25,549 | |||||||||||||||||
|
|
|
|
|
|
|
|
|
|
|
|||||||||||||
| Weighted average common shares outstanding - diluted | (1) | 26,245 | 26,151 | 25,760 | 26,298 | 26,077 | ||||||||||||||||
|
|
|
|
|
|
|
|
|
|
|
|||||||||||||
| Dividends declared per common share | $ | 1.72242 | $ | 1.56 | $ | 1.40375 | $ | 0.46242 | $ | 0.42 | ||||||||||||
| Net income (loss) Coverage - diluted | (2) | 0.98x | -0.23x | 0.63x | 1.51x | 0.36x | ||||||||||||||||
| FFO Coverage - diluted | (2) | 1.58x | 1.80x | 1.76x | 1.46x | 1.12x | ||||||||||||||||
| Core FFO Coverage - diluted | (2) | 1.63x | 2.01x | 1.73x | 1.43x | 1.78x | ||||||||||||||||
| AFFO Coverage - diluted | (2) | 1.87x | 2.24x | 1.96x | 1.66x | 2.01x | ||||||||||||||||
| (1) | The Company uses actual diluted weighted average common shares outstanding when in a dilutive position for FFO, Core FFO and AFFO. |
| (2) | Indicates coverage ratio of Net Income (Loss)/FFO/Core FFO/AFFO per common share (diluted) over dividends declared per common share during the period. |
| NXRT.NEXPOINT.COM | Page 24 |
NEXPOINT RESIDENTIAL TRUST, INC. [NYSE:NXRT]
Historical Capital Expenditures
| FY 2023 | FY 2022 | % Change | Q4 2023 | Q4 2022 | % Change | |||||||||||||||||||
| ($ in thousands) |
||||||||||||||||||||||||
| Capital Expenditures |
||||||||||||||||||||||||
| Acquisition Capital Expenditures |
$ | — | $ | 143,400 | -100.0 | % | $ | — | $ | — | N/A | |||||||||||||
| Capitalized Rehab Expenditures |
||||||||||||||||||||||||
| Interior |
25,505 | 26,229 | -2.8 | % | 3,606 | 8,645 | N/M | |||||||||||||||||
| Exterior and common area |
11,730 | 9,957 | 17.8 | % | 1,360 | 3,083 | N/M | |||||||||||||||||
| Capitalized Maintenance Expenditures |
||||||||||||||||||||||||
| Recurring |
10,858 | 11,699 | -7.2 | % | 1,356 | 2,720 | N/M | |||||||||||||||||
| Non-Recurring |
7,915 | 7,509 | 5.4 | % | 1,274 | 2,131 | -40.2 | % | ||||||||||||||||
|
|
|
|
|
|
|
|
|
|
|
|
|
|||||||||||||
| Total Capital Expenditures |
$ | 56,007 | $ | 198,794 | -71.8 | % | $ | 7,597 | $ | 16,579 | N/M | |||||||||||||
|
|
|
|
|
|
|
|
|
|
|
|
|
|||||||||||||
| NXRT.NEXPOINT.COM | Page 25 |
NEXPOINT RESIDENTIAL TRUST, INC. [NYSE:NXRT]
Value-Add Program Details: Interiors (Full & Partials)
| Property Name (1) |
Units | Rehab Units Completed (2) |
Average Rent Pre-Rehab |
Average Rent Post-Rehab |
Avg. Rehab Cost Per Unit (3) |
Post-Rehab Rent Change% |
ROI (3) | |||||||||||||||||||||
| Value-Add Programs In Progress |
||||||||||||||||||||||||||||
| Arbors of Brentwood |
346 | 158 | 1,221 | $ | 1,436 | $ | 10,346 | 17.6 | % | 24.9 | % | |||||||||||||||||
| Arbors on Forest Ridge |
210 | 180 | 814 | 916 | 4,388 | 12.6 | % | 27.9 | % | |||||||||||||||||||
| Atera Apartments |
380 | 233 | 1,207 | 1,356 | 3,420 | 12.4 | % | 52.5 | % | |||||||||||||||||||
| Avant at Pembroke Pines |
1,520 | 624 | 1,838 | 2,090 | 17,453 | 13.8 | % | 17.4 | % | |||||||||||||||||||
| Bella Solara |
320 | 129 | 1,284 | 1,446 | 11,232 | 12.6 | % | 17.3 | % | |||||||||||||||||||
| Bella Vista |
248 | 204 | 1,466 | 1,608 | 10,516 | 9.7 | % | 16.2 | % | |||||||||||||||||||
| Bloom |
528 | 160 | 1,241 | 1,405 | 14,199 | 13.2 | % | 13.8 | % | |||||||||||||||||||
| Brandywine I & II |
632 | 552 | 1,034 | 1,218 | 10,755 | 17.9 | % | 20.6 | % | |||||||||||||||||||
| Courtney Cove |
324 | 300 | 1,000 | 1,113 | 4,974 | 11.3 | % | 27.1 | % | |||||||||||||||||||
| Creekside at Matthews |
240 | 83 | 1,316 | 1,517 | 12,455 | 15.3 | % | 19.4 | % | |||||||||||||||||||
| Cutter’s Point |
196 | 158 | 1,004 | 1,133 | 6,732 | 12.9 | % | 23.0 | % | |||||||||||||||||||
| Estates on Maryland |
330 | 109 | 1,285 | 1,474 | 13,332 | 14.7 | % | 17.0 | % | |||||||||||||||||||
| Fairways at San Marcos |
352 | 145 | 1,508 | 1,699 | 13,665 | 12.7 | % | 16.8 | % | |||||||||||||||||||
| High House at Cary |
302 | 115 | 1,331 | 1,602 | 13,517 | 20.4 | % | 24.1 | % | |||||||||||||||||||
| Madera Point |
256 | 261 | 871 | 983 | 4,535 | 12.8 | % | 29.5 | % | |||||||||||||||||||
| Parc500 |
217 | 219 | 1,307 | 1,497 | 14,668 | 14.5 | % | 15.5 | % | |||||||||||||||||||
| Radbourne Lake |
225 | 381 | 1,079 | 1,150 | 2,841 | 6.6 | % | 29.9 | % | |||||||||||||||||||
| Residences at Glenview Reserve |
360 | 252 | 1,116 | 1,334 | 13,431 | 19.6 | % | 19.5 | % | |||||||||||||||||||
| Residences at West Place |
342 | 156 | 1,504 | 1,710 | 11,892 | 13.7 | % | 20.8 | % | |||||||||||||||||||
| Rockledge Apartments |
708 | 470 | 1,237 | 1,444 | 11,091 | 16.7 | % | 22.4 | % | |||||||||||||||||||
| Sabal Palm at Lake Buena Vista |
400 | 94 | 1,634 | 1,871 | 12,984 | 14.5 | % | 21.9 | % | |||||||||||||||||||
| Seasons 704 Apartments |
222 | 232 | 1,228 | 1,371 | 7,836 | 11.6 | % | 21.8 | % | |||||||||||||||||||
| Six Forks Station |
323 | 134 | 1,145 | 1,435 | 12,784 | 25.4 | % | 27.2 | % | |||||||||||||||||||
| Summers Landing |
196 | 56 | 1,092 | 1,316 | 11,075 | 20.6 | % | 24.3 | % | |||||||||||||||||||
| Summit at Sabal Park |
252 | 239 | 1,004 | 1,105 | 5,854 | 10.1 | % | 20.8 | % | |||||||||||||||||||
| The Adair |
232 | 124 | 1,742 | 2,029 | 11,855 | 16.5 | % | 29.0 | % | |||||||||||||||||||
| The Cornerstone |
430 | 514 | 1,060 | 1,154 | 4,905 | 8.9 | % | 23.0 | % | |||||||||||||||||||
| The Enclave |
204 | 172 | 1,468 | 1,654 | 10,392 | 12.7 | % | 21.5 | % | |||||||||||||||||||
| The Heritage |
204 | 177 | 1,406 | 1,540 | 9,609 | 9.6 | % | 16.8 | % | |||||||||||||||||||
| The Preserve at Terrell Mill |
752 | 781 | 898 | 1,079 | 11,376 | 20.1 | % | 19.0 | % | |||||||||||||||||||
| The Verandas at Lake Norman |
264 | 90 | 1,354 | 1,571 | 11,041 | 16.1 | % | 23.7 | % | |||||||||||||||||||
| The Venue on Camelback |
415 | 280 | 776 | 1,028 | 10,269 | 32.4 | % | 29.4 | % | |||||||||||||||||||
| Torreyana Apartments |
316 | 56 | 1,477 | 1,609 | 13,435 | 9.0 | % | 11.9 | % | |||||||||||||||||||
| Venue at 8651 |
333 | 298 | 822 | 933 | 6,982 | 13.5 | % | 19.1 | % | |||||||||||||||||||
| Versailles |
388 | 316 | 817 | 921 | 6,164 | 12.7 | % | 20.2 | % | |||||||||||||||||||
| Versailles II |
242 | 82 | 903 | 1,038 | 5,632 | 15.0 | % | 28.9 | % | |||||||||||||||||||
|
|
|
|
|
|
|
|
|
|
|
|
|
|
|
|
||||||||||||||
| Total/Weighted Average |
13,209 | 8,534 | $ | 1,164 | $ | 1,333 | $ | 9,715 | 14.5 | % | 20.9 | % | ||||||||||||||||
|
|
|
|
|
|
|
|
|
|
|
|
|
|
|
|
||||||||||||||
| (1) | We do not plan to upgrade 100% of the units at each of our properties. |
| (2) | Inclusive of all full and partial interior upgrades completed through December 31, 2023. |
| (3) | Inclusive of all full and partial interior upgrades completed and leased through December 31, 2023. |
| NXRT.NEXPOINT.COM | Page 26 |
NEXPOINT RESIDENTIAL TRUST, INC. [NYSE:NXRT]
Value-Add Program Details: Kitchen & Laundry Appliances
| Property Name (1) |
Units | Rehab Units Completed (2) |
Avg. Rehab Cost Per Unit (3) |
Post-Rehab Rent Change $ |
ROI (3) | |||||||||||||||
| Value-Add Programs In Progress |
||||||||||||||||||||
| Arbors of Brentwood |
346 | 313 | $ | 858 | $ | 50 | 69.7 | % | ||||||||||||
| Arbors on Forest Ridge |
210 | 130 | 770 | 42 | 64.7 | % | ||||||||||||||
| Atera Apartments |
380 | 368 | 812 | 40 | 59.7 | % | ||||||||||||||
| Avant at Pembroke Pines |
1,520 | 352 | 1,382 | 49 | 42.3 | % | ||||||||||||||
| Brandywine I & II |
632 | 189 | 1,033 | 71 | 81.9 | % | ||||||||||||||
| Creekside at Matthews |
240 | 190 | 1,084 | 45 | 49.8 | % | ||||||||||||||
| Cutter’s Point |
196 | 141 | 756 | 46 | 72.9 | % | ||||||||||||||
| Estates on Maryland |
330 | 19 | 1,083 | 35 | 38.8 | % | ||||||||||||||
| Madera Point |
256 | 157 | 885 | 30 | 40.2 | % | ||||||||||||||
| Radbourne Lake |
225 | 224 | 717 | 40 | 66.9 | % | ||||||||||||||
| Rockledge Apartments |
708 | 620 | 819 | 40 | 58.6 | % | ||||||||||||||
| Sabal Palm at Lake Buena Vista |
400 | 634 | 599 | 86 | 171.8 | % | ||||||||||||||
| Six Forks Station |
323 | 196 | 1,087 | 55 | 60.7 | % | ||||||||||||||
| Summers Landing |
196 | 97 | 833 | 50 | 72.0 | % | ||||||||||||||
| Summit at Sabal Park |
252 | 249 | 994 | 40 | 48.3 | % | ||||||||||||||
| The Adair |
232 | 11 | 1,083 | 84 | 92.8 | % | ||||||||||||||
| The Cornerstone |
430 | 17 | 809 | 50 | 74.2 | % | ||||||||||||||
| The Verandas at Lake Norman |
264 | 150 | 1,083 | 55 | 60.9 | % | ||||||||||||||
| Venue at 8651 |
333 | 260 | 766 | 47 | 72.9 | % | ||||||||||||||
| Versailles |
388 | 306 | 868 | 50 | 68.4 | % | ||||||||||||||
| Versailles II |
242 | 138 | 885 | 28 | 38.4 | % | ||||||||||||||
|
|
|
|
|
|
|
|
|
|
|
|
||||||||||
| Total/Weighted Average |
8,103 | 4,761 | $ | 907 | $ | 49 | 64.7 | % | ||||||||||||
|
|
|
|
|
|
|
|
|
|
|
|
||||||||||
| (1) | We do not plan to upgrade 100% of the units at each of our properties. |
| (2) | Inclusive of all kitchen and laundry appliance upgrades completed through December 31, 2023. |
| (3) | Inclusive of all kitchen and laundry appliance upgrades completed and leased through December 31, 2023. |
| NXRT.NEXPOINT.COM | Page 27 |
NEXPOINT RESIDENTIAL TRUST, INC. [NYSE:NXRT]
Value-Add Program Details: Smart Home Technology Packages
| Property Name (1) |
Units | Rehab Units Completed (2) |
Avg. Rehab Cost Per Unit (3) |
Post-Rehab Rent Change $ |
ROI (3) | |||||||||||||||
| Value-Add Programs In Progress |
||||||||||||||||||||
| Arbors of Brentwood |
346 | 346 | $ | 1,419 | $ | 45 | 30.9 | % | ||||||||||||
| Arbors on Forest Ridge |
210 | 210 | 1,416 | 45 | 30.9 | % | ||||||||||||||
| Atera Apartments |
380 | 380 | 1,339 | 50 | 37.0 | % | ||||||||||||||
| Avant at Pembroke Pines |
1,520 | 1,520 | 1,350 | 45 | 32.4 | % | ||||||||||||||
| Bella Solara |
320 | 320 | 820 | 35 | 39.5 | % | ||||||||||||||
| Bella Vista |
248 | 248 | 970 | 40 | 39.3 | % | ||||||||||||||
| Bloom |
528 | 528 | 901 | 40 | 42.3 | % | ||||||||||||||
| Brandywine I & II |
632 | 632 | 1,234 | 45 | 35.5 | % | ||||||||||||||
| Courtney Cove |
324 | 324 | 1,238 | 35 | 26.2 | % | ||||||||||||||
| Creekside at Matthews |
240 | 240 | 913 | 65 | 72.9 | % | ||||||||||||||
| Cutter’s Point |
196 | 196 | 1,400 | 45 | 31.3 | % | ||||||||||||||
| Estates on Maryland |
330 | 330 | 913 | 45 | 48.0 | % | ||||||||||||||
| Fairways of San Marcos |
352 | 352 | 901 | 40 | 42.3 | % | ||||||||||||||
| Hight House at Cary |
302 | 302 | 899 | 65 | 74.1 | % | ||||||||||||||
| Madera Point |
256 | 256 | 1,283 | 45 | 34.1 | % | ||||||||||||||
| Old Farm |
734 | 734 | 928 | 45 | 47.2 | % | ||||||||||||||
| Radbourne Lake |
225 | 225 | 630 | 35 | 51.4 | % | ||||||||||||||
| Residences at Glenview Reserve |
360 | 360 | 1,017 | 45 | 43.1 | % | ||||||||||||||
| Rockledge Apartments |
708 | 708 | 942 | 35 | 34.4 | % | ||||||||||||||
| Sabal Palm at Lake Buena Vista |
400 | 400 | 1,237 | 45 | 35.4 | % | ||||||||||||||
| Six Forks Station |
323 | 323 | 844 | 35 | 38.4 | % | ||||||||||||||
| Stone Creek at Old Farm |
190 | 190 | 909 | 45 | 48.2 | % | ||||||||||||||
| Summers Landing |
196 | 196 | 1,449 | 45 | 30.2 | % | ||||||||||||||
| The Adair |
232 | 232 | 913 | 45 | 48.0 | % | ||||||||||||||
| The Cornerstone |
430 | 430 | 1,236 | 45 | 35.4 | % | ||||||||||||||
| The Enclave |
204 | 204 | 966 | 40 | 39.4 | % | ||||||||||||||
| The Heritage |
204 | 204 | 997 | 40 | 38.2 | % | ||||||||||||||
| The Venue on Camelback Apartments |
415 | 415 | 808 | 30 | 33.0 | % | ||||||||||||||
| The Verandas at Lake Norman |
264 | 264 | 954 | 65 | 69.8 | % | ||||||||||||||
| Torreyana Apartments |
316 | 316 | 900 | 35 | 36.0 | % | ||||||||||||||
| Venue at 8651 |
333 | 333 | 1,229 | 45 | 35.6 | % | ||||||||||||||
| Versailles |
388 | 388 | 1,080 | 45 | 40.6 | % | ||||||||||||||
| Versailles II |
242 | 242 | 1,241 | 45 | 35.3 | % | ||||||||||||||
|
|
|
|
|
|
|
|
|
|
|
|
||||||||||
| Total/Weighted Average |
12,348 | 12,348 | $ | 1,093 | $ | 43 | 37.8 | % | ||||||||||||
|
|
|
|
|
|
|
|
|
|
|
|
||||||||||
| Planned Value-Add Programs | |
Rent Change & ROI (Projections) |
| |||||||||||||||||
| Residences at West Place |
342 | — | TBD | TBD | TBD | |||||||||||||||
| Seasons 704 Apartments |
222 | — | TBD | TBD | TBD | |||||||||||||||
| Summit at Sabal Park |
252 | — | TBD | TBD | TBD | |||||||||||||||
| The Preserve at Terrell Mill |
752 | — | TBD | TBD | TBD | |||||||||||||||
|
|
|
|
|
|
|
|
|
|
|
|
||||||||||
| Total/Weighted Average Planned |
1,568 | — | TBD | TBD | TBD | |||||||||||||||
|
|
|
|
|
|
|
|
|
|
|
|
||||||||||
| (1) | We do not plan to upgrade 100% of the units at each of our properties. |
| (2) | Inclusive of all smart home technology package upgrades completed through December 31, 2023. |
| (3) | Inclusive of all smart home technology package upgrades completed and leased through December 31, 2023. |
| NXRT.NEXPOINT.COM | Page 28 |
NEXPOINT RESIDENTIAL TRUST, INC. [NYSE:NXRT]
Outstanding Debt Details
Mortgage Debt
The following table contains summary information concerning the mortgage debt of the Company as of December 31, 2023 (dollars in thousands):
| Operating Properties |
Type | Term (months) | Outstanding Principal |
Interest Rate (1) | Maturity Date | |||||||||||||||||||
| Arbors on Forest Ridge |
Floating | 120 | $ | 19,184 | 6.89% | 12/1/2032 | ||||||||||||||||||
| Cutter’s Point |
Floating | 120 | 21,524 | 6.89% | 12/1/2032 | |||||||||||||||||||
| The Summit at Sabal Park |
Floating | 120 | 30,826 | 6.89% | 12/1/2032 | |||||||||||||||||||
| Courtney Cove |
Floating | 120 | 36,146 | 6.89% | 12/1/2032 | |||||||||||||||||||
| The Preserve at Terrell Mill |
Floating | 120 | 71,098 | 6.89% | 12/1/2032 | |||||||||||||||||||
| Versailles |
Floating | 120 | 40,247 | 6.89% | 12/1/2032 | |||||||||||||||||||
| Seasons 704 Apartments |
Floating | 120 | 33,132 | 6.89% | 12/1/2032 | |||||||||||||||||||
| Madera Point |
Floating | 120 | 34,457 | 6.89% | 12/1/2032 | |||||||||||||||||||
| Venue at 8651 |
Floating | 120 | 18,690 | 6.89% | 12/1/2032 | |||||||||||||||||||
| The Venue on Camelback |
Floating | 120 | 42,788 | 7.52% | 2/1/2033 | |||||||||||||||||||
| Sabal Palm at Lake Buena Vista |
Floating | 84 | 42,100 | 6.76% | 9/1/2025 | |||||||||||||||||||
| Cornerstone |
Floating | 120 | 46,804 | 7.43% | 12/1/2032 | |||||||||||||||||||
| Parc500 |
Floating | 120 | 29,416 | 6.89% | 12/1/2032 | |||||||||||||||||||
| Rockledge Apartments |
Floating | 120 | 93,129 | 6.89% | 12/1/2032 | |||||||||||||||||||
| Atera Apartments |
Floating | 120 | 46,198 | 6.89% | 12/1/2032 | |||||||||||||||||||
| Versailles II |
Floating | 84 | 12,061 | 6.64% | 10/1/2025 | |||||||||||||||||||
| Brandywine I & II |
Floating | 84 | 43,835 | 6.64% | 10/1/2025 | |||||||||||||||||||
| Bella Vista |
Floating | 84 | 29,040 | 6.78% | 2/1/2026 | |||||||||||||||||||
| The Enclave |
Floating | 84 | 25,322 | 6.78% | 2/1/2026 | |||||||||||||||||||
| The Heritage |
Floating | 84 | 24,625 | 6.78% | 2/1/2026 | |||||||||||||||||||
| Summers Landing |
(2) | Floating | 84 | 10,109 | 6.64% | 10/1/2025 | ||||||||||||||||||
| Residences at Glenview Reserve |
(2) | Floating | 84 | 25,574 | 6.90% | 10/1/2025 | ||||||||||||||||||
| Residences at West Place |
(2) | Fixed | 120 | 33,817 | 4.24% | 10/1/2028 | ||||||||||||||||||
| Avant at Pembroke Pines |
Floating | 84 | 177,101 | 6.89% | 9/1/2026 | |||||||||||||||||||
| Arbors of Brentwood |
Floating | 84 | 34,237 | 6.89% | 10/1/2026 | |||||||||||||||||||
| Torreyana Apartments |
Floating | 120 | 50,580 | 6.89% | 12/1/2032 | |||||||||||||||||||
| Bloom |
Floating | 120 | 59,830 | 6.89% | 12/1/2032 | |||||||||||||||||||
| Bella Solara |
Floating | 120 | 40,328 | 6.89% | 12/1/2032 | |||||||||||||||||||
| Fairways at San Marcos |
Floating | 120 | 60,228 | 6.89% | 12/1/2032 | |||||||||||||||||||
| The Verandas at Lake Norman |
Floating | 84 | 34,925 | 7.19% | 7/1/2028 | |||||||||||||||||||
| Creekside at Matthews |
Floating | 120 | 29,648 | 6.89% | 12/1/2032 | |||||||||||||||||||
| Six Forks Station |
Floating | 120 | 41,180 | 7.06% | 10/1/2031 | |||||||||||||||||||
| High House at Cary |
Floating | 84 | 46,625 | 7.35% | 1/1/2029 | |||||||||||||||||||
| The Adair |
Floating | 84 | 35,115 | 7.31% | 4/1/2029 | |||||||||||||||||||
| Estates on Maryland |
Floating | 84 | 43,157 | 7.31% | 4/1/2029 | |||||||||||||||||||
|
|
|
|||||||||||||||||||||||
| $ | 1,463,076 | |||||||||||||||||||||||
| Fair market value adjustment |
503 | (3) | ||||||||||||||||||||||
| Deferred financing costs, net of accumulated amortization of $3,763 | (9,792 | ) | ||||||||||||||||||||||
|
|
|
|||||||||||||||||||||||
| $ | 1,453,787 | |||||||||||||||||||||||
|
|
|
|||||||||||||||||||||||
| Held For Sale Properties |
||||||||||||||||||||||||
| Old Farm |
Floating | 84 | $ | 52,886 | 7.14% | 7/1/2024 | ||||||||||||||||||
| Stone Creek at Old Farm |
Floating | 84 | 15,274 | 7.14% | 7/1/2024 | |||||||||||||||||||
| Radbourne Lake |
Floating | 84 | 20,000 | 6.75% | 10/1/2025 | |||||||||||||||||||
|
|
|
|||||||||||||||||||||||
| $ | 88,160 | |||||||||||||||||||||||
| Deferred financing costs, net of accumulated amortization of $827 | (116 | ) | ||||||||||||||||||||||
|
|
|
|||||||||||||||||||||||
| $ | 88,044 | |||||||||||||||||||||||
|
|
|
|||||||||||||||||||||||
| (1) | Interest rate is based on a reference rate plus an applicable margin, except for fixed rate mortgage debt. The reference rates used in our portfolio is 30-Day Average Secured Overnight Financing Rate (“SOFR”). Loans that transitioned from LIBOR to SOFR include a 0.11448% adjustment to SOFR for the all-in rate. As of December 31, 2023, SOFR was 5.344%. |
| (2) | Debt was assumed upon acquisition of this property and recorded at approximated fair value. |
| (3) | The Company reflected a valuation adjustment on its fixed rate debt for Residences at West Place to adjust it to fair market value on their respective dates of acquisition for the difference between the fair value and the assumed principal amount of debt. The difference is amortized into interest expense over the remaining terms of the mortgages. |
| NXRT.NEXPOINT.COM | Page 29 |
NEXPOINT RESIDENTIAL TRUST, INC. [NYSE:NXRT]
Credit Facility
The following table contains summary information concerning the Company’s credit facility as of December 31, 2023 (dollars in thousands):
| Type | Term (months) | Outstanding Principal |
Available Principal |
Interest Rate (1) | Maturity Date | |||||||||||||||||||
| Corporate Credit Facility |
Floating | 36 | $ | 24,000 | $ | 326,000 | 7.60% | 6/30/2025 | ||||||||||||||||
| Deferred financing costs, net of accumulated amortization of $2,250 | (757) | |||||||||||||||||||||||
|
|
|
|||||||||||||||||||||||
| $ | 23,243 | |||||||||||||||||||||||
|
|
|
|||||||||||||||||||||||
| (1) | Interest rate is based on Term SOFR plus an applicable margin. Term SOFR as of December 31, 2023 was 5.355%. |
Interest Rate Swap Agreements
As of December 31, 2023, the Company had the following outstanding interest rate swaps that were designated as cash flow hedges of interest rate risk (dollars in thousands):
| Effective Date |
Termination Date |
Counterparty |
Notional Amount | Fixed Rate (1) | ||||||||
| June 1, 2019 |
June 1, 2024 | KeyBank | $ | 50,000 | 2.0020 | % | ||||||
| June 1, 2019 |
June 1, 2024 | Truist | 50,000 | 2.0020 | % | |||||||
| September 1, 2019 |
September 1, 2026 | KeyBank | 100,000 | 1.4620 | % | |||||||
| September 1, 2019 |
September 1, 2026 | KeyBank | 125,000 | 1.3020 | % | |||||||
| January 3, 2020 |
September 1, 2026 | KeyBank | 92,500 | 1.6090 | % | |||||||
| March 4, 2020 |
June 1, 2026 | Truist | 100,000 | 0.8200 | % | |||||||
| June 1, 2021 |
September 1, 2026 | KeyBank | 200,000 | 0.8450 | % | |||||||
| June 1, 2021 |
September 1, 2026 | KeyBank | 200,000 | 0.9530 | % | |||||||
| March 1, 2022 |
March 1, 2025 | Truist | 145,000 | 0.5730 | % | |||||||
| March 1, 2022 |
March 1, 2025 | Truist | 105,000 | 0.6140 | % | |||||||
|
|
|
|
|
|||||||||
| $ | 1,167,500 | 1.0682 | %(2) | |||||||||
|
|
|
|
|
|||||||||
| (1) | The floating rate option for the interest rate swaps is Adjusted SOFR. As of December 31, 2023, Adjusted SOFR was 5.459%. |
| (2) | Represents the weighted average fixed rate of the interest rate swaps. |
The following table contains summary information regarding our forward interest rate swaps (dollars in thousands):
| Effective Date |
Termination Date |
Counterparty |
Notional Amount | Fixed Rate (1) | ||||||||
| September 1, 2026 |
January 1, 2027 | KeyBank | $ | 92,500 | 1.7980 | % | ||||||
|
|
|
|
|
|||||||||
| (1) | The floating rate option for the interest rate swaps is Adjusted SOFR. As of December 31, 2023, Adjusted SOFR was 5.459%. |
| (2) | Represents the weighted average fixed rate of the forward interest rate swaps. |
| NXRT.NEXPOINT.COM | Page 30 |
NEXPOINT RESIDENTIAL TRUST, INC. [NYSE:NXRT]
Interest Rate Cap Agreements
As of December 31, 2023, the Company had the following interest rate caps outstanding that are not designated as cash flow hedges of interest rate risk (dollars in thousands):
| Properties |
Type |
Maturity Date |
Notional | Strike Rate | ||||||||||||||||||||
| Residences at Glenview Reserve |
Floating | 10/1/2024 | $ | 25,645 | 4.81% | (1) | ||||||||||||||||||
| Timber Creek |
Floating | 10/1/2024 | 24,100 | 4.99% | (1) | |||||||||||||||||||
| Brandywine I & II |
Floating | 10/1/2024 | 43,835 | 6.82% | ||||||||||||||||||||
| Radbourne Lake |
Floating | 10/1/2024 | 20,000 | 6.46% | ||||||||||||||||||||
| Summers Landing |
Floating | 10/1/2024 | 10,109 | 6.07% | ||||||||||||||||||||
| Versailles II |
Floating | 10/1/2024 | 12,061 | 6.82% | ||||||||||||||||||||
| The Verandas at Lake Norman |
Floating | 7/1/2024 | 34,925 | 3.40% | (1) | |||||||||||||||||||
| Creekside at Matthews |
Floating | 7/1/2024 | 31,900 | 4.40% | (1) | |||||||||||||||||||
| Six Forks Station |
Floating | 10/1/2024 | 41,180 | 4.00% | (1) | |||||||||||||||||||
| High House at Cary |
Floating | 1/1/2025 | 46,625 | 2.74% | (1) | |||||||||||||||||||
| Estates on Maryland |
Floating | 4/1/2025 | 43,157 | 3.91% | (1) | |||||||||||||||||||
| The Adair |
Floating | 4/1/2025 | 35,115 | 3.91% | (1) | |||||||||||||||||||
| Rockledge Apartments |
Floating | 12/1/2025 | 93,129 | 6.45% | ||||||||||||||||||||
| The Preserve at Terrell Mill |
Floating | 12/1/2025 | 71,098 | 6.45% | ||||||||||||||||||||
| Fairways at San Marcos |
Floating | 12/1/2025 | 60,228 | 6.70% | ||||||||||||||||||||
| Bloom |
Floating | 12/1/2025 | 59,830 | 6.70% | ||||||||||||||||||||
| Atera Apartments |
Floating | 12/1/2025 | 46,198 | 6.45% | ||||||||||||||||||||
| Silverbrook |
Floating | 12/1/2025 | 46,088 | 6.45% | ||||||||||||||||||||
| Torreyana Apartments |
Floating | 12/1/2025 | 50,580 | 6.70% | ||||||||||||||||||||
| Cornerstone |
Floating | 12/1/2025 | 46,804 | 6.66% | ||||||||||||||||||||
| Versailles |
Floating | 12/1/2025 | 40,247 | 6.45% | ||||||||||||||||||||
| Bella Solara |
Floating | 12/1/2025 | 40,328 | 6.70% | ||||||||||||||||||||
| Courtney Cove |
Floating | 12/1/2025 | 36,146 | 6.70% | ||||||||||||||||||||
| Madera Point |
Floating | 12/1/2025 | 34,457 | 6.70% | ||||||||||||||||||||
| Creekside at Matthews |
Floating | 12/1/2025 | 29,648 | 6.45% | ||||||||||||||||||||
| Parc500 |
Floating | 12/1/2025 | 29,416 | 6.45% | ||||||||||||||||||||
| Seasons 704 Apartments |
Floating | 12/1/2025 | 33,132 | 6.70% | ||||||||||||||||||||
| The Summit at Sabal Park |
Floating | 12/1/2025 | 30,826 | 6.70% | ||||||||||||||||||||
| Cutter’s Point |
Floating | 12/1/2025 | 21,524 | 6.45% | ||||||||||||||||||||
| Venue at 8651 |
Floating | 12/1/2025 | 18,690 | 6.45% | ||||||||||||||||||||
| The Heritage |
Floating | 2/1/2024 | 24,625 | 5.18% | (1) | |||||||||||||||||||
| The Enclave |
Floating | 2/1/2024 | 25,322 | 5.18% | (1) | |||||||||||||||||||
| Bella Vista |
Floating | 2/1/2024 | 29,040 | 5.18% | (1) | |||||||||||||||||||
| Sabal Palm at Lake Buena Vista |
Floating | 9/1/2024 | 42,100 | 6.20% | ||||||||||||||||||||
| Arbors on Forest Ridge |
Floating | 12/1/2025 | 19,184 | 6.70% | ||||||||||||||||||||
| Venue on Camelback |
Floating | 2/1/2026 | 42,788 | 6.07% | ||||||||||||||||||||
|
|
|
|
|
|
||||||||||||||||||||
| $ | 1,340,080 | 5.90% | ||||||||||||||||||||||
|
|
|
|
|
|
||||||||||||||||||||
| (1) | As of December 31, 2023, these properties have rate caps that are below the 30-Day Average SOFR rate of 5.344%. |
| NXRT.NEXPOINT.COM | Page 31 |
NEXPOINT RESIDENTIAL TRUST, INC. [NYSE:NXRT]
Debt Maturity Schedule
The following table summarizes our contractual obligations and commitments as of December 31, 2023 for the next five calendar years subsequent to December 31, 2023 and thereafter. We used the applicable reference rate as of December 31, 2023 to calculate interest expense due by period on our floating rate debt and net interest expense due by period on our interest rate swaps.
| Payments Due by Period (in thousands) | ||||||||||||||||||||||||||||||||
| Total | 2024 | 2025 | 2026 | 2027 | 2028 | Thereafter | ||||||||||||||||||||||||||
| Operating Properties Mortgage Debt |
||||||||||||||||||||||||||||||||
| Principal payments |
$ | 1,463,076 | $ | 292 | $ | 133,388 | $ | 290,324 | $ | — | $ | 80,641 | $ | 958,431 | ||||||||||||||||||
| Interest expense |
(1 | ) | 538,777 | 52,170 | 61,158 | 59,280 | 72,975 | 71,072 | 222,122 | |||||||||||||||||||||||
|
|
|
|
|
|
|
|
|
|
|
|
|
|
|
|
|
|
|
|
|
| ||||||||||||
| Total |
$ | 2,001,853 | $ | 52,462 | $ | 194,546 | $ | 349,604 | $ | 72,975 | $ | 151,713 | $ | 1,180,553 | ||||||||||||||||||
|
|
||||||||||||||||||||||||||||||||
|
|
||||||||||||||||||||||||||||||||
| Held For Sale Properties Mortgage Debt |
||||||||||||||||||||||||||||||||
| Principal payments |
$ | 88,160 | $ | 68,160 | $ | 20,000 | $ | — | $ | — | $ | — | $ | — | ||||||||||||||||||
| Interest expense |
4,784 | 3,778 | 1,006 | — | — | — | — | |||||||||||||||||||||||||
|
|
|
|
|
|
|
|
|
|
|
|
|
|
|
|
|
|
|
|
|
| ||||||||||||
| Total |
$ | 92,944 | $ | 71,938 | $ | 21,006 | $ | — | $ | — | $ | — | $ | — | ||||||||||||||||||
|
|
||||||||||||||||||||||||||||||||
| Credit Facility |
||||||||||||||||||||||||||||||||
| Principal payments |
$ | 24,000 | $ | — | $ | 24,000 | $ | — | $ | — | $ | — | $ | — | ||||||||||||||||||
| Interest expense |
2,770 | 1,857 | 913 | — | — | — | — | |||||||||||||||||||||||||
|
|
|
|
|
|
|
|
|
|
|
|
|
|
|
|
|
|
|
|
|
| ||||||||||||
| Total |
$ | 26,770 | $ | 1,857 | $ | 24,913 | $ | — | $ | — | $ | — | $ | — | ||||||||||||||||||
|
|
||||||||||||||||||||||||||||||||
|
|
|
|
|
|
|
|
|
|
|
|
|
|
|
|
|
|
|
|
|
| ||||||||||||
| Total contractual obligations and commitments |
$ | 2,121,567 | $ | 126,257 | $ | 240,465 | $ | 349,604 | $ | 72,975 | $ | 151,713 | $ | 1,180,553 | ||||||||||||||||||
|
|
|
|
|
|
|
|
|
|
|
|
|
|
|
|
|
|
|
|
|
| ||||||||||||
| (1) | Interest expense obligations includes the impact of expected settlements on interest rate swaps which have been entered into in order to fix the interest rate on the hedged portion of our floating rate debt obligations. As of December 31, 2023, we had entered into 10 interest rate swap transactions with a combined notional amount of $1.2 billion. We have allocated the total impact of expected settlements on the $1.2 billion notional amount of interest rate swaps to ‘Operating Properties Mortgage Debt.’ We used Adjusted SOFR as of December 31, 2023 to determine our expected settlements through the terms of the interest rate swaps. |
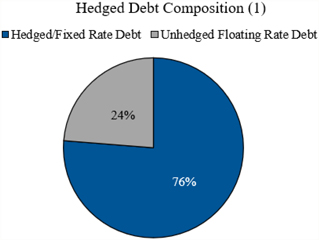
|
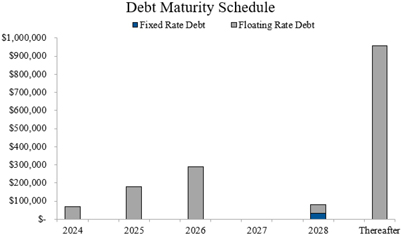
|
| (1) | As of December 31, 2023, we had total indebtedness of $1.6 billion at an adjusted weighted average interest rate of 6.91%, of which $1.5 billion was debt with a floating interest rate. The interest rate swap agreements we have entered into effectively fix the interest rate on $1.2 billion, or 77%, of our $1.5 billion of floating rate mortgage debt outstanding. For purposes of calculating the adjusted weighted average interest rate of the total indebtedness, we have included the weighted average fixed rate of 1.0682% for Adjusted SOFR on the $1.2 billion notional amount of interest rate swap agreements that we have entered into as of December 31, 2023, which effectively fix the interest rate on $1.2 billion of our floating rate mortgage debt outstanding. |
| NXRT.NEXPOINT.COM | Page 32 |
NEXPOINT RESIDENTIAL TRUST, INC. [NYSE:NXRT]
Historical Acquisition Details
(in thousands, except for unit and per unit amounts)
|
Property Name (1) |
Location |
Units | Transaction Date | Purchase Price | Rehab Budget (2) | Total Investment | Per Unit | |||||||||||||||||||
| Arbors on Forest Ridge |
Bedford, TX | 210 | 1/31/2014 | $12,805 | $1,449 | $14,254 | $67,876 | |||||||||||||||||||
| Cutter’s Point |
Richardson, TX | 196 | 1/31/2014 | 15,845 | 1,379 | 17,224 | 87,878 | |||||||||||||||||||
| The Summit at Sabal Park |
Tampa, FL | 252 | 8/20/2014 | 19,050 | 1,655 | 20,705 | 82,163 | |||||||||||||||||||
| Courtney Cove |
Tampa, FL | 324 | 8/20/2014 | 18,950 | 1,635 | 20,585 | 63,534 | |||||||||||||||||||
| Radbourne Lake |
Charlotte, NC | 225 | 9/30/2014 | 24,250 | 1,437 | 25,687 | 114,164 | |||||||||||||||||||
| Sabal Palm at Lake Buena Vista |
Orlando, FL | 400 | 11/5/2014 | 49,500 | 1,346 | 50,846 | 127,115 | |||||||||||||||||||
| Cornerstone |
Orlando, FL | 430 | 1/15/2015 | 31,550 | 2,610 | 34,160 | 79,442 | |||||||||||||||||||
| The Preserve at Terrell Mill |
Marietta, GA | 752 | 2/6/2015 | 58,000 | 6,688 | 64,688 | 86,021 | |||||||||||||||||||
| Versailles |
Dallas, TX | 388 | 2/26/2015 | 26,165 | 3,997 | 30,162 | 77,737 | |||||||||||||||||||
| Seasons 704 Apartments |
West Palm Beach, FL | 222 | 4/15/2015 | 21,000 | 1,900 | 22,900 | 103,153 | |||||||||||||||||||
| Madera Point |
Mesa, AZ | 256 | 8/5/2015 | 22,525 | 1,808 | 24,333 | 95,051 | |||||||||||||||||||
| Venue at 8651 |
Fort Worth, TX | 333 | 10/30/2015 | 19,250 | 4,626 | 23,876 | 71,700 | |||||||||||||||||||
| Parc500 |
West Palm Beach, FL | 217 | 7/27/2016 | 22,421 | 5,082 | 27,503 | 126,742 | |||||||||||||||||||
| The Venue on Camelback |
Phoenix, AZ | 415 | 10/11/2016 | 44,600 | 6,018 | 50,618 | 121,971 | |||||||||||||||||||
| Old Farm |
Houston, TX | 734 | 12/29/2016 | 84,721 | 1,135 | 85,856 | 116,970 | |||||||||||||||||||
| Stone Creek at Old Farm |
Houston, TX | 190 | 12/29/2016 | 23,332 | 462 | 23,794 | 125,232 | |||||||||||||||||||
| Rockledge Apartments |
Marietta, GA | 708 | 6/30/2017 | 113,500 | 7,685 | 121,185 | 171,165 | |||||||||||||||||||
| Atera Apartments |
Dallas, TX | 380 | 10/25/2017 | 59,200 | 3,721 | 62,921 | 165,582 | |||||||||||||||||||
| Versailles II |
Dallas, TX | 242 | 9/26/2018 | 24,680 | 2,843 | 27,523 | 113,731 | |||||||||||||||||||
| Brandywine I & II |
Nashville, TN | 632 | 9/26/2018 | 79,800 | 7,787 | 87,587 | 138,587 | |||||||||||||||||||
| Bella Vista |
Phoenix, AZ | 248 | 1/28/2019 | 48,400 | 3,414 | 51,814 | 208,927 | |||||||||||||||||||
| The Enclave |
Tempe, AZ | 204 | 1/28/2019 | 41,800 | 2,608 | 44,408 | 217,686 | |||||||||||||||||||
| The Heritage |
Phoenix, AZ | 204 | 1/28/2019 | 41,900 | 2,660 | 44,560 | 218,431 | |||||||||||||||||||
| Summers Landing |
Fort Worth, TX | 196 | 6/7/2019 | 19,396 | 2,980 | 22,376 | 114,163 | |||||||||||||||||||
| Residences at Glenview Reserve |
Nashville, TN | 360 | 7/17/2019 | 45,000 | 5,695 | 50,695 | 140,819 | |||||||||||||||||||
| Residences at West Place |
Orlando, FL | 342 | 7/17/2019 | 55,000 | 4,129 | 59,129 | 172,892 | |||||||||||||||||||
| Avant at Pembroke Pines |
Pembroke Pines, FL | 1,520 | 8/30/2019 | 322,000 | 32,583 | 354,583 | 233,278 | |||||||||||||||||||
| Arbors of Brentwood |
Nashville, TN | 346 | 9/10/2019 | 62,250 | 4,248 | 66,498 | 192,191 | |||||||||||||||||||
| Torreyana Apartments |
Las Vegas, NV | 316 | 11/22/2019 | 68,000 | 2,771 | 70,771 | 223,959 | |||||||||||||||||||
| Bloom |
Las Vegas, NV | 528 | 11/22/2019 | 106,500 | 4,786 | 111,286 | 210,769 | |||||||||||||||||||
| Bella Solara |
Las Vegas, NV | 320 | 11/22/2019 | 66,500 | 3,642 | 70,142 | 219,194 | |||||||||||||||||||
| Fairways at San Marcos |
Chandler, AZ | 352 | 11/2/2020 | 84,480 | 4,366 | 88,846 | 252,403 | |||||||||||||||||||
| The Verandas at Lake Norman |
Charlotte, NC | 264 | 6/30/2021 | 63,500 | 4,628 | 68,128 | 258,061 | |||||||||||||||||||
| Creekside at Matthews |
Charlotte, NC | 240 | 6/30/2021 | 58,000 | 3,943 | 61,943 | 258,096 | |||||||||||||||||||
| Six Forks Station |
Raleigh, NC | 323 | 9/10/2021 | 74,760 | 6,431 | 81,191 | 251,365 | |||||||||||||||||||
| Hudson High House |
Cary, NC | 302 | 12/7/2021 | 93,250 | 1,677 | 94,927 | 314,328 | |||||||||||||||||||
| The Adair |
Sandy Springs, GA | 232 | 4/1/2022 | 65,500 | 5,390 | 70,890 | 305,560 | |||||||||||||||||||
| Estates on Maryland |
Phoenix, AZ | 330 | 4/1/2022 | 77,900 | 4,636 | 82,536 | 250,109 | |||||||||||||||||||
|
|
|
|
|
|
|
|
|
|
|
|
||||||||||||||||
| Total/Weighted Average |
14,133 | $ | 2,165,280 | $165,850 | $ | 2,331,130 | $ | 164,942 | ||||||||||||||||||
|
|
|
|
|
|
|
|
|
|
|
|
||||||||||||||||
| (1) | Only includes properties owned as of December 31, 2023. |
| (2) | Includes interior and exterior rehab. |
| NXRT.NEXPOINT.COM | Page 33 |
NEXPOINT RESIDENTIAL TRUST, INC. [NYSE:NXRT]
Historical Disposition Details
(in thousands, except unit and per unit amounts)
| Property Name |
Location |
Units | Purchase Price |
Sale Price |
Sales Price Per Unit |
Sale Date | Net Cash Proceeds (1) |
Gain on Sale |
||||||||||||||||||||||
| Meridian |
Austin, TX | 200 | $ | 12,300 | $ | 17,250 | $ | 86,250 | 5/10/2016 | $ | 16,981 | $ | 4,786 | |||||||||||||||||
| Park at Regency and Mandarin Reserve |
Jacksonville, FL | 679 | 34,500 | 47,000 | 69,219 | 6/6/2016 | 46,239 | 11,584 | ||||||||||||||||||||||
| Park at Blanding and Colonial Forest |
Jacksonville, FL | 291 | 12,000 | 14,500 | 49,828 | 8/31/2016 | 14,259 | 2,007 | ||||||||||||||||||||||
| Willowdale Crossings |
Frederick, MD | 432 | 41,000 | 45,200 | 104,630 | 9/15/2016 | 44,439 | 5,576 | ||||||||||||||||||||||
| Jade Park |
Dayton Beach, FL | 144 | 7,800 | 10,000 | 69,444 | 9/30/2016 | 9,868 | 1,979 | ||||||||||||||||||||||
| The Miramar Apartments |
Dallas, TX | 314 | 8,875 | 16,550 | 52,707 | 4/3/2017 | 16,326 | 6,368 | ||||||||||||||||||||||
| Toscana |
Dallas, TX | 192 | 8,875 | 13,250 | 69,010 | 4/3/2017 | 13,040 | 4,283 | ||||||||||||||||||||||
| The Grove at Alban |
Frederick, MD | 290 | 23,050 | 27,500 | 94,828 | 4/3/2017 | 27,021 | 4,514 | ||||||||||||||||||||||
| Twelve 6 Ten at the Park |
Dallas, TX | 402 | 20,984 | 26,600 | 66,169 | 4/27/2017 | 26,349 | 4,731 | ||||||||||||||||||||||
| Regatta Bay |
Seabrook, TX | 240 | 18,200 | 28,200 | 117,500 | 7/14/2017 | 27,670 | 10,423 | ||||||||||||||||||||||
| NAVA Portfolio (2) |
Atlanta, GA | 1,100 | 66,200 | 116,000 | 105,455 | 9/27/2017 | 114,010 | 48,046 | ||||||||||||||||||||||
| Timberglen |
Dallas, TX | 304 | 16,950 | 30,000 | 98,684 | 1/31/2018 | 29,553 | 13,742 | ||||||||||||||||||||||
| Edgewater at Sandy Springs |
Atlanta, GA | 760 | 58,000 | 101,250 | 133,224 | 8/28/2019 | 100,219 | 47,329 | ||||||||||||||||||||||
| Belmont at Duck Creek |
Garland, TX | 240 | 18,525 | 29,500 | 122,917 | 8/28/2019 | 29,148 | 11,985 | ||||||||||||||||||||||
| The Ashlar |
Dallas, TX | 264 | 16,235 | 29,400 | 111,364 | 8/28/2019 | 29,050 | 13,205 | ||||||||||||||||||||||
| Heatherstone |
Dallas, TX | 152 | 9,450 | 16,275 | 107,072 | 8/28/2019 | 16,054 | 6,368 | ||||||||||||||||||||||
| The Pointe at the Foothills |
Mesa, AZ | 528 | 52,275 | 85,400 | 161,742 | 8/28/2019 | 84,663 | 37,925 | ||||||||||||||||||||||
| Abbington Heights |
Antioch, TN | 274 | 17,900 | 28,050 | 102,372 | 8/30/2019 | 27,630 | 10,888 | ||||||||||||||||||||||
| Southpoint Reserve at Stoney Creek |
Fredericksburg, VA | 156 | 17,000 | 23,500 | 150,641 | 3/20/2020 | 23,176 | 5,469 | ||||||||||||||||||||||
| Willow Grove |
Nashville, TN | 244 | 13,750 | 31,300 | 128,279 | 3/26/2020 | 31,005 | 17,513 | ||||||||||||||||||||||
| Woodbridge |
Nashville, TN | 220 | 16,000 | 31,700 | 144,091 | 3/26/2020 | 31,237 | 15,990 | ||||||||||||||||||||||
| Eagle Crest |
Irving, TX | 447 | 27,325 | 55,500 | 124,161 | 9/30/2020 | 54,779 | 30,160 | ||||||||||||||||||||||
| Beechwood Terrace |
Antioch, TN | 300 | 21,400 | 53,600 | 178,667 | 11/1/2021 | 53,003 | 33,960 | ||||||||||||||||||||||
| Cedar Pointe |
Antioch, TN | 210 | 26,500 | 37,650 | 179,286 | 11/1/2021 | 37,231 | 12,252 | ||||||||||||||||||||||
| Hollister Place |
Houston, TX | 260 | 24,500 | 36,750 | 141,346 | 12/29/2022 | 36,455 | 14,684 | ||||||||||||||||||||||
| Silverbrook |
Grand Prairie, TX | 642 | 30,400 | 70,000 | 109,034 | 9/22/2023 | 69,431 | 43,107 | ||||||||||||||||||||||
| Timber Creek |
Charlotte, NC | 352 | 22,750 | 49,000 | 139,205 | 12/13/2023 | 48,348 | 24,819 | ||||||||||||||||||||||
|
|
|
|
|
|
|
|
|
|
|
|
|
|
||||||||||||||||||
| Total/Weighted Average |
9,637 | $ | 642,744 | $ | 1,070,925 | $ | 111,126 | $ | 1,057,184 | $ | 443,693 | |||||||||||||||||||
|
|
|
|
|
|
|
|
|
|
|
|
|
|
||||||||||||||||||
| (1) | Represents sales price, net of closing costs. |
| (2) | The NAVA Portfolio consists of The Arbors, The Crossings, The Crossings at Holcomb Bridge and The Knolls. |
| NXRT.NEXPOINT.COM | Page 34 |
NEXPOINT RESIDENTIAL TRUST, INC. [NYSE:NXRT]
Definitions and Reconciliations of Non-GAAP Measures
Definitions
This presentation contains non-GAAP financial measures. A “non-GAAP financial measure” is defined as a numerical measure of a company’s financial performance that excludes or includes amounts so as to be different than the most directly comparable measure calculated and presented in accordance with GAAP in the statements of income, balance sheets or statements of cash flows of the Company. The non-GAAP financial measures used within this presentation are net operating income (“NOI”), funds from operations attributable to common stockholders (“FFO”), FFO per diluted share, Core FFO, Core FFO per diluted share, adjusted FFO (“AFFO”), AFFO per diluted share and net debt.
NOI is used by investors and our management to evaluate and compare the performance of our properties to other comparable properties, to determine trends in earnings and to compute the fair value of our properties. NOI is calculated by adjusting net income (loss) to add back (1) interest expense (2) advisory and administrative fees, (3) the impact of : (a) depreciation and amortization expenses and (b) gains or losses from the sale of operating real estate assets that are included in net income computed in accordance with GAAP, (4) corporate general and administrative expenses, (5) other gains and losses that are specific to us including loss on extinguishment of debt and modification costs, (6) casualty-related expenses/(recoveries) and casualty gains (losses), (7) gain on forfeited deposits, (8) equity in earnings from affiliate and (9) property general and administrative expenses that are not reflective of the continuing operations of the properties or are incurred on behalf of the Company at the property for expenses such as legal, professional, centralized leasing service and franchise tax fees. We define “Same Store NOI” as NOI for our properties that are comparable between periods. We view Same Store NOI as an important measure of the operating performance of our properties because it allows us to compare operating results of properties owned for the entirety of the current and comparable periods and therefore eliminates variations caused by acquisitions or dispositions during the periods.
FFO is defined by the National Association of Real Estate Investment Trusts (“NAREIT”), as net income (loss) computed in accordance with GAAP, excluding gains or losses from real estate dispositions, plus real estate depreciation and amortization. We compute FFO in accordance with NAREIT’s definition. Our presentation differs slightly in that we begin with net income (loss) before adjusting for amounts attributable to redeemable noncontrolling interests in the OP and we show the combined amounts attributable to such noncontrolling interests as an adjustment to arrive at FFO attributable to common stockholders.
Core FFO makes certain adjustments to FFO, which are either not likely to occur on a regular basis or are otherwise not representative of the ongoing operating performance of our Portfolio. Core FFO adjusts FFO to remove items such as losses on extinguishment of debt and modification costs (includes prepayment penalties and defeasance costs incurred on the early payment of debt, the write-off of unamortized deferred financing costs and fair market value adjustments of assumed debt related to the retirement of debt, costs incurred in connection with a debt modification that are not capitalized as deferred financing costs and other costs incurred in a debt extinguishment that are expensed), casualty-related expenses/and recoveries and gains (losses), gain on forfeited deposits, the amortization of deferred financing costs incurred in connection with obtaining short-term debt financing, and the noncontrolling interests (as described above) related to these items.
AFFO makes certain adjustments to Core FFO in order to arrive at a more refined measure of the operating performance of our portfolio. There is no industry standard definition of AFFO and practice is divergent across the industry. AFFO adjusts Core FFO to remove items such as equity-based compensation expense and the amortization of deferred financing costs incurred in connection with obtaining long-term debt financing, and the noncontrolling interests related to these items.
Net debt is calculated by subtracting cash and cash equivalents and restricted cash held for value-add upgrades and green improvements from total debt outstanding.
We believe that the use of NOI, FFO, Core FFO, AFFO and net debt, combined with the required GAAP presentations, improves the understanding of operating results and debt levels of real estate investment trusts (“REITs”) among investors and makes comparisons of operating results and debt levels among such companies more meaningful. While NOI, FFO, Core FFO, AFFO and net debt are relevant and widely used measures of operating performance and debt levels of REITs, they do not represent cash flows from operations, net income (loss) or total debt as defined by GAAP and should not be considered an alternative to those measures in evaluating our liquidity, operating performance and debt levels. NOI, FFO, Core FFO and AFFO do not purport to be indicative of cash available to fund our future cash requirements. We present net debt because we believe it provides our investors a better understanding of our leverage ratio. Net debt should not be considered an alternative to total debt, as we may not always be able to use our available cash to repay debt. Our computation of NOI, FFO, Core FFO, AFFO and net debt may not be comparable to NOI, FFO, Core FFO, AFFO and net debt reported by other REITs. For a more complete discussion of NOI, FFO, Core FFO and AFFO, see our most recent Annual Report on Form 10-K and our other filings with the SEC.
| NXRT.NEXPOINT.COM | Page 35 |
NEXPOINT RESIDENTIAL TRUST, INC. [NYSE:NXRT]
Reconciliations
Reconciliation of Debt to Net Debt
| (dollar amounts in thousands) | FY 2023 | FY 2022 | FY 2021 | |||||||||
| Total mortgage debt |
$ | 1,551,236 | $ | 1,607,028 | $ | 1,281,146 | ||||||
| Credit facilities |
24,000 | 74,500 | 280,000 | |||||||||
|
|
|
|
|
|
|
|||||||
| Total Debt |
1,575,236 | 1,681,528 | 1,561,146 | |||||||||
| Adjustments to arrive at net debt: |
||||||||||||
| Cash and cash equivalents |
(12,367 | ) | (16,762 | ) | (49,450 | ) | ||||||
| Restricted cash held for value-add upgrades and green improvements |
(2,929 | ) | (11,894 | ) | (11,875 | ) | ||||||
|
|
|
|
|
|
|
|||||||
| Net Debt |
$ | 1,559,940 | $ | 1,652,872 | $ | 1,499,821 | ||||||
|
|
|
|
|
|
|
|||||||
| Enterprise Value (1) |
$ | 2,443,940 | $ | 2,764,872 | $ | 3,637,821 | ||||||
| Leverage Ratio |
64 | % | 60 | % | 41 | % | ||||||
| (1) | Enterprise Value is calculated as Market Capitalization as of December 31, 2023 plus Net Debt. |
Guidance Reconciliations of NOI, Same Store NOI, FFO, Core FFO and AFFO
The following table, which has not been adjusted for the effects of noncontrolling interests, reconciles our 2024 NOI guidance to our net income (the most directly comparable GAAP financial measure) guidance for the year ended December 31, 2024 and for the three months ended March 31, 2024 (in thousands):
| For the Year Ended December 31, 2024 |
For the Three Months Ended March 31, 2024 |
|||||||||||
| Mid-Point (1) | Mid-Point (1) | |||||||||||
| Net income |
$ | 18,524 | $ | 22,434 | ||||||||
| Adjustments to reconcile net loss to NOI: |
||||||||||||
| Advisory and administrative fees |
7,675 | 1,908 | ||||||||||
| Corporate general and administrative expenses |
18,135 | 4,128 | ||||||||||
| Property general and administrative expenses |
(2 | ) | 4,818 | 1,206 | ||||||||
| Depreciation and amortization |
99,126 | 25,767 | ||||||||||
| Interest expense |
57,140 | 14,670 | ||||||||||
| Loss on extinguishment of debt and modification costs |
805 | 550 | ||||||||||
| Equity in earnings of affiliate |
(240 | ) | (60 | ) | ||||||||
| Gain on sales of real estate |
(49,427 | ) | (30,243 | ) | ||||||||
|
|
|
|
|
|||||||||
| NOI |
(3 | ) | $ | 156,556 | $ | 40,360 | ||||||
|
|
|
|
|
|||||||||
| Less Non-Same Store |
||||||||||||
| Revenues |
(4 | ) | (7,016 | ) | ||||||||
| Operating expenses |
(4 | ) | 3,194 | |||||||||
|
|
|
|||||||||||
| Same Store NOI |
(4 | ) | $ | 152,734 | ||||||||
|
|
|
|||||||||||
| (1) | Mid-Point estimates shown for full year and first quarter 2024 guidance. Assumptions made for full year and first quarter 2024 NOI guidance include the Same Store operating growth projections included in the “2024 Full Year Guidance Summary” section of this release and the effect of the acquisition and dispositions throughout the fiscal year. |
| (2) | Adjustment to net income to exclude certain property general and administrative expenses that are not reflective of the continuing operations of the properties or are incurred on our behalf at the property for expenses such as legal, professional, centralized leasing service and franchise tax fees. |
| (3) | FY 2024 NOI Guidance considers the forecast dispositions of Old Farm, Stone Creek at Old Farm and Radbourne Lake, and considers a commensurate volume of capital recycling. |
| (4) | Year-over-year growth for the Full Year 2024 pro forma Same Store pool (35 properties). |
| NXRT.NEXPOINT.COM | Page 36 |
NEXPOINT RESIDENTIAL TRUST, INC. [NYSE:NXRT]
The following table reconciles our FFO, Core FFO and AFFO guidance to our net income (the most directly comparable GAAP financial measure) guidance for the year ended December 31, 2024 (in thousands, except per share data):
| For the Year Ended December 31, 2024 |
||||
| Mid-Point | ||||
| Net income |
$ | 18,524 | ||
| Depreciation and amortization |
99,126 | |||
| Gain on sales of real estate |
(49,427 | ) | ||
| Adjustment for noncontrolling interests |
(297 | ) | ||
|
|
|
|||
| FFO attributable to common stockholders |
67,926 | |||
|
|
|
|||
| FFO per share - diluted (1) |
$ | 2.66 | ||
|
|
|
|||
| Loss on extinguishment of debt and modification costs |
805 | |||
| Amortization of deferred financing costs - acquisition term notes |
872 | |||
| Adjustment for noncontrolling interests |
(3 | ) | ||
|
|
|
|||
| Core FFO attributable to common stockholders |
69,600 | |||
|
|
|
|||
| Core FFO per share - diluted (1) |
$ | 2.72 | ||
|
|
|
|||
| Amortization of deferred financing costs - long term debt |
1,656 | |||
| Equity-based compensation expense |
10,395 | |||
| Adjustment for noncontrolling interests |
(48 | ) | ||
|
|
|
|||
| AFFO attributable to common stockholders |
81,603 | |||
|
|
|
|||
| AFFO per share - diluted (1) |
$ | 3.19 | ||
|
|
|
|||
| Weighted average common shares outstanding - diluted |
25,559 | |||
| (1) | For purposes of calculating per share data, we assume a weighted average diluted share count of approximately 25.6 million for the full year 2024. |
The following table reconciles our NOI to our net income (loss) for the years ended December 31, 2020, 2019, 2018, 2017, 2016 and 2015 (in thousands):
| For the Year Ended December 31, | ||||||||||||||||||||||||
| 2020 | 2019 | 2018 | 2017 | 2016 | 2015 | |||||||||||||||||||
| Net income (loss) |
$ | 44,150 | $ | 99,438 | $ | (1,614 | ) | $ | 56,359 | $ | 25,888 | $ | (10,992 | ) | ||||||||||
| Adjustments to reconcile net income (loss) to NOI: |
||||||||||||||||||||||||
| Advisory and administrative fees |
7,670 | 7,500 | 7,474 | 7,419 | 6,802 | 5,565 | ||||||||||||||||||
| Corporate general and administrative expenses |
10,035 | 9,613 | 7,808 | 6,275 | 4,014 | 2,455 | ||||||||||||||||||
| Casualty-related expenses/(recoveries) |
789 | (34 | ) | (663 | ) | (287 | ) | 151 | 25 | |||||||||||||||
| Casualty losses |
(5,886 | ) | 3,488 | — | — | — | — | |||||||||||||||||
| Property general and administrative expenses |
2,400 | 1,939 | 1,294 | 1,130 | 879 | 1,109 | ||||||||||||||||||
| Depreciation and amortization |
82,411 | 69,086 | 47,470 | 48,752 | 35,643 | 40,801 | ||||||||||||||||||
| Interest expense |
44,753 | 37,385 | 28,572 | 29,576 | 20,167 | 17,817 | ||||||||||||||||||
| Loss on extinguishment of debt and modification costs |
1,470 | 2,869 | 3,576 | 5,719 | 1,722 | 652 | ||||||||||||||||||
| Gain on sales of real estate |
(69,151 | ) | (127,684 | ) | (13,742 | ) | (78,365 | ) | (25,932 | ) | — | |||||||||||||
| Acquisition costs |
— | — | — | — | 386 | 2,975 | ||||||||||||||||||
|
|
|
|
|
|
|
|
|
|
|
|
|
|||||||||||||
| NOI |
$ | 118,641 | $ | 103,600 | $ | 80,175 | $ | 76,578 | $ | 69,720 | $ | 60,407 | ||||||||||||
|
|
|
|
|
|
|
|
|
|
|
|
|
|||||||||||||
| NXRT.NEXPOINT.COM | Page 37 |
NEXPOINT RESIDENTIAL TRUST, INC. [NYSE:NXRT]
The following table reconciles our FFO, Core FFO and AFFO to our net income (loss) for the years ended December 31, 2020, 2019, 2018, 2017, 2016 and 2015 (in thousands):
| For the Year Ended December 31, | ||||||||||||||||||||||||
| 2020 | 2019 | 2018 | 2017 | 2016 | 2015 | |||||||||||||||||||
| Net income (loss) |
$ | 44,150 | $ | 99,438 | $ | (1,614 | ) | $ | 56,359 | $ | 25,888 | $ | (10,992 | ) | ||||||||||
| Depreciation and amortization |
82,411 | 69,086 | 47,470 | 48,752 | 35,643 | 40,801 | ||||||||||||||||||
| Gain on sales of real estate |
(69,151 | ) | (127,684 | ) | (13,742 | ) | (78,365 | ) | (25,932 | ) | — | |||||||||||||
| Adjustment for noncontrolling interests |
(172 | ) | (122 | ) | (96 | ) | (1,695 | ) | (4,583 | ) | (4,170 | ) | ||||||||||||
|
|
|
|
|
|
|
|
|
|
|
|
|
|||||||||||||
| FFO attributable to common stockholders |
57,238 | 40,718 | 32,018 | 25,051 | 31,016 | 25,639 | ||||||||||||||||||
|
|
|
|
|
|
|
|
|
|
|
|
|
|||||||||||||
| FFO per share - basic |
$ | 2.32 | $ | 1.69 | $ | 1.51 | $ | 1.19 | $ | 1.46 | $ | 1.20 | ||||||||||||
|
|
|
|
|
|
|
|
|
|
|
|
|
|||||||||||||
| FFO per share - diluted |
$ | 2.27 | $ | 1.66 | $ | 1.48 | $ | 1.17 | $ | 1.46 | $ | 1.20 | ||||||||||||
|
|
|
|
|
|
|
|
|
|
|
|
|
|||||||||||||
| Acquisition costs |
1,470 | 2,869 | — | — | 386 | 2,975 | ||||||||||||||||||
| Loss on extinguishment of debt and modification costs | 790 | (34 | ) | 3,576 | 5,719 | 1,722 | 652 | |||||||||||||||||
| Casualty-related expenses/(recoveries) |
(5,886 | ) | 3,488 | (663 | ) | — | — | — | ||||||||||||||||
| Change in fair value on derivative instruments - ineffective portion | 510 | — | — | (309 | ) | (1,683 | ) | — | ||||||||||||||||
| Amortization of deferred financing costs - acquisition term notes | 1,384 | 553 | 159 | 403 | — | — | ||||||||||||||||||
| Adjustment for noncontrolling interests |
6 | (21 | ) | (9 | ) | (429 | ) | (94 | ) | (322 | ) | |||||||||||||
|
|
|
|
|
|
|
|
|
|
|
|
|
|||||||||||||
| Core FFO attributable to common stockholders |
55,512 | 47,573 | 35,081 | 30,435 | 31,347 | 28,944 | ||||||||||||||||||
|
|
|
|
|
|
|
|
|
|
|
|
|
|||||||||||||
| Core FFO per share - basic |
$ | 2.25 | $ | 1.97 | $ | 1.66 | $ | 1.45 | $ | 1.48 | $ | 1.36 | ||||||||||||
|
|
|
|
|
|
|
|
|
|
|
|
|
|||||||||||||
| Core FFO per share - diluted |
$ | 2.20 | $ | 1.93 | $ | 1.62 | $ | 1.42 | $ | 1.47 | $ | 1.36 | ||||||||||||
|
|
|
|
|
|
|
|
|
|
|
|
|
|||||||||||||
| Amortization of deferred financing costs - long term debt |
1,453 | 1,530 | 1,491 | 1,592 | 1,423 | 1,081 | ||||||||||||||||||
| Equity-based compensation expense |
5,504 | 5,130 | 4,198 | 3,108 | 825 | — | ||||||||||||||||||
| Adjustment for noncontrolling interests |
(21 | ) | (20 | ) | (17 | ) | (76 | ) | (140 | ) | (92 | ) | ||||||||||||
|
|
|
|
|
|
|
|
|
|
|
|
|
|||||||||||||
| AFFO attributable to common stockholders |
62,448 | 54,213 | 40,753 | 35,059 | 33,455 | 29,933 | ||||||||||||||||||
|
|
|
|
|
|
|
|
|
|
|
|
|
|||||||||||||
| AFFO per share - basic |
$ | 2.53 | $ | 2.25 | $ | 1.92 | $ | 1.66 | $ | 1.58 | $ | 1.41 | ||||||||||||
|
|
|
|
|
|
|
|
|
|
|
|
|
|||||||||||||
| AFFO per share - diluted |
$ | 2.47 | $ | 2.20 | $ | 1.88 | $ | 1.64 | $ | 1.57 | $ | 1.41 | ||||||||||||
|
|
|
|
|
|
|
|
|
|
|
|
|
|||||||||||||
| Weighted average common shares outstanding - basic |
24,715 | 24,116 | 21,189 | 21,057 | 21,232 | 21,294 | ||||||||||||||||||
|
|
|
|
|
|
|
|
|
|
|
|
|
|||||||||||||
| Weighted average common shares outstanding - diluted |
25,234 | 24,593 | 21,667 | 21,399 | 21,314 | 21,294 | ||||||||||||||||||
|
|
|
|
|
|
|
|
|
|
|
|
|
|||||||||||||
| NXRT.NEXPOINT.COM | Page 38 |
Document and Entity Information |
Feb. 20, 2024 |
|---|---|
| Cover [Abstract] | |
| Amendment Flag | false |
| Entity Central Index Key | 0001620393 |
| Document Type | 8-K |
| Document Period End Date | Feb. 20, 2024 |
| Entity Registrant Name | NEXPOINT RESIDENTIAL TRUST, INC. |
| Entity Incorporation State Country Code | MD |
| Entity File Number | 001-36663 |
| Entity Tax Identification Number | 47-1881359 |
| Entity Address, Address Line One | 300 Crescent Court |
| Entity Address, Address Line Two | Suite 700 |
| Entity Address, City or Town | Dallas |
| Entity Address, State or Province | TX |
| Entity Address, Postal Zip Code | 75201 |
| City Area Code | (214) |
| Local Phone Number | 276-6300 |
| Written Communications | false |
| Soliciting Material | false |
| Pre Commencement Tender Offer | false |
| Pre Commencement Issuer Tender Offer | false |
| Security 12b Title | Common Stock, par value $0.01 per share |
| Trading Symbol | NXRT |
| Security Exchange Name | NYSE |
| Entity Emerging Growth Company | false |
1 Year NexPoint Residential Chart |
1 Month NexPoint Residential Chart |

It looks like you are not logged in. Click the button below to log in and keep track of your recent history.
Support: +44 (0) 203 8794 460 | support@advfn.com
By accessing the services available at ADVFN you are agreeing to be bound by ADVFN's Terms & Conditions
 Hot Features