
We could not find any results for:
Make sure your spelling is correct or try broadening your search.
| Share Name | Share Symbol | Market | Type |
|---|---|---|---|
| NNN REIT Inc | NYSE:NNN | NYSE | Common Stock |
| Price Change | % Change | Share Price | High Price | Low Price | Open Price | Shares Traded | Last Trade | |
|---|---|---|---|---|---|---|---|---|
| -0.81 | -1.93% | 41.11 | 41.88 | 41.10 | 41.88 | 522,653 | 00:59:08 |
Maryland | 001-11290 | 56-1431377 | ||
(State or other jurisdiction of incorporation or organization) | (Commission File Number) | (I.R.S. Employment Identification No.) | ||
¨ | Written communications pursuant to Rule 425 under the Securities Act (17 CFR 230.425) |
¨ | Soliciting material pursuant to Rule 14a-12 under the Exchange Act (17 CFR 240.14a-12) |
¨ | Pre-commencement communications pursuant to Rule 14d-2(b) under the Exchange Act (17 CFR 240.14d-2(b)) |
¨ | Pre-commencement communications pursuant to Rule 13e-4(c) under the Exchange Act (17 CFR 240.13e-4(c)) |
Item 2.02. | Results of Operations and Financial Condition. |
Item 9.01. | Financial Statements and Exhibits. |
(d) | Exhibits. |
99.1 | Press Release, dated February 13, 2017, of National Retail Properties, Inc. | ||
99.2 | Supplemental Data, dated February 13, 2017, of National Retail Properties, Inc. | ||
National Retail Properties, Inc. | ||||
Dated: February 13, 2017 | By: | /s/ Kevin B. Habicht | ||
Kevin B. Habicht | ||||
Executive Vice President and Chief Financial Officer | ||||
Exhibit No. | Description | ||
99.1 | Press Release, dated February 13, 2017, of National Retail Properties, Inc. | ||
99.2 | Supplemental Data, dated February 13, 2017, of National Retail Properties, Inc. | ||

• | Revenues and net earnings, FFO, Core FFO and AFFO available to common stockholders and diluted per share amounts: |
Quarter Ended | Year Ended | ||||||||||||||
December 31, | December 31, | ||||||||||||||
2016 | 2015 | 2016 | 2015 | ||||||||||||
(in thousands, except per share data) | |||||||||||||||
Revenues | $ | 141,199 | $ | 126,377 | $ | 533,647 | $ | 482,916 | |||||||
Net earnings available to common stockholders | $ | 54,044 | $ | 33,612 | $ | 200,877 | $ | 162,402 | |||||||
Net earnings per common share | $ | 0.37 | $ | 0.24 | $ | 1.38 | $ | 1.20 | |||||||
FFO available to common stockholders | $ | 88,717 | $ | 67,319 | $ | 330,544 | $ | 289,193 | |||||||
FFO per common share | $ | 0.60 | $ | 0.49 | $ | 2.28 | $ | 2.15 | |||||||
Core FFO available to common stockholders | $ | 88,717 | $ | 76,661 | $ | 340,643 | $ | 299,171 | |||||||
Core FFO per common share | $ | 0.60 | $ | 0.56 | $ | 2.35 | $ | 2.22 | |||||||
AFFO available to common stockholders | $ | 90,285 | $ | 77,953 | $ | 347,933 | $ | 304,772 | |||||||
AFFO per common share | $ | 0.62 | $ | 0.57 | $ | 2.41 | $ | 2.27 | |||||||
• | Portfolio occupancy was 99.0% at December 31, 2016 and September 30, 2016, as compared to 99.1% at December 31, 2015 |
• | Increased annual net earnings per common share 15.0% |
• | Increased annual FFO per common share 6.0% |
• | Increased annual Core FFO per common share 5.9% |
• | Increased annual AFFO per common share 6.2% |
• | Dividend yield of 4.0% at December 31, 2016 |
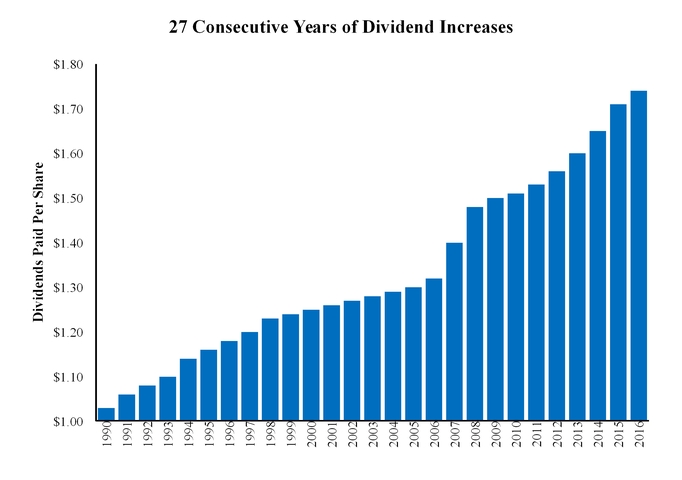
• | Annual dividend per common share increased to $1.78 marking the 27th consecutive year of annual dividend increases - making the company one of only four equity REITs and one of only 94 public companies with 27 or more consecutive annual dividend increases |
• | Maintained high occupancy levels at or above 99.0% for the entire year with a weighted average remaining lease term of 11.6 years |
• | Invested $846.9 million in 313 properties with an aggregate gross leasable area of approximately 2,734,000 square feet at an initial cash yield of 6.9% |
• | Sold 38 properties for $103.2 million, producing $27.1 million of gains on sale, net of noncontrolling interests, at a cap rate of 6.8% |
• | Raised $950.9 million of new long-term capital at attractive pricing |
◦ | Raised $274.0 million in net proceeds from the issuance of 5,903,848 common shares |
◦ | Raised $342.8 million in net proceeds from the issuance of 3.60% senior unsecured notes due 2026 |
◦ | Raised $334.1 million in net proceeds from the issuance of 5.20% Series F preferred stock |
• | Entire $650 million availability on bank credit facility at December 31, 2016 |
• | 99.7% of properties are unencumbered with secured mortgage debt |
• | Total shareholder return of 14.5% for 2016 exceeds industry averages and general equity averages |
• | Total average annual shareholder return of 14.3% over the past 25 years exceeds industry averages and general equity averages |
• | Investments: |
◦ | $250.4 million in property investments, including the acquisition of 64 properties with an aggregate gross leasable area of approximately 698,000 square feet at an initial cash yield of 6.9% |
• | Dispositions: |
◦ | Sold 14 properties with net proceeds of $20.1 million, producing $4.6 million of gains on sales, net of noncontrolling interests, at a cap rate of 7.2% |
• | Long-term capital: |
◦ | Raised $965,000 in net proceeds from the issuance of 22,986 common shares |
◦ | Raised $342.8 million in net proceeds from the issuance of 3.60% senior unsecured notes due 2026 |
◦ | Raised $334.1 million in net proceeds from the issuance of 5.20% Series F preferred stock |
National Retail Properties, Inc. (in thousands, except per share data) (unaudited) | ||||||||||||||||
Quarter Ended | Year Ended | |||||||||||||||
December 31, | December 31, | |||||||||||||||
2016 | 2015 | 2016 | 2015 | |||||||||||||
Income Statement Summary | ||||||||||||||||
Revenues: | ||||||||||||||||
Rental and earned income | $ | 135,947 | $ | 121,106 | $ | 515,954 | $ | 465,282 | ||||||||
Real estate expense reimbursement from tenants | 4,732 | 4,561 | 14,984 | 14,868 | ||||||||||||
Interest and other income from real estate transactions | 128 | 264 | 1,032 | 988 | ||||||||||||
Interest income on commercial mortgage residual interests | 392 | 446 | 1,677 | 1,778 | ||||||||||||
141,199 | 126,377 | 533,647 | 482,916 | |||||||||||||
Operating expenses: | ||||||||||||||||
General and administrative | 9,408 | 9,657 | 36,508 | 34,736 | ||||||||||||
Real estate | 6,555 | 5,575 | 20,852 | 19,776 | ||||||||||||
Depreciation and amortization | 38,987 | 34,848 | 149,101 | 134,798 | ||||||||||||
Impairment – commercial mortgage residual interests valuation | — | 51 | 6,830 | 531 | ||||||||||||
Impairment losses – real estate and other charges, net of recoveries | 338 | 708 | 11,287 | 4,420 | ||||||||||||
55,288 | 50,839 | 224,578 | 194,261 | |||||||||||||
Other expenses (revenues): | ||||||||||||||||
Interest and other income | (62 | ) | (42 | ) | (170 | ) | (109 | ) | ||||||||
Interest expense | 24,429 | 24,548 | 96,352 | 90,008 | ||||||||||||
Real estate acquisition costs | 42 | 33 | 563 | 927 | ||||||||||||
24,409 | 24,539 | 96,745 | 90,826 | |||||||||||||
Income tax expense | — | (9,827 | ) | — | (10,318 | ) | ||||||||||
Earnings before gain on disposition of real estate, net of income tax expense | 61,502 | 41,172 | 212,324 | 187,511 | ||||||||||||
Gain on disposition of real estate, net of income tax expense | 4,624 | 1,305 | 27,182 | 10,450 | ||||||||||||
Earnings including noncontrolling interests | 66,126 | 42,477 | 239,506 | 197,961 | ||||||||||||
Earnings from continuing operations attributable to noncontrolling interests: | (34 | ) | (6 | ) | (6 | ) | (125 | ) | ||||||||
Net earnings attributable to NNN | 66,092 | 42,471 | 239,500 | 197,836 | ||||||||||||
Series D preferred stock dividends | (4,762 | ) | (4,762 | ) | (19,047 | ) | (19,047 | ) | ||||||||
Series E preferred stock dividends | (4,097 | ) | (4,097 | ) | (16,387 | ) | (16,387 | ) | ||||||||
Series F preferred stock dividends | (3,189 | ) | — | (3,189 | ) | — | ||||||||||
Net earnings available to common stockholders | $ | 54,044 | $ | 33,612 | $ | 200,877 | $ | 162,402 | ||||||||
Weighted average common shares outstanding: | ||||||||||||||||
Basic | 146,266 | 137,111 | 144,176 | 133,999 | ||||||||||||
Diluted | 146,763 | 137,623 | 144,661 | 134,489 | ||||||||||||
Net earnings per share available to common stockholders: | ||||||||||||||||
Basic | $ | 0.37 | $ | 0.24 | $ | 1.39 | $ | 1.21 | ||||||||
Diluted | $ | 0.37 | $ | 0.24 | $ | 1.38 | $ | 1.20 | ||||||||
National Retail Properties, Inc. (in thousands, except per share data) (unaudited) | ||||||||||||||||
Quarter Ended | Year Ended | |||||||||||||||
December 31, | December 31, | |||||||||||||||
2016 | 2015 | 2016 | 2015 | |||||||||||||
Funds From Operations (FFO) Reconciliation: | ||||||||||||||||
Net earnings available to common stockholders | $ | 54,044 | $ | 33,612 | $ | 200,877 | $ | 162,402 | ||||||||
Real estate depreciation and amortization: | 38,907 | 34,754 | 148,779 | 134,380 | ||||||||||||
Gain on disposition of real estate, net of income tax and noncontrolling interests | (4,579 | ) | (1,305 | ) | (27,137 | ) | (10,397 | ) | ||||||||
Impairment losses – depreciable real estate, net of recoveries and income tax | 345 | 258 | 8,025 | 2,808 | ||||||||||||
Total FFO adjustments | 34,673 | 33,707 | 129,667 | 126,791 | ||||||||||||
FFO available to common stockholders | $ | 88,717 | $ | 67,319 | $ | 330,544 | $ | 289,193 | ||||||||
FFO per common share: | ||||||||||||||||
Basic | $ | 0.61 | $ | 0.49 | $ | 2.29 | $ | 2.16 | ||||||||
Diluted | $ | 0.60 | $ | 0.49 | $ | 2.28 | $ | 2.15 | ||||||||
Core Funds from Operations Reconciliation: | ||||||||||||||||
Net earnings available to common stockholders | $ | 54,044 | $ | 33,612 | $ | 200,877 | $ | 162,402 | ||||||||
Total FFO adjustments | 34,673 | 33,707 | 129,667 | 126,791 | ||||||||||||
FFO available to common stockholders | 88,717 | 67,319 | 330,544 | 289,193 | ||||||||||||
Impairment – commercial mortgage residual interests valuation | — | 51 | 6,830 | 531 | ||||||||||||
Impairment losses – non-depreciable real estate and other charges | — | — | — | 156 | ||||||||||||
Bad debt expense – loans | — | — | 3,269 | — | ||||||||||||
Income tax benefit | — | (316 | ) | — | (316 | ) | ||||||||||
TRS revocation election | — | 9,607 | — | 9,607 | ||||||||||||
Total Core FFO adjustments | — | 9,342 | 10,099 | 9,978 | ||||||||||||
Core FFO available to common stockholders | $ | 88,717 | $ | 76,661 | $ | 340,643 | $ | 299,171 | ||||||||
Core FFO per common share: | ||||||||||||||||
Basic | $ | 0.61 | $ | 0.56 | $ | 2.36 | $ | 2.23 | ||||||||
Diluted | $ | 0.60 | $ | 0.56 | $ | 2.35 | $ | 2.22 | ||||||||
National Retail Properties, Inc. (in thousands, except per share data) (unaudited) | ||||||||||||||||
Quarter Ended | Year Ended | |||||||||||||||
December 31, | December 31, | |||||||||||||||
2016 | 2015 | 2016 | 2015 | |||||||||||||
Adjusted Funds From Operations (AFFO) Reconciliation: | ||||||||||||||||
Net earnings available to common stockholders | $ | 54,044 | $ | 33,612 | $ | 200,877 | $ | 162,402 | ||||||||
Total FFO adjustments | 34,673 | 33,707 | 129,667 | 126,791 | ||||||||||||
Total Core FFO adjustments | — | 9,342 | 10,099 | 9,978 | ||||||||||||
Core FFO available to common stockholders | 88,717 | 76,661 | 340,643 | 299,171 | ||||||||||||
Straight-line accrued rent | (273 | ) | (529 | ) | (252 | ) | (368 | ) | ||||||||
Net capital lease rent adjustment | 309 | 331 | 1,364 | 1,277 | ||||||||||||
Below market rent amortization | (662 | ) | (671 | ) | (2,842 | ) | (3,046 | ) | ||||||||
Stock based compensation expense | 2,689 | 2,461 | 10,758 | 9,671 | ||||||||||||
Capitalized interest expense | (495 | ) | (750 | ) | (1,738 | ) | (2,383 | ) | ||||||||
Loss on sale of mortgage receivable | — | 450 | — | 450 | ||||||||||||
Total AFFO adjustments | 1,568 | 1,292 | 7,290 | 5,601 | ||||||||||||
AFFO available to common stockholders | $ | 90,285 | $ | 77,953 | $ | 347,933 | $ | 304,772 | ||||||||
AFFO per common share: | ||||||||||||||||
Basic | $ | 0.62 | $ | 0.57 | $ | 2.41 | $ | 2.27 | ||||||||
Diluted | $ | 0.62 | $ | 0.57 | $ | 2.41 | $ | 2.27 | ||||||||
Other Information: | ||||||||||||||||
Percentage rent | $ | 776 | $ | 802 | $ | 1,735 | $ | 1,430 | ||||||||
Amortization of debt costs | $ | 810 | $ | 773 | $ | 3,086 | $ | 2,915 | ||||||||
Scheduled debt principal amortization (excluding maturities) | $ | 129 | $ | 378 | $ | 656 | $ | 1,587 | ||||||||
Non-real estate depreciation expense | $ | 83 | $ | 77 | $ | 333 | $ | 418 | ||||||||
2017 Earnings Guidance: | ||||||||||||||||
Core FFO guidance for 2017 is $2.42 to $2.48 per share. The 2017 AFFO is estimated to be $2.46 to $2.52 per share. The FFO guidance equates to net earnings of $1.37 to $1.43 per share, plus $1.05 per share of expected real estate depreciation and amortization and excludes any gains from the sale of real estate and any charges for impairments, severance costs, or preferred stock redemption charges. The guidance is based on current plans and assumptions and subject to risks and uncertainties more fully described in this press release and the company's reports filed with the Securities and Exchange Commission. | ||||||||||||||||
2017 Guidance | ||||||||||||||||
Net earnings per common share excluding any gains on sale of real estate, impairment charges, severance charges or charges in connection with preferred stock redemption | $1.37 - $1.43 per share | |||||||||||||||
Real estate depreciation and amortization per share | $1.05 per share | |||||||||||||||
Core FFO per share | $2.42 - $2.48 per share | |||||||||||||||
AFFO per share | $2.46 - $2.52 per share | |||||||||||||||
G&A expenses (excluding severance charges) | $34 - $35 Million | |||||||||||||||
Real estate expenses, net of tenant reimbursements | $6.0 - $6.5 Million | |||||||||||||||
Acquisition volume | $500 - $600 Million | |||||||||||||||
Disposition volume | $80 - $120 Million | |||||||||||||||
National Retail Properties, Inc. (in thousands) (unaudited) | ||||||||
December 31, 2016 | December 31, 2015 | |||||||
Balance Sheet Summary | ||||||||
Assets: | ||||||||
Real estate: | ||||||||
Accounted for using the operating method, net of accumulated depreciation and amortization | $ | 5,881,280 | $ | 5,231,413 | ||||
Accounted for using the direct financing method | 11,230 | 14,518 | ||||||
Real estate held for sale | 23,850 | 57,527 | ||||||
Cash and cash equivalents | 294,540 | 13,659 | ||||||
Restricted cash and cash held in escrow | — | 601 | ||||||
Receivables, net of allowance | 3,418 | 3,344 | ||||||
Mortgages, notes and accrued interest receivable, net of allowance | 1,252 | 8,688 | ||||||
Accrued rental income, net of allowance | 25,101 | 25,529 | ||||||
Debt costs, net of accumulated amortization | 2,715 | 4,003 | ||||||
Commercial mortgage residual interests | 36 | 11,115 | ||||||
Other assets | 90,729 | 89,647 | ||||||
Total assets | $ | 6,334,151 | $ | 5,460,044 | ||||
Liabilities: | ||||||||
Line of credit payable | $ | — | $ | — | ||||
Mortgages payable, including unamortized premium and net of unamortized debt cost | 13,878 | 23,964 | ||||||
Notes payable, net of unamortized discount and unamortized debt costs | 2,297,811 | 1,951,980 | ||||||
Accrued interest payable | 19,665 | 20,113 | ||||||
Other liabilities | 85,869 | 121,594 | ||||||
Total liabilities | 2,417,223 | 2,117,651 | ||||||
Stockholders’ equity of NNN | 3,916,799 | 3,342,134 | ||||||
Noncontrolling interests | 129 | 259 | ||||||
Total equity | 3,916,928 | 3,342,393 | ||||||
Total liabilities and equity | $ | 6,334,151 | $ | 5,460,044 | ||||
Common shares outstanding | 147,150 | 141,008 | ||||||
Gross leasable area, Property Portfolio (square feet) | 27,204 | 24,964 | ||||||
National Retail Properties, Inc. Debt Summary As of December 31, 2016 (in thousands) (unaudited) | |||||||||||||||
Unsecured Debt | Principal | Principal, Net of Unamortized Discount | Stated Rate | Effective Rate | Maturity Date | ||||||||||
Line of credit payable | $ | — | $ | — | L + 92.5 bps | — | January 2019 | ||||||||
Unsecured notes payable: | |||||||||||||||
2017 | 250,000 | 249,907 | 6.875% | 6.924% | October 2017 | ||||||||||
2021 | 300,000 | 297,764 | 5.500% | 5.689% | July 2021 | ||||||||||
2022 | 325,000 | 321,917 | 3.800% | 3.985% | October 2022 | ||||||||||
2023 | 350,000 | 348,269 | 3.300% | 3.388% | April 2023 | ||||||||||
2024 | 350,000 | 349,451 | 3.900% | 3.924% | June 2024 | ||||||||||
2025 | 400,000 | 399,131 | 4.000% | 4.029% | November 2025 | ||||||||||
2026 | 350,000 | 346,153 | 3.600% | 3.733% | December 2026 | ||||||||||
Total | 2,325,000 | 2,312,592 | |||||||||||||
Total unsecured debt (1) | $ | 2,325,000 | $ | 2,312,592 | |||||||||||
Debt costs | (21,157 | ) | |||||||||||||
Accumulated amortization | 6,376 | ||||||||||||||
Debt costs, net of accumulated amortization | (14,781 | ) | |||||||||||||
Notes payable, net of unamortized discount and unamortized debt costs | $ | 2,297,811 | |||||||||||||
(1) Unsecured notes payable have a weighted average interest rate of 4.4% and a weighted average maturity of 6.6 years | |||||||||||||||
Mortgages Payable | Principal Balance | Interest Rate | Maturity Date | |||||
Mortgage(1) | $ | 13,987 | 5.230% | July 2023 | ||||
Debt costs | (147 | ) | ||||||
Accumulated amortization | 38 | |||||||
Debt costs, net of accumulated amortization | (109 | ) | ||||||
Mortgages payable, including unamortized premium and net of unamortized debt costs | $ | 13,878 | ||||||
(1) Includes unamortized premium | ||||||||
As of December 31, | ||||||||
Line of Trade | 2016(1) | 2015(2) | ||||||
1. | Convenience stores | 16.9 | % | 16.7 | % | |||
2. | Restaurants - full service | 11.8 | % | 11.0 | % | |||
3. | Restaurants - limited service | 7.5 | % | 7.2 | % | |||
4. | Automotive service | 6.6 | % | 7.0 | % | |||
5. | Family entertainment centers | 5.8 | % | 5.6 | % | |||
6. | Health and fitness | 5.7 | % | 3.8 | % | |||
7. | Theaters | 4.9 | % | 5.2 | % | |||
8. | Automotive parts | 3.9 | % | 4.2 | % | |||
9. | Recreational vehicle dealers, parts and accessories | 3.4 | % | 3.6 | % | |||
10. | Banks | 3.1 | % | 3.4 | % | |||
11. | Sporting goods | 2.5 | % | 3.3 | % | |||
12. | Medical service providers | 2.4 | % | 2.2 | % | |||
13. | Wholesale clubs | 2.4 | % | 2.6 | % | |||
14. | Drug stores | 2.1 | % | 2.3 | % | |||
15. | Consumer electronics | 2.0 | % | 2.2 | % | |||
16. | Travel plazas | 1.9 | % | 2.1 | % | |||
17. | Furniture | 1.9 | % | 1.1 | % | |||
18. | General merchandise | 1.8 | % | 1.9 | % | |||
19. | Home improvement | 1.8 | % | 1.8 | % | |||
20. | Home furnishings | 1.7 | % | 1.9 | % | |||
Other | 9.9 | % | 10.9 | % | ||||
Total | 100.0 | % | 100.0 | % | ||||
State | % of Total(1) | State | % of Total(1) | |||||||||
1. | Texas | 18.4 | % | 6. | Georgia | 4.3 | % | |||||
2. | Florida | 9.1 | % | 7. | Indiana | 4.2 | % | |||||
3. | Illinois | 5.7 | % | 8. | Virginia | 3.5 | % | |||||
4. | Ohio | 5.7 | % | 9. | Alabama | 3.0 | % | |||||
5. | North Carolina | 4.7 | % | 10. | Tennessee | 2.8 | % | |||||
(1) | Based on the annualized base rent for all leases in place as of December 31, 2016. |
(2) | Based on the annualized base rent for all leases in place as of December 31, 2015. |
Properties | % of Total (1) | ||||
Sunoco | 125 | 5.4% | |||
Mister Car Wash | 90 | 4.0% | |||
LA Fitness | 29 | 3.8% | |||
AMC Theatres | 20 | 3.5% | |||
Camping World | 32 | 3.4% | |||
Couche-Tard (Pantry) | 86 | 3.3% | |||
7-Eleven | 77 | 3.3% | |||
SunTrust | 121 | 3.0% | |||
Bell American (Taco Bell) | 115 | 2.8% | |||
Chuck E. Cheese's | 53 | 2.5% | |||
BJ's Wholesale Club | 8 | 2.4% | |||
Frisch's Restaurant | 74 | 2.2% | |||
Gander Mountain | 12 | 2.2% | |||
Bob Evans | 117 | 2.0% | |||
% of Total(1) | # of Properties | Gross Leasable Area (3) | % of Total(1) | # of Properties | Gross Leasable Area (3) | |||||||||||
2017 | 1.2% | 27 | 502,000 | 2023 | 2.5% | 85 | 1,014,000 | |||||||||
2018 | 3.2% | 90 | 1,153,000 | 2024 | 2.6% | 50 | 883,000 | |||||||||
2019 | 3.0% | 76 | 1,122,000 | 2025 | 5.0% | 132 | 1,116,000 | |||||||||
2020 | 3.8% | 132 | 1,571,000 | 2026 | 6.0% | 181 | 1,830,000 | |||||||||
2021 | 4.4% | 122 | 1,320,000 | 2027 | 9.0% | 190 | 2,842,000 | |||||||||
2022 | 6.1% | 111 | 1,456,000 | Thereafter | 53.2% | 1,305 | 11,891,000 | |||||||||
(1) | Based on the annual base rent of $543,446,000, which is the annualized base rent for all leases in place as of December 31, 2016. |
(2) | As of December 31, 2016, the weighted average remaining lease term is 11.6 years. |
(3) | Square feet. |
PAGE REFERENCE | |
Financial Summary | |
Income Statement Summary | |
Funds From Operations (FFO) | |
Core Funds From Operation | |
Adjusted Funds From Operations (AFFO) | |
Other Information | |
Balance Sheet | |
Debt Summary | |
Credit Metrics | |
Credit Facility and Note Covenants | |
Long-Term Dividend History | |
Transaction Summary | |
Property Acquisitions | |
Property Dispositions | |
Property Portfolio | |
Lease Expirations | |
Top 20 Lines of Trade | |
Top 10 States | |
Portfolio By Region | |
Top Tenants | |
Same Store Rental Income | |
Leasing Data | |
Other Property Portfolio Data | |
Earnings Guidance | |
INCOME STATEMENT SUMMARY | ||||||||||||||||
(in thousands, except per share data) | ||||||||||||||||
(unaudited) | ||||||||||||||||
Quarter Ended | Year Ended | |||||||||||||||
December 31, | December 31, | |||||||||||||||
2016 | 2015 | 2016 | 2015 | |||||||||||||
Revenues: | ||||||||||||||||
Rental and earned income | $ | 135,947 | $ | 121,106 | $ | 515,954 | $ | 465,282 | ||||||||
Real estate expense reimbursement from tenants | 4,732 | 4,561 | 14,984 | 14,868 | ||||||||||||
Interest and other income from real estate transactions | 128 | 264 | 1,032 | 988 | ||||||||||||
Interest income on commercial mortgage residual interests | 392 | 446 | 1,677 | 1,778 | ||||||||||||
141,199 | 126,377 | 533,647 | 482,916 | |||||||||||||
Operating expenses: | ||||||||||||||||
General and administrative | 9,408 | 9,657 | 36,508 | 34,736 | ||||||||||||
Real estate | 6,555 | 5,575 | 20,852 | 19,776 | ||||||||||||
Depreciation and amortization | 38,987 | 34,848 | 149,101 | 134,798 | ||||||||||||
Impairment – commercial mortgage residual interests valuation | — | 51 | 6,830 | 531 | ||||||||||||
Impairment losses – real estate and other charges, net of recoveries | 338 | 708 | 11,287 | 4,420 | ||||||||||||
55,288 | 50,839 | 224,578 | 194,261 | |||||||||||||
Other expenses (revenues): | ||||||||||||||||
Interest and other income | (62 | ) | (42 | ) | (170 | ) | (109 | ) | ||||||||
Interest expense | 24,429 | 24,548 | 96,352 | 90,008 | ||||||||||||
Real estate acquisition costs | 42 | 33 | 563 | 927 | ||||||||||||
24,409 | 24,539 | 96,745 | 90,826 | |||||||||||||
Income tax expense | — | (9,827 | ) | — | (10,318 | ) | ||||||||||
Earnings before gain on disposition of real estate, net of income tax expense | 61,502 | 41,172 | 212,324 | 187,511 | ||||||||||||
Gain on disposition of real estate, net of income tax expense | 4,624 | 1,305 | 27,182 | 10,450 | ||||||||||||
Earnings including noncontrolling interests | 66,126 | 42,477 | 239,506 | 197,961 | ||||||||||||
Earnings from continuing operations attributable to noncontrolling interests: | (34 | ) | (6 | ) | (6 | ) | (125 | ) | ||||||||
Net earnings attributable to NNN | 66,092 | 42,471 | 239,500 | 197,836 | ||||||||||||
| ||||||||||||||||
INCOME STATEMENT SUMMARY | ||||||||||||||||
(in thousands, except per share data) | ||||||||||||||||
(unaudited) | ||||||||||||||||
Quarter Ended | Year Ended | |||||||||||||||
December 31, | December 31, | |||||||||||||||
2016 | 2015 | 2016 | 2015 | |||||||||||||
Net earnings attributable to NNN | 66,092 | 42,471 | 239,500 | 197,836 | ||||||||||||
Series D preferred stock dividends | (4,762 | ) | (4,762 | ) | (19,047 | ) | (19,047 | ) | ||||||||
Series E preferred stock dividends | (4,097 | ) | (4,097 | ) | (16,387 | ) | (16,387 | ) | ||||||||
Series F preferred stock dividends | (3,189 | ) | — | (3,189 | ) | — | ||||||||||
Net earnings available to common stockholders | $ | 54,044 | $ | 33,612 | $ | 200,877 | $ | 162,402 | ||||||||
Weighted average common shares outstanding: | ||||||||||||||||
Basic | 146,266 | 137,111 | 144,176 | 133,999 | ||||||||||||
Diluted | 146,763 | 137,623 | 144,661 | 134,489 | ||||||||||||
Net earnings per share available to common stockholders: | ||||||||||||||||
Basic | $ | 0.37 | $ | 0.24 | $ | 1.39 | $ | 1.21 | ||||||||
Diluted | $ | 0.37 | $ | 0.24 | $ | 1.38 | $ | 1.20 | ||||||||
FUNDS FROM OPERATIONS (FFO) | ||||||||||||||||
(in thousands, except per share data) | ||||||||||||||||
(unaudited) | Quarter Ended | Year Ended | ||||||||||||||
December 31, | December 31, | |||||||||||||||
2016 | 2015 | 2016 | 2015 | |||||||||||||
Net earnings available to common stockholders | $ | 54,044 | $ | 33,612 | $ | 200,877 | $ | 162,402 | ||||||||
Real estate depreciation and amortization: | 38,907 | 34,754 | 148,779 | 134,380 | ||||||||||||
Gain on disposition of real estate, net of income tax and noncontrolling interests | (4,579 | ) | (1,305 | ) | (27,137 | ) | (10,397 | ) | ||||||||
Impairment losses – depreciable real estate, net of recoveries and income tax | 345 | 258 | 8,025 | 2,808 | ||||||||||||
Total FFO adjustments | 34,673 | 33,707 | 129,667 | 126,791 | ||||||||||||
FFO available to common stockholders | $ | 88,717 | $ | 67,319 | $ | 330,544 | $ | 289,193 | ||||||||
FFO per common share: | ||||||||||||||||
Basic | $ | 0.61 | $ | 0.49 | $ | 2.29 | $ | 2.16 | ||||||||
Diluted | $ | 0.60 | $ | 0.49 | $ | 2.28 | $ | 2.15 | ||||||||
CORE FUNDS FROM OPERATIONS | ||||||||||||||||
(in thousands, except per share data) | ||||||||||||||||
(unaudited) | Quarter Ended | Year Ended | ||||||||||||||
December 31, | December 31, | |||||||||||||||
2016 | 2015 | 2016 | 2015 | |||||||||||||
Net earnings available to common stockholders | $ | 54,044 | $ | 33,612 | $ | 200,877 | $ | 162,402 | ||||||||
Total FFO adjustments | 34,673 | 33,707 | 129,667 | 126,791 | ||||||||||||
FFO available to common stockholders | 88,717 | 67,319 | 330,544 | 289,193 | ||||||||||||
Impairment – commercial mortgage residual interests valuation | — | 51 | 6,830 | 531 | ||||||||||||
Impairment losses – non-depreciable real estate and other charges | — | — | — | 156 | ||||||||||||
Bad debt expense – loans | — | — | 3,269 | — | ||||||||||||
Income tax benefit | — | (316 | ) | — | (316 | ) | ||||||||||
Taxable REIT subsidiary revocation election(1) | — | 9,607 | — | 9,607 | ||||||||||||
Total Core FFO adjustments | — | 9,342 | 10,099 | 9,978 | ||||||||||||
Core FFO available to common stockholders | $ | 88,717 | $ | 76,661 | $ | 340,643 | $ | 299,171 | ||||||||
Core FFO per common share: | ||||||||||||||||
Basic | $ | 0.61 | $ | 0.56 | $ | 2.36 | $ | 2.23 | ||||||||
Diluted | $ | 0.60 | $ | 0.56 | $ | 2.35 | $ | 2.22 | ||||||||
ADJUSTED FUNDS FROM OPERATIONS (AFFO) | ||||||||||||||||
(in thousands, except per share data) | ||||||||||||||||
(unaudited) | ||||||||||||||||
Quarter Ended | Year Ended | |||||||||||||||
December 31, | December 31, | |||||||||||||||
2016 | 2015 | 2016 | 2015 | |||||||||||||
Net earnings available to common stockholders | $ | 54,044 | $ | 33,612 | $ | 200,877 | $ | 162,402 | ||||||||
Total FFO adjustments | 34,673 | 33,707 | 129,667 | 126,791 | ||||||||||||
Total Core FFO adjustments | — | 9,342 | 10,099 | 9,978 | ||||||||||||
Core FFO available to common stockholders | 88,717 | 76,661 | 340,643 | 299,171 | ||||||||||||
Straight-line accrued rent | (273 | ) | (529 | ) | (252 | ) | (368 | ) | ||||||||
Net capital lease rent adjustment | 309 | 331 | 1,364 | 1,277 | ||||||||||||
Below market rent amortization | (662 | ) | (671 | ) | (2,842 | ) | (3,046 | ) | ||||||||
Stock based compensation expense | 2,689 | 2,461 | 10,758 | 9,671 | ||||||||||||
Capitalized interest expense | (495 | ) | (750 | ) | (1,738 | ) | (2,383 | ) | ||||||||
Loss on sale of mortgage receivable | — | 450 | — | 450 | ||||||||||||
Total AFFO adjustments | 1,568 | 1,292 | 7,290 | 5,601 | ||||||||||||
AFFO available to common stockholders | $ | 90,285 | $ | 77,953 | $ | 347,933 | $ | 304,772 | ||||||||
AFFO per common share: | ||||||||||||||||
Basic | $ | 0.62 | $ | 0.57 | $ | 2.41 | $ | 2.27 | ||||||||
Diluted | $ | 0.62 | $ | 0.57 | $ | 2.41 | $ | 2.27 | ||||||||
OTHER INFORMATION | ||||||||||||||||
(in thousands) | ||||||||||||||||
(unaudited) | ||||||||||||||||
Quarter Ended | Year Ended | |||||||||||||||
December 31, | December 31, | |||||||||||||||
2016 | 2015 | 2016 | 2015 | |||||||||||||
Percentage rent | $ | 776 | $ | 802 | $ | 1,735 | $ | 1,430 | ||||||||
Amortization of debt costs | $ | 810 | $ | 773 | $ | 3,086 | $ | 2,915 | ||||||||
Scheduled debt principal amortization (excluding maturities) | $ | 129 | $ | 378 | $ | 656 | $ | 1,587 | ||||||||
Non-real estate depreciation expense | $ | 83 | $ | 77 | $ | 333 | $ | 418 | ||||||||
BALANCE SHEET |
(in thousands) |
(unaudited) |
December 31, 2016 | December 31, 2015 | |||||||
Assets: | ||||||||
Real estate: | ||||||||
Accounted for using the operating method, net of accumulated depreciation and amortization | $ | 5,881,280 | $ | 5,231,413 | ||||
Accounted for using the direct financing method | 11,230 | 14,518 | ||||||
Real estate held for sale | 23,850 | 57,527 | ||||||
Cash and cash equivalents | 294,540 | 13,659 | ||||||
Restricted cash and cash held in escrow | — | 601 | ||||||
Receivables, net of allowance | 3,418 | 3,344 | ||||||
Mortgages, notes and accrued interest receivable, net of allowance | 1,252 | 8,688 | ||||||
Accrued rental income, net of allowance | 25,101 | 25,529 | ||||||
Debt costs, net of accumulated amortization | 2,715 | 4,003 | ||||||
Commercial mortgage residual interests | 36 | 11,115 | ||||||
Other assets | 90,729 | 89,647 | ||||||
Total assets | $ | 6,334,151 | $ | 5,460,044 | ||||
Liabilities: | ||||||||
Line of credit payable | $ | — | $ | — | ||||
Mortgages payable, including unamortized premium and net of unamortized debt cost | 13,878 | 23,964 | ||||||
Notes payable, net of unamortized discount and unamortized debt costs | 2,297,811 | 1,951,980 | ||||||
Accrued interest payable | 19,665 | 20,113 | ||||||
Other liabilities | 85,869 | 121,594 | ||||||
Total liabilities | 2,417,223 | 2,117,651 | ||||||
Stockholders’ equity of NNN | 3,916,799 | 3,342,134 | ||||||
Noncontrolling interests | 129 | 259 | ||||||
Total equity | 3,916,928 | 3,342,393 | ||||||
Total liabilities and equity | $ | 6,334,151 | $ | 5,460,044 | ||||
Common shares outstanding | 147,150 | 141,008 | ||||||
Gross leasable area, Property Portfolio (square feet) | 27,204 | 24,964 | ||||||
DEBT SUMMARY |
(in thousands) |
As of December 31, 2016 |
Unsecured Debt | Principal | Principal, Net of Unamortized Discount | Stated Rate | Effective Rate | Maturity Date | |||||||||
Line of credit payable | $ | — | $ | — | L + 92.5 bps | — | January 2019 | |||||||
Unsecured notes payable: | ||||||||||||||
2017 | 250,000 | 249,907 | 6.875% | 6.924% | October 2017 | |||||||||
2021 | 300,000 | 297,764 | 5.500% | 5.689% | July 2021 | |||||||||
2022 | 325,000 | 321,917 | 3.800% | 3.985% | October 2022 | |||||||||
2023 | 350,000 | 348,269 | 3.300% | 3.388% | April 2023 | |||||||||
2024 | 350,000 | 349,451 | 3.900% | 3.924% | June 2024 | |||||||||
2025 | 400,000 | 399,131 | 4.000% | 4.029% | November 2025 | |||||||||
2026 | 350,000 | 346,153 | 3.600% | 3.733% | December 2026 | |||||||||
Total | 2,325,000 | 2,312,592 | ||||||||||||
Total unsecured debt (1) | $ | 2,325,000 | $ | 2,312,592 | ||||||||||
Debt costs | (21,157 | ) | ||||||||||||
Accumulated amortization | 6,376 | |||||||||||||
Debt costs, net of accumulated amortization | (14,781 | ) | ||||||||||||
Notes payable, net of unamortized discount and unamortized debt costs | $ | 2,297,811 | ||||||||||||
(1) Unsecured notes payable have a weighted average interest rate of 4.4% and a weighted average maturity of 6.6 years | ||||||||||||||
Mortgages Payable | Interest Rate | Maturity Date | Principal Balance | |||||||
Mortgage(1) | 5.230 | % | July 2023 | $ | 13,987 | |||||
Debt costs | (147 | ) | ||||||||
Accumulated amortization | 38 | |||||||||
Debt costs, net of accumulated amortization | (109 | ) | ||||||||
Mortgages payable, including unamortized premium and net of unamortized debt costs | $ | 13,878 | ||||||||
(1) Includes unamortized premium | ||||||||||
CREDIT METRICS (1) | |||||||||||||||||
Ratings: Moody’s Baa1; S&P BBB+; Fitch BBB+ | |||||||||||||||||
2012 | 2013 | 2014 | 2015 | 2016 | 2016 Pro Forma Pfd Stock Redemption(2) | ||||||||||||
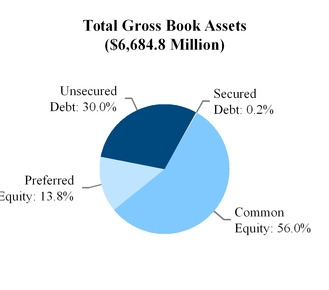
Debt / Total assets (gross book) | 37.5 | % | 32.9 | % | 32.6 | % | 33.2 | % | 30.2 | % | 34.5 | % | |||||
Debt + preferred / Total assets (gross book) | 44.3 | % | 44.9 | % | 43.3 | % | 42.9 | % | 43.9 | % | 44.0 | % | |||||
Debt / EBITDA (last quarter annualized) | 5.1 | 4.3 | 4.2 | 4.4 | 4.0 | 4.6 | |||||||||||
Debt / EBITDA (last four quarters) | 5.3 | 4.5 | 4.5 | 4.6 | 4.3 | 4.9 | |||||||||||
Debt + Pref Stock / EBITDA | 6.3 | 6.1 | 6.0 | 5.9 | 6.2 | 6.2 | |||||||||||
EBITDA / Interest expense (cash) | 3.7 | 4.1 | 4.4 | 4.6 | 4.8 | ||||||||||||
EBITDA / Fixed charges (cash) | 3.0 | 3.1 | 3.1 | 3.3 | 3.4 | ||||||||||||
CREDIT FACILITY AND NOTES COVENANTS | |||||||||
Unsecured Credit Facility Key Covenants | Required | December 31, 2016 | ||
Maximum leverage ratio | < 0.60 | 0.32 | ||
Minimum fixed charge coverage ratio | > 1.50 | 3.44 | ||
Maximum secured indebtedness ratio | < 0.40 | 0.002 | ||
Unencumbered asset value ratio | > 1.67 | 3.15 | ||
Unencumbered interest ratio | > 1.75 | 5.37 | ||
Unsecured Notes Key Covenants | Required | December 31, 2016 | ||
Limitation on incurrence of total debt | ≤ 60% | 32.6% | ||
Limitation on incurrence of secured debt | ≤ 40% | 0.2% | ||
Debt service coverage ratio | ≥ 1.50 | 4.82 | ||
Maintenance of total unencumbered assets | ≥ 150% | 307.2% | ||
LONG-TERM DIVIDEND HISTORY |
PROPERTY ACQUISITIONS |
Year Ended December 31, | ||||||||
2016 | 2015 | |||||||
Total dollars invested | $ | 846,906 | $ | 726,303 | ||||
Number of Properties | 313 | 221 | ||||||
Gross leasable area (square feet) | 2,734,000 | 2,706,000 | ||||||
Cash cap rate | 6.9 | % | 7.2 | % | ||||
PROPERTY DISPOSITIONS |
Year Ended December 31, | |||||||||||||||||||||||
2016 | 2015 | ||||||||||||||||||||||
Occupied | Vacant | Total | Occupied | Vacant | Total | ||||||||||||||||||
Number of properties | 33 | 5 | (1 | ) | 38 | 11 | 8 | (1 | ) | 19 | |||||||||||||
Gross leasable area (square feet) | 419,000 | 71,000 | 490,000 | 106,000 | 126,000 | 232,000 | |||||||||||||||||
Acquisition costs | $ | 91,203 | $ | 7,787 | $ | 98,990 | $ | 28,092 | $ | 11,264 | $ | 39,356 | |||||||||||
Net book value | $ | 73,041 | $ | 2,992 | $ | 76,033 | $ | 24,535 | $ | 3,892 | $ | 28,427 | |||||||||||
Net sale proceeds | $ | 99,954 | $ | 3,261 | $ | 103,215 | $ | 35,030 | $ | 4,086 | $ | 39,116 | |||||||||||
Cash cap rate | 6.8 | % | — | 6.8 | % | 5.9 | % | — | 5.9 | % | |||||||||||||
LEASE EXPIRATIONS |
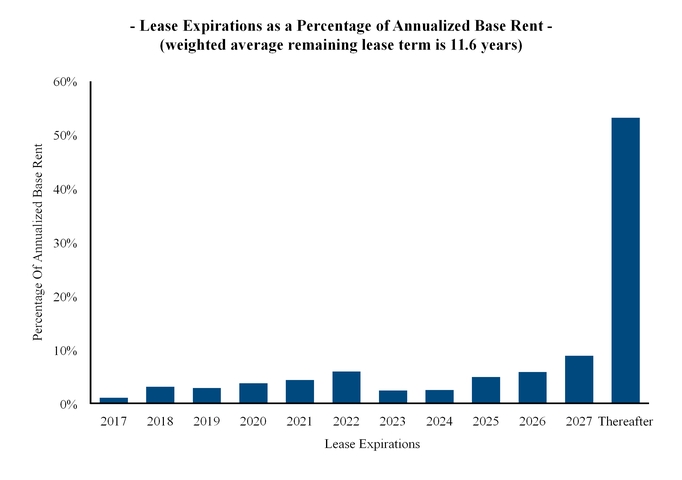
% of Total(1) | # of Properties | Gross Leasable Area (2) | % of Total(1) | # of Properties | Gross Leasable Area (2) | |||||||||||||||
2017 | 1.2 | % | 27 | 502,000 | 2023 | 2.5 | % | 85 | 1,014,000 | |||||||||||
2018 | 3.2 | % | 90 | 1,153,000 | 2024 | 2.6 | % | 50 | 883,000 | |||||||||||
2019 | 3.0 | % | 76 | 1,122,000 | 2025 | 5.0 | % | 132 | 1,116,000 | |||||||||||
2020 | 3.8 | % | 132 | 1,571,000 | 2026 | 6.0 | % | 181 | 1,830,000 | |||||||||||
2021 | 4.4 | % | 122 | 1,320,000 | 2027 | 9.0 | % | 190 | 2,842,000 | |||||||||||
2022 | 6.1 | % | 111 | 1,456,000 | Thereafter | 53.2 | % | 1,305 | 11,891,000 | |||||||||||
(1) | Based on the annual base rent of $543,446,000, which is the annualized base rent for all leases in place as of December 31, 2016. |
(2) | Square feet. |
TOP 20 LINES OF TRADE |
As of December 31, 2016 | As of December 31, 2015 | |||||||||||||
Line of Trade | % of Total(1) | Properties | % of Total(2) | Properties | ||||||||||
1. | Convenience stores | 16.9 | % | 502 | 16.7 | % | 448 | |||||||
2. | Restaurants - full service | 11.8 | % | 414 | 11.0 | % | 294 | |||||||
3. | Restaurants - limited service | 7.5 | % | 347 | 7.2 | % | 297 | |||||||
4. | Automotive service | 6.6 | % | 201 | 7.0 | % | 197 | |||||||
5. | Family entertainment centers | 5.8 | % | 88 | 5.6 | % | 80 | |||||||
6. | Health and fitness | 5.7 | % | 35 | 3.8 | % | 28 | |||||||
7. | Theaters | 4.9 | % | 30 | 5.2 | % | 30 | |||||||
8. | Automotive parts | 3.9 | % | 182 | 4.2 | % | 183 | |||||||
9. | Recreational vehicle dealers, parts and accessories | 3.4 | % | 32 | 3.6 | % | 32 | |||||||
10. | Banks | 3.1 | % | 124 | 3.4 | % | 124 | |||||||
11. | Sporting goods | 2.5 | % | 15 | 3.3 | % | 21 | |||||||
12. | Medical service providers | 2.4 | % | 76 | 2.2 | % | 60 | |||||||
13. | Wholesale clubs | 2.4 | % | 8 | 2.6 | % | 7 | |||||||
14. | Drug stores | 2.1 | % | 39 | 2.3 | % | 39 | |||||||
15. | Consumer electronics | 2.0 | % | 20 | 2.2 | % | 20 | |||||||
16. | Travel plazas | 1.9 | % | 28 | 2.1 | % | 29 | |||||||
17. | Furniture | 1.9 | % | 42 | 1.1 | % | 24 | |||||||
18. | General merchandise | 1.8 | % | 58 | 1.9 | % | 60 | |||||||
19. | Home improvement | 1.8 | % | 23 | 1.8 | % | 21 | |||||||
20. | Home furnishings | 1.7 | % | 18 | 1.9 | % | 18 | |||||||
Other | 9.9 | % | 253 | 10.9 | % | 245 | ||||||||
Total | 100.0 | % | 2,535 | 100.0 | % | 2,257 | ||||||||
TOP 10 STATES |
State | % of Total(1) | Properties | State | Properties | % of Total(1) | |||||||||||
1. | Texas | 18.4 | % | 448 | 6. | Georgia | 118 | 4.3 | % | |||||||
2. | Florida | 9.1 | % | 197 | 7. | Indiana | 118 | 4.2 | % | |||||||
3. | Illinois | 5.7 | % | 132 | 8. | Virginia | 88 | 3.5 | % | |||||||
4. | Ohio | 5.7 | % | 165 | 9. | Alabama | 101 | 3.0 | % | |||||||
5. | North Carolina | 4.7 | % | 134 | 10. | Tennessee | 77 | 2.8 | % | |||||||
(1) Based on the annualized base rent for all leases in place as of December 31, 2016. | ||||||||||||||||
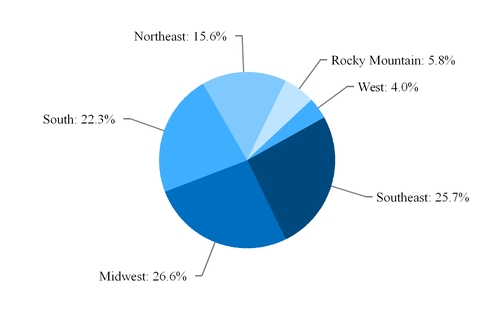
PORTFOLIO BY REGION |
TOP TENANTS |
▪ | 20% of annual base rent is from tenants with investment grade rated debt |
▪ | 65% of annual base rent is from tenants that are publicly traded and/or have rated debt |
▪ | Top 25 tenants (59% of annual base rent) operate an average of over 1,000 stores each |
Top Tenants (>2.0%) | Properties | % of Total (1) | ||||
Sunoco | 125 | 5.4 | % | |||
Mister Car Wash | 90 | 4.0 | % | |||
LA Fitness | 29 | 3.8 | % | |||
AMC Theatres | 20 | 3.5 | % | |||
Camping World | 32 | 3.4 | % | |||
Couche-Tard (Pantry) | 86 | 3.3 | % | |||
7-Eleven | 77 | 3.3 | % | |||
SunTrust | 121 | 3.0 | % | |||
Bell American (Taco Bell) | 115 | 2.8 | % | |||
Chuck E. Cheese's | 53 | 2.5 | % | |||
BJ's Wholesale Club | 8 | 2.4 | % | |||
Frisch's Restaurant | 74 | 2.2 | % | |||
Gander Mountain | 12 | 2.2 | % | |||
Bob Evans | 117 | 2.0 | % | |||
Rent Coverage (With Corp. Overhead) | Fixed Charge Coverage | ||
Range | 1.1x - 7.4x | 0.9x - 4.9x | |
Average | 3.6x | 2.5x | |
Weighted average | 3.8x | 2.5x | |
SAME STORE RENTAL INCOME |
Same Store Rental Income (Cash Basis) (1) | |||
Number of leases | 1,972 | ||
Year ended December 31, 2016 | $ | 424,920 | |
Year ended December 31, 2015 | $ | 421,497 | |
Increase (in dollars) | $ | 3,423 | |
Increase (percent) | 0.8 | % | |
(1) Includes all properties owned for current and prior year period excluding any vacant properties or properties under development or re-development. | |||
LEASING DATA |
Renewals With Same Tenant(1) | |||||||||||||||||||
Year Ended December 31, 2016 | SunTrust | Other | Total | Vacancy Re-lease To New Tenant | Re-leasing Totals | ||||||||||||||
Number of leases | 90 | 49 | 139 | 16 | 155 | ||||||||||||||
Prior cash rents | $ | 12,527 | $ | 9,537 | $ | 22,064 | $ | 2,726 | $ | 24,790 | |||||||||
New cash rents | $ | 12,715 | $ | 9,627 | $ | 22,342 | $ | 2,266 | $ | 24,608 | (2) | ||||||||
Re-leasing spread | 101.5 | % | 100.9 | % | 101.3 | % | 83.1 | % | 99.3 | % | |||||||||
Tenant improvements | $ | — | $ | 102 | $ | 102 | $ | 3,925 | $ | 4,027 | |||||||||
(1) | Renewal rate for past five years (2011-2016) was 88% |
(2) | Represents 4.5% of total annualized base rent as of December 31, 2016 |
OTHER PROPERTY PORTFOLIO DATA |
# of Properties | % of Annual Base Rent | |||||
Property Level Financial Information | 2,058 | 79 | % | |||
Tenant Corporate Financials | 1,871 | 76 | % | |||
Rent Increases | % of Annual Base Rent | ||||||||||
Annual | Five Year | Other | Total | ||||||||
CPI – Based | 33 | % | 40 | % | 2 | % | 75 | % | |||
Fixed Rate | 4 | % | 13 | % | 3 | % | 20 | % | |||
No increases | — | — | 5 | % | 5 | % | |||||
37 | % | 53 | % | 10 | % | 100 | % | ||||
▪ | 90% of the company's annual base rent is from NNN leases |
▪ | 94% of the company's annual base rent is from NNN leases and NN leases (with roof warranty) |
EARNINGS GUIDANCE |
Core FFO guidance for 2017 is $2.42 to $2.48 per share. The 2017 AFFO is estimated to be $2.46 to $2.52 per share. The FFO guidance equates to net earnings of $1.37 to $1.43 per share, plus $1.05 per share of expected real estate depreciation and amortization and excludes any gains from the sale of real estate and any charges for impairments, severance costs, or preferred stock redemption charges. The guidance is based on current plans and assumptions and subject to risks and uncertainties more fully described in this press release and the company's reports filed with the Securities and Exchange Commission. |
2017 Guidance | ||||||||
Net earnings per common share excluding any gains on sale of real estate, impairment charges, severance charges or charges in connection with preferred stock redemption | $1.37 - $1.43 per share | |||||||
Real estate depreciation and amortization per share | $1.05 per share | |||||||
Core FFO per share | $2.42 - $2.48 per share | |||||||
AFFO per share | $2.46 - $2.52 per share | |||||||
G&A expenses (excluding severance charges) | $34 - $35 Million | |||||||
Real estate expenses, net of tenant reimbursements | $6.0 - $6.5 Million | |||||||
Acquisition volume | $500 - $600 Million | |||||||
Disposition volume | $80 - $120 Million | |||||||
1 Year NNN REIT Chart |
1 Month NNN REIT Chart |

It looks like you are not logged in. Click the button below to log in and keep track of your recent history.
Support: +44 (0) 203 8794 460 | support@advfn.com
By accessing the services available at ADVFN you are agreeing to be bound by ADVFN's Terms & Conditions
 Hot Features