| Share Name | Share Symbol | Market | Type |
|---|---|---|---|
| Nuveen Multi Asset Income Fund | NYSE:NMAI | NYSE | Common Stock |
| Price Change | % Change | Share Price | High Price | Low Price | Open Price | Shares Traded | Last Trade | |
|---|---|---|---|---|---|---|---|---|
| -0.08 | -0.67% | 11.94 | 12.02 | 11.93 | 12.01 | 93,790 | 00:00:00 |
UNITED STATES
SECURITIES AND EXCHANGE COMMISSION
Washington, D.C. 20549
FORM N-CSR
CERTIFIED SHAREHOLDER REPORT OF REGISTERED
MANAGEMENT INVESTMENT COMPANIES
| Investment Company Act file number | 811-23669 |
Nuveen Multi-Asset Income Fund
(Exact name of registrant as specified in charter)
Nuveen Investments
333 West Wacker Drive, Chicago, IL 60606
(Address of principal executive offices) (Zip code)
Mark L. Winget
Nuveen Investments
333 West Wacker Drive, Chicago, IL 60606
(Name and address of agent for service)
Registrant’s telephone number, including area code: (312) 917-7700
Date of fiscal year end: December 31
Date of reporting period: June 30, 2023
Form N-CSR is to be used by management investment companies to file reports with the Commission not later than 10 days after the transmission to stockholders of any report that is required to be transmitted to stockholders under Rule 30e-1 under the Investment Company Act of 1940 (17 CFR 270.30e-1). The Commission may use the information provided on Form N-CSR in its regulatory, disclosure review, inspection, and policy making roles.
A registrant is required to disclose the information specified by Form N-CSR, and the Commission will make this information public. A registrant is not required to respond to the collection of information contained in Form N-CSR unless the Form displays a currently valid Office of Management and Budget (“OMB”) control number. Please direct comments concerning the accuracy of the information collection burden estimate and any suggestions for reducing the burden to Secretary, Securities and Exchange Commission, 450 Fifth Street, NW, Washington, DC 20549-0609. The OMB has reviewed this collection of information under the clearance requirements of 44 U.S.C. ss.3507.
ITEM 1. REPORTS TO STOCKHOLDERS.

Closed-End Funds
June 30, 2023
Nuveen Closed-End Funds
This semi-annual report contains the Fund’s unaudited financial statements.
| NMAI | Nuveen Multi-Asset Income Fund |
Semi-annual Report
| 3 | ||||
| 4 | ||||
| 5 | ||||
| 7 | ||||
| 9 | ||||
| 11 | ||||
| 13 | ||||
| 14 | ||||
| 50 | ||||
| 51 | ||||
| 52 | ||||
| 53 | ||||
| 54 | ||||
| 56 | ||||
| 67 | ||||
| 68 | ||||
| 69 | ||||
| 70 | ||||
2
Chair’s Letter to Shareholders

Dear Shareholders,
The significant measures taken by the U.S. Federal Reserve (Fed) and other global central banks since 2022 to contain inflation have begun to take effect. From March 2022 to July 2023, the Fed raised the target fed funds rate by 5.25% to a range of 5.25% to 5.50%. Even with a brief pause in June 2023, this has been one of the fastest interest rate hiking cycles in the Fed’s history. Inflation rates in the U.S. and across most of the world have fallen from their post-pandemic highs but currently remain above the levels that central banks consider supportive of their economies’ long-term growth, particularly when looking at core inflation measures, which exclude volatile food and energy prices.
At the same time, the U.S. and other large economies have remained relatively resilient, even as financial conditions have tightened. U.S. gross domestic product accelerated to 2.4% in the second quarter of 2023 from 2.0% in the first quarter of 2023, after growing 2.1% in 2022 overall compared to 2021. A relatively strong jobs market has helped support consumer sentiment and spending despite historically high inflation. Markets are concerned that these conditions could keep upward pressure on prices and wages and continue to assess the impact of the collapse of three regional U.S. banks (Silicon Valley Bank, Signature Bank and First Republic Bank) and major European bank Credit Suisse in March 2023.
Fed officials are closely monitoring inflation data and other economic measures to modify their rate setting activity based upon these factors on a meeting-by-meeting basis, including pausing rate adjustments at the June 2023 meeting to assess the effects of monetary policy on the economy. While uncertainty has increased given the unpredictable outcome of tighter credit conditions on the economy, the Fed remains committed to acting until it sees sustainable progress toward its inflation goals. Additionally, market concerns surrounding the U.S. debt ceiling faded after the government agreed in June 2023 to suspend the nation’s borrowing limit until January 2025, averting a near-term default scenario. In the meantime, markets are likely to continue reacting in the short term to news about inflation data, economic indicators and central bank policy. We encourage investors to keep a long-term perspective amid the short-term turbulence. Your financial professional can help you review how well your portfolio is aligned with your time horizon, risk tolerance and investment goals.
On behalf of the other members of the Nuveen Fund Board, we look forward to continuing to earn your trust in the months and years ahead.
Sincerely,

Terence J. Toth
Chair of the Board
August 22, 2023
3
Portfolio Manager Commentaries in Semi-annual Shareholder Reports
The Fund includes portfolio manager commentary in its annual shareholder reports. For the Fund’s most recent annual portfolio manager discussion, please refer to the Portfolio Managers’ Comments section of the Fund’s December 31, 2022 annual shareholder report.
For current information on your Fund’s investment objectives, portfolio management team and average annual total returns please refer to the Fund’s website at www.nuveen.com.
For changes that occurred to your Fund both during and subsequent to this reporting period, please refer to the Notes to Financial Statements section of this report.
For average annual total returns as of the end of this reporting period, please refer to the Performance Overview and Holding Summaries section within this report.
4
IMPACT OF THE FUND’S LEVERAGE STRATEGY ON PERFORMANCE
One important factor impacting the returns of the Fund’s common shares relative to its comparative benchmarks was the Fund’s use of leverage through the use of bank borrowings and reverse repurchase agreemants. The Fund uses leverage because our research has shown that, over time, leveraging provides opportunities for additional income. The opportunity arises when short-term rates that the Fund pays on its leveraging instruments are lower than the interest the Fund earns on its portfolio securities that it has bought with the proceeds of that leverage.
However, use of leverage can expose Fund common shares to additional price volatility. When a Fund uses leverage, the Fund’s common shares will experience a greater increase in their net asset value if the securities acquired through the use of leverage increase in value, but will also experience a correspondingly larger decline in their net asset value if the bonds acquired through leverage decline in value. All this will make the shares’ total return performance more variable, over time.
In addition, common share income in levered funds will typically decrease in comparison to unlevered funds when short-term interest rates increase and increase when short-term interest rates decrease. In recent quarters, fund leverage expenses have generally tracked the overall movement of short-term interest rates. While fund leverage expenses are higher than their prior year lows, leverage nevertheless continues to provide the opportunity for incremental common share income, particularly over longer-term periods.
The Fund’s use of leverage contributed to relative performance during this reporting period.
As of June 30, 2023 the Fund’s percentages of leverage are as shown in the accompanying table.
| NMAI | ||||
| Effective Leverage* |
30.27 | % | ||
| Regulatory Leverage* |
23.39 | % | ||
| * | Effective leverage is a Fund’s effective economic leverage, and includes both regulatory leverage and the leverage effects of reverse repurchase agreements, certain derivative and other investments in the Fund’s portfolio that increase the Fund’s investment exposure. Regulatory leverage consists of preferred shares issued or borrowings of the Fund. Both of these are part of a Fund’s capital structure. The Fund, however, may from time to time borrow on a typically transient basis in connection with its day-to-day operations, primarily in connection with the need to settle portfolio trades. Such incidental borrowings are excluded from the calculation of the Fund’s effective leverage ratio. Regulatory leverage is subject to asset coverage limits set forth in the Investment Company Act of 1940. |
THE FUND’S REGULATORY LEVERAGE
Bank Borrowings
As noted previously, the Fund employs leverage through the use of bank borrowings. The Fund’s bank borrowing activities are as shown in the accompanying table.
| Current Reporting Period | Subsequent to the Close of the Reporting Period |
|||||||||||||||||||||||||||||||||
| Outstanding January 1, 2023 |
Draws | Paydowns | Outstanding Balance as of June 30, 2023 |
Average Balance Outstanding |
Draws | Paydowns | Outstanding Balance as of August 22, 2023 |
|||||||||||||||||||||||||||
| $175,601,000 | $ — | $(36,000,000) | $139,601,000 | $154,838,569 | $16,400,000 | $(41,900,000) | $114,101,000 | |||||||||||||||||||||||||||
Refer to Notes to Financial Statements for further details.
5
Fund Leverage (continued)
Reverse Repurchase Agreements
As noted previously, the Fund uses reverse repurchase agreements, in which the Fund sells to a counterparty a security that it holds with a contemporaneous agreement to repurchase the same security at an agreed-upon price and date. The Fund’s transactions in reverse repurchase agreements are as shown in the accompanying table.
| Current Reporting Period | Subsequent to the Close of the Reporting Period |
|||||||||||||||||||||||||||||||||
| Outstanding Balance as of January 1, 2023 |
Sales | Purchases | Outstanding Balance as of June 30, 2023 |
Average Balance Outstanding |
Sales | Purchases | Outstanding Balance as of August 22, 2023 |
|||||||||||||||||||||||||||
| $59,893,750 | $31,489,000 | $(32,530,770) | $58,851,980 | $59,633,230 | $115,494,140 | $(101,979,960) | $72,366,160 | |||||||||||||||||||||||||||
Refer to Notes to Financial Statements for further details.
6
DISTRIBUTION INFORMATION
The Fund makes regular cash distributions to shareholders of a stated dollar amount per share. Subject to approval and oversight by the Board of Trustees, the Fund seeks to maintain a stable distribution level designed to deliver the long-term return potential of the Fund’s investment strategy through regular distributions (a “Managed Distribution Program”). The practice of maintaining a stable distribution level had no material effect on the Fund’s investment strategy during the most recent fiscal period and is not expected to have such an effect in future periods, however, distributions in excess of Fund returns will cause its NAV per share to erode. For additional information, refer to the distribution information section below and in the Notes to Financial Statements herein.
The following information regarding the Fund’s distributions is current as of May 31, 2023, the date of the distribution data included within the Fund’s most recent distribution notice at the time this report was prepared. This notice provides shareholders with information regarding fund distributions, as required by current securities laws. You should not draw any conclusions about the Fund’s investment performance from the amount of the distribution or from the terms of the Fund’s Managed Distribution Policy.
The following table provides estimates of the Fund’s distribution sources, reflecting year-to-date cumulative experience through the month-end prior to the latest distribution. The Fund attributes these estimates equally to each regular distribution throughout the year. Consequently, the estimated information as of the specified month-end shown below is for the current distribution, and also represents an updated estimate for all prior months in the year. It is estimated that the Fund has distributed more than its income and net realized capital gains; therefore, a portion of the distributions may be (and is shown below as being estimated to be) a return of capital. A return of capital may occur, for example, when some or all of the money that you invested in the Fund is paid back to you. A return of capital distribution does not necessarily reflect the Fund’s investment performance and should not be confused with “yield” or “income.”
The amounts and sources of distributions set forth below are only estimates and are not being provided for tax reporting purposes. The actual amounts and sources of the amounts for tax reporting purposes will be reported to shareholders on Form 1099-DIV which will be sent to shareholders shortly after calendar year-end based on the information from the issuer of the security. More details about the Fund’s distributions and the basis for these estimates are available on www.nuveen.com/cef.
Data as of May 31, 2023
| Per Share Estimated Sources of Distribution | Estimated Percentage of the Distribution | |||||||||||||||||||||||||||||||||||||||
| Fund |
Inception Date |
Per Share Distribution |
Net Investment Income |
Long-Term Gains |
Short-Term Gains |
Return of Capital1 |
Net Investment Income |
Long-Term Gains |
Short-Term Gains |
Return of Capital1 |
||||||||||||||||||||||||||||||
| NMAI (FYE 12/31) |
Nov-2021 | |||||||||||||||||||||||||||||||||||||||
| Current Quarter |
$0.3000 | $0.1586 | $0.000 | $0.000 | $0.1414 | 52.9% | 0.00% | 0.00% | 47.1% | |||||||||||||||||||||||||||||||
| Fiscal YTD |
$0.6000 | $0.3172 | $0.0000 | $0.0000 | $0.2828 | 52.9% | 0.00% | 0.00% | 47.1% | |||||||||||||||||||||||||||||||
7
Common Share Information (continued)
The following table provides information regarding distributions and total return performance over various time periods. This information is intended to help you better understand whether returns for the specified time periods were sufficient to meet distributions.
| Annualized | Cumulative | |||||||||||||||||||||||||||||||
| Fund | Inception Date |
Latest Quarterly Distribution |
Fiscal YTD Distribution |
Net Asset Value (NAV) |
Since Inception Return on NAV |
Fiscal YTD Distribution Rate |
Fiscal YTD Return on NAV |
Fiscal YTD Distribution Rate on NAV |
||||||||||||||||||||||||
| NMAI |
Nov-2021 | $0.3000 | $0.6000 | $13.38 | (12.82)% | 8.97% | 1.97% | 4.48% | ||||||||||||||||||||||||
| 1 | Return of Capital may represent unrealized gains, return of shareholder’s principal, or both. In certain circumstances, all or a portion of the return of capital may be characterized as ordinary income under federal tax law. The actual tax characterization will be provided to shareholders on Form 1099-DIV shortly after calendar year-end. |
NUVEEN CLOSED-END FUND DISTRIBUTION AMOUNTS
The Nuveen Closed-End Funds’ monthly and quarterly periodic distributions to shareholders are posted on www.nuveen.com and can be found on Nuveen’s enhanced closed-end fund resource page, which is at https://www.nuveen.com/resource-center-closed-end-funds, along with other Nuveen closed-end fund product updates. To ensure timely access to the latest information, shareholders may use a subscribe function, which can be activated at this web page (https://www.nuveen.com/subscriptions).
COMMON SHARE REPURCHASES
The Fund’s Board of Trustees authorized an open-market share repurchase program, allowing the Fund to repurchase and retire an aggregate of up to approximately 10% of its outstanding common shares.
During the current reporting period, the Fund did not repurchase any of its outstanding common shares. As of June 30, 2023 (and since the inception of the Fund’s repurchase programs), the Fund has cumulatively repurchased and retired common shares as shown in the accompanying table.
| NMAI | ||||
| Common shares cumulatively repurchased and retired |
0 | |||
| Common shares authorized for repurchase |
3,340,000 | |||
OTHER COMMON SHARE INFORMATION
As of June 30, 2023, the Fund’s common share price was trading at a premium/(discount) to its common share NAV and trading at an average premium/(discount) to NAV during the current reporting period, as follows:
| NMAI | ||||
| Common share NAV |
$ | 13.68 | ||
| Common share price |
$ | 11.66 | ||
| Premium/(Discount) to NAV |
(14.77 | )% | ||
| Average premium/(discount) to NAV |
(14.16 | )% | ||
8
| ∎ | Bloomberg U.S. Corporate High Yield Bond Index: An index designed to measure the performance of the USD-denominated, fixed-rate corporate high yield bond market. Index returns assume reinvestment of distributions, but do not reflect any applicable sales charges or management fees. |
| ∎ | MSCI ACWI Index (Net): An Index designed to measure the performance of large and mid-cap stocks across 23 developed and 24 emerging markets. Index returns assume reinvestment of distributions, but do not reflect any applicable sales charges or management fees. |
| ∎ | NMAI Blended Benchmark: Consists of: 1) 50% MSCI ACWI Index (Net) (defined herein), and 2) 50% Bloomberg U.S. Corporate High Yield Bond Index (defined herein). Index returns assume reinvestment of distributions, but do not reflect any applicable sales charges or management fees. |
| ∎ | S&P 500® Index: An index generally considered representative of the U.S. equity market. The index includes 500 leading companies and covers approximately 80% of available market capitalization. Index returns assume reinvestment of distributions, but do not reflect any applicable sales charges or management fees. |
9
[THIS PAGE INTENTIONALLY LEFT BLANK]
| NMAI | Nuveen Multi-Asset Income Fund Performance Overview and Holding Summaries as of June 30, 2023 |
Refer to the Glossary of Terms Used in this Report for further definition of the terms used within this section.
Fund Performance*
| Cumulative | Average Annual | |||||||||||
| 6-Month | 1-Year | Since Inception |
||||||||||
| NMAI at Common Share NAV | 6.55% | 5.41% | (9.70)% | |||||||||
| NMAI at Common Share Price | 6.84% | 6.09% | (14.79)% | |||||||||
| S&P 500® Index | 16.89% | 19.59% | (2.74)% | |||||||||
| NMAI Blended Benchmark | 9.62% | 12.92% | (5.89)% | |||||||||
| * | For purposes of Fund performance, relative results are measured against the NMAI Blended Benchmark. The Fund’s Blended Benchmark consists of: 1) 50% MSCI ACWI Index (Net) and 2) 50% Bloomberg U.S. Corporate High Yield Bond Index. |
Since inception returns are from 11/22/21. Performance data shown represents past performance and does not predict or guarantee future results. Current performance may be higher or lower than the data shown. Returns do not reflect the deduction of taxes that shareholders may have to pay on Fund distributions or upon the sale of Fund shares. Returns at NAV are net of Fund expenses, and assume reinvestment of distributions. Comparative index return information is provided for the Fund’s shares at NAV only. Indexes are not available for direct investment.
Daily Common Share NAV and Share Price
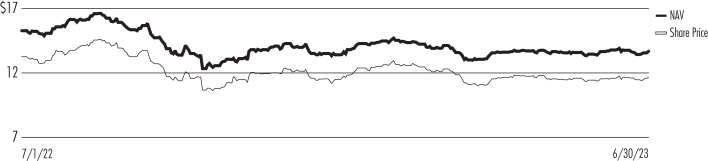
11
This data relates to the securities held in the Fund’s portfolio of investments as of the end of the reporting period. It should not be construed as a measure of performance for the Fund itself. Holdings are subject to change.
The Fund uses credit quality ratings for its portfolio securities provided by Standard & Poor’s Group, Moody’s Investors Service, Inc. and Fitch, Inc. If all three provide a rating for a security, the middle is used; if two of the three agencies rate a security, the lower rating is used; and if only one rating agency rates a security, that rating is used. This treatment of split-rated securities may differ from that used for other purposes, such as for Fund investment policies. Credit ratings are subject to change. AAA, AA, A and BBB are investment grade ratings; BB, B, CCC, CC, C and D are below-investment grade ratings. Holdings designated N/R are not rated by these national rating agencies.
Fund Allocation
(% of net assets)
| Common Stocks | 58.4% | |||
| Asset-Backed and Mortgage-Backed Securities | 17.9% | |||
| Variable Rate Senior Loan Interests | 12.7% | |||
| Exchange-Traded Funds | 11.9% | |||
| Real Estate Investment Trust Common Stocks | 9.4% | |||
| Emerging Market Debt And Foreign Corporate Bonds | 9.1% | |||
| $1000 Par (or similar) Institutional Preferred | 9.1% | |||
| Contingent Capital Securities | 6.2% | |||
| $25 Par (or similar) Retail Preferred | 3.9% | |||
| Corporate Bonds | 1.8% | |||
| Warrants | 0.1% | |||
| Options Purchased |
0.0% | |||
| Investment Companies | 0.1% | |||
| Repurchase Agreements | 4.8% | |||
| Other Assets Less Liabilities | (1.6)% | |||
| Borrowings | (30.5)% | |||
| Reverse Repurchase Agreements | (13.3)% | |||
| Net Assets |
100% |
Portfolio Credit Quality
(% of total fixed-income investments)
| AAA | 1.2% | |||
| AA | 2.4% | |||
| A | 1.2% | |||
| BBB | 30.6% | |||
| BB or Lower | 37.4% | |||
| N/R | 27.2% | |||
| Total |
100% |
Portfolio Composition1
(% of total investments)
| Asset-Backed and Mortgage-Backed Securities | 12.3% | |||
| Banks | 9.7% | |||
| Equity Real Estate Investment Trusts | 6.5% | |||
| Emerging Market Debt And Foreign Corporate Bonds | 6.3% | |||
| Oil, Gas & Consumable Fuels | 4.9% | |||
| Electric Utilities | 3.0% | |||
| Pharmaceuticals | 2.9% | |||
| Insurance | 2.5% | |||
| Semiconductors & Semiconductor Equipment | 2.4% | |||
| Software | 2.2% | |||
| Transportation Infrastructure | 2.2% | |||
| Hotels, Restaurants & Leisure | 1.9% | |||
| Capital Markets | 1.8% | |||
| Health Care Providers & Services | 1.4% | |||
| Multi-Utilities | 1.2% | |||
| Media | 1.2% | |||
| Automobiles | 1.1% | |||
| Beverages | 1.1% | |||
| Health Care Equipment & Supplies | 1.1% | |||
| Industrial Conglomerates | 1.0% | |||
| Commercial Services & Supplies | 1.0% | |||
| Ground Transportation | 1.0% | |||
| Other | 19.8% | |||
| Exchange-Traded Funds | 8.2% | |||
| Investment Companies | 0.0% | |||
| Repurchase Agreements | 3.3% | |||
| Total |
100% |
Top Five Issuers
(% of total investments)
| Fannie Mae Pool |
7.7% | |||
| iShares Core MSCI Emerging Markets ETF | 5.9% | |||
| Vanguard Short-Term Bond ETF | 2.0% | |||
| Ginnie Mae II Pool | 1.5% | |||
| Prologis Inc | 0.8% |
Country Allocation2
(% of total investments)
| United States | 64.9% | |||
| Japan | 3.4% | |||
| United Kingdom | 3.3% | |||
| France | 3.2% | |||
| Netherlands | 2.1% | |||
| Canada | 2.0% | |||
| Australia | 1.8% | |||
| Germany | 1.7% | |||
| China | 1.4% | |||
| Spain | 1.3% | |||
| Mexico | 1.3% | |||
| Other | 13.6% | |||
| Total |
100% |
| 1 | See the Portfolio of Investments for the remaining industries comprising “Other” and not listed in the table above. |
| 2 | Includes 6.3% (as a percentage of total investments) in emerging market countries. |
12
The annual meeting of shareholders was held on May 8, 2023 for NMAI; at this meeting the shareholders were asked to elect Board members.
| NMAI | ||||
| Common Shares |
||||
| Approval of the Board Members was reached as follows: |
||||
| Amy B.R. Lancellotta |
||||
| For |
23,916,638 | |||
| Withhold |
2,923,258 | |||
| Total |
26,839,896 | |||
| John K. Nelson |
||||
| For |
23,623,520 | |||
| Withhold |
3,216,376 | |||
| Total |
26,839,896 | |||
| Terence J. Toth |
||||
| For |
23,986,944 | |||
| Withhold |
2,852,952 | |||
| Total |
26,839,896 | |||
| Robert L. Young |
||||
| For |
23,629,496 | |||
| Withhold |
3,210,400 | |||
| Total |
26,839,896 | |||
13
| NMAI | Nuveen Multi-Asset Income Fund
| |
| (Unaudited) |
| Shares | Description (1) | Value | ||||||||||||||||||||
| LONG-TERM INVESTMENTS – 140.6% (96.7% of Total Investments) |
||||||||||||||||||||||
| COMMON STOCKS – 58.4% (40.2% of Total Investments) |
||||||||||||||||||||||
| Aerospace & Defense – 1.0% | ||||||||||||||||||||||
| 20,515 | Airbus SE |
$ | 2,966,095 | |||||||||||||||||||
| 1,350 | Boeing Co/The (2) |
285,066 | ||||||||||||||||||||
| 80,900 | Embraer SA (2) |
313,246 | ||||||||||||||||||||
| 295 | Northrop Grumman Corp |
134,461 | ||||||||||||||||||||
| 7,286 | Raytheon Technologies Corp (3) |
713,737 | ||||||||||||||||||||
| Total Aerospace & Defense |
4,412,605 | |||||||||||||||||||||
| Air Freight & Logistics – 0.5% | ||||||||||||||||||||||
| 13,619 | Deutsche Post AG |
665,455 | ||||||||||||||||||||
| 5,444 | DSV A/S |
1,143,465 | ||||||||||||||||||||
| 1,643 | United Parcel Service Inc, Class B |
294,508 | ||||||||||||||||||||
| Total Air Freight & Logistics |
2,103,428 | |||||||||||||||||||||
| Automobiles – 1.1% | ||||||||||||||||||||||
| 970,200 | Astra International Tbk PT |
440,061 | ||||||||||||||||||||
| 208,000 | Geely Automobile Holdings Ltd |
255,392 | ||||||||||||||||||||
| 8,284 | Tesla Inc (2), (3) |
2,168,503 | ||||||||||||||||||||
| 143,100 | Toyota Motor Corp (2) |
2,299,915 | ||||||||||||||||||||
| Total Automobiles |
5,163,871 | |||||||||||||||||||||
| Banks – 3.8% | ||||||||||||||||||||||
| 207,459 | Banco Bilbao Vizcaya Argentaria SA |
1,593,846 | ||||||||||||||||||||
| 20,287 | Bank of America Corp |
582,034 | ||||||||||||||||||||
| 851,500 | Bank Rakyat Indonesia Persero Tbk PT |
310,875 | ||||||||||||||||||||
| 15,721 | BNP Paribas SA |
992,089 | ||||||||||||||||||||
| 15,355 | Commonwealth Bank of Australia |
1,027,968 | ||||||||||||||||||||
| 1,904 | Credicorp Ltd |
281,107 | ||||||||||||||||||||
| 60,700 | Grupo Financiero Banorte SAB de CV |
500,756 | ||||||||||||||||||||
| 12,413 | HDFC Bank Ltd, ADR |
865,186 | ||||||||||||||||||||
| 116,179 | ING Groep NV |
1,566,278 | ||||||||||||||||||||
| 20,012 | JPMorgan Chase & Co |
2,910,545 | ||||||||||||||||||||
| 7,006 | KB Financial Group Inc |
254,281 | ||||||||||||||||||||
| 182,300 | Mitsubishi UFJ Financial Group Inc |
1,343,747 | ||||||||||||||||||||
| 73,493 | Nordea Bank Abp |
800,555 | ||||||||||||||||||||
| 2,458 | PNC Financial Services Group Inc/The |
309,585 | ||||||||||||||||||||
| 47,300 | Sumitomo Mitsui Financial Group Inc |
2,027,251 | ||||||||||||||||||||
| 5,860 | Truist Financial Corp |
177,851 | ||||||||||||||||||||
| 45,030 | Wells Fargo & Co (3) |
1,921,880 | ||||||||||||||||||||
| Total Banks |
17,465,834 | |||||||||||||||||||||
| Beverages – 1.3% | ||||||||||||||||||||||
| 16,896 | Coca-Cola Co/The (3) |
1,017,477 | ||||||||||||||||||||
| 12,019 | Diageo PLC |
516,708 | ||||||||||||||||||||
| 17,821 | Fomento Economico Mexicano SAB de CV, Sponsored ADR |
1,975,280 | ||||||||||||||||||||
| 10,798 | Heineken NV |
1,110,429 | ||||||||||||||||||||
| 11,972 | Keurig Dr Pepper Inc |
374,364 | ||||||||||||||||||||
| 13,515 | Monster Beverage Corp (2), (3) |
776,302 | ||||||||||||||||||||
| 2,127 | PepsiCo Inc |
393,963 | ||||||||||||||||||||
| Total Beverages |
6,164,523 | |||||||||||||||||||||
| Biotechnology – 0.2% | ||||||||||||||||||||||
| 5,881 | AbbVie Inc |
792,347 | ||||||||||||||||||||
| Total Biotechnology |
792,347 | |||||||||||||||||||||
| Broadline Retail – 1.2% | ||||||||||||||||||||||
| 153,900 | Alibaba Group Holding Ltd (2) |
1,602,072 | ||||||||||||||||||||
| 13,966 | Alibaba Group Holding Ltd, Sponsored ADR (2) |
1,164,066 | ||||||||||||||||||||
14
| Shares | Description (1) | Value | ||||||||||||||||||||||||||||||
| Broadline Retail (continued) | ||||||||||||||||||||||||||||||||
| 17,532 | Amazon.com Inc (2), (4) |
$ | 2,285,472 | |||||||||||||||||||||||||||||
| 1 | Belk Inc (2) |
8 | ||||||||||||||||||||||||||||||
| 26,200,400 | GoTo Gojek Tokopedia Tbk PT (2) |
193,352 | ||||||||||||||||||||||||||||||
| 20,400 | JD.com Inc, Class A |
347,913 | ||||||||||||||||||||||||||||||
| 2,158 | PDD Holdings Inc (2) |
149,204 | ||||||||||||||||||||||||||||||
| Total Broadline Retail |
5,742,087 | |||||||||||||||||||||||||||||||
| Building Products – 0.6% | ||||||||||||||||||||||||||||||||
| 1,242 | Allegion plc |
149,065 | ||||||||||||||||||||||||||||||
| 18,804 | Cie de Saint-Gobain |
1,144,907 | ||||||||||||||||||||||||||||||
| 4,200 | Daikin Industries Ltd |
860,602 | ||||||||||||||||||||||||||||||
| 3,188 | Masco Corp (3) |
182,928 | ||||||||||||||||||||||||||||||
| 2,208 | Trane Technologies PLC |
422,302 | ||||||||||||||||||||||||||||||
| Total Building Products |
2,759,804 | |||||||||||||||||||||||||||||||
| Capital Markets – 0.7% | ||||||||||||||||||||||||||||||||
| 473 | BlackRock Inc |
326,909 | ||||||||||||||||||||||||||||||
| 9,105 | Charles Schwab Corp/The |
516,072 | ||||||||||||||||||||||||||||||
| 1,339 | Goldman Sachs Group Inc/The |
431,881 | ||||||||||||||||||||||||||||||
| 7,800 | Hong Kong Exchanges & Clearing Ltd |
295,534 | ||||||||||||||||||||||||||||||
| 1,359 | Intercontinental Exchange Inc |
153,676 | ||||||||||||||||||||||||||||||
| 10,116 | Morgan Stanley (3) |
863,906 | ||||||||||||||||||||||||||||||
| 552 | S&P Global Inc |
221,291 | ||||||||||||||||||||||||||||||
| 24,700 | SBI Holdings Inc |
476,363 | ||||||||||||||||||||||||||||||
| Total Capital Markets |
3,285,632 | |||||||||||||||||||||||||||||||
| Chemicals – 1.2% | ||||||||||||||||||||||||||||||||
| 1,508 | Celanese Corp |
174,626 | ||||||||||||||||||||||||||||||
| 15,193 | Corteva Inc (3) |
870,559 | ||||||||||||||||||||||||||||||
| 5,183 | DuPont de Nemours Inc (3) |
370,274 | ||||||||||||||||||||||||||||||
| 1,441 | International Flavors & Fragrances Inc |
114,689 | ||||||||||||||||||||||||||||||
| 2,108 | Linde PLC |
803,317 | ||||||||||||||||||||||||||||||
| 7,992 | Linde PLC |
3,048,067 | ||||||||||||||||||||||||||||||
| Total Chemicals |
5,381,532 | |||||||||||||||||||||||||||||||
| Commercial Banks – 0.1% | ||||||||||||||||||||||||||||||||
| 1,128,800 | Bank Mandiri Persero Tbk PT |
392,830 | ||||||||||||||||||||||||||||||
| Total Commercial Banks |
392,830 | |||||||||||||||||||||||||||||||
| Commercial Services & Supplies – 0.8% | ||||||||||||||||||||||||||||||||
| 5,781 | Casella Waste Systems Inc, Class A (2) |
522,891 | ||||||||||||||||||||||||||||||
| 166,992 | Cleanaway Waste Management Ltd |
288,894 | ||||||||||||||||||||||||||||||
| 3,319 | Republic Services Inc |
508,371 | ||||||||||||||||||||||||||||||
| 9,797 | Waste Connections Inc (4) |
1,400,285 | ||||||||||||||||||||||||||||||
| 5,961 | Waste Management Inc |
1,033,757 | ||||||||||||||||||||||||||||||
| Total Commercial Services & Supplies |
3,754,198 | |||||||||||||||||||||||||||||||
| Communications Equipment – 0.2% | ||||||||||||||||||||||||||||||||
| 4,662 | Avaya Holdings Corp (2), (5) |
46,107 | ||||||||||||||||||||||||||||||
| 7,237 | Cisco Systems Inc | 374,442 | ||||||||||||||||||||||||||||||
| 1,213 | Motorola Solutions Inc |
355,749 | ||||||||||||||||||||||||||||||
| Total Communications Equipment |
776,298 | |||||||||||||||||||||||||||||||
| Construction & Engineering – 0.7% | ||||||||||||||||||||||||||||||||
| 4,062 | Eiffage SA |
424,107 | ||||||||||||||||||||||||||||||
| 19,652 | Ferrovial SE | 621,240 | ||||||||||||||||||||||||||||||
| 20,047 | Vinci SA |
2,329,370 | ||||||||||||||||||||||||||||||
| Total Construction & Engineering |
3,374,717 | |||||||||||||||||||||||||||||||
| Construction Materials – 0.7% | ||||||||||||||||||||||||||||||||
| 34,441 | CRH PLC |
1,900,018 | ||||||||||||||||||||||||||||||
| 15,941 | Heidelberg Materials AG |
1,310,966 | ||||||||||||||||||||||||||||||
| Total Construction Materials |
3,210,984 | |||||||||||||||||||||||||||||||
15
| NMAI | Nuveen Multi-Asset Income Fund (continued) | |
| Portfolio of Investments June 30, 2023 | ||
| (Unaudited) | ||
| Shares | Description (1) | Value | ||||||||||||||||||||||||||||||
| Consumer Finance – 0.1% | ||||||||||||||||||||||||||||||||
| 3,944 | American Express Co | $ | 687,045 | |||||||||||||||||||||||||||||
| Total Consumer Finance |
687,045 | |||||||||||||||||||||||||||||||
| Consumer Staples Distribution & Retail – 0.7% | ||||||||||||||||||||||||||||||||
| 2,295 | Costco Wholesale Corp (3) |
1,235,582 | ||||||||||||||||||||||||||||||
| 1,069 | Dollar General Corp | 181,495 | ||||||||||||||||||||||||||||||
| 10,230 | Walmart Inc (3) |
1,607,951 | ||||||||||||||||||||||||||||||
| Total Consumer Staples Distribution & Retail |
3,025,028 | |||||||||||||||||||||||||||||||
| Containers & Packaging – 0.3% | ||||||||||||||||||||||||||||||||
| 12,237 | Crown Holdings Inc (3) |
1,063,028 | ||||||||||||||||||||||||||||||
| 922 | Packaging Corp of America |
121,852 | ||||||||||||||||||||||||||||||
| Total Containers & Packaging |
1,184,880 | |||||||||||||||||||||||||||||||
| Diversified Telecommunication Services – 0.5% | ||||||||||||||||||||||||||||||||
| 23,745 | Cellnex Telecom SA |
959,388 | ||||||||||||||||||||||||||||||
| 11,544 | IHS Holding Ltd (2), (3) | 112,900 | ||||||||||||||||||||||||||||||
| 17,899 | Infrastrutture Wireless Italiane SpA | 236,272 | ||||||||||||||||||||||||||||||
| 212,430 | Koninklijke KPN NV | 758,369 | ||||||||||||||||||||||||||||||
| 80,000 | NETLINK NBN TRUST |
50,632 | ||||||||||||||||||||||||||||||
| Total Diversified Telecommunication Services |
2,117,561 | |||||||||||||||||||||||||||||||
| Electric Utilities – 3.7% | ||||||||||||||||||||||||||||||||
| 6,742 | American Electric Power Co Inc |
567,676 | ||||||||||||||||||||||||||||||
| 66,500 | CK Infrastructure Holdings Ltd | 352,722 | ||||||||||||||||||||||||||||||
| 40,500 | CLP Holdings Ltd | 315,438 | ||||||||||||||||||||||||||||||
| 31,156 | Contact Energy Ltd | 155,068 | ||||||||||||||||||||||||||||||
| 9,199 | Duke Energy Corp | 825,518 | ||||||||||||||||||||||||||||||
| 113,541 | EDP-Energias de Portugal SA | 554,950 | ||||||||||||||||||||||||||||||
| 660 | Elia Group SA/NV | 83,856 | ||||||||||||||||||||||||||||||
| 4,584 | Emera Inc | 188,793 | ||||||||||||||||||||||||||||||
| 16,019 | Endesa SA | 344,210 | ||||||||||||||||||||||||||||||
| 300,642 | Enel SpA | 2,027,056 | ||||||||||||||||||||||||||||||
| 33,019 | Exelon Corp (3) | 1,345,194 | ||||||||||||||||||||||||||||||
| 14,432 | Hydro One Ltd | 412,343 | ||||||||||||||||||||||||||||||
| 61,958 | Iberdrola SA | 809,097 | ||||||||||||||||||||||||||||||
| 30,866 | Infratil Ltd | 192,595 | ||||||||||||||||||||||||||||||
| 34,559 | NextEra Energy Inc (3) | 2,564,278 | ||||||||||||||||||||||||||||||
| 2,701 | Orsted AS | 256,061 | ||||||||||||||||||||||||||||||
| 31,135 | PG&E Corp (2), (3) | 538,013 | ||||||||||||||||||||||||||||||
| 4,500 | Power Assets Holdings Ltd | 23,623 | ||||||||||||||||||||||||||||||
| 19,809 | PPL Corp | 524,146 | ||||||||||||||||||||||||||||||
| 31,183 | Southern Co/The (4) | 2,190,606 | ||||||||||||||||||||||||||||||
| 19,263 | SSE PLC | 451,719 | ||||||||||||||||||||||||||||||
| 97,349 | Terna-Rete Elettrica Nazionale | 830,305 | ||||||||||||||||||||||||||||||
| 20,948 | Xcel Energy Inc (3) |
1,302,337 | ||||||||||||||||||||||||||||||
| Total Electric Utilities |
16,855,604 | |||||||||||||||||||||||||||||||
| Electrical Equipment – 0.3% | ||||||||||||||||||||||||||||||||
| 18,281 | Contemporary Amperex Technology Co Ltd, Class A |
577,611 | ||||||||||||||||||||||||||||||
| 3,763 | Eaton Corp PLC (3) |
756,739 | ||||||||||||||||||||||||||||||
| Total Electrical Equipment |
1,334,350 | |||||||||||||||||||||||||||||||
| Electronic Equipment, Instruments & Components – 0.4% | ||||||||||||||||||||||||||||||||
| 21,000 | Delta Electronics Inc |
232,729 | ||||||||||||||||||||||||||||||
| 150,400 | Foxconn Industrial Internet Co Ltd, Class A | 521,698 | ||||||||||||||||||||||||||||||
| 1,500 | Keyence Corp | 712,735 | ||||||||||||||||||||||||||||||
| 3,332 | TE Connectivity Ltd (3) |
467,013 | ||||||||||||||||||||||||||||||
| Total Electronic Equipment, Instruments & Components |
1,934,175 | |||||||||||||||||||||||||||||||
| Energy Equipment & Services – 0.2% | ||||||||||||||||||||||||||||||||
| 7,238 | Quarternorth Energy Holding Inc (2) |
814,275 | ||||||||||||||||||||||||||||||
| 7,368 | Transocean Ltd (2) |
51,650 | ||||||||||||||||||||||||||||||
| Total Energy Equipment & Services |
865,925 | |||||||||||||||||||||||||||||||
16
| Shares | Description (1) | Value | ||||||||||||||||||||||||||||||
| Entertainment – 0.9% | ||||||||||||||||||||||||||||||||
| 67,358 | HUYA Inc, ADR (2) |
$ | 241,142 | |||||||||||||||||||||||||||||
| 37,110 | Nintendo Co Ltd | 1,691,782 | ||||||||||||||||||||||||||||||
| 14,395 | Sea Ltd, ADR (2) | 835,486 | ||||||||||||||||||||||||||||||
| 16,953 | Universal Music Group NV | 376,607 | ||||||||||||||||||||||||||||||
| 10,450 | Walt Disney Co/The (2), (3) |
932,976 | ||||||||||||||||||||||||||||||
| Total Entertainment |
4,077,993 | |||||||||||||||||||||||||||||||
| Financial Services – 0.7% | ||||||||||||||||||||||||||||||||
| 2,227 | Berkshire Hathaway Inc, Class B (2), (3) |
759,407 | ||||||||||||||||||||||||||||||
| 2,177 | Fidelity National Information Services Inc | 119,082 | ||||||||||||||||||||||||||||||
| 3,638 | Fiserv Inc (2), (3) | 458,934 | ||||||||||||||||||||||||||||||
| 694 | Mastercard Inc | 272,950 | ||||||||||||||||||||||||||||||
| 32,100 | ORIX Corp | 585,381 | ||||||||||||||||||||||||||||||
| 4,075 | Visa Inc, Class A (3) |
967,731 | ||||||||||||||||||||||||||||||
| Total Financial Services |
3,163,485 | |||||||||||||||||||||||||||||||
| Food & Staples Retailing – 0.2% | ||||||||||||||||||||||||||||||||
| 124,900 | Cia Brasileira de Distribuicao (2) |
488,050 | ||||||||||||||||||||||||||||||
| 146,783 | Sendas Distribuidora S/A |
421,508 | ||||||||||||||||||||||||||||||
| Total Food & Staples Retailing |
909,558 | |||||||||||||||||||||||||||||||
| Food Products – 0.2% | ||||||||||||||||||||||||||||||||
| 7,072 | Mondelez International Inc, Class A |
515,832 | ||||||||||||||||||||||||||||||
| 5,314 | Nestle SA |
639,229 | ||||||||||||||||||||||||||||||
| Total Food Products |
1,155,061 | |||||||||||||||||||||||||||||||
| Gas Utilities – 0.3% | ||||||||||||||||||||||||||||||||
| 2,688 | AltaGas Ltd |
48,292 | ||||||||||||||||||||||||||||||
| 56,507 | APA Group |
365,598 | ||||||||||||||||||||||||||||||
| 213,000 | Hong Kong & China Gas Co Ltd |
184,456 | ||||||||||||||||||||||||||||||
| 60,271 | Italgas SpA |
357,326 | ||||||||||||||||||||||||||||||
| 78,841 | Snam SpA |
412,050 | ||||||||||||||||||||||||||||||
| Total Gas Utilities |
1,367,722 | |||||||||||||||||||||||||||||||
| Ground Transportation – 1.2% | ||||||||||||||||||||||||||||||||
| 5,518 | Canadian National Railway Co (3) |
668,064 | ||||||||||||||||||||||||||||||
| 5,775 | Canadian Pacific Railway Ltd |
466,447 | ||||||||||||||||||||||||||||||
| 3,100 | Central Japan Railway Co |
388,403 | ||||||||||||||||||||||||||||||
| 17,674 | CSX Corp |
602,683 | ||||||||||||||||||||||||||||||
| 17,000 | East Japan Railway Co |
942,709 | ||||||||||||||||||||||||||||||
| 21,350 | Localiza Rent a Car SA |
305,433 | ||||||||||||||||||||||||||||||
| 783 | Norfolk Southern Corp |
177,553 | ||||||||||||||||||||||||||||||
| 10,183 | Union Pacific Corp (3) |
2,083,646 | ||||||||||||||||||||||||||||||
| Total Ground Transportation |
5,634,938 | |||||||||||||||||||||||||||||||
| Health Care Equipment & Supplies – 1.1% | ||||||||||||||||||||||||||||||||
| 14,127 | Abbott Laboratories |
1,540,125 | ||||||||||||||||||||||||||||||
| 14,925 | Boston Scientific Corp (2), (3) |
807,293 | ||||||||||||||||||||||||||||||
| 6,012 | EssilorLuxottica SA |
1,133,684 | ||||||||||||||||||||||||||||||
| 4,540 | Medtronic PLC |
399,974 | ||||||||||||||||||||||||||||||
| 3,042 | Stryker Corp |
928,084 | ||||||||||||||||||||||||||||||
| 998 | Zimmer Biomet Holdings Inc |
145,309 | ||||||||||||||||||||||||||||||
| Total Health Care Equipment & Supplies |
4,954,469 | |||||||||||||||||||||||||||||||
| Health Care Providers & Services – 0.7% | ||||||||||||||||||||||||||||||||
| 1,724 | Cigna Group/The |
483,754 | ||||||||||||||||||||||||||||||
| 1,676 | Elevance Health Inc |
744,630 | ||||||||||||||||||||||||||||||
| 1,501 | HCA Inc |
455,524 | ||||||||||||||||||||||||||||||
| 12,280 | Millennium Health LLC (2), (5) |
1,756 | ||||||||||||||||||||||||||||||
| 11,534 | Millennium Health LLC (2), (5) |
496 | ||||||||||||||||||||||||||||||
| 3,601 | UnitedHealth Group Inc (3) |
1,730,785 | ||||||||||||||||||||||||||||||
| Total Health Care Providers & Services |
3,416,945 | |||||||||||||||||||||||||||||||
17
| NMAI | Nuveen Multi-Asset Income Fund (continued) | |
| Portfolio of Investments June 30, 2023 | ||
| (Unaudited) | ||
| Shares | Description (1) | Value | ||||||||||||||||||||
| Hotels, Restaurants & Leisure – 1.0% | ||||||||||||||||||||||
| 174,789 | 24 Hour Fitness Worldwide Inc (2) |
$ | 1,049 | |||||||||||||||||||
| 83,128 | 24 Hour Fitness Worldwide Inc (2) |
499 | ||||||||||||||||||||
| 116,034 | Arcos Dorados Holdings Inc, Class A |
1,189,348 | ||||||||||||||||||||
| 87 | Booking Holdings Inc (2) |
234,929 | ||||||||||||||||||||
| 3,109 | Hilton Worldwide Holdings Inc |
452,515 | ||||||||||||||||||||
| 5,754 | McDonald’s Corp |
1,717,051 | ||||||||||||||||||||
| 32,851 | Melco Resorts & Entertainment Ltd (2) |
401,111 | ||||||||||||||||||||
| 438,000 | Wynn Macau Ltd (2) |
400,030 | ||||||||||||||||||||
| 1,750 | Wynn Resorts Ltd |
184,817 | ||||||||||||||||||||
| Total Hotels, Restaurants & Leisure |
4,581,349 | |||||||||||||||||||||
| Household Durables – 0.8% | ||||||||||||||||||||||
| 64 | NVR Inc (2) |
406,440 | ||||||||||||||||||||
| 35,300 | Sony Group Corp |
3,186,537 | ||||||||||||||||||||
| Total Household Durables |
3,592,977 | |||||||||||||||||||||
| Household Products – 0.5% | ||||||||||||||||||||||
| 9,739 | Procter & Gamble Co/The (3) |
1,477,796 | ||||||||||||||||||||
| 13,330 | Reckitt Benckiser Group PLC |
1,001,759 | ||||||||||||||||||||
| Total Household Products |
2,479,555 | |||||||||||||||||||||
| Independent Power and Renewable Electricity Producers – 0.7% | ||||||||||||||||||||||
| 4,297 | Clearway Energy Inc, Class C (3) |
122,722 | ||||||||||||||||||||
| 8,746 | EDP Renovaveis SA |
174,776 | ||||||||||||||||||||
| 24,039 | Meridian Energy Ltd |
82,780 | ||||||||||||||||||||
| 1,293 | NextEra Energy Partners LP (3) |
75,822 | ||||||||||||||||||||
| 58,783 | RWE AG |
2,561,545 | ||||||||||||||||||||
| Total Independent Power and Renewable Electricity Producers |
3,017,645 | |||||||||||||||||||||
| Industrial Conglomerates – 1.4% | ||||||||||||||||||||||
| 46,600 | Hitachi Ltd (2) |
2,897,425 | ||||||||||||||||||||
| 6,688 | Honeywell International Inc (3) |
1,387,760 | ||||||||||||||||||||
| 12,220 | Siemens AG |
2,037,085 | ||||||||||||||||||||
| Total Industrial Conglomerates |
6,322,270 | |||||||||||||||||||||
| Insurance – 0.7% | ||||||||||||||||||||||
| 7,884 | American International Group Inc |
453,646 | ||||||||||||||||||||
| 2,644 | Chubb Ltd |
509,129 | ||||||||||||||||||||
| 3,315 | Marsh & McLennan Cos Inc |
623,485 | ||||||||||||||||||||
| 4,706 | MetLife Inc |
266,030 | ||||||||||||||||||||
| 44,000 | Ping An Insurance Group Co of China Ltd |
281,024 | ||||||||||||||||||||
| 47,700 | Ping An Insurance Group Co of China Ltd, Class A |
304,989 | ||||||||||||||||||||
| 1,882 | Zurich Insurance Group AG |
895,246 | ||||||||||||||||||||
| Total Insurance |
3,333,549 | |||||||||||||||||||||
| Interactive Media & Services – 1.2% | ||||||||||||||||||||||
| 8,517 | Alphabet Inc, Class A (2), (3) |
1,019,485 | ||||||||||||||||||||
| 1,776 | Alphabet Inc, Class C (2) |
214,843 | ||||||||||||||||||||
| 54,700 | Baidu Inc, Class A (2) |
932,950 | ||||||||||||||||||||
| 6,057 | Meta Platforms Inc (2), (3) |
1,738,238 | ||||||||||||||||||||
| 38,300 | Tencent Holdings Ltd |
1,623,965 | ||||||||||||||||||||
| Total Interactive Media & Services |
5,529,481 | |||||||||||||||||||||
| Internet & Direct Marketing Retail – 0.0% | ||||||||||||||||||||||
| 15,692 | Baozun Inc (2) |
62,611 | ||||||||||||||||||||
| Total Internet & Direct Marketing Retail |
62,611 | |||||||||||||||||||||
| IT Services – 0.2% | ||||||||||||||||||||||
| 1,910 | Accenture PLC, Class A (3) |
589,388 | ||||||||||||||||||||
| 20,880 | Pagseguro Digital Ltd, Class A (2) |
197,107 | ||||||||||||||||||||
| Total IT Services |
786,495 | |||||||||||||||||||||
18
| Shares | Description (1) | Value | ||||||||||||||||||||||||||||||
| Life Sciences Tools & Services – 0.4% | ||||||||||||||||||||||||||||||||
| 945 | Danaher Corp |
$ | 226,800 | |||||||||||||||||||||||||||||
| 2,589 | Lonza Group AG |
1,547,478 | ||||||||||||||||||||||||||||||
| Total Life Sciences Tools & Services |
1,774,278 | |||||||||||||||||||||||||||||||
| Machinery – 0.4% | ||||||||||||||||||||||||||||||||
| 3,481 | Caterpillar Inc (3) |
856,500 | ||||||||||||||||||||||||||||||
| 634 | Deere & Co |
256,890 | ||||||||||||||||||||||||||||||
| 2,384 | Dover Corp (3) |
351,998 | ||||||||||||||||||||||||||||||
| 1,255 | Parker-Hannifin Corp (3) |
489,500 | ||||||||||||||||||||||||||||||
| Total Machinery |
1,954,888 | |||||||||||||||||||||||||||||||
| Media – 0.3% | ||||||||||||||||||||||||||||||||
| 18,182 | Comcast Corp, Class A |
755,462 | ||||||||||||||||||||||||||||||
| 58,224 | Grupo Televisa SAB, Sponsored ADR |
298,689 | ||||||||||||||||||||||||||||||
| 655,185 | Hibu plc (2), (5) |
— | ||||||||||||||||||||||||||||||
| 55,798 | Vivendi SE |
|
512,252 | |||||||||||||||||||||||||||||
| Total Media |
1,566,403 | |||||||||||||||||||||||||||||||
| Metals & Mining – 1.3% | ||||||||||||||||||||||||||||||||
| 42,765 | BHP Group Ltd |
1,285,600 | ||||||||||||||||||||||||||||||
| 33,854 | Freeport-McMoRan Inc |
1,354,160 | ||||||||||||||||||||||||||||||
| 427,808 | Glencore PLC |
2,425,619 | ||||||||||||||||||||||||||||||
| 20,002 | Pan American Silver Corp |
291,629 | ||||||||||||||||||||||||||||||
| 670 | Reliance Steel & Aluminum Co |
181,965 | ||||||||||||||||||||||||||||||
| 30,248 | Vale SA, Sponsored ADR |
405,928 | ||||||||||||||||||||||||||||||
| Total Metals & Mining |
5,944,901 | |||||||||||||||||||||||||||||||
| Multiline Retail – 0.1% | ||||||||||||||||||||||||||||||||
| 382,900 | Magazine Luiza SA (2) |
269,490 | ||||||||||||||||||||||||||||||
| Total Multiline Retail |
269,490 | |||||||||||||||||||||||||||||||
| Multi-Utilities – 1.4% | ||||||||||||||||||||||||||||||||
| 3,472 | Ameren Corp |
283,558 | ||||||||||||||||||||||||||||||
| 22,231 | CenterPoint Energy Inc |
648,034 | ||||||||||||||||||||||||||||||
| 13,042 | CMS Energy Corp |
766,218 | ||||||||||||||||||||||||||||||
| 4,185 | Consolidated Edison Inc |
378,324 | ||||||||||||||||||||||||||||||
| 14,423 | Dominion Energy Inc |
746,967 | ||||||||||||||||||||||||||||||
| 6,635 | DTE Energy Co |
729,983 | ||||||||||||||||||||||||||||||
| 6,355 | E.ON SE |
81,181 | ||||||||||||||||||||||||||||||
| 12,817 | Engie SA |
213,441 | ||||||||||||||||||||||||||||||
| 7,422 | National Grid PLC, Sponsored ADR |
499,723 | ||||||||||||||||||||||||||||||
| 17,298 | NiSource Inc |
473,100 | ||||||||||||||||||||||||||||||
| 68,200 | Sembcorp Industries Ltd |
290,604 | ||||||||||||||||||||||||||||||
| 1,593 | Sempra Energy |
231,925 | ||||||||||||||||||||||||||||||
| 4,559 | Veolia Environnement SA |
144,317 | ||||||||||||||||||||||||||||||
| 11,269 | WEC Energy Group Inc (3) |
994,377 | ||||||||||||||||||||||||||||||
| Total Multi-Utilities |
6,481,752 | |||||||||||||||||||||||||||||||
| Oil, Gas & Consumable Fuels – 6.0% | ||||||||||||||||||||||||||||||||
| 31,454 | Antero Resources Corp (2), (3) |
724,386 | ||||||||||||||||||||||||||||||
| 80,530 | BP PLC |
468,876 | ||||||||||||||||||||||||||||||
| 13,214 | Cheniere Energy Inc (3) |
2,013,285 | ||||||||||||||||||||||||||||||
| 5,035 | Chevron Corp |
792,257 | ||||||||||||||||||||||||||||||
| 5,947 | ConocoPhillips |
616,169 | ||||||||||||||||||||||||||||||
| 5,363 | Diamondback Energy Inc (3) |
704,484 | ||||||||||||||||||||||||||||||
| 6,436 | DT Midstream Inc |
319,033 | ||||||||||||||||||||||||||||||
| 57,918 | Enbridge Inc (3) |
2,151,654 | ||||||||||||||||||||||||||||||
| 16,172 | Energy Transfer LP |
205,384 | ||||||||||||||||||||||||||||||
| 12,184 | Enterprise Products Partners LP |
321,048 | ||||||||||||||||||||||||||||||
| 4,421 | EOG Resources Inc |
505,939 | ||||||||||||||||||||||||||||||
| 60,534 | Equinor ASA |
1,762,680 | ||||||||||||||||||||||||||||||
| 29,650 | Exxon Mobil Corp (3) |
3,179,962 | ||||||||||||||||||||||||||||||
19
| NMAI | Nuveen Multi-Asset Income Fund (continued) | |
| Portfolio of Investments June 30, 2023 | ||
| (Unaudited) | ||
| Shares | Description (1) | Value | ||||||||||||||||||||||||||||
| Oil, Gas & Consumable Fuels (continued) | ||||||||||||||||||||||||||||||
| 16,451 | Gibson Energy Inc |
$ | 258,671 | |||||||||||||||||||||||||||
| 7,993 | Keyera Corp |
184,326 | ||||||||||||||||||||||||||||
| 29,270 | Kinder Morgan Inc (3) |
504,029 | ||||||||||||||||||||||||||||
| 5,049 | MPLX LP |
171,363 | ||||||||||||||||||||||||||||
| 10,346 | ONEOK Inc (3) |
638,555 | ||||||||||||||||||||||||||||
| 25,390 | Pembina Pipeline Corp |
798,259 | ||||||||||||||||||||||||||||
| 1,252 | Phillips 66 |
119,416 | ||||||||||||||||||||||||||||
| 47,700 | PTT Exploration & Production PCL |
202,113 | ||||||||||||||||||||||||||||
| 23,706 | Reliance Industries Ltd, Sponsored GDR, 144A |
1,476,884 | ||||||||||||||||||||||||||||
| 124,213 | Shell PLC |
3,705,480 | ||||||||||||||||||||||||||||
| 1,906 | SK Innovation Co Ltd (2) |
231,072 | ||||||||||||||||||||||||||||
| 13,778 | Targa Resources Corp |
1,048,506 | ||||||||||||||||||||||||||||
| 17,439 | TC Energy Corp |
704,800 | ||||||||||||||||||||||||||||
| 19,756 | TotalEnergies SE |
1,134,086 | ||||||||||||||||||||||||||||
| 75,600 | Ultrapar Participacoes SA |
298,251 | ||||||||||||||||||||||||||||
| 9,492 | Valero Energy Corp (3) |
1,113,412 | ||||||||||||||||||||||||||||
| 31,873 | Williams Cos Inc/The |
1,040,016 | ||||||||||||||||||||||||||||
| Total Oil, Gas & Consumable Fuels |
27,394,396 | |||||||||||||||||||||||||||||
| Personal Care Products – 0.5% | ||||||||||||||||||||||||||||||
| 232,201 | Haleon PLC |
953,061 | ||||||||||||||||||||||||||||
| 4,760 | Kenvue Inc (2) |
125,759 | ||||||||||||||||||||||||||||
| 13,300 | Shiseido Co Ltd |
602,885 | ||||||||||||||||||||||||||||
| 10,980 | Unilever PLC |
571,775 | ||||||||||||||||||||||||||||
| Total Personal Care Products |
2,253,480 | |||||||||||||||||||||||||||||
| Pharmaceuticals – 3.9% | ||||||||||||||||||||||||||||||
| 26,944 | AstraZeneca PLC |
3,862,536 | ||||||||||||||||||||||||||||
| 38,747 | Bayer AG |
2,144,842 | ||||||||||||||||||||||||||||
| 20,235 | Bristol-Myers Squibb Co |
1,294,028 | ||||||||||||||||||||||||||||
| 306,000 | CSPC Pharmaceutical Group Ltd |
266,305 | ||||||||||||||||||||||||||||
| 67,500 | Daiichi Sankyo Co Ltd |
2,144,762 | ||||||||||||||||||||||||||||
| 6,327 | Johnson & Johnson (3) |
1,047,245 | ||||||||||||||||||||||||||||
| 11,597 | Merck & Co Inc (3) |
1,338,178 | ||||||||||||||||||||||||||||
| 15,804 | Novartis AG |
1,593,350 | ||||||||||||||||||||||||||||
| 24,332 | Novo Nordisk A/S, Class B |
3,930,584 | ||||||||||||||||||||||||||||
| 6,061 | Pfizer Inc |
222,317 | ||||||||||||||||||||||||||||
| Total Pharmaceuticals |
17,844,147 | |||||||||||||||||||||||||||||
| Professional Services – 0.3% | ||||||||||||||||||||||||||||||
| 50,700 | Infomart Corp |
116,613 | ||||||||||||||||||||||||||||
| 38,100 | Recruit Holdings Co Ltd |
1,215,974 | ||||||||||||||||||||||||||||
| Total Professional Services |
1,332,587 | |||||||||||||||||||||||||||||
| Semiconductors & Semiconductor Equipment – 3.5% | ||||||||||||||||||||||||||||||
| 1,771 | Analog Devices Inc (3) |
345,009 | ||||||||||||||||||||||||||||
| 2,524 | Applied Materials Inc |
364,819 | ||||||||||||||||||||||||||||
| 3,528 | ASML Holding NV |
2,558,960 | ||||||||||||||||||||||||||||
| 3,087 | Bright Bidco BV (2) |
1,377 | ||||||||||||||||||||||||||||
| 4,217 | Bright Bidco BV (2), (5) |
1,721 | ||||||||||||||||||||||||||||
| 2,363 | Broadcom Inc (3) |
2,049,737 | ||||||||||||||||||||||||||||
| 2,438 | Intel Corp |
81,527 | ||||||||||||||||||||||||||||
| 299 | Lam Research Corp |
192,215 | ||||||||||||||||||||||||||||
| 30,000 | MediaTek Inc |
664,075 | ||||||||||||||||||||||||||||
| 3,762 | Micron Technology Inc |
237,420 | ||||||||||||||||||||||||||||
| 6,549 | NVIDIA Corp (3) |
2,770,358 | ||||||||||||||||||||||||||||
| 1,480 | NXP Semiconductors NV |
302,926 | ||||||||||||||||||||||||||||
| 13,000 | Silergy Corp |
161,943 | ||||||||||||||||||||||||||||
| 15,323 | SK Hynix Inc |
1,346,346 | ||||||||||||||||||||||||||||
| 120,000 | Taiwan Semiconductor Manufacturing Co Ltd |
2,216,798 | ||||||||||||||||||||||||||||
| 22,412 | Taiwan Semiconductor Manufacturing Co Ltd, Sponsored ADR (3) |
|
2,261,819 | |||||||||||||||||||||||||||
| 1,503 | Texas Instruments Inc |
270,570 | ||||||||||||||||||||||||||||
| Total Semiconductors & Semiconductor Equipment |
15,827,620 | |||||||||||||||||||||||||||||
20
| Shares | Description (1) | Value | ||||||||||||||||||||||||||||
| Software – 1.7% | ||||||||||||||||||||||||||||||
| 21,660 | Avaya Inc (2) |
$ | 270,750 | |||||||||||||||||||||||||||
| 14,730 | Microsoft Corp (3) |
5,016,154 | ||||||||||||||||||||||||||||
| 4,494 | Oracle Corp |
535,190 | ||||||||||||||||||||||||||||
| 4,338 | Salesforce Inc (2), (3) |
916,446 | ||||||||||||||||||||||||||||
| 1,542 | ServiceNow Inc (2), (3) |
866,558 | ||||||||||||||||||||||||||||
| Total Software |
7,605,098 | |||||||||||||||||||||||||||||
| Specialty Retail – 0.3% | ||||||||||||||||||||||||||||||
| 2,864 | Home Depot Inc/The (3) |
889,673 | ||||||||||||||||||||||||||||
| 1,226 | Lowe’s Cos Inc |
276,708 | ||||||||||||||||||||||||||||
| 2,984 | TJX Cos Inc/The |
253,013 | ||||||||||||||||||||||||||||
| Total Specialty Retail |
1,419,394 | |||||||||||||||||||||||||||||
| Technology Hardware, Storage & Peripherals – 1.3% | ||||||||||||||||||||||||||||||
| 21,878 | Apple Inc (3) |
4,243,676 | ||||||||||||||||||||||||||||
| 33,368 | Samsung Electronics Co Ltd |
1,837,350 | ||||||||||||||||||||||||||||
| Total Technology Hardware, Storage & Peripherals |
6,081,026 | |||||||||||||||||||||||||||||
| Textiles, Apparel & Luxury Goods – 1.0% | ||||||||||||||||||||||||||||||
| 3,073 | Kering SA |
1,696,908 | ||||||||||||||||||||||||||||
| 1,133 | LVMH Moet Hennessy Louis Vuitton SE |
1,068,319 | ||||||||||||||||||||||||||||
| 13,644 | Moncler SpA |
943,998 | ||||||||||||||||||||||||||||
| 7,405 | NIKE Inc, Class B (3) |
817,290 | ||||||||||||||||||||||||||||
| Total Textiles, Apparel & Luxury Goods |
4,526,515 | |||||||||||||||||||||||||||||
| Tobacco – 0.1% | ||||||||||||||||||||||||||||||
| 6,172 | Philip Morris International Inc |
602,511 | ||||||||||||||||||||||||||||
| Total Tobacco |
602,511 | |||||||||||||||||||||||||||||
| Trading Companies & Distributors – 0.4% | ||||||||||||||||||||||||||||||
| 15,091 | Ashtead Group PLC |
1,046,271 | ||||||||||||||||||||||||||||
| 1,537 | United Rentals Inc (3) |
684,534 | ||||||||||||||||||||||||||||
| Total Trading Companies & Distributors |
|
1,730,805 | ||||||||||||||||||||||||||||
| Transportation Infrastructure – 3.0% | ||||||||||||||||||||||||||||||
| 15,413 | Aena SME SA |
2,494,542 | ||||||||||||||||||||||||||||
| 3,564 | Aeroports de Paris |
512,118 | ||||||||||||||||||||||||||||
| 155,061 | Atlas Arteria Ltd |
643,965 | ||||||||||||||||||||||||||||
| 262,870 | Auckland International Airport Ltd (2) |
1,381,504 | ||||||||||||||||||||||||||||
| 112,000 | China Merchants Port Holdings Co Ltd |
158,444 | ||||||||||||||||||||||||||||
| 41,688 | Enav SpA |
177,631 | ||||||||||||||||||||||||||||
| 4,577 | Flughafen Zurich AG |
952,032 | ||||||||||||||||||||||||||||
| 5,057 | Fraport AG Frankfurt Airport Services Worldwide (2) |
269,935 | ||||||||||||||||||||||||||||
| 54,376 | Getlink SE |
925,363 | ||||||||||||||||||||||||||||
| 5,826 | Grupo Aeroportuario del Centro Norte SAB de CV, ADR |
|
494,278 | |||||||||||||||||||||||||||
| 3,973 | Grupo Aeroportuario del Pacifico SAB de CV, ADR |
710,055 | ||||||||||||||||||||||||||||
| 47,480 | International Container Terminal Services Inc |
175,364 | ||||||||||||||||||||||||||||
| 18,900 | Japan Airport Terminal Co Ltd |
854,871 | ||||||||||||||||||||||||||||
| 19,200 | Kamigumi Co Ltd |
435,339 | ||||||||||||||||||||||||||||
| 52,240 | Port of Tauranga Ltd |
200,323 | ||||||||||||||||||||||||||||
| 113,604 | Qube Holdings Ltd |
216,525 | ||||||||||||||||||||||||||||
| 320,300 | Transurban Group |
3,049,693 | ||||||||||||||||||||||||||||
| Total Transportation Infrastructure |
13,651,982 | |||||||||||||||||||||||||||||
| Water Utilities – 0.3% | ||||||||||||||||||||||||||||||
| 4,286 | American Water Works Co Inc |
611,827 | ||||||||||||||||||||||||||||
| 23,511 | Severn Trent PLC |
766,464 | ||||||||||||||||||||||||||||
| Total Water Utilities |
|
1,378,291 | ||||||||||||||||||||||||||||
| Wireless Telecommunication Services – 0.1% | ||||||||||||||||||||||||||||||
| 2,719 | T-Mobile US Inc (2) |
|
377,669 | |||||||||||||||||||||||||||
| Total Wireless Telecommunication Services |
|
377,669 | ||||||||||||||||||||||||||||
| Total Common Stocks (cost $238,955,317) |
|
267,188,594 | ||||||||||||||||||||||||||||
21
| NMAI | Nuveen Multi-Asset Income Fund (continued) | |
| Portfolio of Investments June 30, 2023 | ||
| (Unaudited) | ||
| Principal Amount (000) |
Description (1) | Coupon | Maturity | Ratings (6) | Value | |||||||||||||||||||||
| ASSET-BACKED AND MORTGAGE-BACKED SECURITIES – 17.9% (12.3% of Total Investments) | ||||||||||||||||||||||||||
| $ 560 | Connecticut Avenue Securities Trust 2022-R03, (SOFR30A reference rate + 3.500% spread), 2022 R03, 144A (7) |
8.567% | 3/25/42 | BBB- | $ | 572,182 | ||||||||||||||||||||
| 410 | Connecticut Avenue Securities Trust 2022-R04, (SOFR30A reference rate + 3.100% spread), 2022 R04, 144A (7) |
8.167% | 3/25/42 | BBB- | 414,520 | |||||||||||||||||||||
| 60 | Connecticut Avenue Securities Trust 2022-R05, (SOFR30A reference rate + 3.000% spread), 2022 R05, 144A (7) |
8.067% | 4/25/42 | Baa3 | 59,838 | |||||||||||||||||||||
| 970 | Connecticut Avenue Securities Trust 2022-R06, (SOFR30A reference rate + 3.850% spread), 2022 R06, 144A (7) |
8.917% | 5/25/42 | BBB- | 1,000,278 | |||||||||||||||||||||
| 300 | Connecticut Avenue Securities Trust 2022-R07, (SOFR30A reference rate + 4.650% spread), 2022 R07, 144A (7) |
9.717% | 6/25/42 | Aaa | 317,590 | |||||||||||||||||||||
| 35 | Connecticut Avenue Securities Trust 2022-R08, (SOFR reference rate + 3.600% spread), 2022 R08, 144A (7) |
8.667% | 7/25/42 | BBB- | 35,789 | |||||||||||||||||||||
| 105 | Connecticut Avenue Securities Trust 2022-R09, (SOFR30A reference rate + 4.750% spread), 2022 R09, 144A (7) |
9.817% | 9/25/42 | Baa3 | 110,766 | |||||||||||||||||||||
| 425 | Connecticut Avenue Securities Trust 2023-R01, (SOFR30A reference rate + 3.750% spread), 2023 R01, 144A (7) |
8.817% | 12/25/42 | BBB- | 436,221 | |||||||||||||||||||||
| 2,892 | Fannie Mae Pool, FN MA4805, 2022 1 (8) |
4.500% | 11/01/52 | N/R | 2,780,839 | |||||||||||||||||||||
| 2,845 | Fannie Mae Pool, FN MA4655 (8) |
4.000% | 7/01/52 | N/R | 2,671,414 | |||||||||||||||||||||
| 2,901 | Fannie Mae Pool, FN MA4783 (8) |
4.000% | 10/01/52 | N/R | 2,722,630 | |||||||||||||||||||||
| 3,491 | Fannie Mae Pool, FN MA4305, 2021 MTGE (8) |
2.000% | 4/01/51 | N/R | 2,858,521 | |||||||||||||||||||||
| 1,336 | Fannie Mae Pool, FN CB3599 (8) |
3.500% | 5/01/52 | N/R | 1,217,474 | |||||||||||||||||||||
| 983 | Fannie Mae Pool, FN MA4644, 2022 1 (8) |
4.000% | 5/01/52 | N/R | 922,685 | |||||||||||||||||||||
| 1,784 | Fannie Mae Pool, FN CB2839 (8) |
2.000% | 2/01/52 | N/R | 1,463,688 | |||||||||||||||||||||
| 2,175 | Fannie Mae Pool, FN FS0522 (8) |
2.500% | 2/01/52 | N/R | 1,859,508 | |||||||||||||||||||||
| 1,411 | Fannie Mae Pool, FN MA4919 (8) |
5.500% | 2/01/53 | N/R | 1,404,477 | |||||||||||||||||||||
| 1,502 | Fannie Mae Pool, FN MA4626 (8) |
4.000% | 6/01/52 | N/R | 1,410,387 | |||||||||||||||||||||
| 4,294 | Fannie Mae Pool, FN MA4737, 2022 1 (8) |
5.000% | 8/01/52 | N/R | 4,212,013 | |||||||||||||||||||||
| 1,374 | Fannie Mae Pool, FN CB2804 (8) |
2.500% | 2/01/52 | N/R | 1,174,276 | |||||||||||||||||||||
| 2,064 | Fannie Mae Pool, FN MA4700, 2022 1 (8) |
4.000% | 7/01/52 | N/R | 1,937,465 | |||||||||||||||||||||
| 5,051 | Fannie Mae Pool, FN BW3382 (8) |
4.500% | 7/01/52 | N/R | 4,857,297 | |||||||||||||||||||||
| 1,811 | Fannie Mae Pool, FN MA4797 (8) |
4.000% | 11/01/37 | N/R | 1,747,801 | |||||||||||||||||||||
| 532 | Fannie Mae Pool, FN BW3383 (8) |
4.500% | 7/01/52 | N/R | 511,545 | |||||||||||||||||||||
| 811 | Fannie Mae Pool, FN CB2281 (8) |
2.000% | 12/01/51 | N/R | 664,846 | |||||||||||||||||||||
| 758 | Fannie Mae Pool, FN MA4785 (8) |
5.000% | 10/01/52 | N/R | 742,693 | |||||||||||||||||||||
| 1,847 | Fannie Mae Pool, FN FS1535 (8) |
3.000% | 4/01/52 | N/R | 1,633,170 | |||||||||||||||||||||
| 4,499 | Fannie Mae Pool, FN MA4600, 2022 2 (8) |
3.500% | 5/01/52 | N/R | 4,100,281 | |||||||||||||||||||||
| 3,457 | Fannie Mae Pool, FN MA4732 (8) |
4.000% | 9/01/52 | N/R | 3,244,561 | |||||||||||||||||||||
| 3,747 | Fannie Mae Pool, FN FS1533 (8) |
3.000% | 4/01/52 | N/R | 3,317,956 | |||||||||||||||||||||
| 3,731 | Fannie Mae Pool, FN MA4733 (8) |
4.500% | 9/01/52 | N/R | 3,587,325 | |||||||||||||||||||||
| 1,580 | Freddie Mac Pool, FR SD0922 (8) |
2.500% | 3/01/52 | N/R | 1,350,893 | |||||||||||||||||||||
| 981 | Freddie Mac Pool, FR QE5382 (8) |
4.500% | 7/01/52 | N/R | 943,120 | |||||||||||||||||||||
| 879 | Freddie Mac Pool, FR SB8190 (8) |
4.500% | 11/01/37 | N/R | 862,071 | |||||||||||||||||||||
| 1,168 | Freddie Mac REMICS, 2021 5160 |
3.000% | 9/25/50 | N/R | 827,215 | |||||||||||||||||||||
| 815 | Freddie Mac STACR REMIC Trust 2022-DNA2, (SOFR30A reference rate + 2.400% spread), 2022 DNA2, 144A (7) |
7.467% | 2/25/42 | BBB | 806,194 | |||||||||||||||||||||
| 695 | Freddie Mac STACR REMIC Trust 2022-DNA3, (SOFR30A reference rate + 2.900% spread), 2022 DNA3, 144A (7) |
7.967% | 4/25/42 | BBB | 694,721 | |||||||||||||||||||||
| 500 | Freddie Mac STACR REMIC Trust 2022-DNA3, (SOFR30A reference rate + 4.350% spread), 2022 DNA3, 144A (7) |
9.417% | 4/25/42 | BB | 515,782 | |||||||||||||||||||||
| 275 | Freddie Mac STACR REMIC Trust 2022-DNA4, (SOFR30A reference rate + 3.350% spread), 2022 DNA4, 144A (7) |
8.417% | 5/25/42 | BBB- | 278,421 | |||||||||||||||||||||
| 1,000 | Freddie Mac STACR REMIC Trust 2022-DNA5, (SOFR30A reference rate + 4.500% spread), 2022 DNA5, 144A (7) |
9.567% | 6/25/42 | BBB- | 1,051,231 | |||||||||||||||||||||
| 75 | Freddie Mac STACR REMIC Trust 2022-HQA3, (SOFR30A reference rate + 3.550% spread), 2022 HQA3, 144A (7) |
8.617% | 8/25/42 | Baa3 | 76,137 | |||||||||||||||||||||
| 1,534 | Ginnie Mae II Pool, G2 MA8149 (8) |
3.500% | 7/20/52 | N/R | 1,415,671 | |||||||||||||||||||||
| 4,882 | Ginnie Mae II Pool, G2 MA8043 (8) |
3.000% | 5/20/52 | N/R | 4,365,702 | |||||||||||||||||||||
| 759 | Ginnie Mae II Pool, G2 MA8428 (8) |
5.000% | 11/20/52 | N/R | 747,016 | |||||||||||||||||||||
| 966 | Ginnie Mae II Pool, G2 MA8200 (8) |
4.000% | 8/20/52 | N/R | 914,380 | |||||||||||||||||||||
| 515 | Ginnie Mae II Pool, G2 MA7871, 2022 1 (8) |
2.500% | 2/20/52 | N/R | 428,393 | |||||||||||||||||||||
| 2,620 | Ginnie Mae II Pool, G2 MA8042 (8) |
2.500% | 5/20/52 | N/R | 2,268,967 | |||||||||||||||||||||
| 431 | Government National Mortgage Association, 2022 174 |
4.500% | 9/20/52 | N/R | 396,186 | |||||||||||||||||||||
| 232 | Government National Mortgage Association, 2021 209 |
3.000% | 11/20/51 | N/R | 170,313 | |||||||||||||||||||||
22
| Principal Amount (000) |
Description (1) | Coupon | Maturity | Ratings (6) | Value | |||||||||||||||||||||||||
| ASSET-BACKED AND MORTGAGE-BACKED SECURITIES (continued) | ||||||||||||||||||||||||||||||
| $ | 244 | Government National Mortgage Association, 2022 124 |
|
4.000% | 7/20/52 | N/R | $ | 202,014 | ||||||||||||||||||||||
| 914 | Government National Mortgage Association, 2013 188 (8) |
|
2.500% | 12/20/43 | N/R | 808,591 | ||||||||||||||||||||||||
| 901 | GS Mortgage-Backed Securities Corp Trust 2022-PJ2, 2022 PJ2, 144A |
|
3.000% | 6/25/52 | Aa1 | 726,856 | ||||||||||||||||||||||||
| 314 | GS Mortgage-Backed Securities Trust 2021-PJ10, 2021 PJ10, 144A |
|
2.500% | 3/25/52 | Aa1 | 243,094 | ||||||||||||||||||||||||
| 460 | GS Mortgage-Backed Securities Trust 2022-GR2, 2022 GR2, 144A |
|
3.000% | 8/26/52 | Aa1 | 372,018 | ||||||||||||||||||||||||
| 326 | GS Mortgage-Backed Securities Trust 2022-HP1, 2022 HP1, 144A |
|
3.000% | 9/25/52 | Aa1 | 263,825 | ||||||||||||||||||||||||
| 546 | GS Mortgage-Backed Securities Trust 2022-INV1, 2022 INV1, 144A |
|
3.000% | 7/25/52 | Aa1 | 442,403 | ||||||||||||||||||||||||
| 264 | GS Mortgage-Backed Securities Trust 2022-PJ5, 2022 PJ5, 144A |
|
3.000% | 10/25/52 | Aa1 | 213,056 | ||||||||||||||||||||||||
| 274 | GS Mortgage-Backed Securities Trust 2023-PJ1, 2023 PJ1, 144A |
|
3.500% | 2/25/53 | Aa1 | 232,473 | ||||||||||||||||||||||||
| 250 | Industrial DPR Funding Ltd, 2022 1A, 144A |
|
5.380% | 4/15/34 | BBB | 212,237 | ||||||||||||||||||||||||
| 371 | J.P. Morgan Mortgage Trust 2022-4, 2022 4, 144A |
|
3.000% | 10/25/52 | AA+ | 300,231 | ||||||||||||||||||||||||
| 232 | J.P. Morgan Mortgage Trust 2022-6, 2022 6, 144A |
|
3.000% | 11/25/52 | Aa1 | 187,809 | ||||||||||||||||||||||||
| 575 | J.P. Morgan Mortgage Trust 2022-INV3, 2022 INV3, 144A |
|
3.000% | 9/25/52 | AAA | 467,418 | ||||||||||||||||||||||||
| 141 | J.P. Morgan Mortgage Trust 2022-LTV2, 2022 LTV2, 144A |
|
3.500% | 9/25/52 | AA+ | 118,781 | ||||||||||||||||||||||||
| 1,802 | JP Morgan Mortgage Trust, 2022 LTV1, 144A (3) |
|
3.250% | 7/25/52 | Aaa | 1,508,779 | ||||||||||||||||||||||||
| 1,279 | JP Morgan Mortgage Trust 2022-2, 2022 2, 144A (3) |
|
3.000% | 8/25/52 | Aa1 | 1,035,274 | ||||||||||||||||||||||||
| 801 | JP Morgan Mortgage Trust 2022-3, 2022 3, 144A |
|
3.000% | 8/25/52 | Aa1 | 646,266 | ||||||||||||||||||||||||
| 311 | OBX 2022-INV5 Trust, 2022 INV5, 144A |
|
4.000% | 10/25/52 | Aa1 | 270,261 | ||||||||||||||||||||||||
| 727 | RCKT Mortgage Trust 2022-2, 2022 2, 144A |
|
2.500% | 2/25/52 | AAA | 566,121 | ||||||||||||||||||||||||
| 95 | RCKT Mortgage Trust 2022-3, 2022 3, 144A |
|
3.000% | 5/25/52 | Aa1 | 76,700 | ||||||||||||||||||||||||
| 196 | RCKT Mortgage Trust 2022-4, 2022 4, 144A |
|
3.500% | 6/25/52 | Aa1 | 164,930 | ||||||||||||||||||||||||
| 121 | Wells Fargo Mortgage Backed Securities 2021-2 Trust, 2021 2, 144A |
|
2.500% | 6/25/51 | AAA | 93,544 | ||||||||||||||||||||||||
| 188 | Wells Fargo Mortgage Backed Securities 2022-2 Trust, 2022 2, 144A |
|
2.500% | 12/25/51 | AAA | 146,004 | ||||||||||||||||||||||||
| 231 | Wells Fargo Mortgage Backed Securities 2022-INV1 Trust, 2022 INV1, 144A |
|
3.500% | 3/25/52 | AAA | 194,151 | ||||||||||||||||||||||||
| 138 | Wells Fargo Mortgage Backed Securities 2022-INV1 Trust, 2022 INV1, 144A |
|
3.000% | 3/25/52 | AAA | 112,177 | ||||||||||||||||||||||||
| Total Asset-Backed and Mortgage-Backed Securities (cost $85,952,022) |
|
81,707,462 | ||||||||||||||||||||||||||||
| Principal Amount (000) |
Description (1) | Coupon (9) | Reference Rate (9) |
Spread (9) | Maturity (10) | Ratings (6) | Value | |||||||||||||||||||||||
| VARIABLE RATE SENIOR LOAN INTERESTS – 12.7% (8.7% of Total Investments) (9) | ||||||||||||||||||||||||||||||
| Aerospace & Defense – 0.0% | ||||||||||||||||||||||||||||||
| $ 88 | TransDigm, Inc., Term Loan I |
8.492% | SOFR90A | 3.250% | 8/24/28 | Ba3 | $ | 88,540 | ||||||||||||||||||||||
| Total Aerospace & Defense |
|
88,540 | ||||||||||||||||||||||||||||
| Automobile Components – 0.1% | ||||||||||||||||||||||||||||||
| 237 | Adient US LLC, Term Loan B |
8.334% | SOFR30A | 3.250% | 4/08/28 | BB+ | 236,829 | |||||||||||||||||||||||
| 390 | Clarios Global LP, Term Loan |
8.852% | SOFR30A | 3.750% | 4/20/30 | B+ | 389,573 | |||||||||||||||||||||||
| 21 | DexKo Global Inc., Term Loan |
9.288% | 3-Month LIBOR | 3.750% | 10/04/28 | B1 | 20,630 | |||||||||||||||||||||||
| 37 | DexKo Global Inc., Term Loan B |
9.253% | SOFR90A | 3.750% | 10/04/28 | B2 | 35,708 | |||||||||||||||||||||||
| Total Automobile Components |
|
682,740 | ||||||||||||||||||||||||||||
| Beverages – 0.2% | ||||||||||||||||||||||||||||||
| 41 | City Brewing Company, LLC, Term Loan |
8.760% | 3-Month LIBOR | 3.500% | 4/05/28 | CCC | 26,855 | |||||||||||||||||||||||
| 221 | Naked Juice LLC, Term Loan |
8.448% | |
SOFR30A + SOFR90A + 3-Month LIBOR |
|
3.250% | 1/20/29 | B2 | 206,855 | |||||||||||||||||||||
| 33 | Naked Juice LLC, Term Loan , (DD1) |
7.550% | 3-Month LIBOR | 3.250% | 1/20/29 | B2 | 30,563 | |||||||||||||||||||||||
| 164 | Naked Juice LLC, Term Loan, Second Lien |
11.342% | SOFR90A | 6.000% | 1/20/30 | CCC | 132,057 | |||||||||||||||||||||||
| 248 | Sunshine Investments B.V., Term Loan |
9.336% | SOFR90A | 4.250% | 5/05/29 | B+ | 248,128 | |||||||||||||||||||||||
| 271 | Triton Water Holdings, Inc, Term Loan |
5.242% | 3-Month LIBOR | 0.000% | 3/31/28 | B | 262,417 | |||||||||||||||||||||||
| Total Beverages |
|
906,875 | ||||||||||||||||||||||||||||
| Biotechnology – 0.0% | ||||||||||||||||||||||||||||||
| 72 | Grifols Worldwide Operations USA, Inc., Term Loan B |
7.414% | SOFR90A | 2.000% | 11/15/27 | BB+ | 70,965 | |||||||||||||||||||||||
| Total Biotechnology |
|
70,965 | ||||||||||||||||||||||||||||
23
| NMAI | Nuveen Multi-Asset Income Fund (continued) | |
| Portfolio of Investments June 30, 2023 | ||
| (Unaudited) | ||
| Principal Amount (000) |
Description (1) | Coupon (9) | Reference Rate (9) |
Spread (9) | Maturity (10) | Ratings (6) | Value | |||||||||||||||||||||||
| Broadline Retail – 0.0% | ||||||||||||||||||||||||||||||
| $ 8 | Belk, Inc., Term Loan, (cash 5.000%, PIK 8.000%) |
15.299% | 3-Month LIBOR | 10.000% | 7/31/25 | C | $ | 1,127 | ||||||||||||||||||||||
| 2 | Belk, Inc., Term Loan |
12.976% | 3-Month LIBOR | 7.500% | 7/31/25 | CCC | 1,381 | |||||||||||||||||||||||
| Total Broadline Retail |
|
2,508 | ||||||||||||||||||||||||||||
| Building Products – 0.1% | ||||||||||||||||||||||||||||||
| 150 | Chamberlain Group Inc, Term Loan B |
8.452% | SOFR30A | 3.250% | 10/22/28 | B | 147,046 | |||||||||||||||||||||||
| 19 | Cornerstone Building Brands, Inc., Term Loan B |
8.497% | SOFR30A | 3.250% | 4/12/28 | B | 18,737 | |||||||||||||||||||||||
| 166 | Quikrete Holdings, Inc., Term Loan, First Lien |
7.842% | 1-Month LIBOR | 2.625% | 1/31/27 | Ba2 | 165,591 | |||||||||||||||||||||||
| 70 | SRS Distribution Inc, Term Loan , (WI/DD) |
TBD | TBD | TBD | TBD | N/R | 68,469 | |||||||||||||||||||||||
| 206 | Standard Industries Inc., Term Loan B |
7.692% | SOFR30A | 2.500% | 9/22/28 | BBB- | 205,724 | |||||||||||||||||||||||
| 64 | Zurn Holdings, Inc., Term Loan B |
7.193% | 1-Month LIBOR | 2.000% | 10/04/28 | BB+ | 63,910 | |||||||||||||||||||||||
| Total Building Products |
|
669,477 | ||||||||||||||||||||||||||||
| Chemicals – 0.2% | ||||||||||||||||||||||||||||||
| 185 | Axalta Coating Systems Dutch Holding B B.V, Term Loan B |
8.242% | SOFR90A | 3.000% | 12/08/29 | BBB- | 185,120 | |||||||||||||||||||||||
| 137 | Diamond (BC) B.V., Term Loan B |
7.945% | |
SOFR30A + SOFR90A |
|
2.750% | 9/29/28 | Ba3 | 136,615 | |||||||||||||||||||||
| 189 | Discovery Purchaser Corporation, Term Loan |
9.617% | SOFR90A | 4.375% | 8/03/29 | B- | 181,189 | |||||||||||||||||||||||
| 35 | INEOS Quattro Holdings UK Ltd, Term Loan |
8.952% | SOFR30A | 3.750% | 3/03/30 | BB | 35,000 | |||||||||||||||||||||||
| 78 | INEOS Styrolution US Holding LLC, Term Loan B |
7.967% | |
SOFR30A |
|
2.750% | 1/29/26 | BB+ | 78,233 | |||||||||||||||||||||
| 15 | Starfruit Finco B.V, Term Loan |
8.990% | SOFR90A | 4.000% | 3/03/28 | BB- | 14,931 | |||||||||||||||||||||||
| 296 | Trinseo Materials Operating S.C.A., Term Loan |
7.538% | 1-Month LIBOR | 2.000% | 9/09/24 | Ba3 | 286,795 | |||||||||||||||||||||||
| 1 | W.R. Grace & Co.-Conn., Term Loan B |
9.313% | 3-Month LIBOR | 3.750% | 9/22/28 | BB+ | 1,229 | |||||||||||||||||||||||
| Total Chemicals |
|
919,112 | ||||||||||||||||||||||||||||
| Commercial Services & Supplies – 0.4% | ||||||||||||||||||||||||||||||
| 182 | Amentum Government Services Holdings LLC, Term Loan |
9.147% | SOFR30A | 4.000% | 2/07/29 | B | 178,571 | |||||||||||||||||||||||
| 197 | Anticimex International AB, Term Loan B1 |
8.517% | |
SOFR90A + 3-Month LIBOR |
|
3.466% | 11/16/28 | B | 194,846 | |||||||||||||||||||||
| 220 | Covanta Holding Corporation, Term Loan B |
7.602% | SOFR30A | 2.500% | 11/30/28 | BB | 218,894 | |||||||||||||||||||||||
| 17 | Covanta Holding Corporation, Term Loan C |
7.602% | SOFR30A | 2.500% | 11/30/28 | BB | 16,604 | |||||||||||||||||||||||
| 250 | Garda World Security Corporation, Term Loan B |
9.427% | SOFR30A | 4.250% | 10/30/26 | BB | 249,062 | |||||||||||||||||||||||
| 322 | GFL Environmental Inc., Term Loan |
8.145% | SOFR30A | 3.000% | 5/30/25 | BB- | 322,324 | |||||||||||||||||||||||
| 241 | Prime Security Services Borrower, LLC, Term Loan |
7.943% | 1-Month LIBOR | 2.750% | 9/23/26 | BB | 240,786 | |||||||||||||||||||||||
| 238 | West Corporation, Term Loan B3 |
9.250% | SOFR90A | 4.000% | 4/10/27 | B1 | 216,034 | |||||||||||||||||||||||
| 47 | WIN Waste Innovations Holdings, Inc., Term Loan B, (DD1) |
7.967% | SOFR30A | 2.750% | 3/25/28 | B3 | 40,621 | |||||||||||||||||||||||
| Total Commercial Services & Supplies |
|
1,677,742 | ||||||||||||||||||||||||||||
| Communications Equipment – 0.2% | ||||||||||||||||||||||||||||||
| 253 | CommScope, Inc., Term Loan B |
8.443% | 1-Month LIBOR | 3.250% | 4/04/26 | B1 | 243,258 | |||||||||||||||||||||||
| 235 | Delta TopCo, Inc., Term Loan B |
9.069% | SOFR180A | 3.750% | 12/01/27 | B2 | 227,701 | |||||||||||||||||||||||
| 99 | EOS Finco Sarl, Term Loan |
10.909% | TSFR3M | 6.000% | 8/03/29 | B | 98,795 | |||||||||||||||||||||||
| 151 | MLN US HoldCo LLC, Term Loan B2 |
11.782% | TSFR3M | 6.700% | 10/18/27 | N/R | 76,072 | |||||||||||||||||||||||
| 261 | MLN US HoldCo LLC, Term Loan, First Lien |
9.838% | SOFR90A | 4.500% | 11/30/25 | CCC- | 62,603 | |||||||||||||||||||||||
| 375 | Riverbed Technology, Inc., Exit Term Loan, (cash 7.000%, PIK 2.000%) |
8.887% | 3+12-Month LIBOR | 5.333% | 12/07/26 | Caa3 | 101,656 | |||||||||||||||||||||||
| 124 | ViaSat, Inc., Term Loan |
9.602% | SOFR30A | 4.500% | 3/04/29 | BB+ | 120,115 | |||||||||||||||||||||||
| Total Communications Equipment |
|
930,200 | ||||||||||||||||||||||||||||
24
| Principal Amount (000) |
Description (1) | Coupon (9) | Reference Rate (9) |
Spread (9) | Maturity (10) | Ratings (6) | Value | |||||||||||||||||||||||
| Construction & Engineering – 0.0% | ||||||||||||||||||||||||||||||
| $ 3 | AECOM, Term Loan B |
6.967% | SOFR30A | 1.750% | 4/13/28 | BBB- | $ | 2,793 | ||||||||||||||||||||||
| 197 | Centuri Group, Inc, Term Loan B |
7.709% | 1+3-Month LIBOR | 2.375% | 8/27/28 | Ba2 | 196,385 | |||||||||||||||||||||||
| Total Construction & Engineering |
199,178 | |||||||||||||||||||||||||||||
| Consumer Staples Distribution & Retail – 0.1% | ||||||||||||||||||||||||||||||
| 125 | Heritage Grocers Group LLC , (WI/DD) |
TBD | TBD | TBD | TBD | B2 | 123,880 | |||||||||||||||||||||||
| 125 | Heritage Grocers Group LLC, Term Loan, (WI/DD) |
TBD | TBD | TBD | TBD | N/R | 121,563 | |||||||||||||||||||||||
| 349 | US Foods, Inc., Term Loan B |
7.943% | 1-Month LIBOR | 2.750% | 11/22/28 | BB+ | 349,525 | |||||||||||||||||||||||
| 57 | US Foods, Inc., Term Loan B |
7.193% | 1-Month LIBOR | 2.000% | 9/13/26 | BB+ | 56,681 | |||||||||||||||||||||||
| Total Consumer Staples Distribution & Retail |
|
651,649 | ||||||||||||||||||||||||||||
| Containers & Packaging – 0.1% | ||||||||||||||||||||||||||||||
| 143 | Clydesdale Acquisition Holdings Inc, Term Loan B |
9.377% | SOFR30A | 4.175% | 3/30/29 | B | 141,534 | |||||||||||||||||||||||
| 44 | Klockner-Pentaplast of America, Inc., Term Loan B, (DD1) |
10.104% | SOFR180A | 4.725% | 2/09/26 | B2 | 41,897 | |||||||||||||||||||||||
| 90 | LABL, Inc., Term Loan, First Lien, (DD1) |
10.202% | SOFR30A | 5.100% | 10/29/28 | B2 | 89,231 | |||||||||||||||||||||||
| 147 | Reynolds Group Holdings Inc., Term Loan B |
8.467% | SOFR30A | 3.250% | 9/24/28 | B+ | 147,115 | |||||||||||||||||||||||
| 95 | Reynolds Group Holdings Inc., Term Loan B2 |
8.467% | SOFR30A | 3.250% | 2/05/26 | B+ | 95,082 | |||||||||||||||||||||||
| 45 | TricorBraun Holdings, Inc., Term Loan |
8.467% | SOFR30A | 3.250% | 3/03/28 | B2 | 43,680 | |||||||||||||||||||||||
| Total Containers & Packaging |
|
558,539 | ||||||||||||||||||||||||||||
| Diversified Consumer Services – 0.1% | ||||||||||||||||||||||||||||||
| 159 | AVSC Holding Corp., Term Loan B3, (cash 5.000%, PIK 10.000%) |
15.000% | N/A | N/A | 12/04/26 | CCC+ | 165,691 | |||||||||||||||||||||||
| 258 | Spin Holdco Inc., Term Loan |
9.230% | 3-Month LIBOR | 4.000% | 3/04/28 | B- | 222,770 | |||||||||||||||||||||||
| Total Diversified Consumer Services |
|
388,461 | ||||||||||||||||||||||||||||
| Diversified Financial Services – 0.0% | ||||||||||||||||||||||||||||||
| 179 | Ditech Holding Corporation, Term Loan |
0.000% | N/A | N/A | 12/19/22 | N/R | 19,668 | |||||||||||||||||||||||
| Total Diversified Financial Services |
|
19,668 | ||||||||||||||||||||||||||||
| Diversified Telecommunication Services – 0.5% | ||||||||||||||||||||||||||||||
| 118 | Altice France S.A., Term Loan B12 |
8.948% | 3-Month LIBOR | 3.688% | 1/31/26 | B2 | 111,469 | |||||||||||||||||||||||
| 211 | Altice France S.A., Term Loan B13 |
9.321% | 3-Month LIBOR | 4.000% | 8/14/26 | B2 | 198,877 | |||||||||||||||||||||||
| 27 | CenturyLink, Inc., Term Loan B |
7.467% | SOFR30A | 2.250% | 3/15/27 | BB | 21,245 | |||||||||||||||||||||||
| 122 | Cincinnati Bell, Inc., Term Loan B2 |
8.452% | SOFR30A | 3.250% | 11/23/28 | BB- | 116,876 | |||||||||||||||||||||||
| 258 | Cyxtera DC Holdings, Inc., Term Loan, (DD1) |
13.793% | TSFR3M | 8.500% | 12/07/23 | N/R | 257,172 | |||||||||||||||||||||||
| 1,020 | Cyxtera DC Holdings, Inc., Term Loan B, (DD1) (11) |
8.068% | TSFR3M | 3.000% | 5/01/24 | D | 519,048 | |||||||||||||||||||||||
| 437 | Dawn Acquisition LLC, Term Loan , (DD1) |
9.279% | 3-Month LIBOR | 3.750% | 12/31/25 | Caa1 | 269,786 | |||||||||||||||||||||||
| 240 | Eagle Broadband Investments LLC, Term Loan |
8.503% | 3-Month LIBOR | 3.000% | 11/12/27 | B+ | 237,350 | |||||||||||||||||||||||
| 376 | Frontier Communications Corp., Term Loan B |
9.000% | 1-Month LIBOR | 3.750% | 10/08/27 | BB+ | 365,646 | |||||||||||||||||||||||
| — | (12) | Intelsat Jackson Holdings S.A., Term Loan B4 (11) |
13.750% | 3-Month LIBOR | 5.500% | 1/02/24 | N/R | 406 | ||||||||||||||||||||||
| 1 | Intelsat Jackson Holdings S.A., Term Loan B5 (11) |
8.625% | N/A | N/A | 1/02/24 | N/R | 659 | |||||||||||||||||||||||
| 50 | Level 3 Financing Inc., Term Loan B |
6.967% | SOFR30A | 1.750% | 3/01/27 | Ba2 | 46,703 | |||||||||||||||||||||||
| Total Diversified Telecommunication Services |
|
2,145,237 | ||||||||||||||||||||||||||||
| Electric Utilities – 0.3% | ||||||||||||||||||||||||||||||
| 657 | Talen Energy Supply, LLC, Term Loan B |
9.590% | TSFR3M | 4.500% | 5/17/30 | BB+ | 655,794 | |||||||||||||||||||||||
| 532 | Talen Energy Supply, LLC, Term Loan C |
9.590% | TSFR3M | 4.500% | 5/27/30 | BB+ | 531,419 | |||||||||||||||||||||||
| Total Electric Utilities |
|
1,187,213 | ||||||||||||||||||||||||||||
25
| NMAI | Nuveen Multi-Asset Income Fund (continued) | |
| Portfolio of Investments June 30, 2023 | ||
| (Unaudited) | ||
| Principal Amount (000) |
Description (1) | Coupon (9) | Reference Rate (9) |
Spread (9) | Maturity (10) | Ratings (6) | Value | |||||||||||||||||||||||||
| Electronic Equipment, Instruments & Components – 0.0% | ||||||||||||||||||||||||||||||||
| $ 137 | Ingram Micro Inc., Term Loan B |
9.044% | 3-Month LIBOR | 3.500% | 7/02/28 | BB+ | $ | 136,499 | ||||||||||||||||||||||||
| Total Electronic Equipment, Instruments & Components |
|
136,499 | ||||||||||||||||||||||||||||||
| Entertainment – 0.3% | ||||||||||||||||||||||||||||||||
| 839 | AMC Entertainment Holdings, Inc., Term Loan B |
8.218% | 1-Month LIBOR | 3.000% | 4/22/26 | B- | 657,323 | |||||||||||||||||||||||||
| 367 | Crown Finance US, Inc., Term Loan (11) |
0.000% | N/A | N/A | 2/28/25 | D | 113,516 | |||||||||||||||||||||||||
| 85 | Crown Finance US, Inc., Term Loan (11) |
0.000% | N/A | N/A | 9/20/26 | D | 26,212 | |||||||||||||||||||||||||
| 351 | Diamond Sports Group, LLC, Term Loan, Second Lien (11) |
8.314% | SOFR90A | 3.250% | 8/24/26 | N/R | 12,579 | |||||||||||||||||||||||||
| 117 | Lions Gate Capital Holdings LLC, Term Loan B |
7.452% | SOFR30A | 2.250% | 3/24/25 | Ba2 | 116,806 | |||||||||||||||||||||||||
| 260 | Springer Nature Deutschland GmbH, Term Loan B18 |
8.538% | SOFR90A | 3.000% | 8/14/26 | BB+ | 259,864 | |||||||||||||||||||||||||
| Total Entertainment |
|
1,186,300 | ||||||||||||||||||||||||||||||
| Financial Services – 0.1% | ||||||||||||||||||||||||||||||||
| 154 | Avolon TLB Borrower 1 (US) LLC, Term Loan B6 |
7.589% | SOFR30A | 2.500% | 6/22/28 | Baa2 | 154,064 | |||||||||||||||||||||||||
| 158 | Trans Union, LLC, Term Loan B6 |
7.467% | SOFR30A | 2.250% | 12/01/28 | BBB- | 157,794 | |||||||||||||||||||||||||
| Total Financial Services |
|
311,858 | ||||||||||||||||||||||||||||||
| Food Products – 0.2% | ||||||||||||||||||||||||||||||||
| 262 | 8th Avenue Food & Provisions, Inc., Term Loan, First Lien |
8.967% | SOFR30A | 3.750% | 10/01/25 | CCC+ | 242,492 | |||||||||||||||||||||||||
| 252 | CHG PPC Parent LLC, Term Loan |
8.239% | SOFR30A | 3.000% | 12/08/28 | B1 | 250,231 | |||||||||||||||||||||||||
| 238 | Sycamore Buyer LLC, Term Loan B |
7.467% | SOFR30A | 2.250% | 7/22/29 | BB+ | 231,815 | |||||||||||||||||||||||||
| Total Food Products |
|
724,538 | ||||||||||||||||||||||||||||||
| Ground Transportation – 0.2% | ||||||||||||||||||||||||||||||||
| 138 | First Student Bidco Inc, Term Loan B |
8.529% | 3-Month LIBOR | 3.000% | 7/21/28 | BB+ | 133,298 | |||||||||||||||||||||||||
| 70 | First Student Bidco Inc, Term Loan C |
8.529% | 3-Month LIBOR | 3.000% | 7/21/28 | BB+ | 68,208 | |||||||||||||||||||||||||
| 372 | Hertz Corporation, (The), Term Loan B |
8.443% | 1-Month LIBOR | 3.250% | 6/30/28 | BB+ | 372,168 | |||||||||||||||||||||||||
| 72 | Hertz Corporation, (The), Term Loan C |
8.489% | SOFR30A | 3.250% | 6/30/28 | BB+ | 72,081 | |||||||||||||||||||||||||
| 100 | Uber Technologies, Inc., Term Loan B |
8.001% | TSFR3M + SOFR90A | 2.750% | 3/03/30 | Ba2 | 99,869 | |||||||||||||||||||||||||
| Total Ground Transportation |
|
745,624 | ||||||||||||||||||||||||||||||
| Health Care Equipment & Supplies – 0.5% | ||||||||||||||||||||||||||||||||
| 606 | Bausch & Lomb, Inc., Term Loan |
8.592% | SOFR90A | 3.250% | 5/05/27 | BB- | 589,385 | |||||||||||||||||||||||||
| 240 | CNT Holdings I Corp, Term Loan |
8.459% | SOFR90A | 3.500% | 11/08/27 | B | 240,016 | |||||||||||||||||||||||||
| 102 | Embecta Corp, Term Loan B |
8.337% | 6-Month LIBOR | 3.000% | 1/27/29 | Ba3 | 101,609 | |||||||||||||||||||||||||
| 1,181 | Medline Borrower, LP, Term Loan B |
8.352% | SOFR30A | 3.250% | 10/21/28 | BB- | 1,168,574 | |||||||||||||||||||||||||
| Total Health Care Equipment & Supplies |
|
2,099,584 | ||||||||||||||||||||||||||||||
| Health Care Providers & Services – 1.0% | ||||||||||||||||||||||||||||||||
| 173 | 24 Hour Fitness Worldwide, Inc., Exit Term Loan |
19.507% | 3-Month LIBOR | 14.000% | 9/30/26 | N/R | 90,623 | |||||||||||||||||||||||||
| 243 | AHP Health Partners, Inc., Term Loan B |
8.693% | 1-Month LIBOR | 3.500% | 8/23/28 | B1 | 242,773 | |||||||||||||||||||||||||
| 59 | DaVita, Inc., Term Loan B |
6.967% | SOFR30A | 1.750% | 8/12/26 | BBB- | 57,899 | |||||||||||||||||||||||||
| 27 | Element Materials Technology Group US Holdings Inc., Term Loan |
9.489% | SOFR90A | 4.250% | 4/12/29 | B1 | 26,241 | |||||||||||||||||||||||||
| 58 | Element Materials Technology Group US Holdings Inc., Term Loan |
9.485% | SOFR90A | 4.250% | 4/12/29 | B1 | 56,854 | |||||||||||||||||||||||||
| 98 | Global Medical Response, Inc., Term Loan |
9.467% | SOFR30A | 4.250% | 3/14/25 | CCC+ | 55,728 | |||||||||||||||||||||||||
| 691 | Global Medical Response, Inc., Term Loan B |
9.439% | 1-Month LIBOR | 4.250% | 10/02/25 | CCC+ | 392,375 | |||||||||||||||||||||||||
| 253 | ICON Luxembourg S.A.R.L., Term Loan |
7.753% | SOFR90A | 2.250% | 7/01/28 | BB+ | 253,363 | |||||||||||||||||||||||||
| 156 | Onex TSG Intermediate Corp., Term Loan B |
10.057% | 3-Month LIBOR | 4.750% | 2/26/28 | B | 139,042 | |||||||||||||||||||||||||
26
| Principal Amount (000) |
Description (1) | Coupon (9) | Reference Rate (9) |
Spread (9) | Maturity (10) | Ratings (6) | Value | |||||||||||||||||||||||
| Health Care Providers & Services (continued) | ||||||||||||||||||||||||||||||
| $ | 375 | Packaging Coordinators Midco Inc, Term Loan , (WI/DD) |
TBD | TBD | TBD | TBD | N/R | $ | 370,343 | |||||||||||||||||||||
| 368 | Packaging Coordinators Midco, Inc., Term Loan, First Lien |
8.739% | SOFR90A | 3.500% | 11/30/27 | B2 | 363,829 | |||||||||||||||||||||||
| 929 | Parexel International Corporation, Term Loan, First Lien |
8.443% | 1-Month LIBOR | 3.250% | 11/15/28 | B1 | 923,094 | |||||||||||||||||||||||
| 72 | Phoenix Guarantor Inc, Term Loan B |
8.443% | 1-Month LIBOR | 3.250% | 3/05/26 | B1 | 70,861 | |||||||||||||||||||||||
| 120 | Phoenix Guarantor Inc, Term Loan B3 |
8.693% | 1-Month LIBOR | 3.500% | 3/05/26 | B1 | 119,157 | |||||||||||||||||||||||
| 281 | Select Medical Corporation, Term Loan B |
7.702% | SOFR30A | 2.500% | 3/06/25 | Ba2 | 281,151 | |||||||||||||||||||||||
| 807 | Surgery Center Holdings, Inc., Term Loan |
8.896% | 1-Month LIBOR | 3.750% | 8/31/26 | B1 | 806,425 | |||||||||||||||||||||||
| 211 | Team Health Holdings, Inc., Term Loan B |
10.331% | |
3-Month LIBOR + SOFR30A |
|
5.250% | 2/02/27 | B- | 145,779 | |||||||||||||||||||||
| 112 | Team Health Holdings, Inc., Term Loan, First Lien |
7.943% | 1-Month LIBOR | 2.750% | 2/06/24 | B- | 99,941 | |||||||||||||||||||||||
| Total Health Care Providers & Services |
|
4,495,478 | ||||||||||||||||||||||||||||
| Health Care Technology – 0.0% | ||||||||||||||||||||||||||||||
| — | (12) | Athenahealth, Inc., Term Loan |
3.500% | Unfunded | 3.500% | 1/27/29 | B+ | 178 | ||||||||||||||||||||||
| 2 | Athenahealth, Inc., Term Loan B |
8.589% | SOFR30A | 3.500% | 1/27/29 | B+ | 1,445 | |||||||||||||||||||||||
| Total Health Care Technology |
|
1,623 | ||||||||||||||||||||||||||||
| Hotels – 0.0% | ||||||||||||||||||||||||||||||
| 134 | GVC Holdings (Gibraltar) Limited, Term Loan B |
8.437% | SOFR180A | 3.500% | 10/31/29 | Ba1 | 134,291 | |||||||||||||||||||||||
| Total Hotels |
|
134,291 | ||||||||||||||||||||||||||||
| Hotels, Restaurants & Leisure – 1.5% | ||||||||||||||||||||||||||||||
| 378 | 24 Hour Fitness Worldwide, Inc., Term Loan |
10.529% | 3-Month LIBOR | 5.000% | 12/29/25 | CCC- | 47,725 | |||||||||||||||||||||||
| 244 | Alterra Mountain Company, Term Loan |
8.693% | 1-Month LIBOR | 3.500% | 8/17/28 | B+ | 244,293 | |||||||||||||||||||||||
| 508 | B.C. Unlimited Liability Company, Term Loan B4 |
6.942% | 1-Month LIBOR | 1.750% | 11/19/26 | BB+ | 505,138 | |||||||||||||||||||||||
| 210 | Caesars Entertainment Corp, Term Loan B |
8.452% | SOFR30A | 3.250% | 1/25/30 | Ba3 | 209,748 | |||||||||||||||||||||||
| 164 | Carnival Corporation, Term Loan B |
8.217% | SOFR30A | 3.000% | 6/30/25 | Ba2 | 164,229 | |||||||||||||||||||||||
| 219 | Churchill Downs Incorporated, Term Loan B1 |
7.084% | SOFR30A | 2.000% | 3/17/28 | BBB- | 217,594 | |||||||||||||||||||||||
| 695 | ClubCorp Holdings, Inc., Term Loan B |
8.288% | 3-Month LIBOR | 2.750% | 9/18/24 | B- | 667,986 | |||||||||||||||||||||||
| 460 | Crown Finance US, Inc., Term Loan |
15.263% | TSFR3M | 10.000% | 9/09/23 | N/R | 465,266 | |||||||||||||||||||||||
| 294 | Crown Finance US, Inc., Term Loan (13) |
0.000% | N/A | N/A | 8/31/23 | CCC+ | 90,825 | |||||||||||||||||||||||
| 242 | Equinox Holdings, Inc., Term Loan, First Lien |
8.538% | 3-Month LIBOR | 3.000% | 3/08/24 | Caa2 | 226,316 | |||||||||||||||||||||||
| 727 | Fertitta Entertainment, LLC, Term Loan B |
9.102% | SOFR30A | 4.000% | 1/27/29 | B | 718,321 | |||||||||||||||||||||||
| 219 | Hilton Grand Vacations Borrower LLC, Term Loan B |
8.239% | SOFR30A | 3.000% | 8/02/28 | BB+ | 218,449 | |||||||||||||||||||||||
| 121 | IRB Holding Corp, Term Loan B |
8.202% | SOFR30A | 3.000% | 12/15/27 | B+ | 119,970 | |||||||||||||||||||||||
| 280 | NASCAR Holdings, Inc, Term Loan B |
7.717% | SOFR30A | 2.500% | 10/18/26 | BBB- | 280,626 | |||||||||||||||||||||||
| 57 | PCI Gaming Authority, Term Loan |
7.717% | SOFR30A | 2.500% | 5/31/26 | BBB- | 57,112 | |||||||||||||||||||||||
| 167 | Penn National Gaming, Inc., Term Loan B |
7.952% | SOFR30A | 2.750% | 4/20/29 | BB | 166,732 | |||||||||||||||||||||||
| 165 | Scientific Games Holdings LP, Term Loan B |
8.421% | SOFR90A | 3.500% | 2/04/29 | BB- | 163,370 | |||||||||||||||||||||||
| 192 | Scientific Games International, Inc., Term Loan |
8.248% | SOFR30A | 3.000% | 4/07/29 | BBB- | 192,160 | |||||||||||||||||||||||
| 268 | SeaWorld Parks & Entertainment, Inc., Term Loan B |
8.250% | 1-Month LIBOR | 3.000% | 8/25/28 | BB | 267,899 | |||||||||||||||||||||||
| 1,283 | Stars Group Holdings B.V. (The), Term Loan |
7.682% | |
SOFR90A + 3-Month LIBOR |
|
2.250% | 7/10/25 | BBB | 1,284,863 | |||||||||||||||||||||
| 248 | Stars Group Holdings B.V. (The), Term Loan B |
8.489% | SOFR90A | 3.250% | 7/04/28 | BBB | 248,872 | |||||||||||||||||||||||
| 203 | Twin River Worldwide Holdings, Inc., Term Loan B |
8.396% | 1-Month LIBOR | 3.250% | 10/01/28 | BB+ | 198,801 | |||||||||||||||||||||||
27
| NMAI | Nuveen Multi-Asset Income Fund (continued) | |
| Portfolio of Investments June 30, 2023 | ||
| (Unaudited) | ||
| Principal Amount (000) |
Description (1) | Coupon (9) | Reference Rate (9) |
Spread (9) | Maturity (10) | Ratings (6) | Value | |||||||||||||||||||||||
| Hotels, Restaurants & Leisure (continued) | ||||||||||||||||||||||||||||||
| $ 269 | William Morris Endeavor Entertainment, LLC, Term Loan, First Lien |
7.950% | 1-Month LIBOR | 2.750% | 5/16/25 | B+ | $ | 269,015 | ||||||||||||||||||||||
| Total Hotels, Restaurants & Leisure |
|
7,025,310 | ||||||||||||||||||||||||||||
| Household Durables – 0.1% | ||||||||||||||||||||||||||||||
| 124 | AI Aqua Merger Sub, Inc., Term Loan B, First Lien |
8.896% | SOFR30A | 3.750% | 7/30/28 | B | 122,283 | |||||||||||||||||||||||
| 6 | Serta Simmons Bedding, LLC, Term Loan (11) |
14.448% | 1-Month LIBOR | 9.500% | 8/10/23 | N/R | 5,516 | |||||||||||||||||||||||
| 327 | Weber-Stephen Products LLC, Term Loan B |
8.467% | SOFR30A | 3.250% | 10/30/27 | CCC+ | 289,633 | |||||||||||||||||||||||
| Total Household Durables |
|
417,432 | ||||||||||||||||||||||||||||
| Independent Power and Renewable Electricity Producers – 0.0% | ||||||||||||||||||||||||||||||
| 3 | Vistra Operations Company LLC, Term Loan B3, First Lien |
6.920% | 1-Month LIBOR | 1.750% | 12/31/25 | BBB- | 2,881 | |||||||||||||||||||||||
| Total Independent Power and Renewable Electricity Producers |
|
2,881 | ||||||||||||||||||||||||||||
| Insurance – 0.6% | ||||||||||||||||||||||||||||||
| 236 | Acrisure, LLC, Term Loan B |
8.693% | 1-Month LIBOR | 3.500% | 2/15/27 | B | 229,375 | |||||||||||||||||||||||
| 216 | Alliant Holdings Intermediate, LLC, Term Loan B4 |
8.650% | 1-Month LIBOR | 3.500% | 11/06/27 | B | 215,334 | |||||||||||||||||||||||
| 246 | AssuredPartners, Inc., Term Loan B |
8.584% | SOFR30A | 3.500% | 2/13/27 | B | 244,179 | |||||||||||||||||||||||
| 94 | Asurion LLC, Term Loan B4, Second Lien |
10.427% | |
SOFR30A + 1-Month LIBOR |
|
5.225% | 1/20/29 | B | 79,094 | |||||||||||||||||||||
| 232 | Asurion LLC, Term Loan B7 |
8.538% | 3-Month LIBOR | 3.000% | 11/03/24 | Ba3 | 232,317 | |||||||||||||||||||||||
| 214 | Asurion LLC, Term Loan B9 |
8.788% | 3-Month LIBOR | 3.250% | 7/31/27 | Ba3 | 202,511 | |||||||||||||||||||||||
| 288 | Broadstreet Partners, Inc., Term Loan B |
7.943% | 1-Month LIBOR | 2.750% | 1/27/27 | B | 285,117 | |||||||||||||||||||||||
| 244 | Broadstreet Partners, Inc., Term Loan B2 |
7.967% | 1-Month LIBOR | 2.750% | 1/27/27 | B | 241,927 | |||||||||||||||||||||||
| 65 | Hub International Limited, Term Loan B |
9.123% | SOFR90A | 4.000% | 11/10/29 | B | 64,722 | |||||||||||||||||||||||
| 244 | HUB International Limited, Term Loan B |
9.341% | TSFR3M | 4.250% | 6/08/30 | B | 244,539 | |||||||||||||||||||||||
| 323 | Ryan Specialty Group, LLC, Term Loan |
8.202% | SOFR30A | 3.000% | 9/01/27 | BB- | 322,943 | |||||||||||||||||||||||
| 371 | USI, Inc., Term Loan |
8.992% | SOFR90A | 3.750% | 11/16/29 | B1 | 371,531 | |||||||||||||||||||||||
| Total Insurance |
|
2,733,589 | ||||||||||||||||||||||||||||
| Interactive Media & Services – 0.1% | ||||||||||||||||||||||||||||||
| 100 | MH Sub I LLC, Term Loan , (WI/DD) |
TBD | TBD | TBD | TBD | B1 | 100,125 | |||||||||||||||||||||||
| 1,028 | Rackspace Technology Global, Inc., Term Loan B |
7.996% | SOFR30A | 2.750% | 2/09/28 | B3 | 477,368 | |||||||||||||||||||||||
| Total Interactive Media & Services |
|
577,493 | ||||||||||||||||||||||||||||
| IT Services – 0.2% | ||||||||||||||||||||||||||||||
| 118 | Peraton Corp., Term Loan B |
8.952% | SOFR30A | 3.750% | 2/01/28 | BB- | 116,308 | |||||||||||||||||||||||
| 651 | Syniverse Holdings, Inc., Term Loan |
12.242% | SOFR90A | 7.000% | 5/10/29 | B- | 598,447 | |||||||||||||||||||||||
| 333 | Tempo Acquisition LLC, Term Loan B |
8.102% | SOFR30A | 3.000% | 8/31/28 | BB- | 333,375 | |||||||||||||||||||||||
| 93 | WEX Inc., Term Loan |
7.467% | SOFR30A | 2.250% | 4/01/28 | Ba2 | 93,701 | |||||||||||||||||||||||
| Total IT Services |
|
1,141,831 | ||||||||||||||||||||||||||||
| Leisure Products – 0.0% | ||||||||||||||||||||||||||||||
| 63 | SRAM, LLC , Term Loan B |
7.943% | 1-Month LIBOR | 2.750% | 5/18/28 | BB- | 63,198 | |||||||||||||||||||||||
| 65 | Topgolf Callaway Brands Corp., Term Loan B |
8.702% | SOFR30A | 3.500% | 3/09/30 | B+ | 64,851 | |||||||||||||||||||||||
| Total Leisure Products |
|
128,049 | ||||||||||||||||||||||||||||
| Life Sciences Tools & Services – 0.1% | ||||||||||||||||||||||||||||||
| 42 | Avantor Funding, Inc., Term Loan B5 |
7.452% | SOFR30A | 2.250% | 11/06/27 | BBB- | 42,098 | |||||||||||||||||||||||
| 63 | ICON Luxembourg S.A.R.L., Term Loan |
7.753% | SOFR90A | 2.250% | 7/01/28 | BB+ | 63,126 | |||||||||||||||||||||||
| 224 | Maravai Intermediate Holdings, LLC, Term Loan B |
8.028% | SOFR90A | 3.000% | 10/19/27 | B+ | 223,973 | |||||||||||||||||||||||
| Total Life Sciences Tools & Services |
|
329,197 | ||||||||||||||||||||||||||||
28
| Principal Amount (000) |
Description (1) | Coupon (9) | Reference Rate (9) |
Spread (9) | Maturity (10) | Ratings (6) | Value | |||||||||||||||||||||||
| Machinery – 0.4% | ||||||||||||||||||||||||||||||
| $ 193 | Ali Group North America Corporation, Term Loan B |
7.084% | SOFR30A | 2.000% | 10/13/28 | Baa3 | $ | 192,998 | ||||||||||||||||||||||
| 345 | Chart Industries, Inc., Term Loan B, (DD1) |
8.941% | TSFR1M | 3.750% | 12/08/29 | Ba3 | 344,906 | |||||||||||||||||||||||
| 275 | Emerald Debt Merger Sub LLC, Term Loan, (DD1) |
0.000% | TSFR1M | 3.000% | 5/04/30 | BB+ | 275,573 | |||||||||||||||||||||||
| 244 | Filtration Group Corporation, Term Loan |
8.717% | SOFR30A | 3.500% | 10/21/28 | B | 243,189 | |||||||||||||||||||||||
| 286 | Gates Global LLC, Term Loan B3 |
7.702% | SOFR30A | 2.500% | 3/31/27 | Ba3 | 284,783 | |||||||||||||||||||||||
| 97 | Grinding Media Inc., Term Loan B |
9.199% | SOFR90A | 4.000% | 10/12/28 | B | 95,298 | |||||||||||||||||||||||
| 303 | Victory Buyer LLC, Term Loan , (DD1) |
9.258% | TSFR3M | 3.750% | 11/18/28 | B3 | 275,457 | |||||||||||||||||||||||
| Total Machinery |
|
1,712,204 | ||||||||||||||||||||||||||||
| Media – 1.1% | ||||||||||||||||||||||||||||||
| 332 | ABG Intermediate Holdings 2 LLC, Term Loan B1 |
8.702% | SOFR30A | 3.500% | 12/21/28 | B1 | 330,738 | |||||||||||||||||||||||
| 80 | ABG Intermediate Holdings 2 LLC, Term Loan, Second Lien |
11.202% | SOFR30A | 6.000% | 12/20/29 | CCC+ | 74,800 | |||||||||||||||||||||||
| 120 | Cable One, Inc., Term Loan B4 |
7.193% | 1-Month LIBOR | 2.000% | 5/03/28 | BB+ | 117,878 | |||||||||||||||||||||||
| 440 | Cengage Learning, Inc., Term Loan B |
9.880% | 3-Month LIBOR | 4.750% | 7/14/26 | B | 431,630 | |||||||||||||||||||||||
| 1,022 | Clear Channel Outdoor Holdings, Inc., Term Loan B |
8.733% | |
SOFR30A + SOFR90A + 3-Month LIBOR |
|
3.500% | 8/23/26 | B1 | 977,822 | |||||||||||||||||||||
| 72 | CSC Holdings, LLC, Term Loan |
7.443% | 1-Month LIBOR | 2.250% | 1/15/26 | B1 | 69,196 | |||||||||||||||||||||||
| 48 | CSC Holdings, LLC, Term Loan B1 |
7.443% | 1-Month LIBOR | 2.250% | 7/17/25 | B1 | 46,453 | |||||||||||||||||||||||
| 326 | CSC Holdings, LLC, Term Loan B6 |
9.647% | SOFR30A | 4.500% | 1/18/28 | B1 | 301,491 | |||||||||||||||||||||||
| 49 | Cumulus Media New Holdings Inc., Term Loan B |
9.226% | 3-Month LIBOR | 3.750% | 3/31/26 | B | 37,035 | |||||||||||||||||||||||
| 320 | DirecTV Financing, LLC, Term Loan |
10.217% | 1-Month LIBOR | 5.000% | 8/02/27 | BBB- | 313,917 | |||||||||||||||||||||||
| 244 | Dotdash Meredith Inc, Term Loan B |
9.260% | SOFR30A | 4.000% | 12/01/28 | B+ | 223,037 | |||||||||||||||||||||||
| 235 | Formula One Holdings Limited, Term Loan B |
8.102% | SOFR30A | 3.000% | 1/15/30 | BB+ | 235,323 | |||||||||||||||||||||||
| 204 | iHeartCommunications, Inc., Term Loan |
8.217% | SOFR30A | 3.000% | 5/01/26 | BB- | 177,381 | |||||||||||||||||||||||
| 230 | McGraw-Hill Global Education Holdings, LLC, Term Loan |
10.142% | 1+6-Month LIBOR | 4.750% | 7/30/28 | BB+ | 216,433 | |||||||||||||||||||||||
| 83 | Mission Broadcasting, Inc., Term Loan B |
7.670% | 1-Month LIBOR | 2.500% | 6/03/28 | BBB- | 82,538 | |||||||||||||||||||||||
| 73 | Outfront Media Capital LLC, Term Loan B |
6.852% | SOFR30A | 1.750% | 11/18/26 | Ba1 | 72,050 | |||||||||||||||||||||||
| 600 | Radiate Holdco, LLC, Term Loan B |
8.477% | SOFR90A | 3.250% | 9/25/26 | B3 | 502,095 | |||||||||||||||||||||||
| 500 | Radiate Holdco, LLC, Term Loan B,Term Loan, Term Loan , (WI/DD) |
TBD | TBD | TBD | TBD | N/R | 418,563 | |||||||||||||||||||||||
| 250 | Virgin Media Bristol LLC, Term Loan N |
7.693% | 1-Month LIBOR | 2.500% | 1/31/28 | BB+ | 248,235 | |||||||||||||||||||||||
| 231 | Ziggo Financing Partnership, Term Loan I |
7.693% | 1-Month LIBOR | 2.500% | 4/30/28 | BB | 227,857 | |||||||||||||||||||||||
| Total Media |
|
5,104,472 | ||||||||||||||||||||||||||||
| Oil, Gas & Consumable Fuels – 0.3% | ||||||||||||||||||||||||||||||
| 1 | DT Midstream, Inc, Term Loan B |
7.193% | 1-Month LIBOR | 2.000% | 6/10/28 | Baa2 | 1,256 | |||||||||||||||||||||||
| 140 | EG America LLC, Term Loan |
9.084% | SOFR30A | 4.000% | 2/05/25 | B | 138,002 | |||||||||||||||||||||||
| 269 | Freeport LNG Investments, LLLP, Term Loan A |
8.250% | 3-Month LIBOR | 3.000% | 11/16/26 | N/R | 264,042 | |||||||||||||||||||||||
| 567 | Gulf Finance, LLC, Term Loan |
11.981% | SOFR30A | 6.750% | 8/25/26 | B | 552,295 | |||||||||||||||||||||||
| 365 | QuarterNorth Energy Holding Inc., Exit Term Loan, Second Lien |
12.840% | 1-Month LIBOR | 8.000% | 8/27/26 | B | 364,439 | |||||||||||||||||||||||
| 231 | TransMontaigne Operating Company L.P., Term Loan B |
8.698% | |
TSFR1M + 1-Month LIBOR |
|
3.500% | 11/05/28 | BB- | 228,293 | |||||||||||||||||||||
| Total Oil, Gas & Consumable Fuels |
|
1,548,327 | ||||||||||||||||||||||||||||
| Paper & Forest Products – 0.0% | ||||||||||||||||||||||||||||||
| 182 | Asplundh Tree Expert, LLC, Term Loan B |
6.952% | SOFR30A | 1.750% | 9/04/27 | BBB- | 181,403 | |||||||||||||||||||||||
| Total Paper & Forest Products |
|
181,403 | ||||||||||||||||||||||||||||
| Passenger Airlines – 0.4% | ||||||||||||||||||||||||||||||
| 162 | AAdvantage Loyalty IP Ltd., Term Loan |
10.000% | 3-Month LIBOR | 4.750% | 4/20/28 | Ba2 | 166,068 | |||||||||||||||||||||||
| 197 | Air Canada, Term Loan B |
8.839% | 3-Month LIBOR | 3.500% | 8/11/28 | Ba2 | 197,329 | |||||||||||||||||||||||
29
| NMAI | Nuveen Multi-Asset Income Fund (continued) | |
| Portfolio of Investments June 30, 2023 | ||
| (Unaudited) | ||
| Principal Amount (000) |
Description (1) | Coupon (9) | Reference Rate (9) |
Spread (9) | Maturity (10) | Ratings (6) | Value | |||||||||||||||||||||||
| Passenger Airlines (continued) | ||||||||||||||||||||||||||||||
| $ | 693 | Kestrel Bidco Inc., Term Loan B |
8.251% | SOFR90A | 3.000% | 12/11/26 | B+ | $ | 674,141 | |||||||||||||||||||||
| 430 | Mileage Plus Holdings LLC, Term Loan B |
10.764% | 3-Month LIBOR | 5.250% | 6/20/27 | Baa3 | 447,836 | |||||||||||||||||||||||
| 293 | SkyMiles IP Ltd., Term Loan B |
8.798% | SOFR90A | 3.750% | 10/20/27 | Baa1 | 304,200 | |||||||||||||||||||||||
| 192 | United Airlines, Inc., Term Loan B |
9.292% | 3-Month LIBOR | 3.750% | 4/21/28 | Ba1 | 191,749 | |||||||||||||||||||||||
| Total Passenger Airlines |
|
1,981,323 | ||||||||||||||||||||||||||||
| Personal Care Products – 0.0% | ||||||||||||||||||||||||||||||
| 110 | Kronos Acquisition Holdings Inc., Term Loan B |
8.943% | 1-Month LIBOR | 3.750% | 12/22/26 | B2 | 107,089 | |||||||||||||||||||||||
| Total Personal Care Products |
|
107,089 | ||||||||||||||||||||||||||||
| Pharmaceuticals – 0.3% | ||||||||||||||||||||||||||||||
| 609 | Jazz Financing Lux S.a.r.l., Term Loan |
8.864% | 1-Month LIBOR | 3.500% | 5/05/28 | BB+ | 608,336 | |||||||||||||||||||||||
| 245 | LSCS Holdings, Inc., Term Loan, First Lien |
9.693% | 1-Month LIBOR | 4.500% | 12/16/28 | B2 | 239,492 | |||||||||||||||||||||||
| 3 | Mallinckrodt International Finance S.A., Term Loan |
10.396% | 1-Month LIBOR | 5.250% | 9/30/27 | Caa1 | 2,574 | |||||||||||||||||||||||
| 267 | Organon & Co, Term Loan |
8.250% | 1-Month LIBOR | 3.000% | 6/02/28 | BB | 267,553 | |||||||||||||||||||||||
| 154 | Perrigo Investments, LLC, Term Loan B |
7.452% | SOFR30A | 2.350% | 4/05/29 | BB+ | 153,475 | |||||||||||||||||||||||
| Total Pharmaceuticals |
|
1,271,430 | ||||||||||||||||||||||||||||
| Professional Services – 0.2% | ||||||||||||||||||||||||||||||
| 113 | CHG Healthcare Services Inc., Term Loan |
8.443% | 1-Month LIBOR | 3.250% | 9/30/28 | B1 | 112,578 | |||||||||||||||||||||||
| 117 | Dun & Bradstreet Corporation (The), Term Loan |
8.434% | TSFR1M | 3.250% | 2/08/26 | BB+ | 117,290 | |||||||||||||||||||||||
| 93 | Physician Partners LLC, Term Loan |
9.392% | SOFR90A | 4.000% | 2/01/29 | B | 87,479 | |||||||||||||||||||||||
| 200 | Trans Union, LLC, Term Loan B5 |
6.952% | 1-Month LIBOR | 1.750% | 11/13/26 | BBB- | 199,729 | |||||||||||||||||||||||
| 23 | Travelport Finance (Luxembourg) S.a.r.l., Term Loan , (cash 3.500%, PIK 6.500%) |
6.976% | 3-Month LIBOR | 1.500% | 2/28/25 | B- | 23,087 | |||||||||||||||||||||||
| 243 | Verscend Holding Corp., Term Loan B |
9.217% | 1-Month LIBOR | 4.000% | 8/27/25 | BB- | 242,836 | |||||||||||||||||||||||
| Total Professional Services |
|
782,999 | ||||||||||||||||||||||||||||
| Real Estate Management & Development – 0.1% | ||||||||||||||||||||||||||||||
| 130 | Cushman & Wakefield U.S. Borrower, LLC, Term Loan |
8.452% | SOFR30A | 3.250% | 1/31/30 | BB | 126,048 | |||||||||||||||||||||||
| 103 | Cushman & Wakefield U.S. Borrower, LLC, Term Loan B |
7.943% | 1-Month LIBOR | 2.750% | 8/21/25 | BB | 102,181 | |||||||||||||||||||||||
| Total Real Estate Management & Development |
|
228,229 | ||||||||||||||||||||||||||||
| Semiconductors & Semiconductor Equipment – 0.0% | ||||||||||||||||||||||||||||||
| 222 | Bright Bidco B.V., Term Loan |
13.068% | SOFR90A | 8.000% | 10/31/27 | B- | 114,870 | |||||||||||||||||||||||
| Total Semiconductors & Semiconductor Equipment |
|
114,870 | ||||||||||||||||||||||||||||
| Software – 1.6% | ||||||||||||||||||||||||||||||
| 121 | AppLovin Corporation, Term Loan B |
8.202% | SOFR30A | 3.100% | 10/21/28 | BB- | 120,782 | |||||||||||||||||||||||
| 66 | Apttus Corporation, Term Loan |
9.523% | 3-Month LIBOR | 4.250% | 5/06/28 | BB | 65,077 | |||||||||||||||||||||||
| 639 | Avaya, Inc., Term Loan |
13.739% | SOFR90A | 8.500% | 8/01/28 | N/R | 553,043 | |||||||||||||||||||||||
| 316 | Banff Merger Sub Inc, Term Loan |
8.967% | SOFR30A | 3.750% | 10/02/25 | B2 | 313,767 | |||||||||||||||||||||||
| 208 | Camelot U.S. Acquisition LLC, Term Loan B |
8.217% | SOFR30A | 3.000% | 10/31/26 | BB+ | 207,828 | |||||||||||||||||||||||
| 183 | Camelot U.S. Acquisition LLC, Term Loan B |
8.217% | SOFR30A | 3.000% | 10/31/26 | B+ | 182,822 | |||||||||||||||||||||||
| 179 | CDK Global, Inc., Term Loan B |
9.492% | SOFR90A | 4.250% | 6/09/29 | B+ | 178,184 | |||||||||||||||||||||||
| 221 | Ceridian HCM Holding Inc., Term Loan B |
7.827% | 1+3-Month LIBOR | 2.500% | 4/30/25 | Ba3 | 221,052 | |||||||||||||||||||||||
| 248 | DTI Holdco, Inc., Term Loan |
9.795% | SOFR90A | 4.750% | 4/21/29 | B2 | 231,609 | |||||||||||||||||||||||
| 667 | Epicor Software Corporation, Term Loan |
8.334% | SOFR30A | 3.250% | 7/31/27 | B2 | 659,728 | |||||||||||||||||||||||
| 647 | Finastra USA, Inc., Term Loan, First Lien |
9.102% | 3+6-Month LIBOR | 3.500% | 6/13/24 | B | 623,923 | |||||||||||||||||||||||
| 242 | Greeneden U.S. Holdings II, LLC, Term Loan B4 |
9.193% | SOFR30A | 4.000% | 12/01/27 | B2 | 242,017 | |||||||||||||||||||||||
| 119 | IGT Holding IV AB, Term Loan B2 |
8.450% | SOFR90A | 3.400% | 3/29/28 | B | 118,150 | |||||||||||||||||||||||
| 269 | Informatica LLC, Term Loan B |
8.000% | 1-Month LIBOR | 2.750% | 10/14/28 | BB- | 269,152 | |||||||||||||||||||||||
30
| Principal Amount (000) |
Description (1) | Coupon (9) | Reference Rate (9) |
Spread (9) | Maturity (10) | Ratings (6) | Value | |||||||||||||||||||||||
| Software (continued) | ||||||||||||||||||||||||||||||
| $ 247 | Instructure Holdings, Inc., Term Loan B |
7.852% | 3-Month LIBOR | 2.750% | 10/29/28 | BBB- | $ | 247,339 | ||||||||||||||||||||||
| 173 | McAfee, LLC, Term Loan B |
9.010% | SOFR30A | 3.750% | 2/03/29 | BB+ | 166,065 | |||||||||||||||||||||||
| 194 | NortonLifeLock Inc., Term Loan B |
7.202% | SOFR30A | 2.000% | 1/28/29 | BBB- | 193,276 | |||||||||||||||||||||||
| 646 | Open Text Corporation, Term Loan B |
8.584% | SOFR30A | 3.500% | 8/25/29 | BBB- | 649,761 | |||||||||||||||||||||||
| 47 | Proofpoint, Inc., Term Loan, First Lien |
8.442% | 1-Month LIBOR | 3.250% | 8/31/28 | BB- | 46,272 | |||||||||||||||||||||||
| 95 | Quartz Acquireco LLC |
0.000% | |
CME Term SOFR 1 Month |
|
350.000% | 4/14/30 | BB+ | 95,119 | |||||||||||||||||||||
| 17 | RealPage, Inc, Term Loan, First Lien |
8.193% | 1-Month LIBOR | 3.000% | 4/22/28 | B+ | 16,497 | |||||||||||||||||||||||
| 517 | Sophia, L.P., Term Loan B |
9.038% | 3-Month LIBOR | 3.500% | 10/07/27 | B2 | 512,614 | |||||||||||||||||||||||
| 168 | SS&C European Holdings Sarl, Term Loan B4 |
6.967% | SOFR30A | 1.750% | 4/16/25 | BB+ | 168,264 | |||||||||||||||||||||||
| 176 | SS&C Technologies Inc., Term Loan B3 |
6.967% | SOFR30A | 1.750% | 4/16/25 | BB+ | 176,098 | |||||||||||||||||||||||
| 44 | SS&C Technologies Inc., Term Loan B6 |
7.452% | SOFR30A | 2.250% | 3/22/29 | BB+ | 44,349 | |||||||||||||||||||||||
| 67 | SS&C Technologies Inc., Term Loan B7 |
7.452% | SOFR30A | 2.250% | 3/22/29 | BB+ | 66,843 | |||||||||||||||||||||||
| 540 | Ultimate Software Group Inc (The), Term Loan |
8.271% | SOFR90A | 3.250% | 5/03/26 | B1 | 530,377 | |||||||||||||||||||||||
| 235 | Zelis Healthcare Corporation, Term Loan |
8.693% | 1-Month LIBOR | 3.500% | 9/30/26 | B | 234,607 | |||||||||||||||||||||||
| Total Software |
|
7,134,615 | ||||||||||||||||||||||||||||
| Specialty Retail – 0.4% | ||||||||||||||||||||||||||||||
| 189 | Avis Budget Car Rental, LLC, Term Loan B |
6.967% | SOFR30A | 1.750% | 8/06/27 | BB+ | 187,008 | |||||||||||||||||||||||
| 162 | Avis Budget Car Rental, LLC, Term Loan C |
8.587% | SOFR30A | 3.500% | 3/15/29 | BB+ | 162,363 | |||||||||||||||||||||||
| 245 | Driven Holdings, LLC, Term Loan B |
8.154% | 1-Month LIBOR | 3.000% | 12/17/28 | B3 | 241,176 | |||||||||||||||||||||||
| 274 | Jo-Ann Stores, Inc., Term Loan B1 |
10.018% | 3-Month LIBOR | 4.750% | 6/30/28 | CCC+ | 143,998 | |||||||||||||||||||||||
| 154 | Les Schwab Tire Centers, Term Loan B |
8.443% | 1-Month LIBOR | 3.250% | 11/02/27 | B | 153,569 | |||||||||||||||||||||||
| 718 | PetSmart, Inc., Term Loan B |
8.834% | SOFR30A | 3.750% | 2/12/28 | BB | 718,147 | |||||||||||||||||||||||
| 178 | Restoration Hardware, Inc., Term Loan B |
7.693% | 1-Month LIBOR | 2.500% | 10/15/28 | BB- | 172,226 | |||||||||||||||||||||||
| Total Specialty Retail |
1,778,487 | |||||||||||||||||||||||||||||
| Technology Hardware, Storage & Peripherals – 0.1% | ||||||||||||||||||||||||||||||
| 231 | NCR Corporation, Term Loan |
7.780% | 3-Month LIBOR | 2.500% | 8/28/26 | BB+ | 230,556 | |||||||||||||||||||||||
| Total Technology Hardware, Storage & Peripherals |
|
230,556 | ||||||||||||||||||||||||||||
| Textiles, Apparel & Luxury Goods – 0.1% | ||||||||||||||||||||||||||||||
| 201 | Birkenstock GmbH & Co. KG, Term Loan B |
8.593% | TSFR3M | 3.250% | 4/28/28 | BB+ | 199,649 | |||||||||||||||||||||||
| 147 | Crocs Inc, Term Loan B |
8.702% | SOFR30A | 3.500% | 2/19/29 | Ba2 | 148,011 | |||||||||||||||||||||||
| 27 | New Trojan Parent, Inc., Term Loan, First Lien |
8.449% | |
TSFR1M + 1-Month LIBOR |
|
3.250% | 1/06/28 | CCC+ | 15,364 | |||||||||||||||||||||
| Total Textiles, Apparel & Luxury Goods |
363,024 | |||||||||||||||||||||||||||||
| Trading Companies & Distributors – 0.2% | ||||||||||||||||||||||||||||||
| 175 | Core & Main LP, Term Loan B |
7.687% | TSFR1M + SOFR90A | 2.500% | 6/10/28 | B+ | 174,082 | |||||||||||||||||||||||
| 340 | Fly Funding II S.a.r.l., Term Loan B |
7.090% | 3-Month LIBOR | 1.750% | 8/09/25 | B3 | 323,239 | |||||||||||||||||||||||
| 1 | Univar Solutions USA Inc., Term Loan B6 |
7.288% | 3-Month LIBOR | 1.750% | 6/03/28 | BBB- | 1,551 | |||||||||||||||||||||||
| 380 | Windsor Holdings III LLC, Term Loan, (WI/DD) |
TBD | TBD | TBD | TBD | BB+ | 373,778 | |||||||||||||||||||||||
| Total Trading Companies & Distributors |
872,650 | |||||||||||||||||||||||||||||
| Transportation Infrastructure – 0.2% | ||||||||||||||||||||||||||||||
| 189 | Brown Group Holding, LLC, Term Loan B |
7.702% | SOFR30A | 2.500% | 4/22/28 | B+ | 186,359 | |||||||||||||||||||||||
| 149 | Brown Group Holding, LLC, Term Loan B2 |
8.887% | |
SOFR30A + SOFR90A + TSFR3M |
|
3.750% | 6/09/29 | B+ | 148,768 | |||||||||||||||||||||
| 418 | KKR Apple Bidco, LLC, Term Loan |
7.967% | SOFR30A | 2.750% | 9/23/28 | B | 415,403 | |||||||||||||||||||||||
| 120 | KKR Apple Bidco, LLC, Term Loan |
9.102% | SOFR30A | 4.000% | 9/23/28 | B | 118,952 | |||||||||||||||||||||||
| Total Transportation Infrastructure |
869,482 | |||||||||||||||||||||||||||||
31
| NMAI | Nuveen Multi-Asset Income Fund (continued) | |
| Portfolio of Investments June 30, 2023 | ||
| (Unaudited) | ||
| Principal Amount (000) |
Description (1) | Coupon (9) | Reference Rate (9) |
Spread (9) | Maturity (10) | Ratings (6) | Value | |||||||||||||||||||||||
| Wireless Telecommunication Services – 0.1% | ||||||||||||||||||||||||||||||
| $ 191 | GOGO Intermediate Holdings LLC, Term Loan B |
8.967% | SOFR30A | 3.750% | 4/30/28 | B+ | $ | 191,021 | ||||||||||||||||||||||
| 352 | Intelsat Jackson Holdings S.A., Term Loan B |
9.443% | SOFR90A | 4.250% | 1/27/29 | BB+ | 350,797 | |||||||||||||||||||||||
| 3 | Intelsat Jackson Holdings S.A., Term Loan B3 (11) |
13.000% | Prime | 4.750% | 11/27/23 | N/R | 3,130 | |||||||||||||||||||||||
| Total Wireless Telecommunication Services |
|
544,948 | ||||||||||||||||||||||||||||
| Total Variable Rate Senior Loan Interests (cost $61,927,283) |
|
58,115,789 | ||||||||||||||||||||||||||||
| Shares | Description (1) | Value | ||||||||||||||||||||||||||||
| EXCHANGE-TRADED FUNDS – 11.9% (8.2% of Total Investments) | ||||||||||||||||||||||||||||||
| 789,275 | iShares Core MSCI Emerging Markets ETF |
$ | 38,903,365 | |||||||||||||||||||||||||||
| 8,699 | iShares MSCI EAFE ETF |
630,677 | ||||||||||||||||||||||||||||
| 18,839 | iShares MSCI India ETF |
823,264 | ||||||||||||||||||||||||||||
| 17,939 | iShares MSCI Saudi Arabia ETF |
741,419 | ||||||||||||||||||||||||||||
| 175,131 | Vanguard Short-Term Bond ETF |
13,234,650 | ||||||||||||||||||||||||||||
| Total Exchange-Traded Funds (cost $52,234,846) |
|
54,333,375 | ||||||||||||||||||||||||||||
| Shares | Description (1) | Value | ||||||||||||||||||||||||||||
| REAL ESTATE INVESTMENT TRUST COMMON STOCKS – 9.4% (6.5% of Total Investments) |
|
|||||||||||||||||||||||||||||
| Data Center REITs – 0.9% | ||||||||||||||||||||||||||||||
| 13,115 | Digital Realty Trust Inc (3) |
$ | 1,493,405 | |||||||||||||||||||||||||||
| 3,474 | Equinix Inc (3) |
2,723,408 | ||||||||||||||||||||||||||||
| Total Data Center REITs |
4,216,813 | |||||||||||||||||||||||||||||
| Health Care REITs – 0.6% | ||||||||||||||||||||||||||||||
| 23,100 | Healthpeak Properties Inc |
464,310 | ||||||||||||||||||||||||||||
| 42,400 | Parkway Life Real Estate Investment Trust |
122,467 | ||||||||||||||||||||||||||||
| 15,200 | Ventas Inc |
718,504 | ||||||||||||||||||||||||||||
| 18,400 | Welltower Inc (3) |
1,488,376 | ||||||||||||||||||||||||||||
| Total Health Care REITs |
2,793,657 | |||||||||||||||||||||||||||||
| Hotel & Resort REITs – 0.2% | ||||||||||||||||||||||||||||||
| 33,900 | Host Hotels & Resorts Inc |
570,537 | ||||||||||||||||||||||||||||
| 3,900 | Ryman Hospitality Properties Inc |
362,388 | ||||||||||||||||||||||||||||
| Total Hotel & Resort REITs |
932,925 | |||||||||||||||||||||||||||||
| Industrial REITs – 1.8% | ||||||||||||||||||||||||||||||
| 2,600 | EastGroup Properties Inc |
451,360 | ||||||||||||||||||||||||||||
| 44,510 | Prologis Inc |
5,458,261 | ||||||||||||||||||||||||||||
| 25,000 | Rexford Industrial Realty Inc |
1,305,500 | ||||||||||||||||||||||||||||
| 14,400 | Terreno Realty Corp |
865,440 | ||||||||||||||||||||||||||||
| Total Industrial REITs |
8,080,561 | |||||||||||||||||||||||||||||
| Multi-Family Residential REITs – 1.0% | ||||||||||||||||||||||||||||||
| 9,200 | AvalonBay Communities Inc |
1,741,284 | ||||||||||||||||||||||||||||
| 11,800 | Equity Residential |
778,446 | ||||||||||||||||||||||||||||
| 2,600 | Essex Property Trust Inc |
609,180 | ||||||||||||||||||||||||||||
| 21,800 | Independence Realty Trust Inc |
397,196 | ||||||||||||||||||||||||||||
| 6,200 | Mid-America Apartment Communities Inc |
941,532 | ||||||||||||||||||||||||||||
| Total Multi-Family Residential REITs |
4,467,638 | |||||||||||||||||||||||||||||
32
| Shares | Description (1) | Value | ||||||||||||||||||||||||||||
| Office REITs – 0.2% | ||||||||||||||||||||||||||||||
| 4,600 | Alexandria Real Estate Equities Inc |
$ | 522,054 | |||||||||||||||||||||||||||
| 3,000 | Boston Properties Inc |
172,770 | ||||||||||||||||||||||||||||
| Total Office REITs |
694,824 | |||||||||||||||||||||||||||||
| Other Specialized REITs – 0.4% | ||||||||||||||||||||||||||||||
| 13,000 | Gaming and Leisure Properties Inc |
629,980 | ||||||||||||||||||||||||||||
| 43,200 | VICI Properties Inc (3) |
1,357,776 | ||||||||||||||||||||||||||||
| Total Other Specialized REITs |
1,987,756 | |||||||||||||||||||||||||||||
| Retail REITs – 1.4% | ||||||||||||||||||||||||||||||
| 5,300 | Agree Realty Corp |
346,567 | ||||||||||||||||||||||||||||
| 27,700 | Brixmor Property Group Inc |
609,400 | ||||||||||||||||||||||||||||
| 39,600 | Kimco Realty Corp |
780,912 | ||||||||||||||||||||||||||||
| 27,500 | Kite Realty Group Trust |
614,350 | ||||||||||||||||||||||||||||
| 17,700 | Realty Income Corp |
1,058,283 | ||||||||||||||||||||||||||||
| 15,100 | Regency Centers Corp (3) |
932,727 | ||||||||||||||||||||||||||||
| 17,100 | Simon Property Group Inc (3) |
1,974,708 | ||||||||||||||||||||||||||||
| 4,500 | Spirit Realty Capital Inc |
177,210 | ||||||||||||||||||||||||||||
| Total Retail REITs |
6,494,157 | |||||||||||||||||||||||||||||
| Self-Storage REITs – 0.4% | ||||||||||||||||||||||||||||||
| 1,900 | Extra Space Storage Inc |
282,815 | ||||||||||||||||||||||||||||
| 2,700 | Life Storage Inc |
358,992 | ||||||||||||||||||||||||||||
| 3,800 | Public Storage (3) |
1,109,144 | ||||||||||||||||||||||||||||
| Total Self-Storage REITs |
1,750,951 | |||||||||||||||||||||||||||||
| Single-Family Residential REITs – 0.7% | ||||||||||||||||||||||||||||||
| 31,200 | American Homes 4 Rent, Class A (3) |
1,106,040 | ||||||||||||||||||||||||||||
| 16,900 | Equity LifeStyle Properties Inc |
1,130,441 | ||||||||||||||||||||||||||||
| 5,400 | Invitation Homes Inc |
185,760 | ||||||||||||||||||||||||||||
| 8,500 | Sun Communities Inc |
1,108,910 | ||||||||||||||||||||||||||||
| Total Single-Family Residential REITs |
3,531,151 | |||||||||||||||||||||||||||||
| Telecom Tower REITs – 1.6% | ||||||||||||||||||||||||||||||
| 19,601 | American Tower Corp (3) |
3,801,418 | ||||||||||||||||||||||||||||
| 14,542 | Crown Castle Inc (3) |
1,656,915 | ||||||||||||||||||||||||||||
| 7,712 | SBA Communications Corp (3) |
1,787,333 | ||||||||||||||||||||||||||||
| Total Telecom Tower REITs |
7,245,666 | |||||||||||||||||||||||||||||
| Timber REITs – 0.2% | ||||||||||||||||||||||||||||||
| 21,600 | Weyerhaeuser Co (3) |
723,816 | ||||||||||||||||||||||||||||
| Total Timber REITs |
723,816 | |||||||||||||||||||||||||||||
| Total Real Estate Investment Trust Common Stocks (cost $36,805,982) |
|
42,919,915 | ||||||||||||||||||||||||||||
| Principal Amount (000) (14) |
Description (1) | Coupon | Maturity | Ratings (6) | Value | |||||||||||||||||||||||||
| EMERGING MARKET DEBT AND FOREIGN CORPORATE BONDS – 9.1% (6.3% of Total Investments) |
|
|||||||||||||||||||||||||||||
| Angola – 0.1% | ||||||||||||||||||||||||||||||
| $ 335 | Angolan Government International Bond, 144A |
|
8.250% | 5/09/28 | B3 | $ | 296,642 | |||||||||||||||||||||||
| 200 | Angolan Government International Bond, 144A |
|
8.750% | 4/14/32 | B- | 167,950 | ||||||||||||||||||||||||
| 270 | Angolan Government International Bond, 144A |
|
9.375% | 5/08/48 | B3 | 213,300 | ||||||||||||||||||||||||
| Total Angola |
677,892 | |||||||||||||||||||||||||||||
33
| NMAI | Nuveen Multi-Asset Income Fund (continued) | |
| Portfolio of Investments June 30, 2023 | ||
| (Unaudited) | ||
| Principal Amount (000) |
(14) |
Description (1) | Coupon | Maturity | Ratings (6) | Value | ||||||||||||||||||||||||
| Argentina – 0.1% | ||||||||||||||||||||||||||||||
| $ 700 | Argentine Republic Government International Bond |
|
1.500% | 7/09/35 | CCC- | $ | 208,815 | |||||||||||||||||||||||
| 475 | Provincia de Buenos Aires/Government Bonds , 144A |
|
5.250% | 9/01/37 | CCC- | 180,500 | ||||||||||||||||||||||||
| 20 | YPF SA, Reg S |
|
6.950% | 7/21/27 | CCC- | 16,413 | ||||||||||||||||||||||||
| 139 | YPF SA, 144A |
6.950% | 7/21/27 | CCC- | 114,070 | |||||||||||||||||||||||||
| Total Argentina |
519,798 | |||||||||||||||||||||||||||||
| Australia – 0.4% | ||||||||||||||||||||||||||||||
| 200 | AngloGold Ashanti Holdings PLC |
|
3.375% | 11/01/28 | Baa3 | 175,112 | ||||||||||||||||||||||||
| 200 | AngloGold Ashanti Holdings PLC |
|
3.750% | 10/01/30 | Baa3 | 171,673 | ||||||||||||||||||||||||
| 1,290 | QBE Insurance Group Ltd, Reg S |
6.750% | 12/02/44 | BBB | 1,273,556 | |||||||||||||||||||||||||
| Total Australia |
1,620,341 | |||||||||||||||||||||||||||||
| Barbados – 0.0% | ||||||||||||||||||||||||||||||
| 200 | Barbados Government International Bond, 144A |
|
6.500% | 10/01/29 | B | 186,760 | ||||||||||||||||||||||||
| Total Barbados |
186,760 | |||||||||||||||||||||||||||||
| Benin – 0.1% | ||||||||||||||||||||||||||||||
| 190 | EUR | Benin Government International Bond, 144A |
|
4.950% | 1/22/35 | B+ | 145,693 | |||||||||||||||||||||||
| 100 | EUR | Benin Government International Bond, 144A |
|
6.875% | 1/19/52 | B+ | 76,751 | |||||||||||||||||||||||
| Total Benin |
222,444 | |||||||||||||||||||||||||||||
| Bermuda – 0.0% | ||||||||||||||||||||||||||||||
| 200 | Bermuda Government International Bond, 144A |
|
4.750% | 2/15/29 | A+ | 195,400 | ||||||||||||||||||||||||
| Total Bermuda |
195,400 | |||||||||||||||||||||||||||||
| Brazil – 0.4% | ||||||||||||||||||||||||||||||
| 200 | B3 SA – Brasil Bolsa Balcao, 144A |
|
4.125% | 9/20/31 | Ba1 | 170,297 | ||||||||||||||||||||||||
| 200 | Banco do Brasil SA/Cayman, 144A |
|
4.875% | 1/11/29 | Ba2 | 188,371 | ||||||||||||||||||||||||
| 900 | BRL | Brazil Notas do Tesouro Nacional Serie F |
|
10.000% | 1/01/31 | BB- | 182,663 | |||||||||||||||||||||||
| 340 | Brazilian Government International Bond |
|
6.000% | 10/20/33 | Ba2 | 336,100 | ||||||||||||||||||||||||
| 210 | Brazilian Government International Bond |
|
5.000% | 1/27/45 | Ba2 | 163,470 | ||||||||||||||||||||||||
| 200 | Brazilian Government International Bond |
|
5.625% | 1/07/41 | Ba2 | 176,583 | ||||||||||||||||||||||||
| 200 | Brazilian Government International Bond |
|
4.750% | 1/14/50 | Ba2 | 146,866 | ||||||||||||||||||||||||
| 200 | Embraer Netherlands Finance BV, 144A |
|
6.950% | 1/17/28 | BB+ | 198,938 | ||||||||||||||||||||||||
| 200 | JSM Global Sarl , 144A (11) |
|
4.750% | 10/20/30 | C | 34,700 | ||||||||||||||||||||||||
| 145 | Petrobras Global Finance BV |
|
6.750% | 6/03/50 | Ba1 | 129,816 | ||||||||||||||||||||||||
| 115 | Petrobras Global Finance BV |
|
5.500% | 6/10/51 | Ba1 | 90,505 | ||||||||||||||||||||||||
| 200 | Suzano Austria GmbH |
2.500% | 9/15/28 | BBB- | 170,332 | |||||||||||||||||||||||||
| Total Brazil |
1,988,641 | |||||||||||||||||||||||||||||
| Cameroon – 0.0% | ||||||||||||||||||||||||||||||
| 100 | EUR | Republic of Cameroon International Bond, 144A |
|
5.950% | 7/07/32 | B | 77,880 | |||||||||||||||||||||||
| Total Cameroon |
77,880 | |||||||||||||||||||||||||||||
| Canada – 0.3% | ||||||||||||||||||||||||||||||
| 150 | Air Canada, 144A |
|
3.875% | 8/15/26 | Ba2 | 139,028 | ||||||||||||||||||||||||
| 550 | Enbridge Inc |
|
5.750% | 7/15/80 | BBB- | 496,721 | ||||||||||||||||||||||||
| 175 | Enbridge Inc |
|
5.500% | 7/15/77 | BBB- | 155,768 | ||||||||||||||||||||||||
| 625 | GFL Environmental Inc, 144A (2), (3) |
5.125% | 12/15/26 | BB- | 602,992 | |||||||||||||||||||||||||
| Total Canada |
1,394,509 | |||||||||||||||||||||||||||||
| Chile – 0.3% | ||||||||||||||||||||||||||||||
| 199 | Alfa Desarrollo SpA, 144A 2021 1 |
|
4.550% | 9/27/51 | BBB- | 146,027 | ||||||||||||||||||||||||
| 200 | Antofagasta PLC, 144A |
|
5.625% | 5/13/32 | BBB+ | 198,780 | ||||||||||||||||||||||||
| 200 | Banco del Estado de Chile, 144A |
|
2.704% | 1/09/25 | A | 191,032 | ||||||||||||||||||||||||
| 175 | Cia Cervecerias Unidas SA, 144A |
|
3.350% | 1/19/32 | A- | 149,189 | ||||||||||||||||||||||||
| 200 | Corp Nacional del Cobre de Chile, 144A |
|
3.000% | 9/30/29 | A | 175,649 | ||||||||||||||||||||||||
| 150 | Empresa Nacional de Telecomunicaciones SA, 144A |
|
3.050% | 9/14/32 | BBB | 118,800 | ||||||||||||||||||||||||
| 200 | Empresa Nacional del Petroleo, 144A |
|
6.150% | 5/10/33 | A- | 199,750 | ||||||||||||||||||||||||
| 200 | Inversiones CMPC SA, 144A |
6.125% | 6/23/33 | BBB | 201,289 | |||||||||||||||||||||||||
| Total Chile |
1,380,516 | |||||||||||||||||||||||||||||
34
| Principal Amount (000) |
(14) |
Description (1) | Coupon | Maturity | Ratings (6) | Value | ||||||||||||||||||||||||
| China – 0.1% | ||||||||||||||||||||||||||||||
| $ 200 | Agile Group Holdings Ltd, Reg S |
|
5.500% | 5/17/26 | N/R | $ | 41,047 | |||||||||||||||||||||||
| 200 | ENN Clean Energy International Investment Ltd, 144A |
|
3.375% | 5/12/26 | BBB- | 185,242 | ||||||||||||||||||||||||
| 200 | Lenovo Group Ltd, 144A |
|
3.421% | 11/02/30 | Baa2 | 168,549 | ||||||||||||||||||||||||
| 200 | RKPF Overseas 2020 A Ltd, Reg S |
5.200% | 1/12/26 | B1 | 105,803 | |||||||||||||||||||||||||
| Total China |
500,641 | |||||||||||||||||||||||||||||
| Colombia – 0.3% | ||||||||||||||||||||||||||||||
| 320 | Bancolombia SA |
|
3.000% | 1/29/25 | Baa2 | 303,992 | ||||||||||||||||||||||||
| 350 | Colombia Government International Bond |
|
3.125% | 4/15/31 | Baa2 | 263,550 | ||||||||||||||||||||||||
| 200 | Colombia Government International Bond |
|
7.500% | 2/02/34 | Baa2 | 195,485 | ||||||||||||||||||||||||
| 205 | Colombia Government International Bond |
|
3.250% | 4/22/32 | Baa2 | 151,507 | ||||||||||||||||||||||||
| 200 | Ecopetrol SA |
|
4.625% | 11/02/31 | Baa3 | 154,386 | ||||||||||||||||||||||||
| 200 | Ecopetrol SA |
|
5.875% | 11/02/51 | Baa3 | 132,358 | ||||||||||||||||||||||||
| 200 | Empresas Publicas de Medellin ESP, 144A |
|
4.250% | 7/18/29 | Baa3 | 157,440 | ||||||||||||||||||||||||
| 200 | Grupo Aval Ltd, 144A |
4.375% | 2/04/30 | BB+ | 156,907 | |||||||||||||||||||||||||
| Total Colombia |
1,515,625 | |||||||||||||||||||||||||||||
| Costa Rica – 0.2% | ||||||||||||||||||||||||||||||
| 200 | Costa Rica Government International Bond, 144A |
|
6.550% | 4/03/34 | BB- | 200,700 | ||||||||||||||||||||||||
| 200 | Costa Rica Government International Bond, 144A |
|
7.000% | 4/04/44 | BB- | 194,533 | ||||||||||||||||||||||||
| 200 | Instituto Costarricense de Electricidad, 144A |
|
6.750% | 10/07/31 | BB- | 196,500 | ||||||||||||||||||||||||
| 200 | Liberty Costa Rica Senior Secured Finance, 144A |
|
10.875% | 1/15/31 | B+ | 197,905 | ||||||||||||||||||||||||
| Total Costa Rica |
789,638 | |||||||||||||||||||||||||||||
| Cote d’Ivoire – 0.1% | ||||||||||||||||||||||||||||||
| 395 | Ivory Coast Government International Bond, Reg S |
|
6.125% | 6/15/33 | BB- | 345,594 | ||||||||||||||||||||||||
| 270 | EUR | Ivory Coast Government International Bond, Reg S |
|
6.875% | 10/17/40 | BB- | 223,018 | |||||||||||||||||||||||
| Total Cote d’Ivoire |
568,612 | |||||||||||||||||||||||||||||
| Czech Republic – 0.0% | ||||||||||||||||||||||||||||||
| 1,700 | CZK | Czech Republic Government Bond |
1.750% | 6/23/32 | Aa3 | 63,207 | ||||||||||||||||||||||||
| Total Czech Republic |
63,207 | |||||||||||||||||||||||||||||
| Dominican Republic – 0.2% | ||||||||||||||||||||||||||||||
| 425 | Dominican Republic International Bond, Reg S |
|
7.450% | 4/30/44 | BB | 415,428 | ||||||||||||||||||||||||
| 270 | Dominican Republic International Bond, Reg S |
|
4.875% | 9/23/32 | BB | 229,471 | ||||||||||||||||||||||||
| 6,700 | DOP | Dominican Republic International Bond, 144A |
|
13.000% | 6/10/34 | N/R | 146,228 | |||||||||||||||||||||||
| 150 | Dominican Republic International Bond, 144A |
4.875% | 9/23/32 | BB | 127,484 | |||||||||||||||||||||||||
| Total Dominican Republic |
918,611 | |||||||||||||||||||||||||||||
| Ecuador – 0.1% | ||||||||||||||||||||||||||||||
| 623 | Ecuador Government International Bond, 144A |
|
1.000% | 7/31/35 | B- | 214,474 | ||||||||||||||||||||||||
| 137 | Ecuador Government International Bond, Reg S |
2.500% | 7/31/35 | N/R | 47,200 | |||||||||||||||||||||||||
| Total Ecuador |
261,674 | |||||||||||||||||||||||||||||
| Egypt – 0.2% | ||||||||||||||||||||||||||||||
| 300 | Egypt Government International Bond, Reg S |
|
7.903% | 2/21/48 | B | 153,258 | ||||||||||||||||||||||||
| 200 | Egypt Government International Bond, 144A |
|
5.800% | 9/30/27 | B | 132,500 | ||||||||||||||||||||||||
| 200 | Egypt Government International Bond, 144A |
|
7.600% | 3/01/29 | B | 129,020 | ||||||||||||||||||||||||
| 225 | Egypt Government International Bond, 144A |
|
8.500% | 1/31/47 | B | 119,003 | ||||||||||||||||||||||||
| 220 | Egypt Government International Bond, 144A |
|
7.300% | 9/30/33 | B | 120,802 | ||||||||||||||||||||||||
| 205 | Egypt Government International Bond, 144A |
8.875% | 5/29/50 | B | 109,929 | |||||||||||||||||||||||||
| Total Egypt |
764,512 | |||||||||||||||||||||||||||||
| El Salvador – 0.1% | ||||||||||||||||||||||||||||||
| 190 | El Salvador Government International Bond, 144A |
|
7.125% | 1/20/50 | CCC+ | 104,544 | ||||||||||||||||||||||||
| 65 | El Salvador Government International Bond, Reg S |
|
7.650% | 6/15/35 | CCC+ | 38,125 | ||||||||||||||||||||||||
| 135 | El Salvador Government International Bond, Reg S |
|
6.375% | 1/18/27 | CCC+ | 93,651 | ||||||||||||||||||||||||
| 40 | El Salvador Government International Bond, Reg S |
|
5.875% | 1/30/25 | CCC+ | 35,277 | ||||||||||||||||||||||||
| Total El Salvador |
271,597 | |||||||||||||||||||||||||||||
35
| NMAI | Nuveen Multi-Asset Income Fund (continued) | |
| Portfolio of Investments June 30, 2023 | ||
| (Unaudited) | ||
| Principal Amount (000) |
(14) |
Description (1) | Coupon | Maturity | Ratings (6) | Value | ||||||||||||||||||||||||
| Ghana – 0.1% | ||||||||||||||||||||||||||||||
| $ 250 | Ghana Government International Bond, 144A |
|
8.750% | 3/11/61 | Ca | $ | 102,583 | |||||||||||||||||||||||
| 355 | Ghana Government International Bond, Reg S |
|
7.625% | 5/16/29 | Ca | 150,889 | ||||||||||||||||||||||||
| 235 | Ghana Government International Bond, 144A |
|
7.750% | 4/07/29 | Ca | 99,405 | ||||||||||||||||||||||||
| 200 | Kosmos Energy Ltd, 144A |
7.750% | 5/01/27 | B+ | 171,011 | |||||||||||||||||||||||||
| Total Ghana |
523,888 | |||||||||||||||||||||||||||||
| Guatemala – 0.1% | ||||||||||||||||||||||||||||||
| 200 | CT Trust, 144A |
|
5.125% | 2/03/32 | Ba1 | 160,519 | ||||||||||||||||||||||||
| 200 | Guatemala Government Bond, 144A |
|
3.700% | 10/07/33 | BB | 161,001 | ||||||||||||||||||||||||
| 180 | Millicom International Cellular SA, 144A 2029 2029 |
|
6.250% | 3/25/29 | BB+ | 161,399 | ||||||||||||||||||||||||
| Total Guatemala |
482,919 | |||||||||||||||||||||||||||||
| Honduras – 0.0% | ||||||||||||||||||||||||||||||
| — | (12) | Honduras Government International Bond, Reg S |
|
7.500% | 3/15/24 | BB- | 7 | |||||||||||||||||||||||
| Total Honduras |
7 | |||||||||||||||||||||||||||||
| Hungary – 0.1% | ||||||||||||||||||||||||||||||
| 29,000 | HUF | Hungary Government Bond |
|
2.000% | 5/23/29 | BBB | 64,424 | |||||||||||||||||||||||
| 200 | Hungary Government International Bond, 144A |
|
5.250% | 6/16/29 | Baa2 | 194,245 | ||||||||||||||||||||||||
| 200 | Magyar Export-Import Bank Zrt, 144A |
6.125% | 12/04/27 | BBB | 198,001 | |||||||||||||||||||||||||
| Total Hungary |
456,670 | |||||||||||||||||||||||||||||
| India – 0.3% | ||||||||||||||||||||||||||||||
| 200 | Adani Ports & Special Economic Zone Ltd, 144A |
|
3.100% | 2/02/31 | BBB- | 139,924 | ||||||||||||||||||||||||
| 200 | Export-Import Bank of India , 144A |
|
2.250% | 1/13/31 | BBB- | 160,853 | ||||||||||||||||||||||||
| 200 | Indian Railway Finance Corp Ltd, 144A |
|
3.570% | 1/21/32 | BBB- | 174,112 | ||||||||||||||||||||||||
| 200 | Network i2i Ltd, 144A |
|
3.975% | 6/03/72 | BB | 178,500 | ||||||||||||||||||||||||
| 200 | Power Finance Corp Ltd, 144A |
|
3.950% | 4/23/30 | Baa3 | 177,410 | ||||||||||||||||||||||||
| 200 | ReNew Wind Energy AP2 / ReNew Power Pvt Ltd other 9 Subsidiaries, 144A |
|
4.500% | 7/14/28 | Ba3 | 170,553 | ||||||||||||||||||||||||
| 200 | UltraTech Cement Ltd, 144A |
2.800% | 2/16/31 | Baa3 | 164,229 | |||||||||||||||||||||||||
| Total India |
1,165,581 | |||||||||||||||||||||||||||||
| Indonesia – 0.3% | ||||||||||||||||||||||||||||||
| 200 | Freeport Indonesia PT, 144A |
|
6.200% | 4/14/52 | Baa3 | 180,272 | ||||||||||||||||||||||||
| 850,000 | IDR | Indonesia Treasury Bond |
|
7.000% | 9/15/30 | N/R | 58,940 | |||||||||||||||||||||||
| 500 | Pertamina Persero PT, 144A |
|
2.300% | 2/09/31 | Baa2 | 405,637 | ||||||||||||||||||||||||
| 200 | Perusahaan Penerbit SBSN Indonesia III, 144A |
|
4.700% | 6/06/32 | BBB | 198,242 | ||||||||||||||||||||||||
| 335 | Perusahaan Perseroan Persero PT Perusahaan Listrik Negara, Reg S |
|
3.875% | 7/17/29 | BBB | 307,664 | ||||||||||||||||||||||||
| 200 | Perusahaan Perseroan Persero PT Perusahaan Listrik Negara, Reg S |
|
5.250% | 5/15/47 | Baa2 | 174,968 | ||||||||||||||||||||||||
| 200 | Saka Energi Indonesia PT, 144A |
4.450% | 5/05/24 | B+ | 195,000 | |||||||||||||||||||||||||
| Total Indonesia |
1,520,723 | |||||||||||||||||||||||||||||
| Iraq – 0.1% | ||||||||||||||||||||||||||||||
| 250 | Iraq International Bond, 144A |
5.800% | 1/15/28 | N/R | 229,455 | |||||||||||||||||||||||||
| Total Iraq |
229,455 | |||||||||||||||||||||||||||||
| Israel – 0.2% | ||||||||||||||||||||||||||||||
| 200 | Bank Leumi Le-Israel BM, 144A, Reg S |
|
5.125% | 7/27/27 | A | 198,108 | ||||||||||||||||||||||||
| 80 | Energean Israel Finance Ltd, 144A, Reg S |
|
4.875% | 3/30/26 | BB- | 74,237 | ||||||||||||||||||||||||
| 85 | Energean Israel Finance Ltd, 144A, Reg S |
|
4.500% | 3/30/24 | BB- | 83,980 | ||||||||||||||||||||||||
| 200 | Israel Electric Corp Ltd, 144A, Reg S |
|
4.250% | 8/14/28 | BBB+ | 186,102 | ||||||||||||||||||||||||
| 75 | Leviathan Bond Ltd, 144A, Reg S |
|
6.750% | 6/30/30 | BB | 69,831 | ||||||||||||||||||||||||
| 32 | Leviathan Bond Ltd, 144A, Reg S |
|
6.125% | 6/30/25 | BB | 31,171 | ||||||||||||||||||||||||
| 127 | Leviathan Bond Ltd, 144A, Reg S |
|
6.500% | 6/30/27 | BB | 121,767 | ||||||||||||||||||||||||
| 175 | EUR | Teva Pharmaceutical Finance Netherlands II BV |
4.375% | 5/09/30 | Ba2 | 162,549 | ||||||||||||||||||||||||
| Total Israel |
927,745 | |||||||||||||||||||||||||||||
| Jamaica – 0.1% | ||||||||||||||||||||||||||||||
| 215 | Jamaica Government International Bond |
|
8.000% | 3/15/39 | B+ | 256,072 | ||||||||||||||||||||||||
| 215 | Jamaica Government International Bond |
7.875% | 7/28/45 | B+ | 247,573 | |||||||||||||||||||||||||
| Total Jamaica |
503,645 | |||||||||||||||||||||||||||||
36
| Principal Amount (000) |
(14) |
Description (1) | Coupon | Maturity | Ratings (6) | Value | ||||||||||||||||||||||||
| Jordan – 0.1% | ||||||||||||||||||||||||||||||
| $ 200 | Jordan Government International Bond, 144A |
|
4.950% | 7/07/25 | BB- | $ | 193,532 | |||||||||||||||||||||||
| 200 | Jordan Government International Bond, 144A |
5.850% | 7/07/30 | BB- | 183,000 | |||||||||||||||||||||||||
| Total Jordan |
376,532 | |||||||||||||||||||||||||||||
| Kazakhstan – 0.2% | ||||||||||||||||||||||||||||||
| 200 | Development Bank of Kazakhstan JSC, 144A |
|
5.750% | 5/12/25 | Baa2 | 201,332 | ||||||||||||||||||||||||
| 200 | Kazakhstan Government International Bond, 144A |
|
6.500% | 7/21/45 | Baa2 | 210,669 | ||||||||||||||||||||||||
| 200 | KazMunayGas National Co JSC, 144A |
|
3.500% | 4/14/33 | Baa2 | 154,500 | ||||||||||||||||||||||||
| 200 | KazMunayGas National Co JSC, 144A |
|
5.375% | 4/24/30 | Baa2 | 185,502 | ||||||||||||||||||||||||
| 200 | Tengizchevroil Finance Co International Ltd, 144A |
|
4.000% | 8/15/26 | Baa2 | 181,500 | ||||||||||||||||||||||||
| Total Kazakhstan |
933,503 | |||||||||||||||||||||||||||||
| Kenya – 0.1% | ||||||||||||||||||||||||||||||
| 200 | Republic of Kenya Government International Bond, 144A |
|
7.250% | 2/28/28 | B | 173,003 | ||||||||||||||||||||||||
| 200 | Republic of Kenya Government International Bond, 144A |
|
6.300% | 1/23/34 | B | 150,565 | ||||||||||||||||||||||||
| Total Kenya |
323,568 | |||||||||||||||||||||||||||||
| Korea, Republic of – 0.1% | ||||||||||||||||||||||||||||||
| 200 | POSCO, 144A |
|
4.500% | 8/04/27 | A- | 193,825 | ||||||||||||||||||||||||
| 200 | Shinhan Bank Co Ltd, 144A |
4.375% | 4/13/32 | BBB+ | 181,415 | |||||||||||||||||||||||||
| Total Korea, Republic of |
375,240 | |||||||||||||||||||||||||||||
| Macau – 0.0% | ||||||||||||||||||||||||||||||
| 200 | Sands China Ltd |
5.625% | 8/08/25 | Baa2 | 195,123 | |||||||||||||||||||||||||
| Total Macau |
195,123 | |||||||||||||||||||||||||||||
| Malaysia – 0.1% | ||||||||||||||||||||||||||||||
| 600 | MYR | Malaysia Government Bond |
3.900% | 11/30/26 | A3 | 129,973 | ||||||||||||||||||||||||
| 215 | MISC Capital Two Labuan Ltd, 144A |
3.750% | 4/06/27 | BBB | 201,206 | |||||||||||||||||||||||||
| 205 | Petronas Capital Ltd, 144A |
3.404% | 4/28/61 | A2 | 145,744 | |||||||||||||||||||||||||
| 200 | Petronas Capital Ltd, 144A |
3.500% | 4/21/30 | A2 | 184,420 | |||||||||||||||||||||||||
| Total Malaysia |
661,343 | |||||||||||||||||||||||||||||
| Mexico – 0.7% | ||||||||||||||||||||||||||||||
| 200 | Banco Nacional de Comercio Exterior SNC/Cayman Islands, 144A |
|
4.375% | 10/14/25 | BBB | 194,750 | ||||||||||||||||||||||||
| 200 | Banco Nacional de Comercio Exterior SNC/Cayman Islands, 144A |
|
2.720% | 8/11/31 | Ba1 | 167,750 | ||||||||||||||||||||||||
| 200 | Braskem Idesa SAPI, 144A |
6.990% | 2/20/32 | BB- | 129,557 | |||||||||||||||||||||||||
| 200 | Cemex SAB de CV, 144A |
3.875% | 7/11/31 | BB+ | 168,381 | |||||||||||||||||||||||||
| 230 | Comision Federal de Electricidad, 144A |
3.348% | 2/09/31 | BBB | 181,222 | |||||||||||||||||||||||||
| 200 | Comision Federal de Electricidad, 144A |
6.125% | 6/16/45 | BBB | 173,500 | |||||||||||||||||||||||||
| 200 | Comision Federal de Electricidad, 144A |
4.688% | 5/15/29 | BBB | 179,572 | |||||||||||||||||||||||||
| 200 | Electricidad Firme de Mexico Holdings SA de CV, 144A |
|
4.900% | 11/20/26 | Ba2 | 175,750 | ||||||||||||||||||||||||
| 200 | Grupo Aeromexico SAB de CV, 144A |
8.500% | 3/17/27 | B | 178,984 | |||||||||||||||||||||||||
| 2,350 | MXN | Mexican Bonos |
7.500% | 6/03/27 | BBB+ | 130,549 | ||||||||||||||||||||||||
| 3,600 | MXN | Mexican Bonos |
8.500% | 11/18/38 | BBB+ | 204,845 | ||||||||||||||||||||||||
| 300 | Mexico Government International Bond |
4.400% | 2/12/52 | BBB | 236,153 | |||||||||||||||||||||||||
| 200 | Mexico Government International Bond |
4.280% | 8/14/41 | BBB | 164,533 | |||||||||||||||||||||||||
| 200 | Nemak SAB de CV , 144A |
3.625% | 6/28/31 | BBB- | 156,008 | |||||||||||||||||||||||||
| 412 | Petroleos Mexicanos |
6.750% | 9/21/47 | BBB | 258,704 | |||||||||||||||||||||||||
| 545 | Petroleos Mexicanos |
6.840% | 1/23/30 | BBB | 433,385 | |||||||||||||||||||||||||
| 245 | Petroleos Mexicanos |
5.950% | 1/28/31 | BBB | 178,985 | |||||||||||||||||||||||||
| 140 | Petroleos Mexicanos |
6.375% | 1/23/45 | BBB | 85,988 | |||||||||||||||||||||||||
| 25 | Petroleos Mexicanos |
6.500% | 1/23/29 | BBB | 20,726 | |||||||||||||||||||||||||
| Total Mexico |
3,419,342 | |||||||||||||||||||||||||||||
| Mongolia – 0.1% | ||||||||||||||||||||||||||||||
| 300 | Mongolia Government International Bond, 144A |
|
5.125% | 4/07/26 | B | 278,393 | ||||||||||||||||||||||||
| Total Mongolia |
278,393 | |||||||||||||||||||||||||||||
37
| NMAI | Nuveen Multi-Asset Income Fund (continued) | |
| Portfolio of Investments June 30, 2023 | ||
| (Unaudited) | ||
| Principal Amount (000) |
(14) |
Description (1) | Coupon | Maturity | Ratings (6) | Value | ||||||||||||||||||||||||
| Morocco – 0.2% | ||||||||||||||||||||||||||||||
| $ 200 | Morocco Government International Bond, 144A |
5.950% | 3/08/28 | BB+ | $ | 201,650 | ||||||||||||||||||||||||
| 200 | Morocco Government International Bond, 144A |
5.500% | 12/11/42 | BB+ | 172,000 | |||||||||||||||||||||||||
| 200 | OCP SA, 144A |
3.750% | 6/23/31 | BB+ | 165,024 | |||||||||||||||||||||||||
| 200 | OCP SA, 144A |
5.125% | 6/23/51 | BB+ | 145,104 | |||||||||||||||||||||||||
| Total Morocco |
683,778 | |||||||||||||||||||||||||||||
| Namibia – 0.0% | ||||||||||||||||||||||||||||||
| 200 | Namibia International Bonds, 144A |
5.250% | 10/29/25 | B1 | 189,754 | |||||||||||||||||||||||||
| Total Namibia |
189,754 | |||||||||||||||||||||||||||||
| Netherlands – 0.1% | ||||||||||||||||||||||||||||||
| 185 | Aegon NV |
5.500% | 4/11/48 | Baa1 | 175,741 | |||||||||||||||||||||||||
| 200 | VEON Holdings BV, Reg S |
4.000% | 4/09/25 | N/R | 167,000 | |||||||||||||||||||||||||
| Total Netherlands |
342,741 | |||||||||||||||||||||||||||||
| Nigeria – 0.2% | ||||||||||||||||||||||||||||||
| 200 | Access Bank PLC , 144A |
6.125% | 9/21/26 | B- | 167,820 | |||||||||||||||||||||||||
| 400 | Nigeria Government International Bond, 144A |
8.375% | 3/24/29 | B- | 359,500 | |||||||||||||||||||||||||
| 200 | Nigeria Government International Bond, 144A |
7.375% | 9/28/33 | B- | 157,214 | |||||||||||||||||||||||||
| 200 | Nigeria Government International Bond, Reg S |
7.625% | 11/28/47 | B- | 141,904 | |||||||||||||||||||||||||
| Total Nigeria |
826,438 | |||||||||||||||||||||||||||||
| Oman – 0.2% | ||||||||||||||||||||||||||||||
| 385 | Oman Government International Bond, Reg S |
5.625% | 1/17/28 | Ba2 | 380,511 | |||||||||||||||||||||||||
| 200 | Oman Government International Bond, 144A |
6.250% | 1/25/31 | Ba2 | 202,648 | |||||||||||||||||||||||||
| 200 | Oman Government International Bond, Reg S |
6.750% | 1/17/48 | Ba2 | 191,829 | |||||||||||||||||||||||||
| 200 | OQ SAOC, 144A |
5.125% | 5/06/28 | BB | 189,373 | |||||||||||||||||||||||||
| Total Oman |
|
964,361 | ||||||||||||||||||||||||||||
| Pakistan – 0.1% | ||||||||||||||||||||||||||||||
| 515 | Pakistan Government International Bond , Reg S |
|
6.875% | 12/05/27 | CCC+ | 243,708 | ||||||||||||||||||||||||
| 200 | Pakistan Government International Bond , 144A |
6.000% | 4/08/26 | Caa3 | 96,750 | |||||||||||||||||||||||||
| 200 | Pakistan Water & Power Development Authority , Reg S |
|
7.500% | 6/04/31 | CCC+ | 84,591 | ||||||||||||||||||||||||
| Total Pakistan |
|
425,049 | ||||||||||||||||||||||||||||
| Panama – 0.2% | ||||||||||||||||||||||||||||||
| 200 | Aeropuerto Internacional de Tocumen SA , 144A |
|
5.125% | 8/11/61 | BBB | 153,500 | ||||||||||||||||||||||||
| 200 | C&W Senior Financing DAC , 144A |
6.875% | 9/15/27 | BB- | 174,500 | |||||||||||||||||||||||||
| 190 | Panama Bonos del Tesoro |
3.362% | 6/30/31 | BBB | 162,355 | |||||||||||||||||||||||||
| 155 | Panama Notas del Tesoro |
3.750% | 4/17/26 | BBB | 151,837 | |||||||||||||||||||||||||
| 182 | UEP Penonome II SA , 144A 2020 1 |
6.500% | 10/01/38 | BB | 136,067 | |||||||||||||||||||||||||
| Total Panama |
|
778,259 | ||||||||||||||||||||||||||||
| Paraguay – 0.0% | ||||||||||||||||||||||||||||||
| 200 | Paraguay Government International Bond , 144A |
|
2.739% | 1/29/33 | Ba1 | 159,177 | ||||||||||||||||||||||||
| Total Paraguay |
|
159,177 | ||||||||||||||||||||||||||||
| Peru – 0.2% | ||||||||||||||||||||||||||||||
| 65 | Banco de Credito del Peru S.A , 144A |
3.250% | 9/30/31 | BBB- | 57,231 | |||||||||||||||||||||||||
| 120 | Banco de Credito del Peru S.A , 144A |
3.125% | 7/01/30 | BBB- | 110,154 | |||||||||||||||||||||||||
| 300 | Fondo MIVIVIENDA SA , 144A |
4.625% | 4/12/27 | Baa1 | 289,138 | |||||||||||||||||||||||||
| 200 | Kallpa Generacion SA , Reg S |
4.875% | 5/24/26 | Baa3 | 192,500 | |||||||||||||||||||||||||
| 300 | PEN | Peru Government Bond |
5.400% | 8/12/34 | BBB+ | 72,941 | ||||||||||||||||||||||||
| 200 | Peruvian Government International Bond |
3.000% | 1/15/34 | Baa1 | 166,000 | |||||||||||||||||||||||||
| 250 | PEN | Peruvian Government International Bond , 144A |
5.400% | 8/12/34 | BBB+ | 60,784 | ||||||||||||||||||||||||
| 95 | Volcan Cia Minera SAA , 144A |
4.375% | 2/11/26 | B+ | 70,651 | |||||||||||||||||||||||||
| Total Peru |
|
1,019,399 | ||||||||||||||||||||||||||||
38
| Principal Amount (000) |
(14) |
Description (1) | Coupon | Maturity | Ratings (6) | Value | ||||||||||||||||||||||||
| Philippines – 0.0% | ||||||||||||||||||||||||||||||
| $ 200 | Philippine Government International Bond |
4.200% | 3/29/47 | BBB+ | $ | 171,859 | ||||||||||||||||||||||||
| Total Philippines |
171,859 | |||||||||||||||||||||||||||||
| Poland – 0.1% | ||||||||||||||||||||||||||||||
| 200 | Bank Gospodarstwa Krajowego , 144A |
5.375% | 5/22/33 | A2 | 198,810 | |||||||||||||||||||||||||
| 300 | PLN | Republic of Poland Government Bond |
2.750% | 10/25/29 | A | 62,802 | ||||||||||||||||||||||||
| 370 | PLN | Republic of Poland Government Bond |
0.250% | 10/25/26 | A2 | 76,360 | ||||||||||||||||||||||||
| 192 | Republic of Poland Government International Bond |
|
5.500% | 4/04/53 | A2 | 193,076 | ||||||||||||||||||||||||
| Total Poland |
531,048 | |||||||||||||||||||||||||||||
| Qatar – 0.1% | ||||||||||||||||||||||||||||||
| 200 | Qatar Government International Bond , Reg S |
4.400% | 4/16/50 | AA | 181,828 | |||||||||||||||||||||||||
| 310 | QatarEnergy , 144A |
3.300% | 7/12/51 | AA | 227,590 | |||||||||||||||||||||||||
| 200 | QNB Finance Ltd , Reg S |
2.625% | 5/12/25 | Aa3 | 189,547 | |||||||||||||||||||||||||
| Total Qatar |
|
598,965 | ||||||||||||||||||||||||||||
| Republic of Serbia – 0.0% | ||||||||||||||||||||||||||||||
| 200 | Serbia International Bond , 144A |
6.500% | 9/26/33 | BB+ | 196,018 | |||||||||||||||||||||||||
| Total Republic of Serbia |
|
196,018 | ||||||||||||||||||||||||||||
| Romania – 0.1% | ||||||||||||||||||||||||||||||
| 550 | RON | Romania Government Bond |
3.650% | 9/24/31 | BBB- | 97,597 | ||||||||||||||||||||||||
| 200 | RON | Romania Government Bond |
4.150% | 1/26/28 | BBB- | 39,571 | ||||||||||||||||||||||||
| 140 | Romanian Government International Bond, 144A |
|
3.000% | 2/27/27 | BBB- | 126,700 | ||||||||||||||||||||||||
| Total Romania |
|
263,868 | ||||||||||||||||||||||||||||
| Rwanda – 0.1% | ||||||||||||||||||||||||||||||
| 300 | Rwanda International Government Bond, 144A |
|
5.500% | 8/09/31 | B+ | 225,773 | ||||||||||||||||||||||||
| Total Rwanda |
|
225,773 | ||||||||||||||||||||||||||||
| Saudi Arabia – 0.2% | ||||||||||||||||||||||||||||||
| 200 | EIG Pearl Holdings Sarl, 144A | 4.387% | 11/30/46 | A1 | 156,520 | |||||||||||||||||||||||||
| 200 | Saudi Arabian Oil Co , Reg S |
4.250% | 4/16/39 | A+ | 175,858 | |||||||||||||||||||||||||
| 385 | Saudi Government International Bond, Reg S |
3.750% | 1/21/55 | A1 | 290,536 | |||||||||||||||||||||||||
| 325 | Saudi Government International Bond, 144A |
2.250% | 2/02/33 | A1 | 261,541 | |||||||||||||||||||||||||
| Total Saudi Arabia |
|
884,455 | ||||||||||||||||||||||||||||
| Senegal – 0.1% | ||||||||||||||||||||||||||||||
| 215 | Senegal Government International Bond, Reg S |
6.750% | 3/13/48 | Ba3 | 153,414 | |||||||||||||||||||||||||
| 200 | Senegal Government International Bond, 144A |
|
6.750% | 3/13/48 | Ba3 | 142,718 | ||||||||||||||||||||||||
| 100 | EUR | Senegal Government International Bond, 144A |
|
5.375% | 6/08/37 | Ba3 | 72,864 | |||||||||||||||||||||||
| Total Senegal |
|
368,996 | ||||||||||||||||||||||||||||
| South Africa – 0.5% | ||||||||||||||||||||||||||||||
| 500 | Eskom Holdings SOC Ltd, 144A |
6.750% | 8/06/23 | CCC+ | 497,500 | |||||||||||||||||||||||||
| 200 | Eskom Holdings SOC Ltd, 144A |
6.350% | 8/10/28 | Ba2 | 186,016 | |||||||||||||||||||||||||
| 200 | MTN Mauritius Investments Ltd, 144A |
6.500% | 10/13/26 | Ba2 | 196,840 | |||||||||||||||||||||||||
| 2,875 | ZAR | Republic of South Africa Government Bond |
|
8.875% | 2/28/35 | BB | 124,952 | |||||||||||||||||||||||
| 3,075 | ZAR | Republic of South Africa Government Bond |
|
7.000% | 2/28/31 | BB | 130,687 | |||||||||||||||||||||||
| 225 | Republic of South Africa Government International Bond |
|
5.875% | 4/20/32 | Ba2 | 199,013 | ||||||||||||||||||||||||
| 200 | Republic of South Africa Government International Bond |
|
5.375% | 7/24/44 | Ba2 | 141,892 | ||||||||||||||||||||||||
| 200 | Republic of South Africa Government International Bond |
|
5.650% | 9/27/47 | Ba2 | 141,111 | ||||||||||||||||||||||||
| 200 | Sasol Financing USA LLC, 144A |
8.750% | 5/03/29 | BB+ | 194,828 | |||||||||||||||||||||||||
| 250 | Transnet SOC Ltd, 144A |
8.250% | 2/06/28 | BB- | 242,812 | |||||||||||||||||||||||||
| Total South Africa |
|
2,055,651 | ||||||||||||||||||||||||||||
| Sri Lanka – 0.0% | ||||||||||||||||||||||||||||||
| 415 | Sri Lanka Government International Bond, Reg S |
|
6.850% | 11/03/25 | Ca | 194,645 | ||||||||||||||||||||||||
| Total Sri Lanka |
|
194,645 | ||||||||||||||||||||||||||||
39
| NMAI | Nuveen Multi-Asset Income Fund (continued) | |
| Portfolio of Investments June 30, 2023 | ||
| (Unaudited) | ||
| Principal Amount (000) |
(14) |
Description (1) | Coupon | Maturity | Ratings (6) | Value | ||||||||||||||||||||||||
| Supranational – 0.1% | ||||||||||||||||||||||||||||||
| $ 5,000 | INR | Asian Development Bank | 6.150% | 2/25/30 | AAA | $ | 58,760 | |||||||||||||||||||||||
| 200 | Banque Ouest Africaine de Developement , 144A |
|
4.700% | 10/22/31 | Baa1 | 162,318 | ||||||||||||||||||||||||
| Total Supranational |
|
221,078 | ||||||||||||||||||||||||||||
| Thailand – 0.1% | ||||||||||||||||||||||||||||||
| 200 | Bangkok Bank PCL/Hong Kong, 144A |
|
3.466% | 9/23/36 | Baa3 | 162,774 | ||||||||||||||||||||||||
| 6,150 | THB | Thailand Government Bond |
2.875% | 12/17/28 | N/R | 177,760 | ||||||||||||||||||||||||
| Total Thailand |
|
340,534 | ||||||||||||||||||||||||||||
| Turkey – 0.2% | ||||||||||||||||||||||||||||||
| 200 | Anadolu Efes Biracilik Ve Malt Sanayii AS, 144A |
3.375% | 6/29/28 | BB+ | 161,096 | |||||||||||||||||||||||||
| 245 | Turkey Government International Bond |
5.125% | 2/17/28 | B | 212,464 | |||||||||||||||||||||||||
| 250 | Turkey Government International Bond |
6.000% | 1/14/41 | B | 183,557 | |||||||||||||||||||||||||
| 200 | Turkiye Ihracat Kredi Bankasi AS, 144A |
6.125% | 5/03/24 | B3 | 194,514 | |||||||||||||||||||||||||
| 200 | Turkiye Ihracat Kredi Bankasi AS, 144A |
5.750% | 7/06/26 | B3 | 180,425 | |||||||||||||||||||||||||
| 200 | Turkiye Sise ve Cam Fabrikalari AS, 144A |
6.950% | 3/14/26 | B | 194,000 | |||||||||||||||||||||||||
| Total Turkey |
|
1,126,056 | ||||||||||||||||||||||||||||
| Uganda – 0.0% | ||||||||||||||||||||||||||||||
| 669,000 | UGX | Republic of Uganda Government Bonds |
|
14.250% | 8/23/29 | N/R | 181,082 | |||||||||||||||||||||||
| Total Uganda |
|
181,082 | ||||||||||||||||||||||||||||
| Ukraine – 0.1% | ||||||||||||||||||||||||||||||
| 200 | NAK Naftogaz Ukraine via Kondor Finance PLC, Reg S (11) |
|
7.375% | 7/19/24 | N/R | 113,000 | ||||||||||||||||||||||||
| 100 | Ukraine Government International Bond, Reg S |
7.750% | 9/01/28 | CCC | 23,720 | |||||||||||||||||||||||||
| 115 | Ukraine Government International Bond, Reg S |
7.750% | 9/01/24 | CCC | 28,492 | |||||||||||||||||||||||||
| 360 | Ukraine Government International Bond, 144A |
7.253% | 3/15/35 | CCC | 82,800 | |||||||||||||||||||||||||
| 425 | Ukraine Government International Bond, 144A |
6.876% | 5/21/31 | CCC | 95,625 | |||||||||||||||||||||||||
| Total Ukraine |
|
343,637 | ||||||||||||||||||||||||||||
| United Arab Emirates – 0.3% | ||||||||||||||||||||||||||||||
| 200 | DAE Funding LLC, 144A |
3.375% | 3/20/28 | Baa3 | 179,704 | |||||||||||||||||||||||||
| 400 | Emirate of Dubai Government International Bonds, Reg S |
|
3.900% | 9/09/50 | N/R | 288,815 | ||||||||||||||||||||||||
| 435 | Galaxy Pipeline Assets Bidco Ltd, 144A |
2.625% | 3/31/36 | Aa2 | 350,726 | |||||||||||||||||||||||||
| 228 | Galaxy Pipeline Assets Bidco Ltd, 144A 2022 2022 |
|
2.940% | 9/30/40 | Aa2 | 182,713 | ||||||||||||||||||||||||
| 240 | MDGH GMTN RSC Ltd, 144A |
4.375% | 11/22/33 | Aa2 | 230,988 | |||||||||||||||||||||||||
| 195 | Sweihan PV Power Co PJSC, 144A 2022 1 |
3.625% | 1/31/49 | BBB+ | 156,782 | |||||||||||||||||||||||||
| Total United Arab Emirates |
|
1,389,728 | ||||||||||||||||||||||||||||
| United Kingdom – 0.0% | ||||||||||||||||||||||||||||||
| 190 | Vodafone Group PLC |
|
4.125% | 6/04/81 | BB+ | 150,765 | ||||||||||||||||||||||||
| Total United Kingdom |
|
150,765 | ||||||||||||||||||||||||||||
| Uruguay – 0.1% | ||||||||||||||||||||||||||||||
| 80 | Uruguay Government International Bond |
|
4.375% | 1/23/31 | BBB+ | 78,808 | ||||||||||||||||||||||||
| 6,200 | UYU | Uruguay Government International Bond |
|
8.250% | 5/21/31 | BBB+ | 151,758 | |||||||||||||||||||||||
| Total Uruguay |
|
230,566 | ||||||||||||||||||||||||||||
| Uzbekistan – 0.0% | ||||||||||||||||||||||||||||||
| 200 | Republic of Uzbekistan International Bond, Reg S |
|
4.750% | 2/20/24 | BB- | 197,760 | ||||||||||||||||||||||||
| Total Uzbekistan |
|
197,760 | ||||||||||||||||||||||||||||
| Zambia – 0.1% | ||||||||||||||||||||||||||||||
| 425 | Zambia Government International Bond, 144A |
|
8.500% | 4/14/24 | D | 244,945 | ||||||||||||||||||||||||
| Total Zambia |
|
244,945 | ||||||||||||||||||||||||||||
| Total Emerging Market Debt And Foreign Corporate Bonds (cost $50,299,234) |
|
41,598,360 | ||||||||||||||||||||||||||||
40
| Principal Amount (000) |
Description (1) | Coupon | Maturity | Ratings (6) | Value | |||||||||||||||||||||||||
| $1,000 PAR (OR SIMILAR) INSTITUTIONAL PREFERRED – 9.1% (6.2% of Total Investments) | ||||||||||||||||||||||||||||||
| Automobiles – 0.3% | ||||||||||||||||||||||||||||||
| $ 1,190 | General Motors Financial Co Inc (3) |
|
5.750% | N/A (15) | BB+ | $ | 968,362 | |||||||||||||||||||||||
| 527 | General Motors Financial Co Inc |
|
5.700% | N/A (15) | BB+ | 462,624 | ||||||||||||||||||||||||
| Total Automobiles |
|
1,430,986 | ||||||||||||||||||||||||||||
| Banks – 3.8% | ||||||||||||||||||||||||||||||
| 75 | Bank of America Corp |
6.100% | N/A (15) | BBB+ | 74,363 | |||||||||||||||||||||||||
| 295 | Bank of America Corp |
4.375% | N/A (15) | BBB+ | 251,561 | |||||||||||||||||||||||||
| 1,090 | Bank of America Corp (3) |
6.500% | N/A (15) | BBB+ | 1,086,970 | |||||||||||||||||||||||||
| 285 | Bank of America Corp |
6.250% | N/A (15) | BBB+ | 281,438 | |||||||||||||||||||||||||
| 170 | Citigroup Inc |
5.000% | N/A (15) | BBB- | 158,685 | |||||||||||||||||||||||||
| 1,190 | Citigroup Inc (3) |
6.250% | N/A (15) | BBB- | 1,170,996 | |||||||||||||||||||||||||
| 1,000 | Citigroup Inc (3) |
6.300% | N/A (15) | BBB- | 972,500 | |||||||||||||||||||||||||
| 1,000 | Citigroup Inc (3) |
5.950% | N/A (15) | BBB- | 959,028 | |||||||||||||||||||||||||
| 260 | Citigroup Inc |
7.375% | N/A (15) | BBB- | 258,090 | |||||||||||||||||||||||||
| 335 | Citizens Financial Group Inc |
4.000% | N/A (15) | Baa3 | 250,823 | |||||||||||||||||||||||||
| 260 | Citizens Financial Group Inc |
6.375% | N/A (15) | Baa3 | 223,600 | |||||||||||||||||||||||||
| 325 | CoBank ACB |
6.250% | N/A (15) | BBB+ | 304,561 | |||||||||||||||||||||||||
| 765 | CoBank ACB |
6.450% | N/A (15) | BBB+ | 707,625 | |||||||||||||||||||||||||
| 550 | First Citizens BancShares Inc/NC (3-Month LIBOR reference rate + 3.972% spread) (7) |
|
9.524% | N/A (15) | Ba1 | 527,845 | ||||||||||||||||||||||||
| 610 | Huntington Bancshares Inc/OH |
5.625% | N/A (15) | Baa3 | 545,103 | |||||||||||||||||||||||||
| 345 | JPMorgan Chase & Co |
3.650% | N/A (15) | BBB+ | 303,652 | |||||||||||||||||||||||||
| 375 | JPMorgan Chase & Co |
5.000% | N/A (15) | BBB+ | 366,328 | |||||||||||||||||||||||||
| 270 | JPMorgan Chase & Co |
6.100% | N/A (15) | BBB+ | 269,379 | |||||||||||||||||||||||||
| 1,600 | JPMorgan Chase & Co (3) |
6.750% | N/A (15) | BBB+ | 1,604,160 | |||||||||||||||||||||||||
| 235 | M&T Bank Corp |
5.125% | N/A (15) | Baa2 | 185,499 | |||||||||||||||||||||||||
| 380 | M&T Bank Corp |
6.450% | N/A (15) | Baa2 | 352,597 | |||||||||||||||||||||||||
| 325 | PNC Financial Services Group Inc/The |
6.000% | N/A (15) | Baa2 | 292,500 | |||||||||||||||||||||||||
| 100 | PNC Financial Services Group Inc/The (3-Month LIBOR reference rate + 3.040% |
|
8.536% | N/A (15) | BBB- | 99,112 | ||||||||||||||||||||||||
| 775 | PNC Financial Services Group Inc/The |
6.250% | N/A (15) | Baa2 | 695,756 | |||||||||||||||||||||||||
| 415 | PNC Financial Services Group Inc/The |
3.400% | N/A (15) | Baa2 | 306,063 | |||||||||||||||||||||||||
| 448 | PNC Financial Services Group Inc/The |
5.000% | N/A (15) | Baa2 | 385,142 | |||||||||||||||||||||||||
| 625 | Regions Financial Corp |
5.750% | N/A (15) | Baa3 | 591,593 | |||||||||||||||||||||||||
| 295 | Truist Financial Corp |
5.100% | N/A (15) | Baa2 | 255,175 | |||||||||||||||||||||||||
| 1,035 | Truist Financial Corp (3-Month LIBOR reference rate + 3.102% spread) (7) |
|
8.654% | N/A (15) | Baa2 | 1,014,341 | ||||||||||||||||||||||||
| 400 | Truist Financial Corp |
4.800% | N/A (15) | Baa2 | 341,000 | |||||||||||||||||||||||||
| 500 | Wells Fargo & Co |
3.900% | N/A (15) | Baa2 | 440,200 | |||||||||||||||||||||||||
| 600 | Wells Fargo & Co |
5.900% | N/A (15) | Baa2 | 591,750 | |||||||||||||||||||||||||
| 1,280 | Wells Fargo & Co (3) |
5.875% | N/A (15) | Baa2 | 1,254,270 | |||||||||||||||||||||||||
| 450 | Zions Bancorp NA |
|
7.200% | N/A (15) | BB+ | 377,445 | ||||||||||||||||||||||||
| Total Banks |
17,499,150 | |||||||||||||||||||||||||||||
| Capital Markets – 0.5% | ||||||||||||||||||||||||||||||
| 395 | Bank of New York Mellon Corp/The |
4.700% | N/A (15) | Baa1 | 383,643 | |||||||||||||||||||||||||
| 615 | Charles Schwab Corp/The |
5.375% | N/A (15) | Baa2 | 587,768 | |||||||||||||||||||||||||
| 710 | Goldman Sachs Group Inc/The |
5.500% | N/A (15) | BBB- | 691,313 | |||||||||||||||||||||||||
| 650 | Goldman Sachs Group Inc/The |
|
5.300% | N/A (15) | BBB- | 627,250 | ||||||||||||||||||||||||
| Total Capital Markets |
2,289,974 | |||||||||||||||||||||||||||||
| Construction Materials – 0.1% | ||||||||||||||||||||||||||||||
| 200 | Cemex SAB de CV, 144A |
|
9.125% | N/A (15) | BB- | 202,549 | ||||||||||||||||||||||||
| Total Construction Materials |
202,549 | |||||||||||||||||||||||||||||
| Consumer Finance – 0.4% | ||||||||||||||||||||||||||||||
| 459 | Ally Financial Inc |
4.700% | N/A (15) | Ba2 | 324,018 | |||||||||||||||||||||||||
| 400 | Ally Financial Inc |
4.700% | N/A (15) | Ba2 | 258,000 | |||||||||||||||||||||||||
| 455 | American Express Co |
3.550% | N/A (15) | Baa2 | 377,650 | |||||||||||||||||||||||||
| 295 | Capital One Financial Corp |
3.950% | N/A (15) | Baa3 | 219,037 | |||||||||||||||||||||||||
| 130 | Discover Financial Services |
5.500% | N/A (15) | Ba1 | 98,647 | |||||||||||||||||||||||||
| 305 | Discover Financial Services |
|
6.125% | N/A (15) | Ba1 | 290,646 | ||||||||||||||||||||||||
| Total Consumer Finance |
1,567,998 | |||||||||||||||||||||||||||||
41
| NMAI | Nuveen Multi-Asset Income Fund (continued) | |
| Portfolio of Investments June 30, 2023 | ||
| (Unaudited) | ||
| Principal Amount (000) |
Description (1) | Coupon | Maturity | Ratings (6) | Value | |||||||||||||||||||||||||
| Electric Utilities – 0.4% | ||||||||||||||||||||||||||||||
| $ 310 | American Electric Power Co Inc |
3.875% | 2/15/62 | BBB | $ | 246,211 | ||||||||||||||||||||||||
| 300 | Edison International |
5.000% | N/A (15) | BB+ | 259,170 | |||||||||||||||||||||||||
| 150 | Edison International |
5.375% | N/A (15) | BB+ | 131,085 | |||||||||||||||||||||||||
| 860 | Emera Inc (3) |
6.750% | 6/15/76 | BB+ | 831,603 | |||||||||||||||||||||||||
| 340 | Southern Co/The |
|
4.000% | 1/15/51 | BBB- | 314,439 | ||||||||||||||||||||||||
| Total Electric Utilities |
1,782,508 | |||||||||||||||||||||||||||||
| Financial Services – 0.3% | ||||||||||||||||||||||||||||||
| 555 | American AgCredit Corp , 144A |
5.250% | N/A (15) | BB+ | 488,400 | |||||||||||||||||||||||||
| 115 | Citigroup Inc (3-Month LIBOR reference rate + 4.068% spread) (7) |
|
9.341% | N/A (15) | BBB- | 115,403 | ||||||||||||||||||||||||
| 390 | Equitable Holdings Inc |
|
4.950% | N/A (15) | BBB- | 362,193 | ||||||||||||||||||||||||
| 420 | Voya Financial Inc |
|
6.125% | N/A (15) | BBB- | 406,071 | ||||||||||||||||||||||||
| Total Financial Services |
|
1,372,067 | ||||||||||||||||||||||||||||
| Food Products – 0.4% | ||||||||||||||||||||||||||||||
| 2,250 | Land O’ Lakes Inc, 144A (3) |
8.000% | N/A (15) | BB | 1,980,000 | |||||||||||||||||||||||||
| Total Food Products |
|
1,980,000 | ||||||||||||||||||||||||||||
| Independent Power Producers & Energy Traders – 0.2% | ||||||||||||||||||||||||||||||
| 300 | AES Andes SA, 144A |
|
6.350% | 10/07/79 | BB | 276,183 | ||||||||||||||||||||||||
| 265 | AES Andes SA, 144A |
7.125% | 3/26/79 | BB | 244,992 | |||||||||||||||||||||||||
| 185 | Vistra Corp, 144A |
8.000% | N/A (15) | Ba3 | 172,973 | |||||||||||||||||||||||||
| 175 | Vistra Corp, 144A |
7.000% | N/A (15) | Ba3 | 152,688 | |||||||||||||||||||||||||
| Total Independent Power Producers & Energy Traders |
|
846,836 | ||||||||||||||||||||||||||||
| Industrial Conglomerates – 0.1% | ||||||||||||||||||||||||||||||
| 409 | General Electric Co (3-Month LIBOR reference rate + 3.330% spread) (3), (7) |
|
8.882% | N/A (15) | BBB- | 408,999 | ||||||||||||||||||||||||
| Total Industrial Conglomerates |
408,999 | |||||||||||||||||||||||||||||
| Insurance – 1.2% | ||||||||||||||||||||||||||||||
| 233 | American International Group Inc |
5.750% | 4/01/48 | BBB- | 226,427 | |||||||||||||||||||||||||
| 450 | AXIS Specialty Finance LLC |
4.900% | 1/15/40 | BBB | 358,730 | |||||||||||||||||||||||||
| 325 | Enstar Finance LLC |
5.750% | 9/01/40 | BBB- | 280,134 | |||||||||||||||||||||||||
| 235 | Enstar Finance LLC |
5.500% | 1/15/42 | BBB- | 175,310 | |||||||||||||||||||||||||
| 681 | Markel Group Inc |
6.000% | N/A (15) | BBB- | 657,148 | |||||||||||||||||||||||||
| 790 | MetLife Inc, 144A (3) |
9.250% | 4/08/38 | BBB | 915,866 | |||||||||||||||||||||||||
| 660 | Provident Financing Trust I |
7.405% | 3/15/38 | BB+ | 664,290 | |||||||||||||||||||||||||
| 395 | Prudential Financial Inc |
5.125% | 3/01/52 | BBB+ | 356,634 | |||||||||||||||||||||||||
| 420 | QBE Insurance Group Ltd, 144A |
5.875% | N/A (15) | Baa2 | 399,717 | |||||||||||||||||||||||||
| 1,075 | SBL Holdings Inc, 144A |
6.500% | N/A (15) | BB | 583,564 | |||||||||||||||||||||||||
| 1,100 | SBL Holdings Inc, 144A |
|
7.000% | N/A (15) | BB | 660,590 | ||||||||||||||||||||||||
| Total Insurance |
|
5,278,410 | ||||||||||||||||||||||||||||
| Media – 0.1% | ||||||||||||||||||||||||||||||
| 560 | Paramount Global |
6.375% | 3/30/62 | Baa3 | 467,158 | |||||||||||||||||||||||||
| Total Media |
467,158 | |||||||||||||||||||||||||||||
| Multi-Utilities – 0.3% | ||||||||||||||||||||||||||||||
| 165 | Algonquin Power & Utilities Corp |
4.750% | 1/18/82 | BB+ | 131,175 | |||||||||||||||||||||||||
| 595 | CenterPoint Energy Inc |
|
6.125% | N/A (15) | BBB- | 574,211 | ||||||||||||||||||||||||
| 360 | CMS Energy Corp |
|
4.750% | 6/01/50 | BBB- | 309,503 | ||||||||||||||||||||||||
| 510 | Sempra Energy |
|
4.875% | N/A (15) | BBB- | 474,335 | ||||||||||||||||||||||||
| Total Multi-Utilities |
1,489,224 | |||||||||||||||||||||||||||||
| Oil, Gas & Consumable Fuels – 0.3% | ||||||||||||||||||||||||||||||
| 305 | Enbridge Inc |
7.625% | 1/15/83 | BBB- | 306,486 | |||||||||||||||||||||||||
| 535 | Energy Transfer LP |
|
6.500% | N/A (15) | BB | 485,951 | ||||||||||||||||||||||||
| 55 | Energy Transfer LP |
|
7.125% | N/A (15) | BB | 46,636 | ||||||||||||||||||||||||
| 645 | Transcanada Trust |
|
5.600% | 3/07/82 | BBB- | 543,535 | ||||||||||||||||||||||||
| Total Oil, Gas & Consumable Fuels |
1,382,608 | |||||||||||||||||||||||||||||
42
| Principal Amount (000) |
Description (1) | Coupon | Maturity | Ratings (6) | Value | |||||||||||||||||||||||||
| Trading Companies & Distributors – 0.5% | ||||||||||||||||||||||||||||||
| $ 610 | AerCap Global Aviation Trust, 144A |
6.500% | 6/15/45 | Baa3 | $ | 589,613 | ||||||||||||||||||||||||
| 1,645 | AerCap Holdings NV (3) |
|
5.875% | 10/10/79 | BB+ | 1,551,443 | ||||||||||||||||||||||||
| 395 | Air Lease Corp |
4.650% | N/A (15) | BB+ | 329,651 | |||||||||||||||||||||||||
| Total Trading Companies & Distributors |
2,470,707 | |||||||||||||||||||||||||||||
| U.S. Agency – 0.1% | ||||||||||||||||||||||||||||||
| 525 | Farm Credit Bank of Texas, 144A |
6.200% | N/A (15) | BBB+ | 459,375 | |||||||||||||||||||||||||
| Total U.S. Agency |
459,375 | |||||||||||||||||||||||||||||
| Wireless Telecommunication Services – 0.1% | ||||||||||||||||||||||||||||||
| 500 | Vodafone Group PLC |
|
7.000% | 4/04/79 | BB+ | 512,675 | ||||||||||||||||||||||||
| Total Wireless Telecommunication Services |
|
512,675 | ||||||||||||||||||||||||||||
| Total $1,000 Par (or similar) Institutional Preferred (cost $46,115,010) |
|
41,441,224 | ||||||||||||||||||||||||||||
| Principal Amount (000) |
Description (1), (16) | Coupon | Maturity | Ratings (6) | Value | |||||||||||||||||||||||||
| CONTINGENT CAPITAL SECURITIES – 6.2% (4.2% of Total Investments) |
|
|||||||||||||||||||||||||||||
| Banks – 5.3% | ||||||||||||||||||||||||||||||
| $ 240 | Australia & New Zealand Banking Group Ltd/United Kingdom, 144A |
|
6.750% | N/A (15) | Baa2 | $ | 234,688 | |||||||||||||||||||||||
| 600 | Banco Bilbao Vizcaya Argentaria SA |
|
6.500% | N/A (15) | Ba2 | 562,620 | ||||||||||||||||||||||||
| 640 | Banco Bilbao Vizcaya Argentaria SA |
|
6.125% | N/A (15) | Ba2 | 536,256 | ||||||||||||||||||||||||
| 200 | Banco Mercantil del Norte SA/Grand Cayman, 144A |
|
7.500% | N/A (15) | Ba2 | 173,656 | ||||||||||||||||||||||||
| 500 | Banco Mercantil del Norte SA/Grand Cayman, 144A |
|
7.625% | N/A (15) | Ba2 | 455,085 | ||||||||||||||||||||||||
| 600 | Banco Santander SA, Reg S |
|
7.500% | N/A (15) | Ba1 | 571,786 | ||||||||||||||||||||||||
| 800 | Banco Santander SA |
|
4.750% | N/A (15) | Ba1 | 612,183 | ||||||||||||||||||||||||
| 200 | Bank Hapoalim BM, 144A, Reg S |
|
3.255% | 1/21/32 | BBB | 171,130 | ||||||||||||||||||||||||
| 1,055 | Barclays PLC (3) |
|
7.750% | N/A (15) | BBB- | 1,033,795 | ||||||||||||||||||||||||
| 630 | Barclays PLC |
|
6.125% | N/A (15) | BBB- | 552,195 | ||||||||||||||||||||||||
| 700 | Barclays PLC |
|
8.000% | N/A (15) | BBB- | 625,380 | ||||||||||||||||||||||||
| 895 | Barclays PLC (3) |
|
8.000% | N/A (15) | BBB- | 845,685 | ||||||||||||||||||||||||
| 200 | BBVA Bancomer SA/Texas, 144A |
|
5.125% | 1/18/33 | BB | 173,548 | ||||||||||||||||||||||||
| 200 | BBVA Bancomer SA/Texas, 144A |
|
8.450% | 6/29/38 | Baa3 | 200,200 | ||||||||||||||||||||||||
| 200 | BNP Paribas SA, 144A |
|
9.250% | N/A (15) | BBB | 206,123 | ||||||||||||||||||||||||
| 985 | BNP Paribas SA, 144A |
|
7.750% | N/A (15) | BBB | 953,382 | ||||||||||||||||||||||||
| 515 | BNP Paribas SA, 144A |
|
6.625% | N/A (15) | BBB | 494,593 | ||||||||||||||||||||||||
| 380 | BNP Paribas SA, 144A |
|
7.375% | N/A (15) | BBB | 368,438 | ||||||||||||||||||||||||
| 290 | BNP Paribas SA, 144A |
|
7.000% | N/A (15) | BBB | 259,598 | ||||||||||||||||||||||||
| 805 | Credit Agricole SA, 144A (3) |
|
7.875% | N/A (15) | BBB | 795,652 | ||||||||||||||||||||||||
| 755 | Credit Agricole SA, 144A |
|
8.125% | N/A (15) | BBB | 755,944 | ||||||||||||||||||||||||
| 910 | HSBC Holdings PLC (3) |
|
6.000% | N/A (15) | BBB | 813,312 | ||||||||||||||||||||||||
| 465 | HSBC Holdings PLC |
|
8.000% | N/A (15) | BBB | 461,631 | ||||||||||||||||||||||||
| 2,120 | HSBC Holdings PLC (3) |
|
6.375% | N/A (15) | BBB | 2,030,218 | ||||||||||||||||||||||||
| 900 | ING Groep NV (3) |
|
6.500% | N/A (15) | BBB | 839,880 | ||||||||||||||||||||||||
| 845 | ING Groep NV |
|
5.750% | N/A (15) | BBB | 746,258 | ||||||||||||||||||||||||
| 530 | ING Groep NV, Reg S |
|
6.750% | N/A (15) | BBB | 504,873 | ||||||||||||||||||||||||
| 420 | Intesa Sanpaolo SpA, 144A |
|
7.700% | N/A (15) | BB- | 394,275 | ||||||||||||||||||||||||
| 1,055 | Lloyds Banking Group PLC (3) |
|
7.500% | N/A (15) | Baa3 | 1,007,789 | ||||||||||||||||||||||||
| 1,225 | Lloyds Banking Group PLC (3) |
|
7.500% | N/A (15) | Baa3 | 1,145,559 | ||||||||||||||||||||||||
| 240 | Lloyds Banking Group PLC |
|
8.000% | N/A (15) | Baa3 | 219,276 | ||||||||||||||||||||||||
| 500 | Macquarie Bank Ltd/London, 144A |
|
6.125% | N/A (15) | Baa3 | 450,384 | ||||||||||||||||||||||||
| 680 | NatWest Group PLC |
|
8.000% | N/A (15) | BBB- | 661,932 | ||||||||||||||||||||||||
| 1,010 | NatWest Group PLC |
|
6.000% | N/A (15) | Baa3 | 934,250 | ||||||||||||||||||||||||
| 380 | Nordea Bank Abp, 144A |
|
6.625% | N/A (15) | BBB+ | 358,260 | ||||||||||||||||||||||||
| 245 | Societe Generale SA, 144A |
|
8.000% | N/A (15) | BB | 229,990 | ||||||||||||||||||||||||
| 660 | Societe Generale SA, 144A |
|
9.375% | N/A (15) | BB+ | 645,150 | ||||||||||||||||||||||||
| 655 | Societe Generale SA, 144A |
|
7.875% | N/A (15) | BB+ | 640,541 | ||||||||||||||||||||||||
| 320 | Societe Generale SA, 144A |
|
6.750% | N/A (15) | BB | 259,314 | ||||||||||||||||||||||||
| 400 | Standard Chartered PLC, 144A |
|
7.750% | N/A (15) | BBB- | 396,104 | ||||||||||||||||||||||||
| 435 | UniCredit SpA , Reg S |
|
8.000% | N/A (15) | BB- | 425,239 | ||||||||||||||||||||||||
| Total Banks |
|
23,746,172 | ||||||||||||||||||||||||||||
43
| NMAI | Nuveen Multi-Asset Income Fund (continued) | |
| Portfolio of Investments June 30, 2023 | ||
| (Unaudited) | ||
| Principal Amount (000) |
Description (1), (16) | Coupon | Maturity | Ratings (6) | Value | |||||||||||||||||||||||||
| Capital Markets – 0.9% | ||||||||||||||||||||||||||||||
| $ 1,645 | Credit Suisse Group AG, 144A |
7.250% | N/A (15) | N/R | $ | 61,407 | ||||||||||||||||||||||||
| 1,000 | Credit Suisse Group AG, 144A |
7.500% | N/A (15) | N/R | 37,330 | |||||||||||||||||||||||||
| 735 | Credit Suisse Group AG, 144A |
9.750% | N/A (15) | N/R | 27,437 | |||||||||||||||||||||||||
| 575 | Credit Suisse Group AG, 144A |
7.500% | N/A (15) | N/R | 21,465 | |||||||||||||||||||||||||
| 300 | Credit Suisse Group AG, 144A |
6.375% | N/A (15) | N/R | 11,199 | |||||||||||||||||||||||||
| 1,600 | Deutsche Bank AG (3) |
6.000% | N/A (15) | Ba2 | 1,276,640 | |||||||||||||||||||||||||
| 1,030 | UBS Group AG, Reg S |
7.000% | N/A (15) | BBB- | 978,500 | |||||||||||||||||||||||||
| 650 | UBS Group AG, 144A |
7.000% | N/A (15) | BBB- | 627,672 | |||||||||||||||||||||||||
| 1,365 | UBS Group AG, Reg S |
6.875% | N/A (15) | BBB- | 1,247,815 | |||||||||||||||||||||||||
| 245 | UBS Group AG, 144A |
3.875% | N/A (15) | BBB- | 189,711 | |||||||||||||||||||||||||
| Total Capital Markets |
|
4,479,176 | ||||||||||||||||||||||||||||
| Total Contingent Capital Securities (cost $35,485,612) |
|
28,225,348 | ||||||||||||||||||||||||||||
| Shares | Description (1) | Coupon | Ratings (6) | Value | ||||||||||||||||||||||||||
| $25 PAR (OR SIMILAR) RETAIL PREFERRED – 3.9% (2.7% of Total Investments) |
|
|||||||||||||||||||||||||||||
| Automobiles – 0.1% | ||||||||||||||||||||||||||||||
| 3,960 | Dr Ing hc F Porsche AG |
|
0.000% | N/R | $ | 491,946 | ||||||||||||||||||||||||
| Total Automobiles |
|
491,946 | ||||||||||||||||||||||||||||
| Banks – 1.3% | ||||||||||||||||||||||||||||||
| 371,500 | Banco Bradesco SA |
0.000% | N/R | 1,276,299 | ||||||||||||||||||||||||||
| 4,750 | Farm Credit Bank of Texas, 144A |
6.750% | Baa1 | 470,250 | ||||||||||||||||||||||||||
| 20,222 | Fifth Third Bancorp |
6.625% | Baa3 | 506,157 | ||||||||||||||||||||||||||
| 161,600 | Itau Unibanco Holding SA |
0.000% | N/R | 959,164 | ||||||||||||||||||||||||||
| 49,625 | KeyCorp |
6.200% | Baa3 | 946,845 | ||||||||||||||||||||||||||
| 18,425 | KeyCorp |
6.125% | Baa3 | 368,684 | ||||||||||||||||||||||||||
| 25,814 | New York Community Bancorp Inc |
6.375% | Ba2 | 565,585 | ||||||||||||||||||||||||||
| 12,231 | Regions Financial Corp |
6.375% | Baa3 | 279,234 | ||||||||||||||||||||||||||
| 8,400 | Synovus Financial Corp |
5.875% | BB- | 173,460 | ||||||||||||||||||||||||||
| 7,800 | Western Alliance Bancorp |
4.250% | Ba3 | 111,540 | ||||||||||||||||||||||||||
| 14,500 | Wintrust Financial Corp |
6.875% | BB | 353,655 | ||||||||||||||||||||||||||
| Total Banks |
6,010,873 | |||||||||||||||||||||||||||||
| Capital Markets – 0.4% | ||||||||||||||||||||||||||||||
| 4,900 | Goldman Sachs Group Inc/The |
8.977% | BB+ | 124,999 | ||||||||||||||||||||||||||
| 25,000 | Morgan Stanley |
6.875% | BBB | 633,000 | ||||||||||||||||||||||||||
| 39,606 | Morgan Stanley |
7.125% | BBB | 995,695 | ||||||||||||||||||||||||||
| 10,100 | Morgan Stanley |
6.500% | BBB | 262,196 | ||||||||||||||||||||||||||
| Total Capital Markets |
2,015,890 | |||||||||||||||||||||||||||||
| Communications Equipment – 0.0% | ||||||||||||||||||||||||||||||
| 3,288 | riverbed technology inc |
|
0.000% | N/R | — | |||||||||||||||||||||||||
| Total Communications Equipment |
|
— | ||||||||||||||||||||||||||||
| Consumer Finance – 0.0% | ||||||||||||||||||||||||||||||
| 10,648 | Synchrony Financial |
|
5.625% | BB- | 178,247 | |||||||||||||||||||||||||
| Total Consumer Finance |
|
178,247 | ||||||||||||||||||||||||||||
| Diversified Telecommunication Services – 0.0% | ||||||||||||||||||||||||||||||
| 7,900 | AT&T Inc |
|
4.750% | BBB- | 166,532 | |||||||||||||||||||||||||
| Total Diversified Telecommunication Services |
|
166,532 | ||||||||||||||||||||||||||||
| Financial Services – 0.2% | ||||||||||||||||||||||||||||||
| 21,900 | Equitable Holdings Inc |
5.250% | BBB- | 437,781 | ||||||||||||||||||||||||||
| 23,800 | Voya Financial Inc |
|
5.350% | BBB- | 530,026 | |||||||||||||||||||||||||
| Total Financial Services |
|
967,807 | ||||||||||||||||||||||||||||
44
| Shares | Description (1) | Coupon | Ratings (6) | Value | ||||||||||||||||||||||
| Food Products – 0.3% | ||||||||||||||||||||||||||
| 24,270 | CHS Inc |
6.750% | N/R | $ | 612,818 | |||||||||||||||||||||
| 34,746 | CHS Inc (3) |
7.100% | N/R | 880,116 | ||||||||||||||||||||||
| Total Food Products |
1,492,934 | |||||||||||||||||||||||||
| Insurance – 0.9% | ||||||||||||||||||||||||||
| 24,200 | American Equity Investment Life Holding Co |
6.625% | BB | 558,778 | ||||||||||||||||||||||
| 26,566 | American Equity Investment Life Holding Co |
5.950% | BB | 565,856 | ||||||||||||||||||||||
| 29,048 | Aspen Insurance Holdings Ltd |
5.950% | BB+ | 720,390 | ||||||||||||||||||||||
| 15,200 | Aspen Insurance Holdings Ltd |
5.625% | BB+ | 288,192 | ||||||||||||||||||||||
| 11,000 | Assurant Inc |
5.250% | Baa3 | 207,460 | ||||||||||||||||||||||
| 19,836 | Athene Holding Ltd |
6.350% | BBB | 416,556 | ||||||||||||||||||||||
| 19,590 | Athene Holding Ltd |
6.375% | BBB | 457,818 | ||||||||||||||||||||||
| 2,500 | Axis Capital Holdings Ltd |
5.500% | BBB | 51,300 | ||||||||||||||||||||||
| 11,432 | Enstar Group Ltd |
7.000% | BBB- | 260,764 | ||||||||||||||||||||||
| 13,500 | Reinsurance Group of America Inc |
5.750% | BBB+ | 336,555 | ||||||||||||||||||||||
| 10,300 | Reinsurance Group of America Inc |
7.125% | BBB+ | 262,238 | ||||||||||||||||||||||
| 8,200 | Selective Insurance Group Inc |
4.600% | BBB- | 134,234 | ||||||||||||||||||||||
| Total Insurance |
4,260,141 | |||||||||||||||||||||||||
| Multi-Utilities – 0.1% | ||||||||||||||||||||||||||
| 10,000 | NiSource Inc |
6.500% | BBB- | 251,900 | ||||||||||||||||||||||
| Total Multi-Utilities |
251,900 | |||||||||||||||||||||||||
| Oil, Gas & Consumable Fuels – 0.4% | ||||||||||||||||||||||||||
| 5,400 | Energy Transfer LP |
7.600% | BB | 131,652 | ||||||||||||||||||||||
| 30,300 | NuStar Energy LP |
11.176% | B2 | 739,320 | ||||||||||||||||||||||
| 18,300 | NuStar Energy LP |
12.299% | B2 | 466,833 | ||||||||||||||||||||||
| 316,133 | Raizen SA |
0.000% | N/R | 290,503 | ||||||||||||||||||||||
| Total Oil, Gas & Consumable Fuels |
1,628,308 | |||||||||||||||||||||||||
| Trading Companies & Distributors – 0.2% | ||||||||||||||||||||||||||
| 20,500 | Air Lease Corp |
6.150% | BB+ | 465,350 | ||||||||||||||||||||||
| 6,800 | WESCO International Inc |
10.625% | B+ | 181,696 | ||||||||||||||||||||||
| Total Trading Companies & Distributors |
647,046 | |||||||||||||||||||||||||
| Total $25 Par (or similar) Retail Preferred (cost $19,654,601) |
18,111,624 | |||||||||||||||||||||||||
| Principal Amount (000) |
Description (1) | Coupon | Maturity | Ratings (6) | Value | |||||||||||||||||||||
| CORPORATE BONDS – 1.8% (1.3% of Total Investments) |
|
|||||||||||||||||||||||||
| Automobiles – 0.0% | ||||||||||||||||||||||||||
| $ 200 | Hyundai Capital America, 144A |
5.680% | 6/26/28 | BBB+ | $ | 198,399 | ||||||||||||||||||||
| Total Automobiles |
198,399 | |||||||||||||||||||||||||
| Commercial Services & Supplies – 0.3% | ||||||||||||||||||||||||||
| 325 | Prime Security Services Borrower LLC / Prime Finance Inc, 144A (3) |
6.250% | 1/15/28 | B | 304,460 | |||||||||||||||||||||
| 973 | Prime Security Services Borrower LLC / Prime Finance Inc, 144A (3) |
5.750% | 4/15/26 | BB | 955,124 | |||||||||||||||||||||
| Total Commercial Services & Supplies |
1,259,584 | |||||||||||||||||||||||||
| Diversified Telecommunication Services – 0.1% | ||||||||||||||||||||||||||
| 375 | Frontier Communications Holdings LLC, 144A (3) |
5.875% | 10/15/27 | BB+ | 344,160 | |||||||||||||||||||||
| Total Diversified Telecommunication Services |
344,160 | |||||||||||||||||||||||||
| Electric Utilities – 0.1% | ||||||||||||||||||||||||||
| 484 | PG&E Corp |
5.000% | 7/01/28 | BB+ | 444,121 | |||||||||||||||||||||
| Total Electric Utilities |
444,121 | |||||||||||||||||||||||||
| Entertainment – 0.0% | ||||||||||||||||||||||||||
| 125 | AMC Entertainment Holdings Inc, 144A, (cash 10.000%, PIK 12.000%) |
10.000% | 6/15/26 | CCC- | 89,688 | |||||||||||||||||||||
| Total Entertainment |
89,688 | |||||||||||||||||||||||||
45
| NMAI | Nuveen Multi-Asset Income Fund (continued) | |
| Portfolio of Investments June 30, 2023 | ||
| (Unaudited) | ||
| Principal Amount (000) |
Description (1) | Coupon | Maturity | Ratings (6) | Value | |||||||||||||||||||||||||
| Health Care Providers & Services – 0.3% | ||||||||||||||||||||||||||||||
| $ 625 | Tenet Healthcare Corp (3) |
|
4.625% | 6/15/28 | BB- | $ | 583,741 | |||||||||||||||||||||||
| 400 | Tenet Healthcare Corp |
|
4.875% | 1/01/26 | BB- | 389,596 | ||||||||||||||||||||||||
| 250 | Tenet Healthcare Corp |
|
6.125% | 10/01/28 | B+ | 240,675 | ||||||||||||||||||||||||
| Total Health Care Providers & Services |
|
1,214,012 | ||||||||||||||||||||||||||||
| Hotel & Resort REITs – 0.0% | ||||||||||||||||||||||||||||||
| 250 | RLJ Lodging Trust LP, 144A |
|
3.750% | 7/01/26 | BB- | 229,375 | ||||||||||||||||||||||||
| Total Hotel & Resort REITs |
|
229,375 | ||||||||||||||||||||||||||||
| Hotels, Restaurants & Leisure – 0.3% | ||||||||||||||||||||||||||||||
| 975 | Caesars Entertainment Inc, 144A |
|
6.250% | 7/01/25 | Ba3 | 970,485 | ||||||||||||||||||||||||
| 250 | Life Time Inc, 144A |
|
5.750% | 1/15/26 | BB- | 243,633 | ||||||||||||||||||||||||
| Total Hotels, Restaurants & Leisure |
|
1,214,118 | ||||||||||||||||||||||||||||
| Insurance – 0.3% | ||||||||||||||||||||||||||||||
| 475 | Alliant Holdings Intermediate LLC / Alliant Holdings Co-Issuer, 144A (3) |
|
4.250% | 10/15/27 | B | 426,262 | ||||||||||||||||||||||||
| 907 | Assurant Inc (3) |
|
7.000% | 3/27/48 | Baa3 | 870,506 | ||||||||||||||||||||||||
| Total Insurance |
|
1,296,768 | ||||||||||||||||||||||||||||
| Media – 0.2% | ||||||||||||||||||||||||||||||
| 625 | iHeartCommunications Inc, 144A (3) |
|
5.250% | 8/15/27 | BB- | 477,937 | ||||||||||||||||||||||||
| 300 | LCPR Senior Secured Financing DAC, 144A |
|
5.125% | 7/15/29 | BB+ | 252,086 | ||||||||||||||||||||||||
| 69 | McGraw-Hill Education Inc, 144A |
|
5.750% | 8/01/28 | BB+ | 59,788 | ||||||||||||||||||||||||
| 250 | Outfront Media Capital LLC / Outfront Media Capital Corp, 144A |
|
5.000% | 8/15/27 | B+ | 226,925 | ||||||||||||||||||||||||
| Total Media |
|
1,016,736 | ||||||||||||||||||||||||||||
| Oil, Gas & Consumable Fuels – 0.1% | ||||||||||||||||||||||||||||||
| 250 | Calumet Specialty Products Partners LP / Calumet Finance Corp, 144A |
|
8.125% | 1/15/27 | B- | 239,373 | ||||||||||||||||||||||||
| 250 | Matador Resources Co (3) |
|
5.875% | 9/15/26 | BB- | 242,261 | ||||||||||||||||||||||||
| 61 | PBF Holding Co LLC / PBF Finance Corp |
|
7.250% | 6/15/25 | BB | 60,894 | ||||||||||||||||||||||||
| Total Oil, Gas & Consumable Fuels |
|
542,528 | ||||||||||||||||||||||||||||
| Specialty Retail – 0.1% | ||||||||||||||||||||||||||||||
| 640 | Hertz Corp/The, 144A (3) |
|
4.625% | 12/01/26 | B+ | 577,600 | ||||||||||||||||||||||||
| Total Specialty Retail |
|
577,600 | ||||||||||||||||||||||||||||
| Total Corporate Bonds (cost $9,130,543) |
|
8,427,089 | ||||||||||||||||||||||||||||
| Shares | Description (1) | Value | ||||||||||||||||||||||||||||
| WARRANTS – 0.1% (0.1% of Total Investments) |
|
|||||||||||||||||||||||||||||
| Energy Equipment & Services – 0.1% | ||||||||||||||||||||||||||||||
| 3,996 | Quarternorth Energy Holding Inc |
|
$ | 449,550 | ||||||||||||||||||||||||||
| 2,870 | Quarternorth Energy Holding Inc |
|
28,700 | |||||||||||||||||||||||||||
| 5,530 | Quarternorth Energy Holding Inc |
|
27,650 | |||||||||||||||||||||||||||
| Total Energy Equipment & Services |
|
505,900 | ||||||||||||||||||||||||||||
| Entertainment – 0.0% | ||||||||||||||||||||||||||||||
| 34,453 | Cineworld Warrant |
|
— | |||||||||||||||||||||||||||
| Total Entertainment |
|
— | ||||||||||||||||||||||||||||
| Total Warrants (cost $54,810) |
|
505,900 | ||||||||||||||||||||||||||||
| Description (17) | Type | Number of Contracts |
Notional Amount (18) |
Exercise Price |
Expiration Date |
Value | ||||||||||||||||||||||||
| OPTIONS PURCHASED – 0.0% (0.0% of Total Investments) | ||||||||||||||||||||||||||||||
| CBOE Volatility Index |
Call | 10 | $ | 22,000 | $ | 22 | 7/21/23 | $ | 200 | |||||||||||||||||||||
46
| Description (17) | Type | Number of Contracts |
Notional Amount (18) |
Exercise Price |
Expiration Date |
Value | ||||||||||||||||||||||||
| OPTIONS PURCHASED (continued) | ||||||||||||||||||||||||||||||
| CBOE Volatility Index |
Call | 10 | $ | 30,000 | $ | 30 | 8/18/23 | $ | 425 | |||||||||||||||||||||
| iShares U.S. Home Construction ETF |
Put | 20 | 150,000 | 75 | 7/21/23 | 128 | ||||||||||||||||||||||||
| Total Options Purchased (cost $3,761) |
|
40 | 202,000 | 753 | ||||||||||||||||||||||||||
| Shares | Description (1) | Value | ||||||||||||||||||||||||||||
| INVESTMENT COMPANIES – 0.1% (0.0% of Total Investments) |
|
|||||||||||||||||||||||||||||
| 72,749 | 3i Infrastructure PLC |
|
$ | 289,331 | ||||||||||||||||||||||||||
| Total Investment Companies (cost $288,165) |
|
289,331 | ||||||||||||||||||||||||||||
| Total Long-Term Investments (cost $636,907,186) |
|
642,864,764 | ||||||||||||||||||||||||||||
| Principal Amount (000) |
Description (1) | Coupon | Maturity | Value | ||||||||||||||||||||||||||
| SHORT-TERM INVESTMENTS – 4.8% (3.3% of Total Investments) |
|
|||||||||||||||||||||||||||||
| REPURCHASE AGREEMENTS – 4.8% (3.3% of Total Investments) |
|
|||||||||||||||||||||||||||||
| $ 1,916 | Repurchase Agreement with Fixed Income Clearing Corporation, dated 6/30/23, repurchase price $1,916,264, collateralized by $2,233,200, U.S. Treasury Note, 1.500%, due 11/30/28, value $1,954,353 |
|
1.520% | 7/03/23 | $ | 1,916,021 | ||||||||||||||||||||||||
| 20,070 | Repurchase Agreement with Fixed Income Clearing Corporation, dated 6/30/23, repurchase price $20,078,379, collateralized by $20,105,200, U.S. Treasury Notes, 4.000%, due 2/28/30, value $20,338,827; collateralized by $134,500, U.S. Treasury Note, 3.625%, due 3/31/30, value $132,650 |
|
5.010% | 7/03/23 | 20,070,000 | |||||||||||||||||||||||||
| Total Repurchase Agreements (cost $21,986,021) |
|
21,986,021 | ||||||||||||||||||||||||||||
| Total Short-Term Investments (cost $21,986,021) |
|
21,986,021 | ||||||||||||||||||||||||||||
| Total Investments (cost $658,893,207) – 145.4% |
|
664,850,785 | ||||||||||||||||||||||||||||
| Borrowings – (30.5)% (19), (20) |
|
(139,601,000 | ) | |||||||||||||||||||||||||||
| Reverse Repurchase Agreements, including accrued interest – (13.3)% (21) |
|
(60,807,219 | ) | |||||||||||||||||||||||||||
| Other Assets & Liabilities, Net – (1.6)% (22) |
|
(7,236,083 | ) | |||||||||||||||||||||||||||
| Net Assets Applicable to Common Shares – 100% |
|
$ | 457,206,483 | |||||||||||||||||||||||||||
Investments in Derivatives
Options Written
| Description (17) | Type | Number of Contracts |
Notional Amount (18) |
Exercise Price |
Expiration Date |
Value | ||||||||||||||||||
| Russell 2000 Index | Call | (10 | ) | $ | (1,900,000 | ) | $ | 1,900 | 7/21/23 | $(23,750 | ) | |||||||||||||
| S&P 500 Index | Call | (10 | ) | (4,450,000 | ) | 4,450 | 7/21/23 | (44,850 | ) | |||||||||||||||
| S&P 500 Index | Call | (27 | ) | (12,150,000 | ) | 4,500 | 7/21/23 | (60,210 | ) | |||||||||||||||
| Total Options Written (premiums received $60,297) |
|
(47 | ) | $ | (18,500,000 | ) | $ | (128,810 | ) | |||||||||||||||
Forward Foreign Currency Contracts
| Currency Purchased |
Notional Amount (Local Currency) |
Currency Sold | Notional Amount (Local Currency) |
Counterparty | Settlement Date | Unrealized Appreciation (Depreciation) |
||||||||||||||||||
| U.S. Dollar | 748,344 | Euro | 692,252 | Morgan Stanley Capital Services LLC | 7/14/2023 | (7,366 | ) | |||||||||||||||||
47
| NMAI | Nuveen Multi-Asset Income Fund (continued) | |
| Portfolio of Investments June 30, 2023 | ||
| (Unaudited) | ||
For Fund portfolio compliance purposes, the Fund’s industry classifications refer to any one or more of the industry sub-classifications used by one or more widely recognized market indexes or ratings group indexes, and/or as defined by Fund management. This definition may not apply for purposes of this report, which may combine industry sub-classifications into sectors for reporting ease.
| (1) | All percentages shown in the Portfolio of Investments are based on net assets applicable to common shares unless otherwise noted. |
| (2) | Non-income producing; issuer has not declared an ex-dividend date within the past twelve months. |
| (3) | Investment, or portion of investment, is hypothecated. The total value of investments hypothecated as of the end of the reporting period was $113,009,627. |
| (4) | Investment, or portion of investment, has been pledged to collateralize the net payment obligations for investments in derivatives. |
| (5) | For fair value measurement disclosure purposes, investment classified as Level 3. |
| (6) | The Fund uses credit quality ratings for its portfolio securities provided by Standard & Poor’s Group (“Standard & Poor’s”), Moody’s Investors Service, Inc. (“Moody’s”) and Fitch, Inc. (“Fitch”). If all three provide a rating for a security, the middle is used; if two of the three agencies rate a security, the lower rating is used; and if only one rating agency rates a security, that rating is used. AAA, AA, A, and BBB are investment grade ratings; BB, B, CCC/CC/C and D are below-investment grade ratings. Credit ratings are subject to change. Holdings designatedN/R are not rated by Moody’s, S&P or Fitch. |
| (7) | Variable rate security. The rate shown is the coupon as of the end of the reporting period. |
| (8) | Investment, or portion of investment, has been pledged to collateralize the net payment obligations for investments in reverse repurchase agreements. As of the end of the reporting period, investments with a value of $64,117,816 have been pledged as collateral for reverse repurchase agreements. |
| (9) | Senior loans generally pay interest at rates which are periodically adjusted by reference to a base short-term, floating lending rate (Reference Rate) plus an assigned fixed rate (Spread). These floating lending rates are generally (i) the lending rate referenced by the London Inter-Bank Offered Rate (“LIBOR”), or (ii) the prime rate offered by one or more major United States banks. Senior loans may be considered restricted in that the Fund ordinarily is contractually obligated to receive approval from the agent bank and/or borrower prior to the disposition of a senior loan. The rate shown is the coupon as of the end of the reporting period. |
| (10) | Senior loans generally are subject to mandatory and/or optional prepayment. Because of these mandatory prepayment conditions and because there may be significant economic incentives for a borrower to prepay, prepayments of senior loans may occur. As a result, the actual remaining maturity of senior loans held may be substantially less than the stated maturities shown. |
| (11) | Defaulted security. A security whose issuer has failed to fully pay principal and/or interest when due, or is under the protection of bankruptcy. |
| (12) | Principal Amount (000) rounds to less than $1,000. |
| (13) | Investment, or portion of investment, represents an outstanding unfunded senior loan commitment. |
| (14) | Principal Amount (000) denominated in U.S. Dollars, unless otherwise noted. |
| (15) | Perpetual security. Maturity date is not applicable. |
| (16) | Contingent Capital Securities (“CoCos”) are hybrid securities with loss absorption characteristics built into the terms of the security for the benefit of the issuer. For example, the terms may specify an automatic write-down of principal or a mandatory conversion into the issuer’s common stock under certain adverse circumstances, such as the issuer’s capital ratio falling below a specified level. |
| (17) | Exchange-traded, unless otherwise noted. |
| (18) | For disclosure purposes, Notional Amount is calculated by multiplying the Number of Contracts by the Exercise Price by 100. |
| (19) | Borrowings as a percentage of Total Investments is 21.0%. |
| (20) | The Fund may pledge up to 100% of its eligible investments (excluding any investments separately pledged as collateral for specific investments in derivatives, when applicable) in the Portfolio of Investments as collateral for borrowings. As of the end of the reporting period, investments with a value of $259,632,596 have been pledged as collateral for borrowings. |
| (21) | Reverse Repurchase Agreements, including accrued interest as a percentage of Total investments is 9.1%. |
| (22) | Other assets less liabilities includes the unrealized appreciation (depreciation) of certain over-the-counter (“OTC”) derivatives as presented on the Statement of Assets and Liabilities, when applicable. The unrealized appreciation (depreciation) of OTC cleared and exchange-traded derivatives is recognized as part of the cash collateral at brokers and/or the receivable or payable for variation margin as presented on the Statement of Assets and Liabilities, when applicable. |
| 144A | Investment is exempt from registration under Rule 144A of the Securities Act of 1933, as amended. These investments may only be resold in transactions exempt from registration, which are normally those transactions with qualified institutional buyers. |
| ADR | American Depositary Receipt |
| BRL | Brazilian Real |
| CME | Chicago Mercantile Exchange |
| CZK | Czech Koruna |
| DD1 | Portion of investment purchased on a delayed delivery basis. |
| DOP | Dominican Peso |
| EAFE | Europe, Australasia and Far East |
| ETF | Exchange-Traded Fund |
| EUR | Euro |
| GDR | Global Depositary Receipt |
| HUF | Hungarian Forint |
| IDR | Indonesian Rupiah |
| INR | Indian Rupee |
| LIBOR | London Inter-Bank Offered Rate |
| MSCI | Morgan Stanley Capital International |
| MXN | Mexican Peso |
| MYR | Malaysian Ringgit |
48
| N/A | Not Applicable. |
| PEN | Peruvian Sol |
| PIK | Payment-in-kind (“PIK”) security. Depending on the terms of the security, income may be received in the form of cash, securities, or a combination of both. The PIK rate shown, where applicable, represents the annualized rate of the last PIK payment made by the issuer as of the end of the reporting period. |
| PLN | Polish Zloty |
| REIT | Real Estate Investment Trust |
| Reg S | Regulation S allows U.S. companies to sell securities to persons or entities located outside of the United States without registering those securities with the Securities and Exchange Commission. Specifically, Regulation S provides a safe harbor from the registration requirements of the Securities Act for the offers and sales of securities by both foreign and domestic issuers that are made outside the United States. |
| RON | Romanian Leu |
| S&P | Standard & Poor’s |
| SOFR180A | 180 Day Average Secured Overnight Financing Rate |
| SOFR30A | 30 Day Average Secured Overnight Financing Rate |
| SOFR90A | 90 Day Average Secured Overnight Financing Rate |
| TBD | Senior loan purchased on a when-issued or delayed-delivery basis. Certain details associated with this purchase are not known prior to the settlement date of the transaction. In addition, senior loans typically trade without accrued interest and therefore a coupon rate is not available prior to settlement. At settlement, if still unknown, the borrower or counterparty will provide the Fund with the final coupon rate and maturity date. |
| THB | Thai Baht |
| TSFR1M | CME Term SOFR 1 Month |
| TSFR3M | CME Term SOFR 3 Month |
| UGX | Ugandan Shilling |
| UYU | Uruguayan Peso |
| WI/DD | Purchased on a when-issued or delayed delivery basis. |
| ZAR | South African Rand |
49
Statement of Assets and Liabilities
| June 30, 2023 (Unaudited) | NMAI | |||
| ASSETS |
||||
| Long-term investments, at value† |
$ | 642,864,764 | ||
| Short-term investments, at valueà |
21,986,021 | |||
| Cash |
554,045 | |||
| Cash denominated in foreign currencies^ |
79,450 | |||
| Receivable for: |
||||
| Dividends |
859,113 | |||
| Interest |
3,218,161 | |||
| Investment sold |
3,072,496 | |||
| Reclaims |
738,722 | |||
| Due from affiliates |
20,763 | |||
| Other assets |
242,948 | |||
| Total assets |
673,636,483 | |||
| LIABILITIES |
||||
| Options written, at value # |
128,810 | |||
| Borrowings |
139,601,000 | |||
| Reverse repurchase agreements, including accrued interest |
60,807,219 | |||
| Payable for: |
||||
| Dividends |
9,929,543 | |||
| Interest |
624,591 | |||
| Investments purchased – regular settlement |
639,652 | |||
| Investments purchased – when-issued/delayed-delivery settlement |
3,525,143 | |||
| Unfunded senior loans |
5,325 | |||
| Unrealized depreciation on forward foreign currency exchange contracts |
7,366 | |||
| Accrued expenses: |
||||
| Custodian fees |
361,015 | |||
| Investor relations |
63,202 | |||
| Management fees |
459,207 | |||
| Trustees fees |
210,942 | |||
| Professional fees |
14,506 | |||
| Shareholder reporting expenses |
46,513 | |||
| Shareholder servicing agent fees |
57 | |||
| Other |
5,909 | |||
| Total liabilities |
216,430,000 | |||
| Net assets applicable to common shares |
$ | 457,206,483 | ||
| Common shares outstanding |
33,425,645 | |||
| Net asset value (“NAV”) per common share outstanding |
$ | 13.68 | ||
| NET ASSETS APPLICABLE TO COMMON SHARES CONSIST OF: |
||||
| Common shares, $0.01 par value per share |
$ | 334,256 | ||
| Paid-in capital |
486,676,006 | |||
| Total distributable earnings (loss) |
(29,803,779 | ) | ||
| Net assets applicable to common shares |
$ | 457,206,483 | ||
| Authorized shares: |
||||
| Common |
Unlimited | |||
| Preferred |
Unlimited | |||
| † Long-term investments, cost |
$ | 636,907,186 | ||
| à Short-term investments, cost |
$ | 21,986,021 | ||
| ^ Cash denominated in foreign currencies, cost |
$ | 80,789 | ||
| # Options written, premiums received |
$ | 60,297 | ||
See Notes to Financial Statements
50
| Six Months Ended June 30, 2023 (Unaudited) | NMAI | |||
| INVESTMENT INCOME |
||||
| Dividends |
$ | 6,466,868 | ||
| Interest |
9,025,470 | |||
| Rehypothecation income |
23,900 | |||
| Foreign tax withheld on dividend income |
(395,320 | ) | ||
| Total investment income |
15,120,918 | |||
| EXPENSES |
||||
| Management fees |
2,858,623 | |||
| Interest expense |
5,900,757 | |||
| Custodian expenses |
160,292 | |||
| Trustees fees |
11,332 | |||
| Professional fees |
33,705 | |||
| Shareholder reporting expenses |
64,649 | |||
| Shareholder servicing agent fees |
619 | |||
| Stock exchange listing fees |
4,931 | |||
| Investor relations expenses |
59,877 | |||
| Other |
10,405 | |||
| Total expenses |
9,105,190 | |||
| Net investment income (loss) |
6,015,728 | |||
| Realized and Unrealized Gain (Loss) |
||||
| Realized gain (loss): |
||||
| Investments and foreign currency |
(17,049,938 | ) | ||
| Options written |
1,696 | |||
| Net realized gain (loss) |
(17,048,242 | ) | ||
| Change in net unrealized appreciation (depreciation) on: |
||||
| Investments and foreign currency |
40,013,550 | |||
| Options written |
(68,513 | ) | ||
| Forward foreign currency exchange contracts |
(7,366 | ) | ||
| Change in net unrealized appreciation (depreciation) |
39,937,671 | |||
| Net realized and unrealized gain (loss) |
22,889,429 | |||
| Net increase (decrease) in net assets applicable to common shares from operations |
$ | 28,905,157 | ||
See Notes to Financial Statements
51
Statement of Changes in Net Assets
| NMAI | ||||||||
| Unaudited Six Months Ended 6/30/23 |
Year Ended |
|||||||
| OPERATIONS |
||||||||
| Net investment income (loss) |
$ | 6,015,728 | $ | 15,582,325 | ||||
| Net realized gain (loss) |
(17,048,242 | ) | (3,423,329 | ) | ||||
| Change in net unrealized appreciation (depreciation) |
39,937,671 | (158,716,918 | ) | |||||
| Net increase (decrease) in net assets applicable to common shares from operations |
28,905,157 | (146,557,922 | ) | |||||
| DISTRIBUTIONS TO COMMON SHAREHOLDERS |
||||||||
| Dividends |
(20,055,387 | ) | (74,696,289 | ) | ||||
| Decrease in net assets applicable to common shares from distributions to common shareholders |
(20,055,387 | ) | (74,696,289 | ) | ||||
| Net increase (decrease) in net assets applicable to common shares |
8,849,770 | (221,254,211 | ) | |||||
| Net assets applicable to common shares at the beginning of period |
448,356,713 | 669,610,924 | ||||||
| Net assets applicable to common shares at the end of period |
$ | 457,206,483 | $ | 448,356,713 | ||||
See Notes to Financial Statements
52
| June 30, 2023 (Unaudited) | NMAI | |||
| Cash Flows from Operating Activities |
||||
| Net Increase (Decrease) in Net Assets Applicable to Common Shares from Operations |
$ | 28,905,157 | ||
| Adjustments to reconcile the net increase (decrease) in net assets applicable to common shares from operations to net cash provided by (used in) operating activities: |
||||
| Purchases of investments |
(122,493,915 | ) | ||
| Proceeds from sales and maturities of investments |
184,208,639 | |||
| Proceeds from (Purchase of) short-term investments, net |
(18,863,757 | ) | ||
| Proceeds from (Payments for) closed foreign currency spot contracts |
30,597 | |||
| Payment-in-kind distributions |
20,315 | |||
| Capital gains and return of capital distributions from investments |
161,872 | |||
| Amortization (Accretion) of premiums and discounts, net |
340,575 | |||
| (Increase) Decrease in: |
||||
| Receivable for dividends |
(167,182 | ) | ||
| Receivable for interest |
466,451 | |||
| Receivable for investments sold |
562,144 | |||
| Receivable for reclaims |
(29,018 | ) | ||
| Due from affiliates |
4,152 | |||
| Other assets |
(33,423 | ) | ||
| Increase (Decrease) in: |
||||
| Payable for interest |
921,131 | |||
| Payable for investments purchased – regular settlement |
5,751 | |||
| Payable investments purchased – when-issued/delayed-delivery settlement |
(2,927,735 | ) | ||
| Payable for unfunded senior loans |
(135,999 | ) | ||
| Payable for shares redeemed |
||||
| Accrued custodian fees |
(43,244 | ) | ||
| Accrued investor relations fees |
7,207 | |||
| Accrued management fees |
(44,966 | ) | ||
| Accrued Trustees fees |
5,242 | |||
| Accrued professional fees |
(3,725 | ) | ||
| Accrued shareholder reporting expenses |
(10,679 | ) | ||
| Accrued shareholder servicing agent fees |
(273 | ) | ||
| Accrued other expenses |
(1,249 | ) | ||
| Net realized (gain) loss from: |
||||
| Investments |
17,049,938 | |||
| Options written |
(1,696 | ) | ||
| Paydowns |
(2,275 | ) | ||
| Change in net unrealized appreciation (depreciation) of: |
||||
| Investments |
(40,013,550 | ) | ||
| Forward foreign currency exchange contracts |
7,366 | |||
| Options written |
68,513 | |||
| Net cash provided by (used in) operating activities |
47,992,364 | |||
| Cash Flows from Financing Activities |
||||
| (Repayments of) borrowings |
(36,000,000 | ) | ||
| Proceeds from reverse repurchase agreements |
31,489,000 | |||
| (Repayments of) reverse repurchase agreements |
(32,530,770 | ) | ||
| Increase (Decrease) in cash overdraft |
(203,036 | ) | ||
| Cash distributions paid to common shareholders |
(10,125,844 | ) | ||
| Net cash provided by (used in) financing activities |
(47,370,650 | ) | ||
| Net Increase (Decrease) in Cash and Cash Denominated in Foreign Currencies |
621,714 | |||
| Cash and cash denominated in foreign currencies at the beginning of period |
11,781 | |||
| Cash and cash denominated in foreign currencies at the end of period |
$ | 633,495 | ||
| The following table provides a reconciliation of cash and cash denominated in foreign currencies to the statement of assets and liabilities: |
||||
| Cash |
$ | 554,045 | ||
| Cash denominated in foreign currencies |
79,450 | |||
| Total cash and cash denominated in foreign currencies |
$ | 633,495 | ||
| Supplemental Disclosure of Cash Flow Information | NMAI | |||
| Cash paid for interest (excluding costs) |
$ | 6,048,483 | ||
See Notes to Financial Statements
53
The following data is for a common share outstanding for each fiscal year end unless otherwise noted:
| Investment Operations | Less Distributions to Common Shareholders |
Common Share | ||||||||||||||||||||||||||||||||||
| Beginning Common Share Net Asset Value |
Net (Loss)(a) |
Net Realized/ Unrealized Gain(Loss) |
Total | From |
From Realized |
Total | Ending Net Asset Value |
Ending Share Price |
||||||||||||||||||||||||||||
| NMAI |
|
|||||||||||||||||||||||||||||||||||
| 6/30/23(d) |
$ | 13.41 | $ | 0.18 | $ | 0.69 | $ | 0.87 | $ | (0.60 | ) | $ | — | $ | (0.60 | ) | $ | 13.68 | $ | 11.66 | ||||||||||||||||
| 12/31/2022 |
20.03 | 0.47 | (4.86 | ) | (4.39 | ) | (1.40 | ) | (0.83 | ) | (2.23 | ) | 13.41 | 11.49 | ||||||||||||||||||||||
| 12/31/2021(f) |
20.00 | 0.07 | 0.31 | 0.38 | (0.06 | ) | (0.29 | ) | (0.35 | ) | 20.03 | 18.65 | ||||||||||||||||||||||||
The following table sets forth information regarding the Fund’s outstanding senior securities as of end of the Fund’s current and prior fiscal periods.
| Borrowings at the End of Period | ||||||||
| Aggregate Amount Outstanding (000)(g) |
Asset Coverage Per $1,000(h) |
|||||||
| NMAI |
||||||||
| 6/30/23(d) |
$ | 139,601 | $ | 4,275 | ||||
| 12/31/2022 |
175,601 | 3,553 | ||||||
| 12/31/2021(f) |
178,550 | 4,750 | ||||||
54
| Common Share Supplemental Data/ Ratios Applicable to Common Shares |
||||||||||||||||||||||
| Common Share Total Returns |
Ratio to Average Net Assets | |||||||||||||||||||||
| Based on Net Asset Value(b) |
Based |
Ending Net Assets (000) |
Expenses(c) | Net Investment Income(Loss)(c) |
Portfolio Turnover Rate |
|||||||||||||||||
| 6.55 | % | 6.84 | % | $ | 457,206 | 3.99 | %(e) | 2.63 | %(e) | 19 | % | |||||||||||
| (21.91 | ) | (26.29 | ) | 448,357 | 2.53 | 2.88 | 129 | |||||||||||||||
| 1.90 | (5.00 | ) | 669,611 | 1.63 | (e) | 3.35 | (e) | 66 | ||||||||||||||
| (a) | Based on average shares outstanding. |
| (b) | Percentage is not annualized. |
| (c) | • Net Investment Income (Loss) ratios reflect income earned and expenses incurred on assets attributable to borrowings and/or reverse repurchase agreements (as described in Notes to Financial Statements), where applicable. |
| •Each ratio includes the effect of all interest expense paid and other costs related to borrowings and/or reverse repurchase agreements as follows: |
| Ratios of Interest Expense to Average Net Assets Applicable to Common Shares |
||||
| NMAI |
||||
| 6/30/2023(d) |
2.58 | %(e) | ||
| 12/31/2022 |
1.04 | |||
| 12/31/2021(f) |
0.21 | (e) | ||
| (d) | Unaudited. |
| (e) | Annualized. |
| (f) | For the period November 22, 2021 (commencement of operations) through December 31, 2021. |
| (g) | Aggregate Amount Outstanding: Aggregate amount outstanding represents the liquidation preference as of the end of the relevant fiscal year. |
| (h) | Asset Coverage Per $1,000: Asset coverage per $1,000 of debt is calculated by subtracting the Fund’s liabilities and indebtedness not represented by senior securities from the Fund’s total assets, dividing the result by the aggregate amount of the Fund’s senior securities representing indebtedness then outstanding, and multiplying the result by 1,000. |
See Notes to Financial Statements
55
(Unaudited)
1. General Information
Fund Information: Nuveen Multi-Asset Income Fund (the “Fund”) is registered under the Investment Company Act of 1940 (the “1940 Act”), as amended, as a diversified closed-end management investment company. The Fund’s common shares are listed on the New York Stock Exchange (“NYSE”) and trade under the ticker symbol “NMAI.” The Fund was organized as a Massachusetts business trust on April 22, 2021.
Current Fiscal Period: The end of the reporting period for the Fund is June 30, 2023, and the period covered by these Notes to Financial Statements is the six months ended June 30, 2023 (the “current fiscal period”).
Investment Adviser and Sub-Adviser: The Fund’s investment adviser is Nuveen Fund Advisors, LLC (the “Adviser”), a subsidiary of Nuveen, LLC (“Nuveen”). Nuveen is the investment management arm of Teachers Insurance and Annuity Association of America (TIAA). The Adviser has overall responsibility for management of the Fund, oversees the management of the Fund’s portfolio, manages the Fund’s business affairs and provides certain clerical, bookkeeping and other administrative services. The Adviser has entered into sub-advisory agreements (each a “Sub-Advisory Agreement”) with each of Nuveen Asset Management, LLC (“NAM”), Teachers Advisors, LLC (“TAL”) and Winslow Capital Management LLC (“Winslow”) (NAM, TAL and Winslow are each a “Sub-Adviser”), each of which are affiliates of the Adviser. Pursuant to the Sub-Advisory Agreement with NAM, NAM is responsible for the Fund’s dynamic asset allocation strategy and for allocating the Fund’s assets among each of the various Sub-Advisers. NAM, TAL and Winslow under each Sub-Advisory Agreement manages the investment portfolios of the Fund allocated to it.
Developments Regarding the Fund’s Control Share By-Law: On October 5, 2020, the Fund and certain other closed-end funds in the Nuveen fund complex amended their by-laws. Among other things, the amended by-laws included provisions pursuant to which, in summary, a shareholder who obtains beneficial ownership of common shares in a Control Share Acquisition (as defined in the by-laws) shall have the same voting rights as other common shareholders only to the extent authorized by the other disinterested shareholders (the “Control Share By-Law”). On January 14, 2021, a shareholder of certain Nuveen closed-end funds filed a civil complaint in the U.S. District Court for the Southern District of New York (the “District Court”) against certain Nuveen funds and their trustees, seeking a declaration that such funds’ Control Share By-Laws violate the 1940 Act, rescission of such fund’s Control Share By-Laws and a permanent injunction against such funds applying the Control Share By-Laws. On February 18, 2022, the District Court granted judgment in favor of the plaintiff’s claim for rescission of such funds’ Control Share By-Laws and the plaintiff’s declaratory judgment claim, and declared that such funds’ Control Share By-Laws violate Section 18(i) of the 1940 Act. Following review of the judgment of the District Court, on February 22, 2022, the Fund’s Board of Trustees (the “Board”) amended the Fund’s bylaws to provide that the Fund’s Control Share By-Law shall be of no force and effect for so long as the judgment of the District Court is effective and that if the judgment of the District Court is reversed, overturned, vacated, stayed, or otherwise nullified, the Fund’s Control Share By-Law will be automatically reinstated and apply to any beneficial owner of common shares acquired in a Control Share Acquisition, regardless of whether such Control Share Acquisition occurs before or after such reinstatement, for the duration of the stay or upon issuance of the mandate reversing, overturning, vacating or otherwise nullifying the judgment of the District Court. On February 25, 2022, the Board and the Fund appealed the District Court’s decision to the U.S. Court of Appeals for the Second Circuit.
2. Significant Accounting Policies
The accompanying financial statements were prepared in accordance with accounting principles generally accepted in the United States of America (“U.S. GAAP”), which may require the use of estimates made by management and the evaluation of subsequent events. Actual results may differ from those estimates. The Fund is an investment company and follows the accounting guidance in the Financial Accounting Standards Board (“FASB”) Accounting Standards Codification 946, Financial Services – Investment Companies. The net asset value (“NAV”) for financial reporting purposes may differ from the NAV for processing security and common share transactions. The NAV for financial reporting purposes includes security and common share transactions through the date of the report. Total return is computed based on the NAV used for processing security and common share transactions. The following is a summary of the significant accounting policies consistently followed by the Fund.
Compensation: The Fund pays no compensation directly to those of its officers, all of whom receive remuneration for their services to the Fund from the Adviser or its affiliates. The Board has adopted a deferred compensation plan for independent trustees that enables trustees to elect to defer receipt of all or a portion of the annual compensation they are entitled to receive from certain Nuveen-advised funds. Under the plan, deferred amounts are treated as though equal dollar amounts had been invested in common shares of select Nuveen-advised funds.
Distributions to Common Shareholders: Distributions to common shareholders are recorded on the ex-dividend date. The amount, character and timing of distributions are determined in accordance with federal income tax regulations, which may differ from U.S. GAAP.
The Fund makes quarterly cash distributions to common shareholders of a stated dollar amount per share. Subject to approval and oversight by the Board, the Fund seeks to maintain a stable distribution level designed to deliver the long-term return potential of the Fund’s investment strategy through regular quarterly distributions (a “Managed Distribution Program”). Total distributions during a calendar year generally will be made from the Fund’s net
56
investment income, net realized capital gains and net unrealized capital gains in the Fund’s portfolio, if any. The portion of distributions paid attributed to net unrealized gains, if any, is distributed from the Fund’s assets and is treated by shareholders as a nontaxable distribution (“return of capital”) for tax purposes. In the event that total distributions during a calendar year exceed a Fund’s total return on NAV, the difference will reduce NAV per share. If the Fund’s total return on NAV exceeds total distributions during a calendar year, the excess will be reflected as an increase in NAV per share. The final determination of the source and character of all distributions paid by the Fund during the fiscal year is made after the end of the fiscal year and is reflected in the financial statements contained in the annual report as of December 31 each year.
The tax character of Fund distributions for a fiscal year is dependent upon the amount and tax character of distributions received from securities held in a Fund’s portfolio. Distributions received from certain securities in which a Fund invests, most notably real estate investment trust securities, may be characterized for tax purposes as ordinary income, long-term capital gain and/or a return of capital. The issuer of a security reports the tax character of its distributions only once per year, generally during the first two months of the calendar year for the previous year. The distribution is included in a Fund’s ordinary income until such time a Fund is notified by the issuer of the actual tax character.
Foreign Currency Transactions and Translation: To the extent that the Fund invests in securities and/or contracts that are denominated in a currency other than U.S. dollars, the Fund will be subject to currency risk, which is the risk that an increase in the U.S. dollar relative to the foreign currency will reduce returns or portfolio value. Generally, when the U.S. dollar rises in value against a foreign currency, the Fund’s investments denominated in that currency will lose value because its currency is worth fewer U.S. dollars; the opposite effect occurs if the U.S. dollar falls in relative value. Investments and other assets and liabilities denominated in foreign currencies are converted into U.S. dollars on a spot (i.e. cash) basis at the spot rate prevailing in the foreign currency exchange market at the time of valuation. Purchases and sales of investments and income denominated in foreign currencies are translated into U.S. dollars on the respective dates of such transactions.
The books and records of the Fund are maintained in U.S. dollars. Assets, including investments, and liabilities denominated in foreign currencies are translated into U.S. dollars at the end of each day. Purchases and sales of securities, income and expenses are translated into U.S. dollars at the prevailing exchange rate on the respective dates of the transactions.
Net realized foreign currency gains and losses resulting from changes in exchange rates associated with (i) foreign currency, (ii) investments and (iii) derivatives include foreign currency gains and losses between trade date and settlement date of the transactions, foreign currency transactions, and the difference between the amounts of interest and dividends recorded on the books of the Fund and the amounts actually received are recognized as a component of “Net realized gain (loss) from investments and foreign currency” on the Statement of Operations, when applicable.
The unrealized gains and losses resulting from changes in foreign currency exchange rates and changes in foreign exchange rates associated with (i) investments and (ii) other assets and liabilities are recognized as a component of “Change in net unrealized appreciation (depreciation) of investments and foreign currency” on the Statement of Operations, when applicable. The unrealized gains and losses resulting from changes in foreign exchange rates associated with investments in derivatives are recognized as a component of the respective derivative’s related “Change in net unrealized appreciation (depreciation)” on the Statement of Operations, when applicable.
As of the end of the reporting period, the Fund’s investments in non-U.S. securities were as follows:
| Value | % of Total Investments |
|||||||
| Country: |
||||||||
| Japan |
$ | 22,783,295 | 3.4 | % | ||||
| United Kingdom |
21,833,841 | 3.3 | ||||||
| France |
21,116,126 | 3.2 | ||||||
| Netherlands |
13,725,069 | 2.1 | ||||||
| Canada |
13,370,292 | 2.0 | ||||||
| Australia |
12,008,992 | 1.8 | ||||||
| Germany |
11,299,107 | 1.7 | ||||||
| China |
9,454,898 | 1.4 | ||||||
| Spain |
8,729,670 | 1.3 | ||||||
| Mexico |
8,603,438 | 1.3 | ||||||
| Other |
90,344,098 | 13.6 | ||||||
| Total non-U.S. securities |
$ | 233,268,826 | 35.1 | % | ||||
Foreign taxes: The Fund may be subject to foreign taxes on income, gains on investments or currency repatriation, a portion of which may be recoverable. The Fund will accrue such taxes and recoveries as applicable, based upon the current interpretation of tax rules and regulations that exist in the markets in which the Fund invests.
Indemnifications: Under the Fund’s organizational documents, its officers and trustees are indemnified against certain liabilities arising out of the performance of their duties to the Fund. In addition, in the normal course of business, the Fund enters into contracts that provide general indemnifications to other parties. The Fund’s maximum exposure under these arrangements is unknown as this would involve future claims that may be made against the Fund that have not yet occurred. However, the Fund has not had prior claims or losses pursuant to these contracts and expects the risk of loss to be remote.
57
Notes to Financial Statements (Unaudited) (continued)
Investments and Investment Income: Securities transactions are accounted for as of the trade date for financial reporting purposes. Trade date for senior and subordinated loans purchased in the “primary market” is considered the date on which the loan allocations are determined. Trade date for senior and subordinated loans purchased in the “secondary market” is the date on which the transaction is entered into. Realized gains and losses on securities transactions are based upon the specific identification method. Dividend income is recorded on the ex-dividend date or, for foreign securities, when information is available. Non-cash dividends received in the form of stock, if any, are recognized on the ex-dividend date and recorded at fair value. Interest income, which is recorded on an accrual basis and includes accretion of discounts and amortization of premiums for financial reporting purposes. Interest income also reflects payment-in-kind (“PIK”) interest, paydown gains and losses and fee income, if any. PIK interest represents income received in the form of securities in lieu of cash. Fee income consists primarily of amendment fees, when applicable. Amendment fees are earned as compensation for evaluating and accepting changes to an original senior loan agreement and are recognized when received. Rehypothecation income is comprised of fees earned in connection with the rehypothecation of pledged collateral as further described later in these Notes to Financial Statements.
Netting Agreements: In the ordinary course of business, the Fund may enter into transactions subject to enforceable master repurchase agreements, International Swaps and Derivative Association, Inc. (ISDA) master agreements or other similar arrangements (“netting agreements”). Generally, the right to offset in netting agreements allows the Fund to offset certain securities and derivatives with a specific counterparty, when applicable, as well as any collateral received or delivered to that counterparty based on the terms of the agreements. Generally, the Fund manages its cash collateral and securities collateral on a counterparty basis. With respect to certain counterparties, in accordance with the terms of the netting agreements, collateral posted to the Funds is held in a segregated account by the Funds’ custodian and/or with respect to those amounts which can be sold or repledged, are presented in the Funds’ Portfolio of Investments or Statement of Assets and Liabilities.
The Fund’s investments subject to netting agreements as of the end of the reporting period, if any, are further described later in these Notes to Financial Statements.
New Accounting Pronouncements: In March 2020, FASB issued Accounting Standards Update (“ASU”) 2020-04, Reference Rate Reform: Facilitation of the Effects of Reference Rate Reform on Financial Reporting. The main objective of the new guidance is to provide relief to companies that will be impacted by the expected change in benchmark interest rates, when participating banks will no longer be required to submit London Interbank Offered Rate (LIBOR) quotes by the UK Financial Conduct Authority (FCA). The new guidance allows companies to, provided the only changes to existing contracts are a change to an approved benchmark interest rate, account for modifications as a continuance of the existing contract without additional analysis. For new and existing contracts, the Fund may elect to apply the amendments as of March 12, 2020 through December 31, 2022. In December 2022, FASB deferred ASU 2022-04 and issued ASU 2022-06, Reference Rate Reform: Deferral of the Sunset Date of Topic 848, which extends the application of the amendments through December 31, 2024. Management has not yet elected to apply the amendments, is continuously evaluating the potential effect a discontinuation of LIBOR could have on the Fund’s investments and has currently determined that it is unlikely the ASU’s adoption will have a significant impact on the Fund’s financial statements and various filings.
New Accounting Pronouncement: In June 2022, the FASB issued ASU 2022-03 to clarify the guidance in Topic 820, Fair Value Measurement (“Topic 820”). The amendments in ASU 2022-03 affect all entities that have investments in equity securities measured at fair value that are subject to a contractual sale restriction. ASU 2022-03 (1) clarifies the guidance in Topic 820, when measuring the fair value of an equity security subject to contractual restrictions that prohibit the sale of an equity security, (2) amends a related illustrative example, and (3) introduces new disclosure requirements for equity securities subject to contractual sale restrictions that are measured at fair value in accordance with Topic 820. For public business entities, the amendments in ASU 2022-03 are effective for fiscal years beginning after December 15, 2023, and interim periods within those fiscal years. For all other entities, the amendments are effective for fiscal years beginning after December 15, 2024, and interim periods within those fiscal years. Early adoption is permitted for both interim and annual financial statements that have not yet been issued or made available for issuance. Management is currently assessing the impact of these provisions on the Fund’s financial statements.
3. Investment Valuation and Fair Value Measurements
The Fund’s investments in securities are recorded at their estimated fair value utilizing valuation methods approved by the Adviser, subject to oversight of the Board. Fair value is defined as the price that would be received upon selling an investment or transferring a liability in an orderly transaction to an independent buyer in the principal or most advantageous market for the investment. U.S. GAAP establishes the three-tier hierarchy which is used to maximize the use of observable market data and minimize the use of unobservable inputs and to establish classification of fair value measurements for disclosure purposes. Observable inputs reflect the assumptions market participants would use in pricing the asset or liability. Observable inputs are based on market data obtained from sources independent of the reporting entity. Unobservable inputs reflect management’s assumptions about the assumptions market participants would use in pricing the asset or liability. Unobservable inputs are based on the best information available in the circumstances. The following is a summary of the three-tiered hierarchy of valuation input levels.
| Level 1 – | Inputs are unadjusted and prices are determined using quoted prices in active markets for identical securities. | |
| Level 2 – | Prices are determined using other significant observable inputs (including quoted prices for similar securities, interest rates, credit spreads, etc.). | |
| Level 3 – | Prices are determined using significant unobservable inputs (including management’s assumptions in determining the fair value of investments). |
58
A description of the valuation techniques applied to the Fund’s major classifications of assets and liabilities measured at fair value follows:
Equity securities and exchange-traded funds listed or traded on a national market or exchange are valued based on their last reported sales price or official closing price of such market or exchange on the valuation date. Foreign equity securities and registered investment companies that trade on a foreign exchange are valued at the last reported sales price or official closing price on the principal exchange where traded, and converted to U.S. dollars at the prevailing rates of exchange on the valuation date. For events affecting the value of foreign securities between the time when the exchange on which they are traded closes and the time when the Funds’ net assets are calculated, such securities will be valued at fair value in accordance with procedures adopted by the Adviser, subject to the oversight of the Board. To the extent these securities are actively traded and no valuation adjustments are applied, they are generally classified as Level 1. When valuation adjustments are applied to the most recent last sales price or official closing price, these securities are generally classified as Level 2.
Prices of certain American Depositary Receipts (“ADR”) held by the Funds that trade in the United States are valued based on the last traded price, official closing price, or an evaluated price provided by the pricing services and are generally classified as Level 1 or 2.
Prices of fixed-income securities are generally provided by pricing services approved by the Adviser, which is subject to review by the Adviser and oversight of the Board. Pricing services establish a security’s fair value using methods that may include consideration of the following: yields or prices of investments of comparable quality, type of issue, coupon, maturity and rating, market quotes or indications of value from security dealers, evaluations of anticipated cash flows or collateral, general market conditions and other information and analysis, including the obligor’s credit characteristics considered relevant. In pricing certain securities, particularly less liquid and lower quality securities, pricing services may consider information about a security, its issuer or market activity provided by the Adviser. These securities are generally classified as Level 2.
Forward foreign currency contracts are valued using the prevailing forward exchange rate which is derived from quotes provided by the pricing service using the procedures approved by the Adviser, subject to the oversight of the Board and are generally classified as Level 2.
Investments in investment companies are valued at their respective NAVs or share price on the valuation date and are generally classified as Level 1.
Repurchase agreements are valued at contract amount plus accrued interest, which approximates market value. These securities are generally classified as Level 2.
Purchased and written options traded and listed on a national market or exchange are valued at the mean of the closing bid and asked prices and are generally classified as Level 1.
For any portfolio security or derivative for which market quotations are not readily available or for which the Adviser deems the valuations derived using the valuation procedures described above not to reflect fair value, the Adviser will determine a fair value in good faith using alternative procedures approved by the Adviser, subject to the oversight of the Board. As a general principle, the fair value of a security is the amount that the owner might reasonably expect to receive for it in a current sale. A variety of factors may be considered in determining the fair value of such securities, which may include consideration of the following: yields or prices of investments of comparable quality, type of issue, coupon, maturity and rating, market quotes or indications of value from security dealers, evaluations of anticipated cash flows or collateral, general market conditions and other information and analysis, including the obligor’s credit characteristics considered relevant. To the extent the inputs are observable and timely, the values would be classified as Level 2; otherwise they would be classified as Level 3.
59
Notes to Financial Statements (Unaudited) (continued)
The following table summarizes the market value of the Fund’s investments as of the end of the reporting period, based on the inputs used to value them:
| Level 1 | Level 2 | Level 3 | Total | |||||||||||||
| Long-Term Investments: |
||||||||||||||||
| Common Stocks |
$ | 140,055,111 | $ | 127,083,403 | $ | 50,080 | * | $ | 267,188,594 | |||||||
| Asset-Backed and Mortgage-Backed Securities |
— | 81,707,462 | — | 81,707,462 | ||||||||||||
| Variable Rate Senior Loan Interests |
— | 58,115,789 | — | 58,115,789 | ||||||||||||
| Exchange-Traded Funds |
41,098,725 | 13,234,650 | — | 54,333,375 | ||||||||||||
| Real Estate Investment Trust Common Stocks |
42,797,448 | 122,467 | — | 42,919,915 | ||||||||||||
| Emerging Market Debt and Foreign Corporate Bonds |
— | 41,598,360 | — | 41,598,360 | ||||||||||||
| $1,000 Par (or similar) Institutional Preferred |
— | 41,441,224 | — | 41,441,224 | ||||||||||||
| Contingent Capital Securities |
— | 28,225,348 | — | 28,225,348 | ||||||||||||
| $25 Par (or similar) Retail Preferred |
15,384,215 | 2,727,409 | — | 18,111,624 | ||||||||||||
| Corporate Bonds |
— | 8,427,089 | — | 8,427,089 | ||||||||||||
| Warrants |
— | 505,900 | — | 505,900 | ||||||||||||
| Investment Companies |
— | 289,331 | — | 289,331 | ||||||||||||
| Options Purchased |
753 | — | — | 753 | ||||||||||||
| Short-Term Investments: |
||||||||||||||||
| Repurchase Agreements |
— | 21,986,021 | — | 21,986,021 | ||||||||||||
| Investment in Derivatives: |
||||||||||||||||
| Options Written |
(128,810 | ) | — | — | (128,810 | ) | ||||||||||
| Forward Foreign Currency Contracts** |
— | (7,366 | ) | — | (7,366 | ) | ||||||||||
| Total |
$ | 239,207,442 | $ | 425,457,087 | $ | 50,080 | $ | 664,714,609 | ||||||||
| * | Refer to the Fund’s Portfolio of Investments for securities classified as Level 3. |
| ** | Represents net unrealized appreciation (depreciation) as reported in the Fund’s Portfolio of Investments. |
4. Portfolio Securities
Unfunded Commitments: Pursuant to the terms of certain of the variable rate senior loan agreements, the Fund may have unfunded senior loan commitments. The Fund will maintain with its custodian, cash, liquid securities and/or liquid senior loans having an aggregate value at least equal to the amount of unfunded senior loan commitments. As of the end of the reporting period, the Fund had $5,325 in outstanding unfunded senior loan commitments.
Participation Commitments: With respect to the senior loans held in the Fund’s portfolio, the Fund may: 1) invest in assignments; 2) act as a participant in primary lending syndicates; or 3) invest in participations. If the Fund purchases a participation of a senior loan interest, the Fund would typically enter into a contractual agreement with the lender or other third party selling the participation, rather than directly with the borrower. As such, the Fund not only assumes the credit risk of the borrower, but also that of the selling participant or other persons interpositioned between the Fund and the borrower. As of the end of the reporting period, the Fund had no such outstanding participation commitments.
Repurchase Agreements: In connection with transactions in repurchase agreements, it is the Fund’s policy that its custodian take possession of the underlying collateral securities, the fair value of which exceeds the principal amount of the repurchase transaction, including accrued interest, at all times. If the counterparty defaults, and the fair value of the collateral declines, realization of the collateral may be delayed or limited.
The following table presents the repurchase agreements for the Fund that are subject to netting agreements as of the end of the reporting period, and the collateral delivered related to those repurchase agreements.
| Counterparty | Short-Term Investments, at Value |
Collateral Pledged (From) Counterparty |
||||||
| Fixed Income Clearing Corporation |
$ | 21,986,021 | $ | (22,425,830 | ) | |||
Zero Coupon Securities: A zero coupon security does not pay a regular interest coupon to its holders during the life of the security. Income to the holder of the security comes from accretion of the difference between the original purchase price of the security at issuance and the par value of the security at maturity and is effectively paid at maturity. The market prices of zero coupon securities generally are more volatile than the market prices of securities that pay interest periodically.
Purchases & Sales: Long-term purchases and sales during the current fiscal period were as follows:
| Fund | Purchases | Sales and Maturities |
||||||
| NMAI |
122,493,915 | 184,208,639 | ||||||
60
The Fund may purchase securities on a when-issued or delayed-delivery basis. Securities purchased on a when-issued or delayed-delivery basis may have extended settlement periods; interest income is not accrued until settlement date. Any securities so purchased are subject to market fluctuation during this period. The Fund has earmarked securities in its portfolio with a current value at least equal to the amount of the when-issued/delayed-delivery purchase commitments. If the Fund has outstanding when-issued/delayed-delivery purchases commitments as of the end of the reporting period, such amounts are recognized on the Statement of Assets and Liabilities.
5. Derivative Investments
The Fund is authorized to invest in certain derivative instruments. As defined by U.S. GAAP, a derivative is a financial instrument whose value is derived from an underlying security price, foreign exchange rate, interest rate, index of prices or rates, or other variables.
Options Transactions: During the current fiscal period, the Fund purchased put and call options as part of its overwrite strategy.
During the current fiscal period, the Fund wrote call options on U.S. equity indexes while investing in a portfolio that included U.S. equities to generate additional income and provide downside protection.
The Funds may purchase (buy) or write (sell) put and call options on specific securities (including groups or “baskets” of specific securities), interest rates, stock indices and/or bond indices (each a “financial instrument”). Options can be settled either directly with the counterparty (over the counter) or through a central clearing house (exchange traded). Call and put options give the holder the right, in return for a premium paid, to purchase or sell, respectively, a financial instrument at a specified exercise price at any time during the period of the option.
When a Fund purchases an option, an amount equal to the premium paid (the premium plus commission) is recognized as an asset on the Statement of Asset and Liabilities. When a Fund writes an option, an amount equal to the net premium received (the premium less commission) is recognized as a liability on the Statement of Assets and Liabilities and is subsequently adjusted to reflect the current value of the written option until the option is exercised or expires or the Fund enters into a closing purchase transaction. The changes in the value of options purchased and/or written during the fiscal period are recognized as in unrealized appreciation (depreciation) on the Statement of Operations. When an option expires, the premiums received or paid are recognized as realized gains or losses on the Statement of Operations. When an option is exercised or a closing purchase transaction is entered into, the difference between the premium and the amount received or paid in a closing transaction is recognized as a realized gain or loss on the Statement of Operations.
The market risk associated with purchasing options is limited to the premium paid. The Fund, as writer of an option, has no control over whether the underlying instrument may be sold (called) or purchased (put) and as a result bears the risk of an unfavorable change in the market value of the instrument underlying the written option. There is also the risk the Fund may not be able to enter into a closing transaction because of an illiquid market.
The average notional amount of outstanding options purchased during the current fiscal period, was as follows:
| Fund | Average Notional Amount of Options Contracts Purchased Outstanding* |
|||
| NMAI |
$ | 67,333 | ||
| * | The average notional amount is calculated based on the absolute aggregate notional amount of contracts outstanding at the beginning of the current fiscal period and at the end of each quarter within the current fiscal period. |
| Fund | Average Notional Amount of Options Contracts Written Outstanding* |
|||
| NMAI |
(6,166,667 | ) | ||
| * | The average notional amount is calculated based on the absolute aggregate notional amount of contracts outstanding at the beginning of the current fiscal period and at the end of each quarter within the current fiscal period. |
Forward Foreign Currency Contracts: During the current fiscal period, NMAI used forward foreign currency contracts to hedge exposure to non-U.S. Dollar denominated positions.
A forward contract is an agreement between two parties to purchase or sell a specified quantity of a currency at or before a specified date in the future at a specified price. Non-deliverable forward foreign currency exchange contracts are settled with the counterparty in cash without the delivery of foreign currency. Forward contracts are typically traded in the over-the-counter (“OTC”) markets and all details of the contract are negotiated between the counterparties to the agreement. Forward contracts are marked-to-market daily and any resulting unrealized gains or losses are reflected as appreciation or depreciation on the Statements of Assets and Liabilities. The Fund realizes gains and losses at the time the forward contracts are closed and are included on the Statement of Operations. Risks may arise upon entering into forward contracts from unanticipated movements in the value of a foreign currency relative to the U.S. dollar; and that losses may exceed amounts recognized on the Statements of Assets and Liabilities.
61
Notes to Financial Statements (Unaudited) (continued)
The average notional amount of forward foreign currency contracts outstanding during the current fiscal period was as follows:
| Fund | Average Notional Amount of Forward Foreign Currency Contracts Outstanding* |
|||
| NMAI |
230,751 | |||
| * | The average notional amount is calculated based on the outstanding notional at the beginning of the current fiscal period and at the end of each fiscal quarter within the current fiscal period. |
The following table presents the forward foreign currency contracts subject to netting agreements and the collateral delivered related to those forward foreign currency contracts as of the end of the reporting period.
| Fund | Counterparty | Gross Unrealized Appreciation on Forward Foreign Currency Contracts* |
Gross Unrealized (Depreciation) on Forward Foreign Currency Contracts* |
Net Unrealized Appreciation (Depreciation) on Forward Foreign Currency Contracts |
Collateral Pledged to (from) Counterparty |
Net Exposure |
||||||||||||
| NMAI |
Morgan Stanley Capital Services LLC |
$ — | $(7,366) | $ | (7,366 | ) | $ | — | $ | (7,366 | ) | |||||||
| * | Represents gross unrealized appreciation (depreciation) for the counterparty as reported in the Funds’ Portfolio of Investments. |
Market and Counterparty Credit Risk: In the normal course of business the Fund may invest in financial instruments and enter into financial transactions where risk of potential loss exists due to changes in the market (market risk) or failure of the other party to the transaction to perform (counterparty credit risk). The potential loss could exceed the value of the financial assets recorded on the financial statements. Financial assets, which potentially expose the Fund to counterparty credit risk, consist principally of cash due from counterparties on forward, option and swap transactions, when applicable. The extent of the Fund’s exposure to counterparty credit risk in respect to these financial assets approximates their carrying value as recorded on the Statement of Assets and Liabilities.
The Fund helps manage counterparty credit risk by entering into agreements only with counterparties the Adviser believes have the financial resources to honor their obligations and by having the Adviser monitor the financial stability of the counterparties. Additionally, counterparties may be required to pledge collateral daily (based on the daily valuation of the financial asset) on behalf of the Fund with a value approximately equal to the amount of any unrealized gain above a pre-determined threshold. Reciprocally, when the Fund has an unrealized loss, the Fund has instructed the custodian to pledge assets of the Fund as collateral with a value approximately equal to the amount of the unrealized loss above a pre-determined threshold. Collateral pledges are monitored and subsequently adjusted if and when the valuations fluctuate, either up or down, by at least the pre-determined threshold amount.
As of the end of the reporting period, the Fund has invested in derivative contracts, which are reflected in the Statements of Assets and Liabilities, as follows:
| Derivative Instrument |
Risk Exposure | Asset Derivatives |
Liability Derivatives |
|||||||||||||||
| Location | Value | Location | Value | |||||||||||||||
| NMAI | ||||||||||||||||||
| Options Purchased | Equity | Long-term investments, at value | $ | 753 | — | $ | — | |||||||||||
| Options Written | Equity | — | — | Options written, at value | (128,810 | ) | ||||||||||||
| Forward Foreign Currency Contracts | Foreign currency exchange rate | — | — | Unrealized depreciation on forward foreign currency contracts | (7,366 | ) | ||||||||||||
During the current fiscal period, the effect of derivative contracts on the Fund’s Statement of Operations was as follows:
| Derivative Instrument | Risk Exposure | Net Realized Gain (Loss) | Change in Unrealized Appreciation (Depreciation) |
|||||||
| NMAI | ||||||||||
| Options Purchased |
Equity | $ | — | $ | (3,008 | ) | ||||
| Options Written |
Equity | 1,696 | (68,513 | ) | ||||||
| Forward Foreign Currency Contracts |
Foreign currency exchange rate | — | (7,366 | ) | ||||||
62
6. Fund Shares
Common Share Transactions: The fund did not have any transactions in common shares during the current or prior fiscal period.
7. Income Tax Information
The Fund intends to distribute substantially all of its net investment income and net capital gains to shareholders and otherwise comply with the requirements of Subchapter M of the Internal Revenue Code applicable to regulated investment companies. Therefore, no federal income tax provision is required.
The Fund files income tax returns in U.S. federal and applicable state and local jurisdictions. A Fund’s federal income tax returns are generally subject to examination for a period of three fiscal years after being filed. State and local tax returns may be subject to examination for an additional period of time depending on the jurisdiction. Management has analyzed the Fund’s tax positions taken for all open tax years and has concluded that no provision for income tax is required in the Fund’s financial statements.
As of the end of the reporting period, the aggregate cost and the net unrealized appreciation/(depreciation) of all investments for federal income tax purposes were as follows:
| Fund | Tax Cost | Gross Unrealized Appreciation |
Gross Unrealized (Depreciation) |
Net Unrealized Appreciation (Depreciation) |
||||||||
| NMAI | $664,747,734 |
$57,266,001 |
$ | (57,299,126 | ) | $ | (33,125 | ) | ||||
For purposes of this disclosure, tax cost generally includes the cost of portfolio investments as well as up-front fees or premiums exchanged on derivatives and any amounts unrealized for income statement reporting but realized income and/or capital gains for tax reporting, if applicable.
As of prior fiscal period end, the components of accumulated earnings on a tax basis were as follows:
| Fund | Undistributed Ordinary Income |
Undistributed Long-Term Capital Gains |
Unrealized Appreciation (Depreciation) |
Capital Loss Carryforwards |
Late-Year Loss Deferrals |
Other Book-to-Tax Differences |
Total | |||||||||||||||||||||
| NMAI |
$ | 6,328,379 | $ | — | $ | (39,876,343 | ) | $ | (5,073,093 | ) | $ | — | $ | — | $ | (38,621,057 | ) | |||||||||||
As of prior fiscal period end, the Fund had capital loss carryforwards, which will not expire:
| Fund | Short-Term | Long-Term | Total | |||||||
| NMAI | $5,073,093 | $ | — | $ | 5,073,093 | |||||
8. Management Fees
The Fund’s management fee compensates the Adviser for overall investment advisory and administrative services and general office facilities. The Sub-Advisers are compensated for their services to the Fund from the management fees paid to the Adviser.
The Fund’s management fee consists of two components – a fund-level fee, based only on the amount of assets within the Fund, and a complex-level fee, based on the aggregate amount of all eligible fund assets managed by the Adviser. This pricing structure enables Fund shareholders to benefit from growth in the assets within the Fund as well as from growth in the amount of complex-wide assets managed by the Adviser.
The annual fund-level fee, payable monthly, is calculated according to the following schedule:
| Average Daily Managed Assets* | Fund-Level Fee Rate | |||
| For the first $500 million |
0.7000 | % | ||
| For the next $500 million |
0.6750 | |||
| For the next $500 million |
0.6500 | |||
| For the next $500 million |
0.6250 | |||
| For managed assets over $2 billion |
0.6000 | |||
63
Notes to Financial Statements (Unaudited) (continued)
The annual complex-level fee, payable monthly, is calculated by multiplying the current complex-wide fee rate, determined according to the following schedule by the Fund’s daily managed assets:
| Complex-Level Eligible Asset Breakpoint Level* | Effective Complex-Level Fee Rate at Breakpoint Level |
|||
| $55 billion |
0.2000 | % | ||
| $56 billion |
0.1996 | |||
| $57 billion |
0.1989 | |||
| $60 billion |
0.1961 | |||
| $63 billion |
0.1931 | |||
| $66 billion |
0.1900 | |||
| $71 billion |
0.1851 | |||
| $76 billion |
0.1806 | |||
| $80 billion |
0.1773 | |||
| $91 billion |
0.1691 | |||
| $125 billion |
0.1599 | |||
| $200 billion |
0.1505 | |||
| $250 billion |
0.1469 | |||
| $300 billion |
0.1445 | |||
| * | For the complex-level fees, managed assets include closed-end fund assets managed by the Adviser that are attributable to certain types of leverage. For these purposes, leverage includes the funds’ use of preferred stock and borrowings and certain investments in the residual interest certificates (also called inverse floating rate securities) in tender option bond (TOB) trusts, including the portion of assets held by a TOB trust that has been effectively financed by the trust’s issuance of floating rate securities, subject to an agreement by the Adviser as to certain funds to limit the amount of such assets for determining managed assets in certain circumstances. The complex-level fee is calculated based upon the aggregate daily managed assets of all Nuveen open-end and closed-end funds that constitute “eligible assets.” Eligible assets do not include assets attributable to investments in other Nuveen funds or assets in excess of a determined amount (originally $2 billion) added to the Nuveen fund complex in connection with the Adviser’s assumption of the management of the former First American Funds effective January 1, 2011, but do not included certain assets of certain Nuveen funds that were reorganized into funds advised by an affiliate of the Adviser during the 2019 calendar year. As of June 30, 2023, the complex-level fee for the Fund: |
| Fund | Complex-Level Fee | |||
| NMAI |
0.1595 | % | ||
Other Transactions with Affiliates
The Fund is permitted to purchase or sell securities from or to certain other funds or accounts managed by the Sub-Adviser (“Affiliated Entity”) under specified conditions outlined in procedures adopted by the Board (“cross-trade”). These procedures have been designed to ensure that any cross-trade of securities by the Fund from or to an Affiliated Entity by virtue of having a common investment adviser (or affiliated investment adviser), common officer and/or common trustee complies with Rule 17a-7 under the 1940 Act. These transactions are effected at the current market price (as provided by an independent pricing service) without incurring broker commissions.
During the current fiscal period, the Fund engaged in cross-trades pursuant to these procedures as follows:
| Cross-Trades | ||||
| Purchases |
$ | — | ||
| Sales |
4,633 | |||
| Realized gain (loss) |
(1,335 | ) | ||
9. Fund Leverage
Borrowings: The Fund has entered into a $300,000,000 (maximum commitment amount) borrowing arrangements (“Borrowings”) as a means of leverage. As of the end of the reporting period, the outstanding balance on these Borrowings was $139,601,000.
Interest is charged on the Borrowings at a rate per annum equal to OBFR (Overnight Bank Funding Rate) plus a spread that is determined by a portion of the underlying collateral pledged to secure the amount borrowed. The Fund is charged an undrawn fee of 0.50% per annum if the undrawn portion of the Borrowings on that day is more than 20% of the maximum commitment amount, however this fee was waived during the reporting period.
During the current fiscal period, the average daily balance outstanding and average annual interest rate on these Borrowings were $154,838,569 and 5.25%, respectively.
In order to maintain these Borrowings, the Fund must meet certain collateral, asset coverage and other requirements. The Fund’s Borrowings outstanding is fully secured by eligible securities held in its portfolio of investments (“Pledged Collateral”).
64
Borrowings outstanding are recognized as “Borrowings” on the Statement of Assets and Liabilities. Interest expense incurred on the borrowed amount and undrawn balance are recognized as components of “Interest expense” on the Statement of Operations.
Rehypothecation: The Fund has entered into a Rehypothecation Side Letter (“Side Letter”) with its prime brokerage lender, allowing it to re-register the Pledged Collateral in its own name or in a name other than the Fund’s to pledge, repledge, hypothecate, rehypothecate, sell, lend or otherwise transfer or use the Pledged Collateral (the “Hypothecated Securities”) with all rights of ownership as described in the Side Letter. Subject to certain conditions, the total value of the outstanding Hypothecated Securities shall not exceed the lesser of (i) 98% of the outstanding balance on the Borrowings to which the Pledged Collateral relates and (ii) 331⁄3% of the Fund’s total assets. The Fund may designate any Pledged Collateral as ineligible for rehypothecation. The Fund may also recall Hypothecated Securities on demand.
The Fund also has the right to apply and set-off an amount equal to one-hundred percent (100%) of the then-current fair market value of such Pledged Collateral against the current Borrowings under the Side Letter in the event that the prime brokerage lender fails to timely return the Pledged Collateral and in certain other circumstances. In such circumstances, however, the Fund may not be able to obtain replacement financing required to purchase replacement securities and, consequently, the Fund’s income generating potential may decrease. Even if the Fund is able to obtain replacement financing, it might not be able to purchase replacement securities at favorable prices.
The Fund will receive a fee in connection with the Hypothecated Securities (“Rehypothecation Fees”) in addition to any principal, interest, dividends and other distributions paid on the Hypothecated Securities.
As of the end of the reporting period, the Fund had Hypothecated Securities totaling $113,009,627. During the current fiscal period, the Fund earned $23,900 from Rehypothecation Fees.
Reverse Repurchase Agreements: During the current fiscal period, the Fund utilized reverse repurchase agreements as a means of leverage.
The Fund may enter into a reverse repurchase agreement with brokers, dealers, banks or other financial institutions that have been determined by the Adviser to be creditworthy. In a reverse repurchase agreement, a Fund sells to the counterparty a security that it holds with a contemporaneous agreement to repurchase the same security at an agreed-upon price and date, reflecting the interest rate effective for the term of the agreement. It may also be viewed as the borrowing of money by the Fund. Cash received in exchange for securities delivered, plus accrued interest payments to be made by the Fund to a counterparty, are reflected as a liability on the Statement of Assets and Liabilities. Interest payments made by the Fund to counterparties are recognized as a component of “Interest expense” on the Statement of Operations.
In a reverse repurchase agreement, the Fund retains the risk of loss associated with the sold security. Reverse repurchase agreements also involve the risk that the purchaser fails to return the securities as agreed upon, files for bankruptcy or becomes insolvent. Upon a bankruptcy or insolvency of a counterparty, the Fund is considered to be an unsecured creditor with respect to excess collateral and as such the return of excess collateral may be delayed.
As of the end of the reporting period, the Fund’s outstanding balances on its reverse repurchase agreement were as follows:
| Counterparty | Coupon | Principal Amount |
Maturity | Value | Value and Accrued Interest |
|||||||||||||||
| BNP Paribas |
SOFR+0.26 | % | $ | (43,127,980 | ) | 35-day Evergreen | $ | (43,127,980 | ) | $ | (44,856,313 | ) | ||||||||
| RBC Capital Markets, LLC |
4.80 | % | (15,724,000 | ) | On-Demand | (15,724,000 | ) | (15,950,906 | ) | |||||||||||
| $ | (58,851,980 | ) | $ | (58,851,980 | ) | $ | (60,807,219 | ) | ||||||||||||
During the Fund’s utilization period(s) during the current fiscal period, the average daily balance outstanding and average interest rate on the Fund’s reverse repurchase agreement were as follows:
| Utilization period (days outstanding) |
181 | |||
| Average daily balance outstanding |
$ | (59,633,230 | ) | |
| Weighted average interest rate |
4.79 | % |
The following table presents the reverse repurchase agreements subject to netting agreements and the collateral delivered related to those reverse repurchase agreements.
| Counterparty | Reverse Repurchase Agreements* |
Collateral Pledged to Counterparty |
||||||
| BNP Paribas |
$ | (44,856,313 | ) | $ | 48,285,944 | |||
| RBC Capital Markets, LLC |
(15,950,906 | ) | 15,831,872 | |||||
| $ | (60,807,219 | ) | $ | 64,117,816 | ||||
| * | Represents gross value and accrued interest for the counterparty as reported in the preceding table. |
65
Notes to Financial Statements (Unaudited) (continued)
10. Inter-Fund Borrowing and Lending
Inter-Fund Borrowing and Lending: The SEC has granted an exemptive order permitting registered open-end and closed-end Nuveen funds to participate in an inter-fund lending facility whereby the Nuveen funds may directly lend to and borrow money from each other for temporary purposes (e.g., to satisfy redemption requests or when a sale of securities “fails,” resulting in an unanticipated cash shortfall) (the “Inter-Fund Program”). The closed-end Nuveen funds, including the Fund covered by this shareholder report, will participate only as lenders, and not as borrowers, in the Inter-Fund Program because such closed-end funds rarely, if ever, need to borrow cash to meet redemptions. The Inter-Fund Program is subject to a number of conditions, including, among other things, the requirements that (1) no fund may borrow or lend money through the Inter-Fund Program unless it receives a more favorable interest rate than is typically available from a bank or other financial institution for a comparable transaction; (2) no fund may borrow on an unsecured basis through the Inter-Fund Program unless the fund’s outstanding borrowings from all sources immediately after the inter-fund borrowing total 10% or less of its total assets; provided that if the borrowing fund has a secured borrowing outstanding from any other lender, including but not limited to another fund, the inter-fund loan must be secured on at least an equal priority basis with at least an equivalent percentage of collateral to loan value; (3) if a fund’s total outstanding borrowings immediately after an inter-fund borrowing would be greater than 10% of its total assets, the fund may borrow through the inter-fund loan on a secured basis only; (4) no fund may lend money if the loan would cause its aggregate outstanding loans through the Inter-Fund Program to exceed 15% of its net assets at the time of the loan; (5) a fund’s inter-fund loans to any one fund shall not exceed 5% of the lending fund’s net assets; (6) the duration of inter-fund loans will be limited to the time required to receive payment for securities sold, but in no event more than seven days; and (7) each interfund loan may be called on one business day’s notice by a lending fund and may be repaid on any day by a borrowing fund. In addition, a Nuveen fund may participate in the Inter-Fund Program only if and to the extent that such participation is consistent with the fund’s investment objective and investment policies. The Board is responsible for overseeing the Inter-Fund Program.
The limitations detailed above and the other conditions of the SEC exemptive order permitting the Inter-Fund Program are designed to minimize the risks associated with Inter-Fund Program for both the lending fund and the borrowing fund. However, no borrowing or lending activity is without risk. When a fund borrows money from another fund, there is a risk that the loan could be called on one day’s notice or not renewed, in which case the fund may have to borrow from a bank at a higher rate or take other actions to payoff such loan if an inter-fund loan is not available from another fund. Any delay in repayment to a lending fund could result in a lost investment opportunity or additional borrowing costs.
During the current reporting period, the Fund did not enter into any inter-fund loan activity.
66
Considerations (Unaudited)
Fund shares are not guaranteed or endorsed by any bank or other insured depository institution, and are not federally insured by the Federal Deposit Insurance Corporation.
Nuveen Multi-Asset Income Fund (NMAI)
Investing in closed-end funds involves risk; principal loss is possible. There is no guarantee the Fund’s investment objectives will be achieved. Closed-end fund shares may frequently trade at a discount or premium to their net asset value. Allocation Risk. The Fund’s ability to achieve its investment objective depends upon the Fund’s sub-adviser’s Nuveen Asset Management’s skill in determining the Fund’s allocation to different sub-advisers and strategies. There is the risk that Fund’s sub-adviser Nuveen Asset Management’s evaluations and assumptions used in making such allocations may be incorrect. Leverage increases return volatility and magnifies the Fund’s potential return and its risks; there is no guarantee a fund’s leverage strategy will be successful. Common stocks have experienced significantly more volatility in returns and may significantly underperform relative to debt securities during certain periods. Preferred securities are subordinated to bonds and other debt instruments in a company’s capital structure, and therefore are subject to greater credit risk. Issuers of debt instruments in which the Fund may invest may default on their obligations to pay principal or interest when due. The Fund is subject to interest rate risk; as interest rates rise, bond prices fall. Investments of below investment grade quality are regarded as having speculative characteristics with respect to the issuer’s capacity to pay dividends or interest and repay principal, and may be subject to higher price volatility and default risk than investment grade investments of comparable terms and duration. Lower credit debt securities may be more likely to fail to make timely interest or principal payments. Investments in non-U.S. securities involve special risks not typically associated with domestic investments including currency risk, if not hedged - the risk that changes in exchange rates will affect the value of the fund’s investments, as well as adverse political, social and economic developments. These risks often are magnified in emerging markets. These and other risk considerations such as foreign currency risk are described in more detail on the Fund’s web page at www.nuveen.com/NMAI.
67
Additional Fund Information (Unaudited)
| Board of Trustees | ||||||||||
| Jack B. Evans | William C. Hunter | Amy B.R. Lancellotta | Joanne T. Medero | Albin F. Moschner | John K. Nelson | |||||
| Matthew Thornton III |
Terence J. Toth |
Margaret L. Wolff |
Robert L. Young |
| Investment Adviser Nuveen Fund Advisors, LLC 333 West Wacker Drive Chicago, IL 60606 |
Custodian State Street
Bank One Congress Street |
Legal Counsel Chapman and Cutler LLP Chicago, IL 60603 |
Independent Registered KPMG LLP 200 East Randolph Street Chicago, IL 60601 |
Transfer Agent and Computershare Trust Company, N.A. 150 Royall Street Canton, MA 02021 (800) 257-8787 | ||||
Portfolio of Investments Information
The Fund is required to file its complete schedule of portfolio holdings with the Securities and Exchange Commission (SEC) for the first and third quarters of each fiscal year as an exhibit to its report on Form N-PORT. You may obtain this information directly from the SEC’s website at http://www.sec.gov.
Nuveen Funds’ Proxy Voting Information
You may obtain (i) information regarding how each fund voted proxies relating to portfolio securities held during the most recent twelve-month period ended June 30, without charge, upon request, by calling Nuveen toll-free at (800) 257-8787 or on Nuveen’s website at www.nuveen.com and (ii) a description of the policies and procedures that each fund used to determine how to vote proxies relating to portfolio securities without charge, upon request, by calling Nuveen toll free at (800) 257-8787. You may also obtain this information directly from the SEC. Visit the SEC on-line at http://www.sec.gov.
CEO Certification Disclosure
The Fund’s Chief Executive Officer (CEO) has submitted to the New York Stock Exchange (NYSE) the annual CEO certification as required by Section 303A.12(a) of the NYSE Listed Company Manual. The Fund has filed with the SEC the certification of its CEO and Chief Financial Officer required by Section 302 of the Sarbanes-Oxley Act.
Common Share Repurchases
The Fund intends to repurchase, through its open-market share repurchase program, shares of its own common stock at such times and in such amounts as is deemed advisable. During the period covered by this report, the Fund repurchased shares of its common stock, as shown in the accompanying table. Any future repurchases will be reported to shareholders in the next annual or semi-annual report.
| NMAI | ||||
| Common shares repurchased |
0 | |||
FINRA BrokerCheck
The Financial Industry Regulatory Authority (FINRA) provides information regarding the disciplinary history of FINRA member firms and associated investment professionals. This information as well as an investor brochure describing FINRA BrokerCheck is available to the public by calling the FINRA BrokerCheck Hotline number at (800) 289-9999 or by visiting www.FINRA.org.
68
Used in this Report
(Unaudited)
| ∎ | 19(a) Notice: Section 19(a) of the Investment Company Act of 1940 requires that the payment of any distribution which is made from a source other than the fund’s net income be accompanied by a written notice that discloses the estimated sources of such payment. |
| ∎ | Average Annual Total Return: This is a commonly used method to express an investment’s performance over a particular, usually multi-year time period. It expresses the return that would have been necessary each year to equal the investment’s actual cumulative performance (including change in NAV or market price and reinvested dividends and capital gains distributions, if any) over the time period being considered. |
| ∎ | Effective Leverage: Effective leverage is a fund’s effective economic leverage, and includes both regulatory leverage (see below) and the leverage effects of certain derivative investments in the fund’s portfolio. |
| ∎ | Leverage: Leverage is created whenever a fund has investment exposure (both reward and/or risk) equivalent to more than 100% of the investment capital. |
| ∎ | Net Asset Value (NAV) Per Share: A fund’s Net Assets is equal to its total assets (securities, cash, accrued earnings and receivables) less its total liabilities. NAV per share is equal to the fund’s Net Assets divided by its number of shares outstanding. |
| ∎ | Regulatory Leverage: Regulatory leverage consists of preferred shares issued by or borrowings of a fund. Both of these are part of a fund’s capital structure. Regulatory leverage is subject to asset coverage limits set in the Investment Company Act of 1940. |
69
Annual Investment Management Agreement Approval Process
(Unaudited)
At a meeting held on May 23-25, 2023 (the “May Meeting”), the Board of Trustees (the “Board” and each Trustee, a “Board Member”) of the Fund, which is comprised entirely of Board Members who are not “interested persons” (as defined under the Investment Company Act of 1940 (the “1940 Act”)) (the “Independent Board Members”), approved the renewal of the management agreement (the “Investment Management Agreement”) with Nuveen Fund Advisors, LLC (the “Adviser”), pursuant to which the Adviser serves as the investment adviser to the Fund, and the respective sub-advisory agreements (each, a “Sub-Advisory Agreement”) with Nuveen Asset Management, LLC (“NAM”), Teachers Advisors, LLC (“TAL”) and Winslow Capital Management, LLC (“Winslow,” and Winslow, NAM and TAL are each, a “Sub-Adviser”), pursuant to which each Sub-Adviser serves as an investment sub-adviser to the Fund, for an additional one-year term. As the Board is comprised of all Independent Board Members, the references to the Board and the Independent Board Members are interchangeable.
Following up to an initial two-year period, the Board considers the renewal of the Investment Management Agreement and each Sub-Advisory Agreement on behalf of the Fund on an annual basis. The Investment Management Agreement and Sub-Advisory Agreements are collectively referred to as the “Advisory Agreements,” and the Adviser and the Sub-Advisers are collectively, the “Fund Advisers” and each, a “Fund Adviser.”
The Independent Board Members considered the review of the advisory agreements for the Nuveen funds to be an ongoing process and employed the accumulated information, knowledge and experience the Board Members had gained during their tenure on the boards governing the Nuveen funds and working with the Adviser and the applicable sub-advisers in their annual review of the advisory agreements. Throughout the year, the Board and its committees meet regularly and, at these meetings, receive regular and/or special reports that cover an extensive array of topics and information that are relevant to the Board’s annual consideration of the renewal of the advisory agreements for the Nuveen funds. Such information may address, among other things, fund performance and risk information; the Adviser’s strategic plans; product initiatives for various funds; the review of the funds and investment teams; compliance, regulatory and risk management matters; the trading practices of the various sub-advisers to the Nuveen funds; management of distributions; valuation of securities; fund expenses; securities lending; liquidity management; overall market and regulatory developments; and with respect to closed-end funds, capital management initiatives, institutional ownership, management of leverage financing and the secondary market trading of the closed-end funds and any actions to address discounts. The Board also seeks to meet periodically with the Nuveen funds’ sub-advisers and/or portfolio teams, when feasible. The presentations, discussions, and meetings throughout the year also provide a means for the Board to evaluate the level, breadth and quality of services provided by the Adviser and how such services have changed over time in light of new or modified regulatory requirements, changes to market conditions or other factors.
In connection with its annual consideration of the advisory agreements for the Nuveen funds, the Board, through its independent legal counsel, requested and received extensive materials and information prepared specifically for its review of such advisory agreements by the Adviser and by Broadridge Financial Solutions, Inc. (“Broadridge”), an independent provider of investment company data. The materials cover a wide range of topics including, but not limited to, a description of the nature, extent and quality of services provided by the Fund Advisers; a review of product actions advanced in 2022 for the benefit of particular Nuveen funds and/or the Nuveen fund complex; a review of each sub-adviser to the Nuveen funds and/or the applicable investment team; an analysis of fund performance with a focus on any Nuveen funds considered performance outliers; an analysis of the fees and expense ratios of the Nuveen funds with a focus on any Nuveen funds considered expense outliers; a review of management fee schedules; a description of portfolio manager compensation; an overview of the secondary market trading of shares of the Nuveen closed-end funds (including, among other things, an analysis of secondary market performance and commentary regarding the leverage management, share repurchase and shelf offering programs of Nuveen closed-end funds); a description of the profitability or financial data of Nuveen and the sub-advisers to the Nuveen funds; and a description of indirect benefits received by the Adviser and the sub-advisers as a result of their relationships with the Nuveen funds. The information prepared specifically for the annual review supplemented the information provided to the Board and its committees and the evaluations of the Nuveen funds by the Board and its committees during the year. The Board’s review of the advisory agreements for the Nuveen funds is based on all the information provided to the Board and its committees throughout the year as well as the
70
information prepared specifically with respect to the annual review of such advisory agreements. The performance, fee and expense data and other information provided by a Fund Adviser, Broadridge or other service providers were not independently verified by the Independent Board Members.
As part of its review, the Board met on April 11-12, 2023 (the “April Meeting”) to review and discuss, in part, the performance of the Nuveen funds and the Adviser’s evaluation of each sub-adviser to the Nuveen funds and/or its investment teams. At the April Meeting, the Board Members asked questions and requested additional information that was provided for the May Meeting.
The Independent Board Members were advised by independent legal counsel during the annual review process as well as throughout the year, including meeting in executive sessions with such counsel at which no representatives from the Adviser or the Sub-Advisers were present. In connection with their annual review, the Independent Board Members also received a memorandum from independent legal counsel outlining their fiduciary duties and legal standards in reviewing the Advisory Agreements, including guidance from court cases evaluating advisory fees.
The Board’s decision to renew the Advisory Agreements was not based on a single identified factor, but rather the decision reflected the comprehensive consideration of all the information provided to the Board and its committees throughout the year as well as the materials prepared specifically in connection with the renewal process. The contractual arrangements are a result of multiple years of review, negotiation and information provided in connection with the Board’s annual review of the Nuveen funds’ advisory arrangements and oversight of the Nuveen funds. Each Board Member may have attributed different levels of importance to the various factors and information considered in connection with the approval process and may place different emphasis on the relevant information year to year in light of, among other things, changing market and economic conditions. A summary of the principal factors and information, but not all the factors, the Board considered in deciding to renew the Advisory Agreements is set forth below.
| A. | Nature, Extent and Quality of Services |
In evaluating the renewal of the Advisory Agreements, the Independent Board Members received and considered information regarding the nature, extent and quality of the applicable Fund Adviser’s services provided to the Fund with particular focus on the services and enhancements or changes to such services provided during the last year. The Independent Board Members considered the Investment Management Agreement and the Sub-Advisory Agreements separately in the course of their review. With this approach, they considered the respective roles of the Adviser and the Sub-Advisers in providing services to the Fund.
The Board recognized that the Adviser provides a wide array of management, oversight and administrative services to manage and operate the Nuveen funds and that the scope and complexity of these services, along with the undertakings required of the Adviser in connection with providing these services, have expanded over time as a result of, among other things, regulatory, market and other developments. The Board noted the Adviser’s dedication of resources, time, personnel and capital and commitment to continuing to develop improvements and innovations that seek to enhance the Nuveen fund complex and meet the needs of the Nuveen funds in an increasingly complex regulatory environment. The Board received and reviewed information regarding, among other things, the Adviser’s investment oversight responsibilities, regulatory and compliance services, administrative duties and other services.
The Board considered the breadth and the quality of the services the Adviser and its various teams provide in overseeing the investment management of the Nuveen funds, including, among other things, overseeing and reviewing the services provided by the various sub-advisers to the Nuveen funds and their investment teams; evaluating fund performance and market conditions; overseeing operational and investment risks; evaluating investment strategies and recommending any changes thereto; managing liquidity; managing the daily valuation of portfolio securities; overseeing trade execution and securities lending; and setting and managing distributions consistent with the respective fund’s product design. With respect to closed-end funds, such services also include managing leverage; monitoring asset coverage levels for leveraged funds and compliance with rating agency criteria; providing capital management and secondary market services (such as implementing common share shelf offerings, capital return programs and common share repurchases); and maintaining a closed-end fund investor relations program. The Board also reviewed the structure of investment personnel compensation of each Fund
71
Annual Investment Management Agreement Approval Process (continued)
(Unaudited)
Adviser and considered whether the structure provides appropriate incentives to attract and maintain qualified personnel and to act in the best interests of the respective Nuveen fund.
Given the Nuveen funds operate in a highly regulated industry, the Board further considered the extensive compliance, regulatory and administrative services the Adviser and its various teams provide to manage and operate the Nuveen funds. The Board recognized such services included, but were not limited to, managing compliance policies; monitoring compliance with applicable policies, laws and regulations; devising internal compliance programs in seeking to enhance compliance with regulatory requirements and creating a framework to review and assess compliance programs; overseeing sub-adviser compliance testing; preparing compliance training materials; and responding to regulatory requests. The Board reviewed highlights of the various initiatives Nuveen compliance had taken in 2022 including, among other things, additional due diligence of service providers as their operating environments evolve post-Covid to more hybrid in-person working arrangements; investments in supporting and expanding international trading capabilities; continuing efforts to enhance policies and controls to address compliance risks including those related to environmental, social and governance (“ESG”) matters and new regulatory developments or guidance; and establishing and maintaining compliance policies and comprehensive compliance training programs. The Board also considered information regarding the Adviser’s business continuity, disaster recovery and information security programs and the periodic testing and review of such programs.
In addition to the above functions, the Board considered the quality and extent of other non-advisory services the Adviser provides including, among other things, various fund administration services (such as preparing, overseeing or assisting with the preparation of tax and regulatory filings); product management services (such as evaluating and enhancing products and strategies); legal support services; shareholder services and transfer agency function oversight services; and board support and reporting services. With respect to board support services, the Board reviewed a summary of the annual, quarterly, and special reports the Adviser and/or its affiliates provided to the Board throughout 2022.
The Board further acknowledged various initiatives the Adviser had undertaken or continued in 2022 in seeking to improve the effectiveness of its organization, the Nuveen funds product line-up as well as particular Nuveen fund(s) through, among other things, rationalizing the product line and gaining efficiencies through mergers, repositionings and liquidations; launching new funds; reviewing and updating investment policies and benchmarks; reopening certain funds previously closed to new investors; adding or modifying the share classes offered by certain funds; implementing fee waivers and expense cap changes for certain funds and evaluating and adjusting portfolio management teams as appropriate for various funds; and developing policy positions on a broad range of regulatory proposals that may impact the funds and communicating with lawmakers and other regulatory authorities to help ensure these positions are represented.
Aside from the services provided, the Board recognized the financial resources of the Adviser and its affiliates and their willingness to make investments in the technology, personnel and infrastructure to support the Nuveen funds, including maintaining a seed capital budget to support new or existing funds and/or facilitate changes for a respective fund. The Board noted the benefits to shareholders of investing in a fund that is a part of a large fund complex with a variety of investment disciplines, capabilities, expertise and resources available to navigate and support the Nuveen funds including during stressed times. The Board recognized the overall reputation and capabilities of the Adviser and its affiliates, the Adviser’s continuing commitment to provide high quality services, its willingness to implement operational or organizational changes in seeking, among other things, to enhance efficiencies and services to the Nuveen funds and its responsiveness to the Board’s questions and/or concerns raised throughout the year and during the annual review of advisory agreements. The Board also considered the significant risks borne by the Adviser and its affiliates in connection with their services to the Nuveen funds, including entrepreneurial risks in sponsoring new funds and ongoing risks with managing the funds such as investment, operational, reputational, regulatory, compliance and litigation risks.
The Board further considered the division of responsibilities between the Adviser and the Sub-Advisers and recognized that each Sub-Adviser and its investment personnel generally are responsible for the management of the Fund’s portfolio or a portion thereof under the oversight of the Adviser and the Board. The Board considered an analysis of each Sub-Adviser provided by the Adviser which included, among other things, the assets under management of the Sub-Adviser or applicable investment team and changes thereto, a summary of the applicable investment team and changes to such team, the
72
investment process and philosophy of the applicable investment team, the performance of the Nuveen funds sub-advised by the Sub-Adviser over various periods of time and a summary of any significant policy and/or other changes to the Nuveen funds sub-advised by the Sub-Adviser. The Board further considered at the May Meeting or prior meetings evaluations of each Sub-Adviser’s compliance programs and trade execution. The Board noted that the Adviser recommended the renewal of the Sub-Advisory Agreements.
Based on its review, the Board determined, in the exercise of its reasonable business judgment, that it was satisfied with the nature, extent and quality of services provided to the Fund under each Advisory Agreement.
| B. | The Investment Performance of the Fund and Fund Advisers |
In evaluating the quality of the services provided by the Fund Advisers, the Board also considered a variety of investment performance data of the Nuveen funds prepared specifically for the annual review of the advisory agreements as well as the performance data the Board received throughout the year representing different time periods. In this regard, leading into the May Meeting, the Board reviewed, among other things, Fund performance over the quarter and one-year periods ending December 31, 2022 and March 31, 2023. In addition, the Board reviewed and discussed performance data at its regularly scheduled quarterly meetings during the year. The Board therefore took into account the performance data, presentations and discussions (written and oral) that have been provided for the annual review as well as in prior meetings over time in evaluating fund performance, including the Adviser’s analysis of a fund’s performance with particular focus on performance outliers (both overperformance and underperformance), the factors contributing to performance (including relative to a fund’s benchmark and peers and the impact of market conditions) and any recommendations or steps that had been taken or were proposed to be taken to address significant performance concerns. In this regard, the Board noted, among other things, that certain Nuveen funds had changes in portfolio managers or other significant changes to their investment strategies or policies since March 2020, and, as a result, the Board reviewed certain tracking performance data comparing the performance of such funds before and after such changes.
The Board recognized that performance data reflects performance over a specified period which may differ significantly depending on the ending dates selected, particularly during periods of market volatility. Further, the Board noted that shareholders may evaluate performance based on their own respective holding periods which may differ from the performance periods reviewed by the Board and lead to differing results.
In its evaluation, the Board reviewed Nuveen fund performance results from different perspectives. In general, subject to certain exceptions, the Board reviewed both absolute and relative fund performance during the annual review over the various time periods and evaluated performance results in light of a fund’s investment objective(s), strategies and risks. With respect to the relative performance, the Board considered fund performance in comparison to the performance of peer funds (the “Performance Peer Group”) and recognized and/or customized benchmarks (i.e., generally benchmarks derived from multiple recognized benchmarks). In reviewing such comparative performance, the Board was cognizant of the inherent limitations of such data which can make meaningful performance comparisons generally difficult. As an illustration, differences in the composition of the Performance Peer Group, the investment objective(s), strategies and other characteristics of the peers in the Performance Peer Group, the level, type and cost of leverage (if any) of the peers, and the varying sizes of peers all may contribute to differences in the performance results of a Performance Peer Group compared to the applicable Nuveen fund. With respect to relative performance of a Nuveen fund compared to a benchmark index, differences, among other things, in the investment objective(s) and strategies of a fund and the benchmark (particularly an actively managed fund that does not directly follow an index) as well as the costs of operating a fund would necessarily contribute to differences in performance results and limit the value of the comparative performance information. To assist the Board in its review of the comparability of the relative performance, the Adviser has ranked the relevancy of the peer group to the Fund as low, medium or high.
The secondary market trading of shares of the Nuveen closed-end funds also continues to be a priority for the Board given its importance to shareholders, and therefore the Board and/or its Closed-end Fund committee reviews certain performance data reflecting, among other things, the premiums and discounts at which the shares of the Nuveen closed-end funds have traded over specified periods throughout the year. In its review, the Board considers, among other things, changes to investment mandates and guidelines, distribution policies, leverage levels and types; share repurchases and similar capital
73
Annual Investment Management Agreement Approval Process (continued)
(Unaudited)
market actions; and effective communications programs to build greater awareness and deepen understanding of closed-end funds. As applicable, the Board considered the impact of leverage on a Nuveen fund’s performance. The Board further acknowledged that performance results should include the distribution yields of funds that seek to provide income as part of their investment objective(s) to shareholders. In this regard, the Board considered that the use of leverage by various funds may have detracted from total return performance of such funds over various periods in current market conditions, but the leverage also was accretive in helping to provide income.
The Board also evaluated Nuveen fund performance in light of various relevant factors which may include, among other things, general market conditions, issuer-specific information, asset class information, leverage and fund cash flows. The Board acknowledged that long-term performance could be impacted by even one period of significant outperformance or underperformance and that a single investment theme could disproportionately affect performance. Further, the Board recognized that the market and economic conditions may significantly impact a fund’s performance, particularly over shorter periods, and such performance may be more reflective of such economic or market events and not necessarily reflective of management skill. Although the Board reviews short-, intermediate- and longer-term performance data, the Board recognized that longer periods of performance may reflect full market cycles.
In relation to recent general market conditions, the Board had recognized the general market volatility and underperformance of the market in 2022 in considering Nuveen fund performance. The Board took into account the Adviser’s assessment of a fund’s performance during the recent period of significant market volatility. In their review from year to year, the Board Members consider and may place different emphasis on the relevant information in light of changing circumstances in market and economic conditions. In evaluating performance, the Board focused particular attention on funds with less favorable performance records. However, depending on the facts and circumstances including any differences between the respective fund and its benchmark and/or Performance Peer Group, the Board may be satisfied with a fund’s performance notwithstanding that its performance may be below that of its benchmark and/or peer group for certain periods. With respect to any funds for which the Board has identified performance issues, the Board seeks to monitor such funds closely until performance improves, discusses with the Adviser the reasons for such results, considers whether any steps are necessary or appropriate to address such issues, and reviews the results of any steps undertaken.
The Board’s determinations with respect to the Fund are summarized below.
The Board noted that the Fund’s performance was below the performance of its blended benchmark and the Fund ranked in the fourth quartile of its Performance Peer Group for the one-year period ended December 31, 2022. The Board noted that the Fund’s use of leverage had detracted from performance but was accretive to overall common share income. In addition, the Fund’s performance was below the performance of its blended benchmark for the one-year period ended March 31, 2023, but the Fund ranked in the third quartile of its Performance Peer Group for the one-year period ended March 31, 2023. In considering performance, the Board recognized that the Performance Peer Group was classified as low for relevancy. In its review, the Board also recognized that the Fund was relatively new with a performance history too limited to make a meaningful assessment of performance, and management deserved additional time to develop a performance record. The Board will continue to monitor the development of the Fund.
| C. | Fees, Expenses and Profitability |
| 1. | Fees and Expenses |
As part of its annual review, the Board generally reviewed, among other things, with respect to the Nuveen closed-end funds, the contractual management fee and actual management fee (i.e., the management fee after taking into consideration fee waivers and/or expense reimbursements, if any) paid by a fund to the Adviser in light of the nature, extent and quality of the services provided. The Board also considered the total operating expense ratio of a fund (after any fee waivers and/or expense reimbursements). More specifically, the Independent Board Members reviewed, among other things, each Nuveen closed-end fund’s actual management fee rate (after fee waivers and/or expense reimbursements, if any) and net total expense ratio in relation to those of a comparable universe of funds (the “Peer Universe”) established by Broadridge. The Independent Board Members reviewed the methodology Broadridge employed to establish its Peer Universe and recognized that differences between the applicable fund and its respective Peer Universe as well as changes to the composition of the
74
Peer Universe from year to year may limit some of the value of the comparative data. The Independent Board Members take these limitations and differences into account when reviewing comparative peer data. The Independent Board Members also considered a fund’s operating expense ratio as it more directly reflected the shareholder’s costs in investing in the respective fund.
In their review, the Independent Board Members considered, in particular, each Nuveen fund with a net total expense ratio (excluding investment-related costs of leverage for closed-end funds) of six basis points or higher compared to that of its peer average (each, an “Expense Outlier Fund”), including the Fund, and an analysis as to the factors contributing to each such fund’s higher relative net total expense ratio. In addition, although the Board reviewed a fund’s total net expenses both including and excluding investment-related expenses (i.e., leverage costs) for certain of the closed-end funds, the Board recognized that leverage expenses will vary across funds and in comparison to peers because of differences in the forms and terms of leverage employed by the respective fund. Accordingly, in reviewing the comparative data between a fund and its peers, the Board generally considered the fund’s net total expense ratio and fees (excluding leverage costs and leveraged assets for the closed-end funds) to be higher if they were over 10 basis points higher, slightly higher if they were 6 to 10 basis points higher, in line if they were within approximately 5 basis points higher than the peer average and below if they were below the peer average of the Peer Universe.
The Independent Board Members also considered, in relevant part, a Nuveen fund’s management fee and net total expense ratio in light of its performance history, including reviewing certain funds identified by the Adviser and/or the Board as having a higher net total expense ratio or management fee compared to their respective peers coupled with experiencing periods of challenged performance and considering the reasons for such comparative positions. In addition, with respect to closed-end funds that utilize leverage, the Independent Board Members recognized that certain assets attributable to a fund’s use of leverage may be included in the amount of assets upon which the advisory or sub-advisory fees are calculated. The Independent Board Members acknowledged the fact that a decision to employ leverage or increase a fund’s leverage which has the effect, all other things being equal, of increasing the assets upon which an advisory or sub-advisory fee is based (and, in turn, increasing the Adviser’s and applicable sub-adviser’s management fees), means that the Adviser and applicable sub-adviser may have a conflict of interest in determining whether to use or increase leverage. The Independent Board Members recognized, however, that the Adviser and sub-advisers would seek to manage the potential conflict by recommending to the Board to leverage the applicable fund or increase such leverage when the Adviser and/or a sub-adviser, as applicable, has determined that such action would be in the best interests of the respective fund and its common shareholders and by periodically reviewing with the Board the fund’s performance and the impact of the use of leverage on that performance.
In their review of the fee arrangements for the Nuveen funds, the Independent Board Members also considered the management fee schedules, including the complex-wide and fund-level breakpoint schedules, as applicable. The Board noted that across the Nuveen fund complex, the complex-wide fee breakpoints reduced fees by approximately $62.4 million and fund-level breakpoints reduced fees by approximately $76.1 million in 2022.
With respect to each Sub-Adviser, the Board also considered, among other things, the sub-advisory fee schedule paid to the Sub-Adviser in light of the sub-advisory services provided to the Fund and comparative data of the fees the Sub-Adviser charges to other clients, if any. In its review, the Board recognized that the compensation paid to each Sub-Adviser is the responsibility of the Adviser, not the Fund.
The Independent Board Members noted that the Fund had an actual management fee that was slightly higher than the peer average and a net total expense ratio that was higher than the peer average. The Independent Board Members noted that differences in the Fund’s investment strategy relative to the peer set contributed to the differential.
Based on its review of the information provided, the Board determined that the Fund’s management fees (as applicable) to a Fund Adviser were reasonable in light of the nature, extent and quality of services provided to the Fund.
75
Annual Investment Management Agreement Approval Process (continued)
(Unaudited)
| 2. | Comparisons with the Fees of Other Clients |
In evaluating the appropriateness of fees, the Board also considered information regarding the fee rates the respective Fund Advisers charged to certain other types of clients and the type of services provided to these other clients. With respect to the Adviser and/or the Sub-Advisers, such other clients may include: retail and institutional managed accounts sub-advised by a Sub-Adviser (with respect to NAM and Winslow); hedge funds or other structured products managed by a Sub-Adviser (with respect to NAM); investment companies offered outside the Nuveen family and sub-advised by a Sub-Adviser (with respect to NAM and Winslow); foreign investment companies offered by Nuveen and sub-advised by a Sub-Adviser (with respect to each Sub-Adviser); collective investment trusts sub-advised by a Sub-Adviser (with respect to NAM and Winslow); and certain funds advised by a Sub-Adviser (with respect to TAL). The Board further noted that the Adviser also advised, and each Sub-Adviser sub-advised, certain exchange-traded funds (“ETFs”) sponsored by Nuveen. The Board reviewed, among other things, the range of fees assessed for managed accounts, hedge funds (along with their performance fee), foreign investment companies and ETFs offered by Nuveen, as applicable. The Board also reviewed the fee range and average fee rate of certain selected investment strategies offered in retail and institutional managed accounts sub-advised by NAM and Winslow, the hedge funds advised by NAM (along with their performance fee) and non-Nuveen investment companies sub-advised by certain affiliated sub-advisers. With respect to TAL, the Board reviewed the management fees and expense ratios of certain funds advised by TAL in the TIAA-CREF family of funds.
In considering the comparative fee data, the Board recognized that differences, including but not limited to, the amount, type and level of services provided by the Adviser to the Nuveen funds compared to that provided to other clients as well as differences in investment policies; eligible portfolio assets and the manner of managing such assets; product structure; investor profiles; account sizes; and regulatory requirements contribute to the variations in the fee schedules. Similarly, differences in the client base, governing bodies, distribution jurisdiction and operational complexities would also contribute to variations in management fees assessed the Nuveen funds compared to foreign fund clients. Further, with respect to ETFs, the Board considered that the Nuveen ETFs that are designed to track the performance of a specified index (“Index ETFs”) were passively managed compared to the active management of other Nuveen funds, which also contributed to the differences in fee levels between such Index ETFs and the actively managed funds. The Board acknowledged the wide range of services in addition to investment management that the Adviser had provided to the Nuveen funds compared to other types of clients as well as the increased entrepreneurial, legal and regulatory risks that the Adviser incurs in sponsoring and managing the Nuveen funds. In general, higher fee levels reflect higher levels of service provided by the Adviser, increased investment management complexity, greater product management requirements, and higher levels of business risk or some combination of these factors. The Board further considered that a Sub-Adviser’s fee is essentially for portfolio management services and therefore more comparable to the fees it receives for retail wrap accounts and other external sub-advisory mandates, as applicable. The Board concluded the varying levels of fees were justified given, among other things, the more extensive services, regulatory requirements and legal liabilities, and the entrepreneurial, legal and regulatory risks incurred in sponsoring and advising a registered investment company compared to that required in advising other types of clients.
| 3. | Profitability of Fund Advisers |
In their review, the Independent Board Members considered estimated profitability information of Nuveen as a result of its advisory services to the Nuveen funds as well as profitability data of other publicly traded asset management firms. Such profitability information included, among other things, gross and net revenue margins (excluding distribution) of Nuveen Investments, Inc. (“Nuveen Investments”) for services to the Nuveen funds on a pre-tax and after-tax basis for the 2022 and 2021 calendar years as well as the revenues earned (less any expense reimbursements/fee waivers) and expenses incurred by Nuveen Investments for its advisory activities to the Nuveen funds (excluding distribution and certain other expenses) for the 2022 and 2021 calendar years. The Independent Board Members also considered a summary of some of the key factors that impacted Nuveen’s profitability in 2022. In addition, the Board reviewed the revenues, expenses and operating margin (pre- and after-tax) the Adviser derived from its ETF product line for the 2022 and 2021 calendar years.
In developing the profitability data of the Adviser for its advisory services to the Nuveen funds, the Independent Board Members recognized the subjective nature of calculating profitability as the information is not audited and is necessarily dependent on cost allocation methodologies to allocate expenses throughout the complex and among the various advisory
76
products. Given there is no perfect expense allocation methodology and that other reasonable and valid allocation methodologies could be employed and could lead to significantly different results, the Board reviewed, among other things, a description of the cost allocation methodologies employed to develop the financial information, a summary of the history of changes to the methodology over the years from 2010 through 2022, and a historical expense analysis of Nuveen Investments’ revenues, expenses and pre-tax net revenue margins derived from its advisory services to the Nuveen funds (excluding distribution) for the calendar years from 2017 through 2022. The Board had also appointed four Independent Board Members to serve as the Board’s liaisons, with the assistance of independent counsel, to meet with representatives of the Adviser and review the development of the profitability data and to report to the full Board.
In addition, the Board considered certain comparative operating margin data. In this regard, the Board reviewed the operating margins of Nuveen Investments compared to the adjusted operating margins of a peer group of asset management firms with publicly available data and the most comparable assets under management (based on asset size and asset composition) to Nuveen. The Board recognized that the operating margins of the peers were adjusted generally to address that certain services provided by the peers were not provided by Nuveen. The Board also reviewed, among other things, the net revenue margins (pre-tax) of Nuveen Investments on a company-wide basis and the net revenue margins (pre-tax) of Nuveen Investments derived from its services to the Nuveen funds only (including and excluding distribution) compared to the adjusted operating margins of the peer group for each calendar year from 2012 to 2022. Although the total company operating margins of Nuveen Investments were in the bottom half of the peer group range for 2022 and 2021, the Independent Board Members recognized the limitations of the comparative data given that peer data is not generally public and the calculation of profitability is subjective and affected by numerous factors (such as types of funds a peer manages, its business mix, its cost of capital, the numerous assumptions underlying the methodology used to allocate expenses and other factors) that can have a significant impact on the results.
Aside from Nuveen’s profitability, the Board recognized that the Adviser is a subsidiary of Nuveen, LLC, the investment management arm of Teachers Insurance and Annuity Association of America (“TIAA”). Accordingly, the Board also reviewed a balance sheet for TIAA reflecting its assets, liabilities and capital and contingency reserves for the 2022 and 2021 calendar years to consider the financial strength of TIAA. The Board recognized the benefit of an investment adviser and its parent with significant resources, particularly during periods of market volatility. The Board also noted the reinvestments Nuveen, its parent and/or other affiliates made into its business through, among other things, the investment of seed capital in certain Nuveen funds and continued investments in enhancements to technological capabilities.
In addition to Nuveen, the Independent Board Members considered the profitability of each Sub-Adviser from its relationships with the respective Nuveen funds. In this regard, with respect to NAM and Winslow, the Independent Board Members reviewed, among other things, each such Sub-Adviser’s revenues, expenses and net revenue margins (pre- and after-tax) for its advisory activities to the respective Nuveen funds for the calendar years ended December 31, 2022 and December 31, 2021. The Independent Board Members also reviewed a profitability analysis reflecting the revenues, expenses and revenue margin (pre- and after-tax) by asset type for NAM for the calendar years ending December 31, 2022 and December 31, 2021. With respect to TAL, the Independent Board Members reviewed, among other things, the revenues, expenses and net operating income for its advisory services to the Nuveen ETFs and Nuveen closed-end funds it sub-advises for the 2022 and 2021 calendar years.
In evaluating the reasonableness of the compensation, the Independent Board Members also considered any other ancillary benefits derived by the respective Fund Adviser from its relationship with the Nuveen funds as discussed in further detail below.
Based on a consideration of all the information provided, the Board noted that Nuveen’s and each Sub-Adviser’s level of profitability was acceptable and not unreasonable in light of the services provided.
| D. | Economies of Scale and Whether Fee Levels Reflect These Economies of Scale |
The Board considered whether there have been economies of scale with respect to the management of the Nuveen funds, whether these economies of scale have been appropriately shared with the funds and whether there is potential for realization
77
Annual Investment Management Agreement Approval Process (continued)
(Unaudited)
of further economies of scale. Although the Board recognized that economies of scale are difficult to measure with any precision and certain expenses may not decline with a rise in assets, the Board considered that Nuveen shares the benefits of economies of scale, if any, in a number of ways including through the use of breakpoints in the management fee schedule, fee waivers and/or expense limitations, the pricing of funds at scale at inception and investments in Nuveen’s business which can enhance the services provided to the funds for the fees paid. In this regard, the Board recognized that the management fee of the Adviser is generally comprised of a fund-level component and a complex-level component each with its own breakpoint schedule, subject to certain exceptions. The Board reviewed the fund-level and complex-level fee schedules. With this structure, the Board noted that the complex-level breakpoint schedule is designed to deliver the benefits of economies of scale to shareholders when the eligible assets in the complex pass certain thresholds even if the assets of a particular fund are unchanged or have declined, and the fund-level breakpoint schedules are designed to share economies of scale with shareholders if the particular fund grows. The Board noted, however, that although closed-end funds may make additional share offerings from time to time, the closed-end funds have a more limited ability to increase their assets because the growth of their assets will occur primarily from the appreciation of their investment portfolios.
As noted above, the Independent Board Members also recognized the continued reinvestment in Nuveen’s business to enhance its capabilities and services to the benefit of its various clients. The Board understood that many of these investments in the Nuveen business were not specific to individual Nuveen funds but rather incurred across of a variety of products and services pursuant to which the family of Nuveen funds as a whole may benefit. In addition, the Board also considered that Nuveen has provided, without raising advisory fees to the Nuveen funds, certain additional services, including, but not limited to, services required by new regulations and regulatory interpretations, and this was also a means of sharing economies of scale with the funds and their shareholders.
Based on its review, the Board was satisfied that the current fee arrangements together with the reinvestment in Nuveen’s business appropriately shared any economies of scale with shareholders.
| E. | Indirect Benefits |
The Independent Board Members received and considered information regarding other benefits the respective Fund Adviser or its affiliates may receive as a result of their relationship with the Nuveen funds. The Board acknowledged that an affiliate of the Adviser may receive compensation for serving as a co-manager in the initial public offerings of new Nuveen closed-end funds (if any) and for serving as an underwriter on shelf offerings of existing Nuveen closed-end funds and reviewed the amounts paid for such services, if any, in 2021 and 2022.
In addition, the Independent Board Members noted that the various sub-advisers to the Nuveen funds do not generally benefit from soft dollar arrangements with respect to Nuveen fund portfolio transactions.
Based on its review, the Board concluded that any indirect benefits received by a Fund Adviser as a result of its relationship with the Fund were reasonable in light of the services provided.
| F. | Other Considerations |
The Independent Board Members did not identify any single factor discussed previously as all-important or controlling. The Independent Board Members concluded that the terms of each Advisory Agreement were reasonable, that the respective Fund Adviser’s fees were reasonable in light of the services provided to the Fund and that the Advisory Agreements be renewed for an additional one-year period.
78
Notes
79
Nuveen:
Serving Investors for Generations
Since 1898, financial professionals and their clients have relied on Nuveen to provide
dependable investment solutions through continued adherence to
proven, long-term investing
principles. Today, we offer a range of high quality solutions designed to
be integral components of a well-diversified core portfolio.
Focused on meeting investor needs.
Nuveen is the investment manager of TIAA. We have grown into one of the world’s premier global asset managers, with specialist knowledge across all major asset classes and particular strength in solutions that provide income for investors and that draw on our expertise in alternatives and responsible investing. Nuveen is driven not only by the independent investment processes across the firm, but also the insights, risk management, analytics and other tools and resources that a truly world-class platform provides. As a global asset manager, our mission is to work in partnership with our clients to create solutions which help them secure their financial future.
Find
out how we can help you.
To learn more about how the products and services of Nuveen may be able to help you meet your financial goals, talk to your financial professional, or call us at (800) 257-8787. Please read the information provided carefully before you invest. Investors should consider the investment objective and policies, risk considerations, charges and expenses of any investment carefully. Where applicable, be sure to obtain a prospectus, which contains this and other relevant information. To obtain a prospectus, please contact your securities representative or Nuveen, 333 W. Wacker Dr., Chicago, IL 60606. Please read the prospectus carefully before you invest or send money.
Learn more about Nuveen Funds at:
www.nuveen.com/closed-end-funds
NOT FDIC INSURED MAY LOSE VALUE NO BANK GUARANTEE
| Nuveen Securities, LLC, member FINRA and SIPC | 333 West Wacker Drive Chicago, IL 60606 | www.nuveen.com | ESA-D-0623P 3020101-INV-B-8/24 |
Item 2. Code of Ethics.
Not applicable to this filing.
Item 3. Audit Committee Financial Expert.
Not applicable to this filing.
Item 4. Principal Accountant Fees and Services.
Not applicable to this filing.
Item 5. Audit Committee of Listed Registrants.
Not applicable to this filing.
Item 6. Schedule of Investments.
(a) See Portfolio of Investments in Item 1.
(b) Not applicable.
Item 7. Disclosure of Proxy Voting Policies and Procedures for Closed-End Management Investment Companies.
Not applicable to this filing.
Item 8. Portfolio Managers of Closed-End Management Investment Companies.
Not applicable to this filing.
Item 9. Purchases of Equity Securities by Closed-End Management Investment Company and Affiliated Purchasers.
Not applicable.
Item 10. Submission of Matters to a Vote of Security Holders.
There have been no material changes to the procedures by which shareholders may recommend nominees to the registrant’s Board implemented after the registrant last provided disclosure in response to this item.
Item 11. Controls and Procedures.
| (a) | The registrant’s principal executive and principal financial officers, or persons performing similar functions, have concluded that the registrant’s disclosure controls and procedures (as defined in Rule 30a-3(c) under the Investment Company Act of 1940, as amended (the “1940 Act”) (17 CFR 270.30a-3(c))) are effective, as of a date within 90 days of the filing date of this report that includes the disclosure required by this paragraph, based on their evaluation of the controls and procedures required by Rule 30a-3(b) under the 1940 Act (17 CFR 270.30a-3(b)) and Rules 13a-15(b) or 15d-15(b) under the Securities Exchange Act of 1934, as amended (the “Exchange Act”) (17 CFR 240.13a-15(b) or 240.15d-15(b)). |
| (b) | There were no changes in the registrant’s internal control over financial reporting (as defined in Rule 30a-3(d) under the 1940 Act (17 CFR 270.30a-3(d)) that occurred during the period covered by this report that has materially affected, or is reasonably likely to materially affect, the registrant’s internal control over financial reporting. |
Item 12. Disclosure of Securities Lending Activities for Closed-End Management Investment Companies.
Not applicable.
Item 13. Exhibits.
File the exhibits listed below as part of this Form.
(a)(1) Any code of ethics, or amendment thereto, that is the subject of the disclosure required by Item 2, to the extent that the registrant intends to satisfy the Item 2 requirements through filing of an exhibit: Not applicable to this filing.
(a)(3) Any written solicitation to purchase securities under Rule 23c-1 under the 1940 Act (17 CFR 270.23c-1) sent or given during the period covered by the report by or on behalf of the registrant to 10 or more persons: Not applicable.
(a)(4) Change in the registrant’s independent public accountant. Not applicable.
SIGNATURES
Pursuant to the requirements of the Securities Exchange Act of 1934 and the Investment Company Act of 1940, the registrant has duly caused this report to be signed on its behalf by the undersigned, thereunto duly authorized.
(Registrant) Nuveen Multi-Asset Income Fund
| By (Signature and Title) | /s/ Mark L. Winget |
|||
| Mark L. Winget | ||||
| Vice President and Secretary |
Date: September 6, 2023
Pursuant to the requirements of the Securities Exchange Act of 1934 and the Investment Company Act of 1940, this report has been signed below by the following persons on behalf of the registrant and in the capacities and on the dates indicated.
| By (Signature and Title) | /s/ David J. Lamb |
|||
| David J. Lamb | ||||
| Chief Administrative Officer | ||||
| (principal executive officer) |
Date: September 6, 2023
| By (Signature and Title) | /s/ E. Scott Wickerham |
|||
| E. Scott Wickerham | ||||
| Vice President and Funds Controller | ||||
| (principal financial officer) |
Date: September 6, 2023
EX-99.CERT
CERTIFICATIONS PURSUANT TO SECTION 302 OF THE SARBANES-OXLEY ACT
CERTIFICATIONS
I, David J. Lamb, certify that:
| 1. | I have reviewed this report on Form N-CSR of Nuveen Multi-Asset Income Fund |
| 2. | Based on my knowledge, this report does not contain any untrue statement of a material fact or omit to state a material fact necessary to make the statements made, in light of the circumstances under which such statements were made, not misleading with respect to the period covered by this report; |
| 3. | Based on my knowledge, the financial statements, and other financial information included in this report, fairly present in all material respects the financial condition, results of operations, changes in net assets, and cash flows (if the financial statements are required to include a statement of cash flows) of the registrant as of, and for, the periods presented in this report; |
| 4. | The registrant’s other certifying officer and I are responsible for establishing and maintaining disclosure controls and procedures (as defined in Rule 30a-3(c) under the Investment Company Act of 1940) and internal control over financial reporting (as defined in Rule 30a-3(d) under the Investment Company Act of 1940) for the registrant and have: |
| a) | designed such disclosure controls and procedures, or caused such disclosure controls and procedures to be designed under our supervision, to ensure that material information relating to the registrant, including its consolidated subsidiaries, is made known to us by others within those entities, particularly during the period in which this report is being prepared; |
| b) | designed such internal control over financial reporting, or caused such internal control over financial reporting to be designed under our supervision, to provide reasonable assurance regarding the reliability of financial reporting and the preparation of financial statements for external purposes in accordance with generally accepted accounting principles; |
| c) | evaluated the effectiveness of the registrant’s disclosure controls and procedures and presented in this report our conclusions about the effectiveness of the disclosure controls and procedures, as of a date within 90 days prior to the filing date of this report based on such evaluation; and |
| d) | disclosed in this report any change in the registrant’s internal control over financial reporting that occurred during the period covered by this report that has materially affected, or is reasonably likely to materially affect, the registrant’s internal control over financial reporting; and |
| 5. | The registrant’s other certifying officer and I have disclosed to the registrant’s auditors and the audit committee of the registrant’s board of directors (or persons performing the equivalent functions): |
| a) | all significant deficiencies and material weaknesses in the design or operation of internal control over financial reporting which are reasonably likely to adversely affect the registrant’s ability to record, process, summarize, and report financial information; and |
| b) | any fraud, whether or not material, that involves management or other employees who have a significant role in the registrant’s internal control over financial reporting. |
Date: September 6, 2023
| /s/ David J. Lamb | ||
| David J. Lamb Chief Administrative Officer | ||
| (principal executive officer) |
I, E. Scott Wickerham, certify that:
| 1. | I have reviewed this report on Form N-CSR of Nuveen Multi-Asset Income Fund |
| 2. | Based on my knowledge, this report does not contain any untrue statement of a material fact or omit to state a material fact necessary to make the statements made, in light of the circumstances under which such statements were made, not misleading with respect to the period covered by this report; |
| 3. | Based on my knowledge, the financial statements, and other financial information included in this report, fairly present in all material respects the financial condition, results of operations, changes in net assets, and cash flows (if the financial statements are required to include a statement of cash flows) of the registrant as of, and for, the periods presented in this report; |
| 4. | The registrant’s other certifying officer and I are responsible for establishing and maintaining disclosure controls and procedures (as defined in Rule 30a-3(c) under the Investment Company Act of 1940) and internal control over financial reporting (as defined in Rule 30a-3(d) under the Investment Company Act of 1940) for the registrant and have: |
| a) | designed such disclosure controls and procedures, or caused such disclosure controls and procedures to be designed under our supervision, to ensure that material information relating to the registrant, including its consolidated subsidiaries, is made known to us by others within those entities, particularly during the period in which this report is being prepared; |
| b) | designed such internal control over financial reporting, or caused such internal control over financial reporting to be designed under our supervision, to provide reasonable assurance regarding the reliability of financial reporting and the preparation of financial statements for external purposes in accordance with generally accepted accounting principles; |
| c) | evaluated the effectiveness of the registrant’s disclosure controls and procedures and presented in this report our conclusions about the effectiveness of the disclosure controls and procedures, as of a date within 90 days prior to the filing date of this report based on such evaluation; and |
| d) | disclosed in this report any change in the registrant’s internal control over financial reporting that occurred during the period covered by this report that has materially affected, or is reasonably likely to materially affect, the registrant’s internal control over financial reporting; and |
| 5. | The registrant’s other certifying officer and I have disclosed to the registrant’s auditors and the audit committee of the registrant’s board of directors (or persons performing the equivalent functions): |
| a) | all significant deficiencies and material weaknesses in the design or operation of internal control over financial reporting which are reasonably likely to adversely affect the registrant’s ability to record, process, summarize, and report financial information; and |
| b) | any fraud, whether or not material, that involves management or other employees who have a significant role in the registrant’s internal control over financial reporting. |
Date: September 6, 2023
| /s/ E. Scott Wickerham | ||
| E. Scott Wickerham Vice President and Funds Controller | ||
| (principal financial officer) |
EX-99.906CERT
CERTIFICATIONS PURSUANT TO SECTION 906 OF THE SARBANES-OXLEY ACT
Certification Pursuant to 18 U.S.C. 1350, as adopted pursuant to Section 906 of the Sarbanes-Oxley Act of 2002; provided by the Chief Executive Officer and Chief Financial Officer, based on each such officer’s knowledge and belief.
The undersigned officers of Nuveen Multi-Asset Income Fund (the “Registrant”), certify that, to the best of each such officer’s knowledge and belief:
| 1. | The Form N-CSR of the Registrant for the period ended June 30, 2023 (the “Report”) fully complies with the requirements of Section 13(a) or 15(d) of the Securities Exchange Act of 1934; and |
| 2. | The information contained in the Report fairly presents, in all material respects, the financial condition and results of operations of the Registrant. |
Date: September 6, 2023
| /s/ David J. Lamb | ||
| David J. Lamb Chief Administrative Officer | ||
| (principal executive officer) | ||
| /s/ E. Scott Wickerham | ||
| E. Scott Wickerham Vice President and Funds Controller | ||
| (principal financial officer) | ||
1 Year Nuveen Multi Asset Income Chart |
1 Month Nuveen Multi Asset Income Chart |

It looks like you are not logged in. Click the button below to log in and keep track of your recent history.
Support: +44 (0) 203 8794 460 | support@advfn.com
By accessing the services available at ADVFN you are agreeing to be bound by ADVFN's Terms & Conditions

 Hot Features


