We could not find any results for:
Make sure your spelling is correct or try broadening your search.
| Share Name | Share Symbol | Market | Type |
|---|---|---|---|
| Nabors Industries Ltd | NYSE:NBR | NYSE | Common Stock |
| Price Change | % Change | Share Price | High Price | Low Price | Open Price | Shares Traded | Last Trade | |
|---|---|---|---|---|---|---|---|---|
| 2.87 | 3.99% | 74.76 | 75.14 | 71.95 | 72.00 | 198,069 | 01:00:00 |
UNITED STATES
SECURITIES AND EXCHANGE COMMISSION
Washington, D.C. 20549
Form
CURRENT REPORT
PURSUANT TO SECTION 13 OR 15(d) OF THE
SECURITIES EXCHANGE ACT OF 1934
Date of Report (Date of earliest event reported):
(Exact name of registrant as specified in its charter)
| (State or Other Jurisdiction of Incorporation or Organization) |
(Commission File Number) | (I.R.S. Employer Identification No.) |
| N/A | ||
| (Address of principal executive offices) | (Zip Code) |
(
(Registrant’s telephone number, including area code)
N/A
(Former name or former address, if changed since last report.)
Check the appropriate box below if the Form 8-K filing is intended to simultaneously satisfy the filing obligation of the registrant under any of the following provisions:
| Written communications pursuant to Rule 425 under the Securities Act (17 CFR 230.425) |
| Soliciting material pursuant to Rule 14a-12 under the Exchange Act (17 CFR 240.14a-12) |
| Pre-commencement communications pursuant to Rule 14d-2(b) under the Exchange Act (17 CFR 240.14d-2(b)) |
| Pre-commencement communications pursuant to Rule 13e-4(c) under the Exchange Act (17 CFR 240.13e-4(c)) |
| Title of each class | Trading Symbol(s) | Name of exchange on which registered | ||
Indicate by check mark whether the registrant is an emerging growth company as defined in Rule 405 of the Securities Act of 1933 (§230.405 of this chapter) or Rule 12b-2 of the Securities Exchange Act of 1934 (§240.12b-2 of this chapter).
Emerging growth
company
If an emerging growth company, indicate by check mark if the registrant has elected not to use the extended transition period for complying with any new or revised financial accounting standards provided pursuant to Section 13(a) of the Exchange Act. ¨
Item 2.02 Results of Operations and Financial Condition.
On July 25, 2023, Nabors Industries Ltd. (“Nabors”) issued a press release announcing its results of operations for the three months ended June 30, 2023. A copy of that release is furnished herewith as Exhibit 99.1 and is incorporated herein by reference.
On July 26th, 2023, Nabors will hold a conference call at 10:00 a.m. Central Time, regarding the Company’s financial results for the quarter ended June 30, 2023. Information about the call - including dial-in information, recording and replay of the call, and supplemental information - is available on the Investor Relations page of www.nabors.com.
The information in this Item 2.02, including Exhibits 99.1 and 99.2, shall not be deemed “filed” for purposes of Section 18 of the Securities Exchange Act, of 1934 or otherwise subject to liabilities of that Section or Sections 11 and 12(a)(2) of the Securities Act of 1933.
Item 9.01 Financial Statements and Exhibits.
(d) Exhibits.
Exhibit No. |
Description | |
| 99.1 | Press Release | |
| 99.2 | Investor Information | |
| 104 | Cover Page Interactive Data File (embedded within the Inline XBRL document) |
-2-
SIGNATURES
Pursuant to the requirements of the Securities Exchange Act of 1934, the Registrant has duly caused this report to be signed on its behalf by the undersigned hereunto duly authorized.
| NABORS INDUSTRIES LTD. | ||
| Date: July 25, 2023 | By: | /s/ Mark D. Andrews |
| Name: Mark D. Andrews | ||
| Title: Corporate Secretary | ||
-3-
Exhibit 99.1
 |
NEWS RELEASE |
Nabors Announces Second Quarter 2023 Results
HAMILTON, Bermuda, July 25, 2023 /PRNewswire/ -- Nabors Industries Ltd. (“Nabors” or the “Company”) (NYSE: NBR) today reported second quarter 2023 operating revenues of $767 million, compared to operating revenues of $779 million in the first quarter. The net income attributable to Nabors shareholders for the quarter was $5 million, compared to $49 million in the first quarter. This equates to a loss of $0.31 per diluted share, compared to earnings per diluted share of $4.11 in the first quarter. The second quarter results included a gain, related to mark-to-market treatment of Nabors warrants, of $18 million, or $1.95 per diluted share, as compared to a gain of $34 million, or $3.48 per diluted share in the first quarter. The first quarter also included a $25 million, or $2.06 per diluted share, gain on the redemption of debt. Second quarter adjusted EBITDA was $235 million, compared to $240 million in the previous quarter.
Anthony G. Petrello, Nabors Chairman, CEO and President, commented, “Our global market activity was essentially in line with our expectations, with the exception of the Lower 48, where oil related drilling fell somewhat in addition to the already anticipated reduction in gas basins. Total adjusted EBITDA declined slightly, reflecting a decrease in U.S. rig count. Although leading edge pricing in the Lower 48 has peaked, daily revenue increased by $300 beyond the first quarter level.
“In our International segment, results benefitted from strong performance in the Middle East including the start of the third newbuild rig in Saudi Arabia. The remaining two rigs, of the initial five awards, are anticipated to commence operations over the balance of 2023. Construction of the second tranche of five units is progressing, with the first of those deployments expected to begin around the end of 2023. During the quarter we successfully deployed an additional rig in Argentina. We also were recently awarded four rigs in Algeria. Additionally, a unit in Colombia will restart operations in the third quarter.
“Revenue and adjusted EBITDA in our Drilling Solutions segment increased in the second quarter, despite the drilling activity headwinds in the Lower 48. On a global basis, third party revenue increased 18% sequentially, accelerating over the growth rate in the first quarter and validating our focus on this strategy. International revenue also increased as we expanded our footprint in Latin America and the Middle East.
“In the Rig Technologies segment, total revenue and adjusted EBITDA grew, driven by international sales of capital equipment and spare parts.
“On July 18, 2023, Nabors affiliate Nabors Energy Transition Corporation II (NASDAQ: NETDU) completed the initial public offering of its common shares. NETDU represents another milestone in the implementation of Nabors energy transition strategy.”
Segment Results
The U.S. Drilling segment reported $141.4 million in adjusted EBITDA for the second quarter of 2023. Nabors’ average Lower 48 rig count totaled 82. Daily adjusted gross margin in the Lower 48 market averaged $16,890, up $200 from the prior quarter.
1
|
NEWS RELEASE |
International Drilling adjusted EBITDA totaled $98.3 million, up nearly $10 million. Improved EBITDA across multiple markets more than offset the forecast decline in Colombia. International rig count averaged 77, up slightly from the previous quarter. Daily adjusted gross margin for the second quarter averaged $16,276, up almost 7% from the prior quarter.
Drilling Solutions adjusted EBITDA increased sequentially by 3% to $32.8 million. Growth was led by the Performance Software and Digitalization product lines.
In Rig Technologies, adjusted EBITDA totaled $6.4 million, compared to $5.0 million in the first quarter. Increases in capital equipment, part sales, and energy transition accounted for the sequential improvement in adjusted EBITDA.
Adjusted Free Cash Flow
Adjusted free cash flow totaled $27 million in the second quarter. Capital expenditures totaled $152 million, including $66 million supporting the newbuilds in Saudi Arabia, compared to $119 million in the first quarter, including $37 million supporting the newbuilds in Saudi Arabia.
At the end of the second quarter, net debt was $2.074 billion.
William Restrepo, Nabors CFO, stated, “Our results in the second quarter mirrored the performance of our markets. Our International segment was solid, while our technology businesses also delivered sequential growth. These results helped offset the softening rig markets we had forecast in the Lower 48 and Colombia. We expected lower drilling activity in gas basins but admittedly, the reductions in oil related drilling we experienced were not anticipated. Despite that pause in the Lower 48, our operation in that market continued to generate superior economics, with record margins and substantial cash flow generation.
“Free cash flow in the quarter, although still positive, was impacted by somewhat lower than expected adjusted EBITDA, and higher than planned capital spending. Capex for the newbuild rigs in Saudi Arabia accounted for this variance, as our supplier reached progress milestones earlier than we planned. It is worth highlighting that while our SANAD JV consumed cash during the quarter, free cash flow for the remainder of our business reached almost $60 million. This incremental cash flow supported the redemption in June of approximately $52 million of notes due in September of 2023. At the same time, our revolving credit facility remained undrawn at the end of the second quarter.
“The drilling market should continue to weaken in the Lower 48 during the third quarter. But after a tough first half in the U.S., we are now starting to see signs that this market is bottoming in the third quarter with encouraging data points of incremental activity for the fourth quarter.
“On another positive note, we anticipate further strength in International markets, with early signs of growth developing into awards for incremental rigs. Drilling Solutions and Rig Technologies are also expected to increase sequentially.
2
|
NEWS RELEASE |
“Despite the softness in the Lower 48 market and to a lesser extent in Colombia, we still expect to generate solid adjusted free cash flow for the full year and to continue reducing our net debt.”
Outlook
Nabors expects the following metrics for the third quarter 2023:
U.S. Drilling
| o | Lower 48 average rig count of 74 - 76 rigs |
| o | Lower 48 adjusted gross margin per day approaching $16,000 |
| o | Alaska and Gulf of Mexico adjusted EBITDA down by approximately $7 million due mainly to recertification-related work on the M400 offshore rig |
International
| o | Rig count up by one to two rigs versus the second quarter average |
| o | Adjusted gross margin per day of approximately $16,000 - $16,200 |
Drilling Solutions
| o | Adjusted EBITDA up by approximately 3% above the second quarter |
Rig Technologies
| o | Adjusted EBITDA up by approximately $3 million vs the second quarter |
Capital Expenditures
| o | Capital expenditures of $125 million, with approximately $48 million supporting newbuilds in Saudi Arabia |
Adjusted Free Cash Flow
| o | Adjusted free cash flow for the third quarter of approximately $80 million and for the full year 2023 between $300 and $350 million |
Mr. Petrello concluded, “Our second quarter results demonstrate the strength of our broad portfolio. With the current U.S. market trends, our International segment and technology businesses are even more impactful as we work to attain our free cash flow and leverage goals. As we look to the future, we believe that the worst should be behind us in the Lower 48 and we expect some recovery in the fourth quarter. Further, we anticipate International activity in all our segments to continue improving during the second half of this year. And we are pleased with the progress made in our energy transition businesses. We are excited about what’s to come for Nabors in the second half and during 2024.”
About Nabors Industries
Nabors Industries (NYSE: NBR) is a leading provider of advanced technology for the energy industry. With presence in more than 20 countries, Nabors has established a global network of people, technology and equipment to deploy solutions that deliver safe, efficient and responsible energy production. By leveraging its core competencies, particularly in drilling, engineering, automation, data science and manufacturing, Nabors aims to innovate the future of energy and enable the transition to a lower-carbon world. Learn more about Nabors and its energy technology leadership: www.nabors.com.
3
|
NEWS RELEASE |
Forward-looking Statements
The information included in this press release includes forward-looking statements within the meaning of the Securities Act of 1933 and the Securities Exchange Act of 1934. Such forward-looking statements are subject to a number of risks and uncertainties, as disclosed by Nabors from time to time in its filings with the Securities and Exchange Commission. As a result of these factors, Nabors' actual results may differ materially from those indicated or implied by such forward-looking statements. The forward-looking statements contained in this press release reflect management's estimates and beliefs as of the date of this press release. Nabors does not undertake to update these forward-looking statements.
Non-GAAP Disclaimer
This press release presents certain “non-GAAP” financial measures. The components of these non-GAAP measures are computed by using amounts that are determined in accordance with accounting principles generally accepted in the United States of America (“GAAP”). Adjusted operating income (loss) represents income (loss) from continuing operations before income taxes, interest expense, investment income (loss), and other, net. Adjusted EBITDA is computed similarly, but also excludes depreciation and amortization expenses. In addition, adjusted EBITDA and adjusted operating income (loss) exclude certain cash expenses that the Company is obligated to make. Net debt is calculated as total debt minus the sum of cash, cash equivalents and short-term investments.
Adjusted free cash flow represents net cash provided by operating activities less cash used for capital expenditures, net of proceeds from sales of assets. Management believes that adjusted free cash flow is an important liquidity measure for the company and that it is useful to investors and management as a measure of the company’s ability to generate cash flow, after reinvesting in the company for future growth, that could be available for paying down debt or other financing cash flows, such as dividends to shareholders. Management believes that this non-GAAP measure is useful information to investors when comparing our cash flows with the cash flows of other companies.
4
|
NEWS RELEASE |
Each of these non-GAAP measures has limitations and therefore should not be used in isolation or as a substitute for the amounts reported in accordance with GAAP. However, management evaluates the performance of its operating segments and the consolidated Company based on several criteria, including Adjusted EBITDA, adjusted operating income (loss), net debt, and adjusted free cash flow, because it believes that these financial measures accurately reflect the Company’s ongoing profitability and performance. Securities analysts and investors also use these measures as some of the metrics on which they analyze the Company’s performance. Other companies in this industry may compute these measures differently. Reconciliations of consolidated adjusted EBITDA and adjusted operating income (loss) to income (loss) from continuing operations before income taxes, net debt to total debt, and adjusted free cash flow to net cash provided by operations, which are their nearest comparable GAAP financial measures, are included in the tables at the end of this press release. We do not provide a forward-looking reconciliation of our outlook for Segment Adjusted EBITDA, Segment Gross Margin or Adjusted Free Cash Flow, as the amount and significance of items required to develop meaningful comparable GAAP financial measures cannot be estimated at this time without unreasonable efforts. These special items could be meaningful.
Investor Contacts: William C. Conroy, CFA, Vice President of Corporate Development & Investor Relations, +1 281-775-2423 or via e-mail william.conroy@nabors.com, or Kara Peak, Director of Corporate Development & Investor Relations, +1 281-775-4954 or via email kara.peak@nabors.com. To request investor materials, contact Nabors' corporate headquarters in Hamilton, Bermuda at +441-292-1510 or via e-mail mark.andrews@nabors.com
5
| NABORS INDUSTRIES LTD. AND SUBSIDIARIES | ||||||||||||||||||||
| CONDENSED CONSOLIDATED STATEMENTS OF INCOME (LOSS) | ||||||||||||||||||||
| (Unaudited) | ||||||||||||||||||||
| Three Months Ended | Six Months Ended | |||||||||||||||||||
| June 30, | March 31, | June 30, | ||||||||||||||||||
| (In thousands, except per share amounts) | 2023 | 2022 | 2023 | 2023 | 2022 | |||||||||||||||
| Revenues and other income: | ||||||||||||||||||||
| Operating revenues | $ | 767,067 | $ | 630,943 | $ | 779,139 | $ | 1,546,206 | $ | 1,199,482 | ||||||||||
| Investment income (loss) | 11,743 | 822 | 9,866 | 21,609 | 985 | |||||||||||||||
| Total revenues and other income | 778,810 | 631,765 | 789,005 | 1,567,815 | 1,200,467 | |||||||||||||||
| Costs and other deductions: | ||||||||||||||||||||
| Direct costs | 455,531 | 403,797 | 462,329 | 917,860 | 776,509 | |||||||||||||||
| General and administrative expenses | 63,232 | 58,167 | 61,730 | 124,962 | 111,806 | |||||||||||||||
| Research and engineering | 13,281 | 10,941 | 15,074 | 28,355 | 22,619 | |||||||||||||||
| Depreciation and amortization | 159,698 | 162,015 | 163,031 | 322,729 | 326,374 | |||||||||||||||
| Interest expense | 46,164 | 42,899 | 45,141 | 91,305 | 89,809 | |||||||||||||||
| Other, net | (1,775 | ) | 14,528 | (42,375 | ) | (44,150 | ) | 94,929 | ||||||||||||
| Total costs and other deductions | 736,131 | 692,347 | 704,930 | 1,441,061 | 1,422,046 | |||||||||||||||
| Income (loss) before income taxes | 42,679 | (60,582 | ) | 84,075 | 126,754 | (221,579 | ) | |||||||||||||
| Income tax expense (benefit) | 26,448 | 9,353 | 23,015 | 49,463 | 23,024 | |||||||||||||||
| Net income (loss) | 16,231 | (69,935 | ) | 61,060 | 77,291 | (244,603 | ) | |||||||||||||
| Less: Net (income) loss attributable to noncontrolling interest | (11,620 | ) | (12,982 | ) | (11,836 | ) | (23,456 | ) | (22,810 | ) | ||||||||||
| Net income (loss) attributable to Nabors | $ | 4,611 | $ | (82,917 | ) | $ | 49,224 | $ | 53,835 | $ | (267,413 | ) | ||||||||
| Earnings (losses) per share: | ||||||||||||||||||||
| Basic | $ | (0.31 | ) | $ | (9.41 | ) | $ | 4.39 | $ | 4.05 | $ | (31.34 | ) | |||||||
| Diluted | $ | (0.31 | ) | $ | (9.41 | ) | $ | 4.11 | $ | 3.79 | $ | (31.34 | ) | |||||||
| Weighted-average number of common shares outstanding: | ||||||||||||||||||||
| Basic | 9,195 | 9,081 | 9,160 | 9,178 | 8,696 | |||||||||||||||
| Diluted | 9,195 | 9,081 | 9,867 | 10,141 | 8,696 | |||||||||||||||
| Adjusted EBITDA | $ | 235,023 | $ | 158,038 | $ | 240,006 | $ | 475,029 | $ | 288,548 | ||||||||||
| Adjusted operating income (loss) | $ | 75,325 | $ | (3,977 | ) | $ | 76,975 | $ | 152,300 | $ | (37,826 | ) | ||||||||
1-1
| NABORS INDUSTRIES LTD. AND SUBSIDIARIES | ||||||||||||
| CONDENSED CONSOLIDATED BALANCE SHEETS | ||||||||||||
| (Unaudited) | ||||||||||||
| June 30, | March 31, | December 31, | ||||||||||
| (In thousands) | 2023 | 2023 | 2022 | |||||||||
| ASSETS | ||||||||||||
| Current assets: | ||||||||||||
| Cash and short-term investments | $ | 429,059 | $ | 475,732 | $ | 452,315 | ||||||
| Accounts receivable, net | 297,388 | 307,005 | 327,397 | |||||||||
| Other current assets | 251,687 | 230,506 | 220,911 | |||||||||
| Total current assets | 978,134 | 1,013,243 | 1,000,623 | |||||||||
| Property, plant and equipment, net | 2,963,898 | 2,976,831 | 3,026,100 | |||||||||
| Other long-term assets | 521,235 | 709,902 | 703,131 | |||||||||
| Total assets | $ | 4,463,267 | $ | 4,699,976 | $ | 4,729,854 | ||||||
| LIABILITIES AND EQUITY | ||||||||||||
| Current liabilities: | ||||||||||||
| Trade accounts payable | $ | 301,751 | $ | 306,543 | $ | 314,041 | ||||||
| Other current liabilities | 242,514 | 233,935 | 282,349 | |||||||||
| Total current liabilities | 544,265 | 540,478 | 596,390 | |||||||||
| Long-term debt | 2,503,250 | 2,562,327 | 2,537,540 | |||||||||
| Other long-term liabilities | 310,263 | 323,694 | 380,529 | |||||||||
| Total liabilities | 3,357,778 | 3,426,499 | 3,514,459 | |||||||||
| Redeemable noncontrolling interest in subsidiary | 513,817 | 691,095 | 678,604 | |||||||||
| Equity: | ||||||||||||
| Shareholders' equity | 402,650 | 402,711 | 368,956 | |||||||||
| Noncontrolling interest | 189,022 | 179,671 | 167,835 | |||||||||
| Total equity | 591,672 | 582,382 | 536,791 | |||||||||
| Total liabilities and equity | $ | 4,463,267 | $ | 4,699,976 | $ | 4,729,854 | ||||||
1-2
NABORS INDUSTRIES LTD. AND SUBSIDIARIES
SEGMENT REPORTING
(Unaudited)
The following tables set forth certain information with respect to our reportable segments and rig activity:
| Three Months Ended | Six Months Ended | |||||||||||||||||||
| June 30, | March 31, | June 30, | ||||||||||||||||||
| (In thousands, except rig activity) | 2023 | 2022 | 2023 | 2023 | 2022 | |||||||||||||||
| Operating revenues: | ||||||||||||||||||||
| U.S. Drilling | $ | 314,830 | $ | 253,008 | $ | 350,652 | $ | 665,482 | $ | 470,591 | ||||||||||
| International Drilling | 337,650 | 296,320 | 320,048 | 657,698 | 575,350 | |||||||||||||||
| Drilling Solutions | 76,855 | 55,879 | 75,043 | 151,898 | 110,061 | |||||||||||||||
| Rig Technologies (1) | 63,565 | 45,094 | 58,479 | 122,044 | 81,830 | |||||||||||||||
| Other reconciling items (2) | (25,833 | ) | (19,358 | ) | (25,083 | ) | (50,916 | ) | (38,350 | ) | ||||||||||
| Total operating revenues | $ | 767,067 | $ | 630,943 | $ | 779,139 | $ | 1,546,206 | $ | 1,199,482 | ||||||||||
| Adjusted EBITDA: (3) | ||||||||||||||||||||
| U.S. Drilling | $ | 141,446 | $ | 87,371 | $ | 156,489 | $ | 297,935 | $ | 161,636 | ||||||||||
| International Drilling | 98,331 | 82,446 | 88,608 | 186,939 | 153,694 | |||||||||||||||
| Drilling Solutions | 32,756 | 22,751 | 31,914 | 64,670 | 42,751 | |||||||||||||||
| Rig Technologies (1) | 6,408 | 3,364 | 4,954 | 11,362 | 2,320 | |||||||||||||||
| Other reconciling items (4) | (43,918 | ) | (37,894 | ) | (41,959 | ) | (85,877 | ) | (71,853 | ) | ||||||||||
| Total adjusted EBITDA | $ | 235,023 | $ | 158,038 | $ | 240,006 | $ | 475,029 | $ | 288,548 | ||||||||||
| Adjusted operating income (loss): (5) | ||||||||||||||||||||
| U.S. Drilling | $ | 75,408 | $ | 8,288 | $ | 85,869 | $ | 161,277 | $ | 2,437 | ||||||||||
| International Drilling | 10,407 | 4,605 | 1,957 | 12,364 | (1,722 | ) | ||||||||||||||
| Drilling Solutions | 28,351 | 18,260 | 27,138 | 55,489 | 32,969 | |||||||||||||||
| Rig Technologies (1) | 5,052 | 2,127 | 3,694 | 8,746 | (624 | ) | ||||||||||||||
| Other reconciling items (4) | (43,893 | ) | (37,257 | ) | (41,683 | ) | (85,576 | ) | (70,886 | ) | ||||||||||
| Total adjusted operating income (loss) | $ | 75,325 | $ | (3,977 | ) | $ | 76,975 | $ | 152,300 | $ | (37,826 | ) | ||||||||
| Rig activity: | ||||||||||||||||||||
| Average Rigs Working: (7) | ||||||||||||||||||||
| Lower 48 | 81.6 | 89.3 | 93.3 | 87.4 | 86.3 | |||||||||||||||
| Other US | 7.0 | 7.1 | 7.0 | 7.0 | 7.0 | |||||||||||||||
| U.S. Drilling | 88.6 | 96.4 | 100.3 | 94.4 | 93.3 | |||||||||||||||
| International Drilling | 77.1 | 74.3 | 76.4 | 76.8 | 73.2 | |||||||||||||||
| Total average rigs working | 165.7 | 170.7 | 176.7 | 171.2 | 166.5 | |||||||||||||||
| Daily Rig Revenue: (6),(8) | ||||||||||||||||||||
| Lower 48 | $ | 36,751 | $ | 25,566 | $ | 36,453 | $ | 36,593 | $ | 24,348 | ||||||||||
| Other US | 65,860 | 70,181 | 70,690 | 68,263 | 71,116 | |||||||||||||||
| U.S. Drilling (10) | 39,049 | 28,852 | 38,842 | 38,940 | 27,856 | |||||||||||||||
| International Drilling | 48,106 | 43,808 | 46,517 | 47,319 | 43,445 | |||||||||||||||
| Daily Adjusted Gross Margin: (6),(9) | ||||||||||||||||||||
| Lower 48 | $ | 16,890 | $ | 8,706 | $ | 16,690 | $ | 16,784 | $ | 8,220 | ||||||||||
| Other US | 35,932 | 36,300 | 37,114 | 36,520 | 36,759 | |||||||||||||||
| U.S. Drilling (10) | 18,394 | 10,738 | 18,115 | 18,246 | 10,361 | |||||||||||||||
| International Drilling | 16,276 | 14,331 | 15,222 | 15,754 | 13,746 | |||||||||||||||
1-3
| (1) | Includes our oilfield equipment manufacturing activities. |
| (2) | Represents the elimination of inter-segment transactions related to our Rig Technologies operating segment. |
| (3) | Adjusted EBITDA represents net income (loss) before income tax expense (benefit), investment income (loss), interest expense, other, net and depreciation and amortization. Adjusted EBITDA is a non-GAAP financial measure and should not be used in isolation or as a substitute for the amounts reported in accordance with GAAP. In addition, adjusted EBITDA excludes certain cash expenses that the Company is obligated to make. However, management evaluates the performance of its operating segments and the consolidated Company based on several criteria, including adjusted EBITDA and adjusted operating income (loss), because it believes that these financial measures accurately reflect the Company’s ongoing profitability and performance. Securities analysts and investors use this measure as one of the metrics on which they analyze the Company’s performance. Other companies in this industry may compute these measures differently. A reconciliation of this non-GAAP measure to net income (loss), which is the most closely comparable GAAP measure, is provided in the table set forth immediately following the heading "Reconciliation of Non-GAAP Financial Measures to Net Income (Loss)". |
| (4) | Represents the elimination of inter-segment transactions and unallocated corporate expenses. |
| (5) | Adjusted operating income (loss) represents net income (loss) before income tax expense (benefit), investment income (loss), interest expense and other, net. Adjusted operating income (loss) is a non-GAAP financial measure and should not be used in isolation or as a substitute for the amounts reported in accordance with GAAP. In addition, adjusted operating income (loss) excludes certain cash expenses that the Company is obligated to make. However, management evaluates the performance of its operating segments and the consolidated Company based on several criteria, including adjusted EBITDA and adjusted operating income (loss), because it believes that these financial measures accurately reflect the Company’s ongoing profitability and performance. Securities analysts and investors use this measure as one of the metrics on which they analyze the Company’s performance. Other companies in this industry may compute these measures differently. A reconciliation of this non-GAAP measure to net income (loss), which is the most closely comparable GAAP measure, is provided in the table set forth immediately following the heading "Reconciliation of Non-GAAP Financial Measures to Net Income (Loss)". |
| (6) | Rig revenue days represents the number of days the Company's rigs are contracted and performing under a contract during the period. These would typically include days in which operating, standby and move revenue is earned. |
| (7) | Average rigs working represents a measure of the average number of rigs operating during a given period. For example, one rig operating 45 days during a quarter represents approximately 0.5 average rigs working for the quarter. On an annual period, one rig operating 182.5 days represents approximately 0.5 average rigs working for the year. Average rigs working can also be calculated as rig revenue days during the period divided by the number of calendar days in the period. |
| (8) | Daily rig revenue represents operating revenue, divided by the total number of revenue days during the quarter. |
| (9) | Daily adjusted gross margin represents operating revenue less direct costs, divided by the total number of rig revenue days during the quarter. |
| (10) | The U.S. Drilling segment includes the Lower 48, Alaska, and Gulf of Mexico operating areas. |
1-4
NABORS INDUSTRIES LTD. AND SUBSIDIARIES
NON-GAAP FINANCIAL MEASURES
RECONCILIATION OF ADJUSTED EBITDA BY SEGMENT TO ADJUSTED OPERATING INCOME (LOSS) BY SEGMENT
(Unaudited)
| (In thousands) | ||||||||||||||||||||||||
| Three Months Ended June 30, 2023 | ||||||||||||||||||||||||
| U.S. Drilling | International Drilling | Drilling Solutions | Rig Technologies | Other reconciling items | Total | |||||||||||||||||||
| Adjusted operating income (loss) | $ | 75,408 | $ | 10,407 | $ | 28,351 | $ | 5,052 | $ | (43,893 | ) | $ | 75,325 | |||||||||||
| Depreciation and amortization | 66,038 | 87,924 | 4,405 | 1,356 | (25 | ) | 159,698 | |||||||||||||||||
| Adjusted EBITDA | $ | 141,446 | $ | 98,331 | $ | 32,756 | $ | 6,408 | $ | (43,918 | ) | $ | 235,023 | |||||||||||
| Three Months Ended June 30, 2022 | ||||||||||||||||||||||||
| U.S. Drilling | International Drilling | Drilling Solutions | Rig Technologies | Other reconciling items | Total | |||||||||||||||||||
| Adjusted operating income (loss) | $ | 8,288 | $ | 4,605 | $ | 18,260 | $ | 2,127 | $ | (37,257 | ) | $ | (3,977 | ) | ||||||||||
| Depreciation and amortization | 79,083 | 77,841 | 4,491 | 1,237 | (637 | ) | 162,015 | |||||||||||||||||
| Adjusted EBITDA | $ | 87,371 | $ | 82,446 | $ | 22,751 | $ | 3,364 | $ | (37,894 | ) | $ | 158,038 | |||||||||||
| Three Months Ended March 31, 2023 | ||||||||||||||||||||||||
| U.S. Drilling | International Drilling | Drilling Solutions | Rig Technologies | Other reconciling items | Total | |||||||||||||||||||
| Adjusted operating income (loss) | $ | 85,869 | $ | 1,957 | $ | 27,138 | $ | 3,694 | $ | (41,683 | ) | $ | 76,975 | |||||||||||
| Depreciation and amortization | 70,620 | 86,651 | 4,776 | 1,260 | (276 | ) | 163,031 | |||||||||||||||||
| Adjusted EBITDA | $ | 156,489 | $ | 88,608 | $ | 31,914 | $ | 4,954 | $ | (41,959 | ) | $ | 240,006 | |||||||||||
| Six Months Ended June 30, 2023 | ||||||||||||||||||||||||
| U.S. Drilling | International Drilling | Drilling Solutions | Rig Technologies | Other reconciling items | Total | |||||||||||||||||||
| Adjusted operating income (loss) | $ | 161,277 | $ | 12,364 | $ | 55,489 | $ | 8,746 | $ | (85,576 | ) | $ | 152,300 | |||||||||||
| Depreciation and amortization | 136,658 | 174,575 | 9,181 | 2,616 | (301 | ) | 322,729 | |||||||||||||||||
| Adjusted EBITDA | $ | 297,935 | $ | 186,939 | $ | 64,670 | $ | 11,362 | $ | (85,877 | ) | $ | 475,029 | |||||||||||
| Six Months Ended June 30, 2022 | ||||||||||||||||||||||||
| U.S. Drilling | International Drilling | Drilling Solutions | Rig Technologies | Other reconciling items | Total | |||||||||||||||||||
| Adjusted operating income (loss) | $ | 2,437 | $ | (1,722 | ) | $ | 32,969 | $ | (624 | ) | $ | (70,886 | ) | $ | (37,826 | ) | ||||||||
| Depreciation and amortization | 159,199 | 155,416 | 9,782 | 2,944 | (967 | ) | 326,374 | |||||||||||||||||
| Adjusted EBITDA | $ | 161,636 | $ | 153,694 | $ | 42,751 | $ | 2,320 | $ | (71,853 | ) | $ | 288,548 | |||||||||||
1-5
NABORS INDUSTRIES LTD. AND SUBSIDIARIES
NON-GAAP FINANCIAL MEASURES
RECONCILIATION OF ADJUSTED GROSS MARGIN BY SEGMENT TO ADJUSTED OPERATING INCOME (LOSS) BY SEGMENT
(Unaudited)
| Three Months Ended | Six Months Ended | ||||||||||||||||||||
| June 30, | March 31, | June 30, | |||||||||||||||||||
| (In thousands) | 2023 | 2022 | 2023 | 2023 | 2022 | ||||||||||||||||
| Lower 48 - U.S. Drilling | |||||||||||||||||||||
| Adjusted operating income (loss) | $ | 60,496 | $ | (937 | ) | $ | 74,071 | $ | 134,567 | $ | (15,533 | ) | |||||||||
| Plus: General and administrative costs | 5,209 | 4,740 | 5,056 | 10,264 | 9,185 | ||||||||||||||||
| Plus: Research and engineering | 1,189 | 1,611 | 1,519 | 2,708 | 3,250 | ||||||||||||||||
| GAAP Gross Margin | 66,894 | 5,414 | 80,646 | 147,539 | (3,098 | ) | |||||||||||||||
| Plus: Depreciation and amortization | 58,533 | 65,312 | 59,507 | 118,041 | 131,556 | ||||||||||||||||
| Adjusted gross margin | $ | 125,427 | $ | 70,726 | $ | 140,153 | $ | 265,580 | $ | 128,458 | |||||||||||
| Other - U.S. Drilling | |||||||||||||||||||||
| Adjusted operating income (loss) | $ | 14,912 | $ | 9,225 | $ | 11,798 | $ | 26,710 | $ | 17,970 | |||||||||||
| Plus: General and administrative costs | 323 | 307 | 345 | 668 | 691 | ||||||||||||||||
| Plus: Research and engineering | 132 | 139 | 128 | 259 | 270 | ||||||||||||||||
| GAAP Gross Margin | 15,367 | 9,671 | 12,271 | 27,637 | 18,931 | ||||||||||||||||
| Plus: Depreciation and amortization | 7,504 | 13,771 | 11,111 | 18,616 | 27,644 | ||||||||||||||||
| Adjusted gross margin | $ | 22,871 | $ | 23,442 | $ | 23,382 | $ | 46,253 | $ | 46,575 | |||||||||||
| U.S. Drilling | |||||||||||||||||||||
| Adjusted operating income (loss) | $ | 75,408 | $ | 8,288 | $ | 85,869 | $ | 161,277 | $ | 2,437 | |||||||||||
| Plus: General and administrative costs | 5,532 | 5,047 | 5,401 | 10,932 | 9,876 | ||||||||||||||||
| Plus: Research and engineering | 1,321 | 1,750 | 1,647 | 2,967 | 3,520 | ||||||||||||||||
| GAAP Gross Margin | 82,261 | 15,085 | 92,917 | 175,176 | 15,833 | ||||||||||||||||
| Plus: Depreciation and amortization | 66,037 | 79,083 | 70,618 | 136,657 | 159,200 | ||||||||||||||||
| Adjusted gross margin | $ | 148,298 | $ | 94,168 | $ | 163,535 | $ | 311,833 | $ | 175,033 | |||||||||||
| International Drilling | |||||||||||||||||||||
| Adjusted operating income (loss) | $ | 10,407 | $ | 4,605 | $ | 1,957 | $ | 12,364 | $ | (1,722 | ) | ||||||||||
| Plus: General and administrative costs | 14,089 | 13,056 | 14,336 | 28,424 | 25,539 | ||||||||||||||||
| Plus: Research and engineering | 1,821 | 1,433 | 1,785 | 3,606 | 2,802 | ||||||||||||||||
| GAAP Gross Margin | 26,317 | 19,094 | 18,078 | 44,394 | 26,619 | ||||||||||||||||
| Plus: Depreciation and amortization | 87,924 | 77,842 | 86,651 | 174,576 | 155,416 | ||||||||||||||||
| Adjusted gross margin | $ | 114,241 | $ | 96,936 | $ | 104,729 | $ | 218,970 | $ | 182,035 | |||||||||||
Adjusted gross margin by segment represents adjusted operating income (loss) plus general and administrative costs, research and engineering costs and depreciation and amortization.
1-6
NABORS INDUSTRIES LTD. AND SUBSIDIARIES
RECONCILIATION OF NON-GAAP FINANCIAL MEASURES TO NET INCOME (LOSS)
(Unaudited)
| Three Months Ended | Six Months Ended | |||||||||||||||||||
| June 30, | March 31, | June 30, | ||||||||||||||||||
| (In thousands) | 2023 | 2022 | 2023 | 2023 | 2022 | |||||||||||||||
| Net income (loss) | 16,231 | (69,935 | ) | 61,060 | 77,291 | (244,603 | ) | |||||||||||||
| Income tax expense (benefit) | 26,448 | 9,353 | 23,015 | 49,463 | 23,024 | |||||||||||||||
| Income (loss) from continuing operations before income taxes | 42,679 | (60,582 | ) | 84,075 | 126,754 | (221,579 | ) | |||||||||||||
| Investment (income) loss | (11,743 | ) | (822 | ) | (9,866 | ) | (21,609 | ) | (985 | ) | ||||||||||
| Interest expense | 46,164 | 42,899 | 45,141 | 91,305 | 89,809 | |||||||||||||||
| Other, net | (1,775 | ) | 14,528 | (42,375 | ) | (44,150 | ) | 94,929 | ||||||||||||
| Adjusted operating income (loss) (1) | 75,325 | (3,977 | ) | 76,975 | 152,300 | (37,826 | ) | |||||||||||||
| Depreciation and amortization | 159,698 | 162,015 | 163,031 | 322,729 | 326,374 | |||||||||||||||
| Adjusted EBITDA (2) | $ | 235,023 | $ | 158,038 | $ | 240,006 | $ | 475,029 | $ | 288,548 | ||||||||||
(1) Adjusted operating income (loss) represents net income (loss) before income tax expense (benefit), investment income (loss), interest expense, and other, net. Adjusted operating income (loss) is a non-GAAP financial measure and should not be used in isolation or as a substitute for the amounts reported in accordance with GAAP. In addition, adjusted operating income (loss) excludes certain cash expenses that the Company is obligated to make. However, management evaluates the performance of its operating segments and the consolidated Company based on several criteria, including adjusted EBITDA and adjusted operating income (loss), because it believes that these financial measures accurately reflect the Company’s ongoing profitability and performance. Securities analysts and investors use this measure as one of the metrics on which they analyze the Company’s performance. Other companies in this industry may compute these measures differently.
(2) Adjusted EBITDA represents net income (loss) before income tax expense (benefit), investment income (loss), interest expense, other, net and depreciation and amortization. Adjusted EBITDA is a non-GAAP financial measure and should not be used in isolation or as a substitute for the amounts reported in accordance with GAAP. In addition, adjusted EBITDA excludes certain cash expenses that the Company is obligated to make. However, management evaluates the performance of its operating segments and the consolidated Company based on several criteria, including adjusted EBITDA and adjusted operating income (loss), because it believes that these financial measures accurately reflect the Company’s ongoing profitability and performance. Securities analysts and investors use this measure as one of the metrics on which they analyze the Company’s performance. Other companies in this industry may compute these measures differently.
1-7
NABORS INDUSTRIES LTD. AND SUBSIDIARIES
RECONCILIATION OF NET DEBT TO TOTAL DEBT
(Unaudited)
| June 30, | March 31, | December 31, | ||||||||||
| (In thousands) | 2023 | 2023 | 2022 | |||||||||
| Long-term debt | $ | 2,503,250 | $ | 2,562,327 | $ | 2,537,540 | ||||||
| Less: Cash and short-term investments | 429,059 | 475,732 | 452,315 | |||||||||
| Net Debt | $ | 2,074,191 | $ | 2,086,595 | $ | 2,085,225 | ||||||
1-8
NABORS INDUSTRIES LTD. AND SUBSIDIARIES
RECONCILIATION OF ADJUSTED FREE CASH FLOW TO
NET CASH PROVIDED BY OPERATING ACTIVITIES
(Unaudited)
| Three Months Ended | Six Months Ended | |||||||||||
| June 30, | March 31, | June 30, | ||||||||||
| (In thousands) | 2023 | 2023 | 2023 | |||||||||
| Net cash provided by operating activities | $ | 168,466 | $ | 154,050 | $ | 322,516 | ||||||
| Add: Capital expenditures, net of proceeds from sales of assets | (141,683 | ) | (116,752 | ) | (258,435 | ) | ||||||
| Adjusted free cash flow | $ | 26,783 | $ | 37,298 | $ | 64,081 | ||||||
Adjusted free cash flow represents net cash provided by operating activities less cash used for capital expenditures, net of proceeds from sales of assets. Management believes that adjusted free cash flow is an important liquidity measure for the company and that it is useful to investors and management as a measure of the company’s ability to generate cash flow, after reinvesting in the company for future growth, that could be available for paying down debt or other financing cash flows, such as dividends to shareholders. Adjusted free cash flow does not represent the residual cash flow available for discretionary expenditures. Adjusted free cash flow is a non-GAAP financial measure that should be considered in addition to, not as a substitute for or superior to, cash flow from operations reported in accordance with GAAP.
1-9
| NABORS INDUSTRIES LTD. July 26, 2023 2Q 2023 Earnings Presentation |
| N A B O R S . C O M We often discuss expectations regarding our future markets, demand for our products and services, and our performance in our annual, quarterly, and current reports, press releases, and other written and oral statements. Such statements, including statements in this document that relate to matters that are not historical facts, are “forward-looking statements” within the meaning of the safe harbor provisions of Section 27A of the U.S. Securities Act of 1933 and Section 21E of the U.S. Securities Exchange Act of 1934. These “forward-looking statements” are based on our analysis of currently available competitive, financial and economic data and our operating plans. They are inherently uncertain, and investors should recognize that events and actual results could turn out to be significantly different from our expectations. Factors to consider when evaluating these forward-looking statements include, but are not limited to: • actual and potential political or economic instability, civil disturbance, war or acts of terrorism involving any of the countries in which we do business; • the Covid-19 pandemic and its impact on oil and gas markets and prices; • fluctuations and volatility in worldwide prices of and demand for oil and natural gas; • fluctuations in levels of oil and natural gas exploration and development activities; • fluctuations in the demand for our services; • competitive and technological changes and other developments in the oil and gas and oilfield services industries; • our ability to renew customer contracts in order to maintain competitiveness; • the existence of operating risks inherent in the oil and gas and oilfield services industries; • the possibility of the loss of one or a number of our large customers; • the impact of long-term indebtedness and other financial commitments on our financial and operating flexibility; • our access to and the cost of capital, including the impact of a further downgrade in our credit rating, covenant restrictions, availability under our revolving credit facility, and future issuances of debt or equity securities and the global interest rate environment; • our dependence on our operating subsidiaries and investments to meet our financial obligations; 2 Forward Looking Statements • our ability to retain skilled employees; • our ability to complete, and realize the expected benefits of, strategic transactions; • changes in tax laws and the possibility of changes in other laws and regulation; • the possibility of changes to U.S. trade policies and regulations including the imposition of trade embargoes or sanctions; and • general economic conditions, including inflation, rising interest rates and the general status of the capital and credit markets. Our businesses depend, to a large degree, on the level of spending by oil and gas companies for exploration, development and production activities. Therefore, sustained lower oil or natural gas prices that have a material impact on exploration, development or production activities could also materially affect our financial position, results of operations and cash flows. The above description of risks and uncertainties is by no means all-inclusive but is designed to highlight what we believe are important factors to consider. For a discussion of these factors and other risks and uncertainties, please refer to our filings with the Securities and Exchange Commission ("SEC"), including those contained in our Annual Reports on Form 10-K and Quarterly Reports on Form 10-Q, which are available at the SEC's website at www.sec.gov. We undertake no obligation to publicly update or revise any forward-looking statement as a result of new information, future events or otherwise, except as otherwise required by law. Non-GAAP Financial Measures This presentation refers to certain “non-GAAP” financial measures, such as adjusted EBITDA, net debt and adjusted free cash flow. The components of these non-GAAP measures are computed by using amounts that are determined in accordance with accounting principles generally accepted in the United States of America (“GAAP”). Reconciliations of non-GAAP measures to the most comparable GAAP measures are provided in the Appendix at the end of this presentation. |
| N A B O R S . C O M 3 June 30 Rig Utilization and Availability RIG FLEET(1)(2) 328 RIGS ON REVENUE(1) 161 UTILIZATION AT 6/30/2023 49% TOTAL U.S. OFFSHORE 12 3 25% 16 4 25% ALASKA INTERNATIONAL 134 76 57% 111 78 70% U.S. LOWER-48 HIGH SPEC(2) (1) As of June 30, 2023 (2) Excludes non-high spec rigs in the Lower 48 |
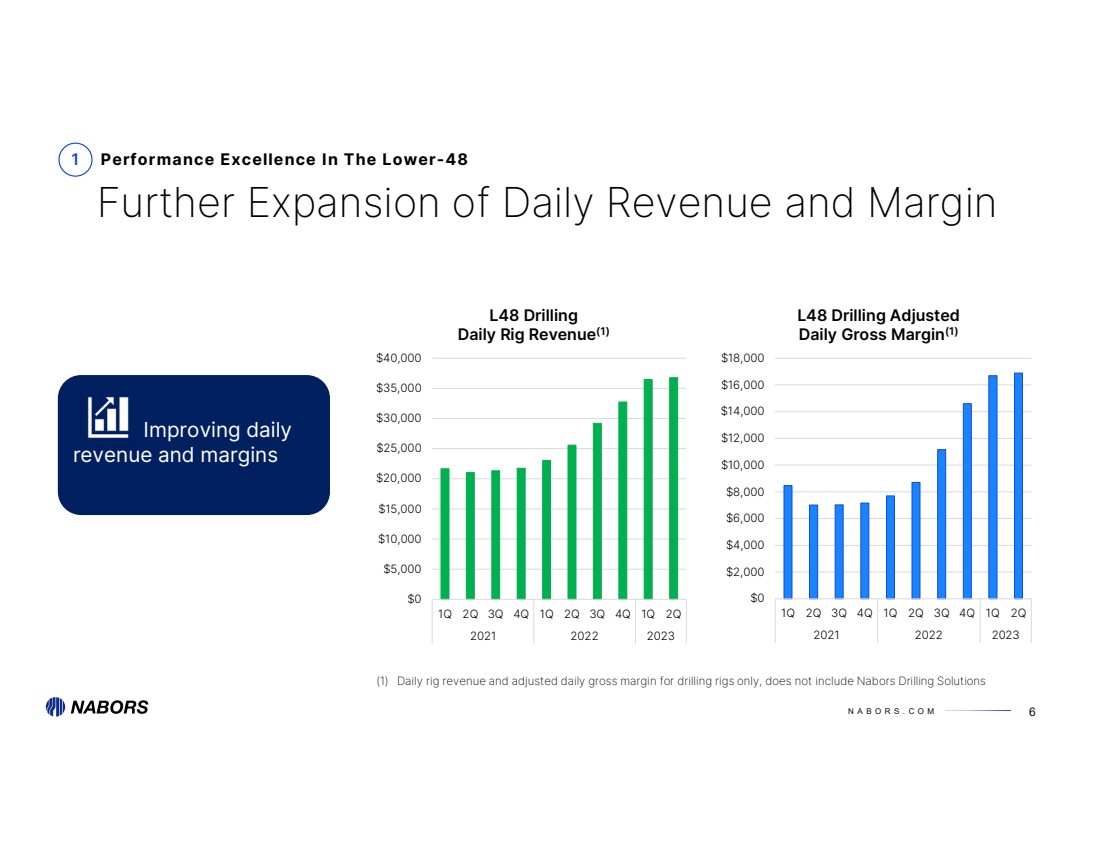
| N A B O R S . C O M Improving leverage Adjusted 2Q free cash flow of $27M on strong collections and disciplined capex Redeemed $52M notes due in Sep’23 RCF undrawn on Jun 30th 2Q 2023 adjusted EBITDA of $235M Adjusted EBITDA up 49% year-on-year Lower 48 EBITDA down offset by increases in all other segments Drilling Solutions growth 2Q adjusted EBITDA of $33M, 3% growth vs 1Q Adjusted gross margin(2) of 52% in 2Q Grew 2Q third party revenue by 18% vs 1Q Adjusted EBITDA up 44% year-on-year International improving Saudi Arabia update: • 3rd newbuild was deployed in mid-2Q • Two rigs anticipated to start in 2023 • Five additional newbuilds awarded Added 1 rig in Argentina in 2Q, and expect to start 1 rig in the Middle East in 3Q Awarded 4 rigs in Algeria ESG focus PowerTAP™ grid power installations up 27% Growing revenue and EBITDA from our Energy Transition portfolio On target to meet emissions reduction goal for 2023 Recent Highlights Note: For reconciliations of adjusted EBITDA, adjusted gross margin, net debt and adjusted free cash flow to the most comparable GAAP measure see non-GAAP measures in the Appendix Continued improvement in L48 Drilling economics 2Q adjusted daily gross margin increased $200 to ~$16,900(1) 2Q daily revenue of $36,750 increased by $300 sequentially (1) Adjusted daily gross margin represents adjusted gross margin (operating revenue less direct costs), divided by the total number of rig revenue days during the quarter. Rig revenue days represents the number of days the Company’s rigs are contracted and performing under a contract during the period. (2) Adjusted gross margin percent represents adjusted gross margin divided by total revenue |
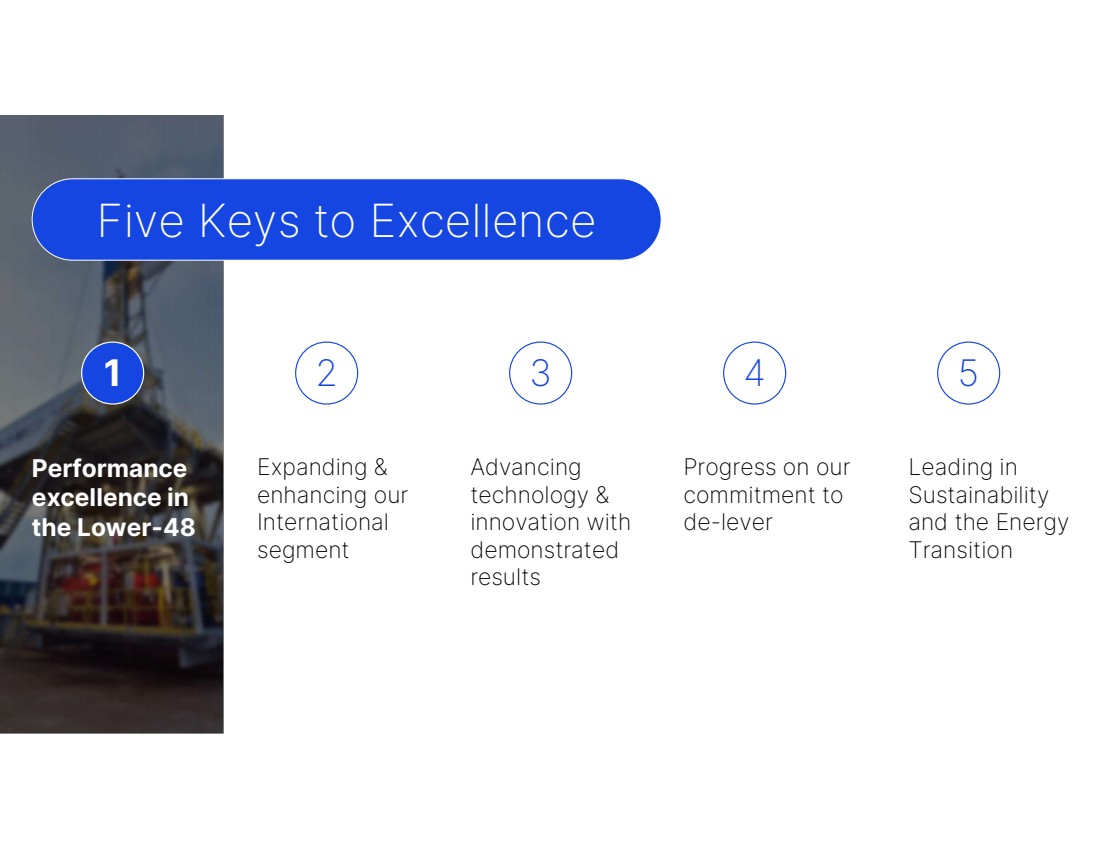
| N A B O R S . C O M Performance excellence in the Lower-48 Expanding & enhancing our International segment Advancing technology & innovation with demonstrated results Progress on our commitment to de-lever Leading in Sustainability and the Energy Transition Five Keys to Excellence 1 2 3 4 5 |
| N A B O R S . C O M 6 Improving daily revenue and margins 1 Performance Excellence In The Lower-48 Further Expansion of Daily Revenue and Margin (1) Daily rig revenue and adjusted daily gross margin for drilling rigs only, does not include Nabors Drilling Solutions $0 $5,000 $10,000 $15,000 $20,000 $25,000 $30,000 $35,000 $40,000 1Q 2Q 3Q 4Q 1Q 2Q 3Q 4Q 1Q 2Q 2021 2022 2023 L48 Drilling Daily Rig Revenue(1) $0 $2,000 $4,000 $6,000 $8,000 $10,000 $12,000 $14,000 $16,000 $18,000 1Q 2Q 3Q 4Q 1Q 2Q 3Q 4Q 1Q 2Q 2021 2022 2023 L48 Drilling Adjusted Daily Gross Margin(1) |
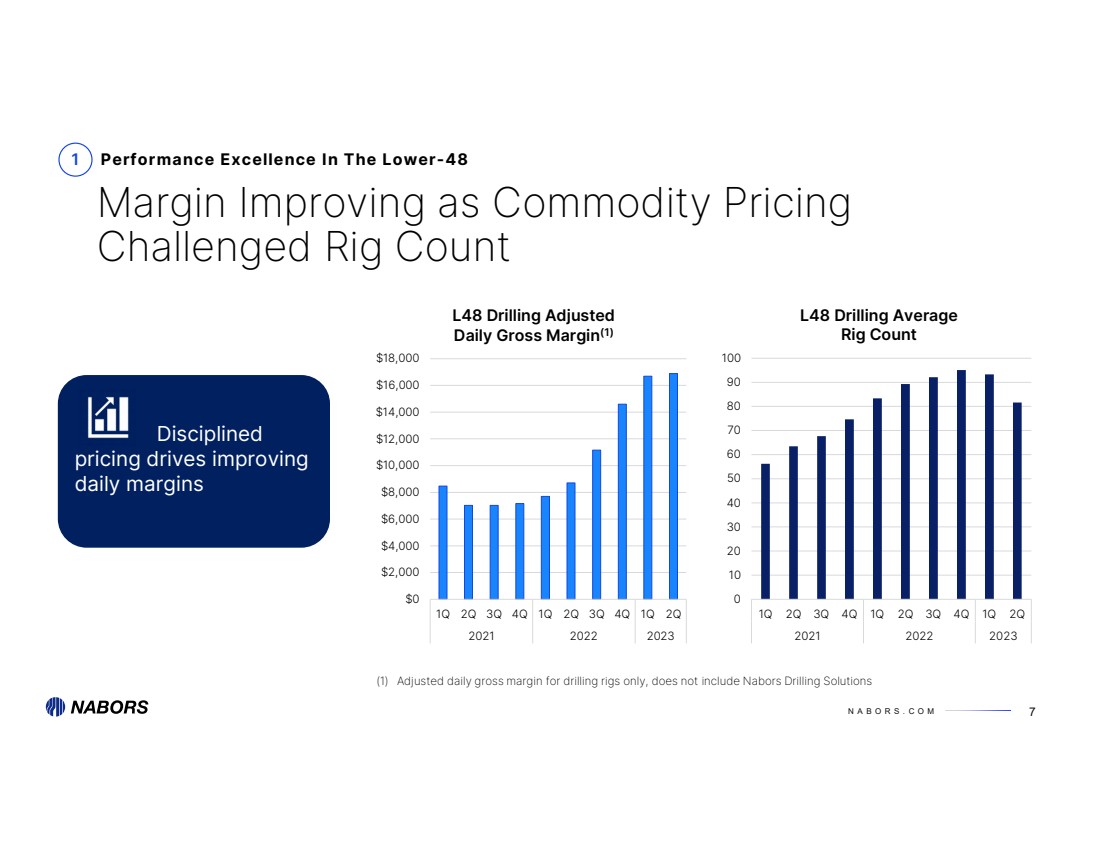
| N A B O R S . C O M $0 $2,000 $4,000 $6,000 $8,000 $10,000 $12,000 $14,000 $16,000 $18,000 1Q 2Q 3Q 4Q 1Q 2Q 3Q 4Q 1Q 2Q 2021 2022 2023 L48 Drilling Adjusted Daily Gross Margin(1) 0 10 20 30 40 50 60 70 80 90 100 1Q 2Q 3Q 4Q 1Q 2Q 3Q 4Q 1Q 2Q 2021 2022 2023 L48 Drilling Average Rig Count 7 Disciplined pricing drives improving daily margins 1 Performance Excellence In The Lower-48 Margin Improving as Commodity Pricing Challenged Rig Count (1) Adjusted daily gross margin for drilling rigs only, does not include Nabors Drilling Solutions |
| N A B O R S . C O M Performance excellence in the Lower-48 Expanding & enhancing our International segment Advancing technology & innovation with demonstrated results Progress on our commitment to de-lever Leading in Sustainability and the Energy Transition 1 2 3 4 5 Five Keys to Excellence |
| N A B O R S . C O M $0 $2,000 $4,000 $6,000 $8,000 $10,000 $12,000 $14,000 $16,000 1Q 2Q 3Q 4Q 1Q 2Q 3Q 4Q 1Q 2Q 2021 2022 2023 International Drilling Adjusted Daily Gross Margin(1) $0 $5,000 $10,000 $15,000 $20,000 $25,000 $30,000 $35,000 $40,000 $45,000 $50,000 1Q 2Q 3Q 4Q 1Q 2Q 3Q 4Q 1Q 2Q 2021 2022 2023 International Drilling Daily Rig Revenue(1) Enhancing both the top and bottom line 9 International Growing Dayrates and Margin 2 Resilience Leading to Growth in Our International Segment (1) Daily rig revenue and adjusted daily gross margin for drilling rigs only, does not include Nabors Drilling Solutions |
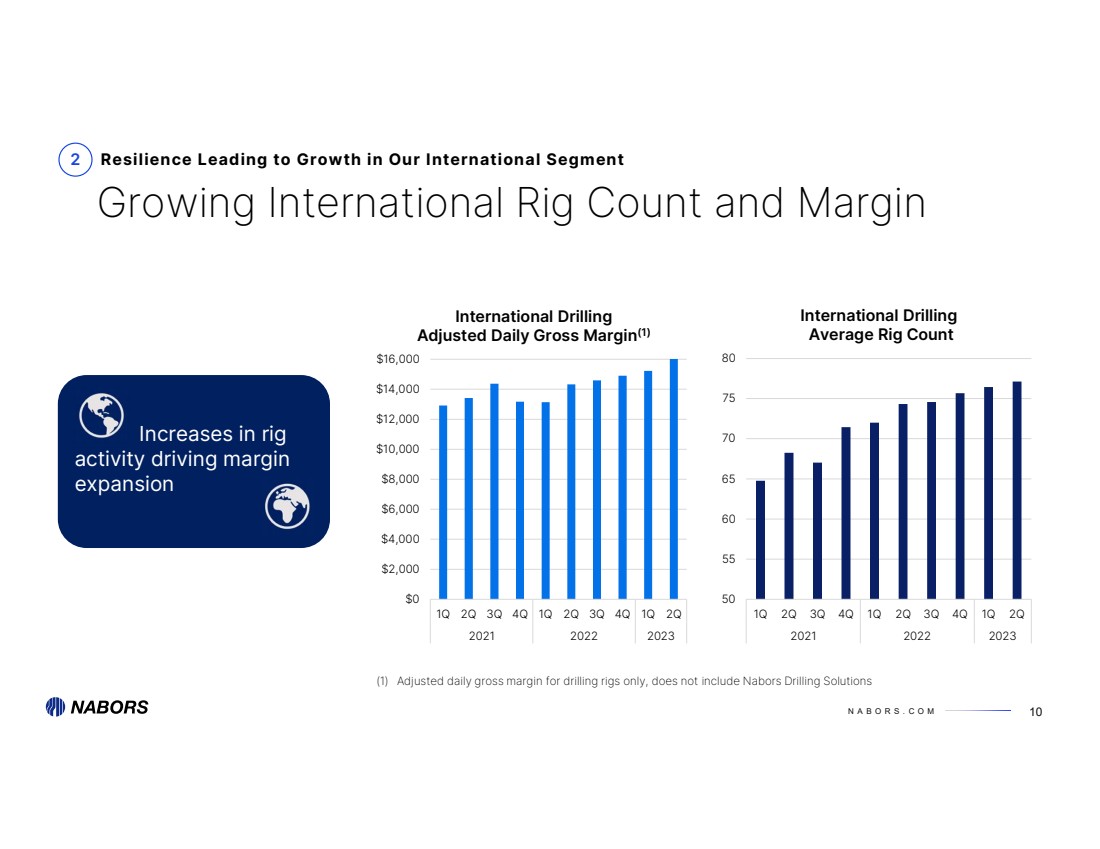
| N A B O R S . C O M $0 $2,000 $4,000 $6,000 $8,000 $10,000 $12,000 $14,000 $16,000 1Q 2Q 3Q 4Q 1Q 2Q 3Q 4Q 1Q 2Q 2021 2022 2023 International Drilling Adjusted Daily Gross Margin(1) Increases in rig activity driving margin expansion 10 Growing International Rig Count and Margin 2 Resilience Leading to Growth in Our International Segment 50 55 60 65 70 75 80 1Q 2Q 3Q 4Q 1Q 2Q 3Q 4Q 1Q 2Q 2021 2022 2023 International Drilling Average Rig Count (1) Adjusted daily gross margin for drilling rigs only, does not include Nabors Drilling Solutions |
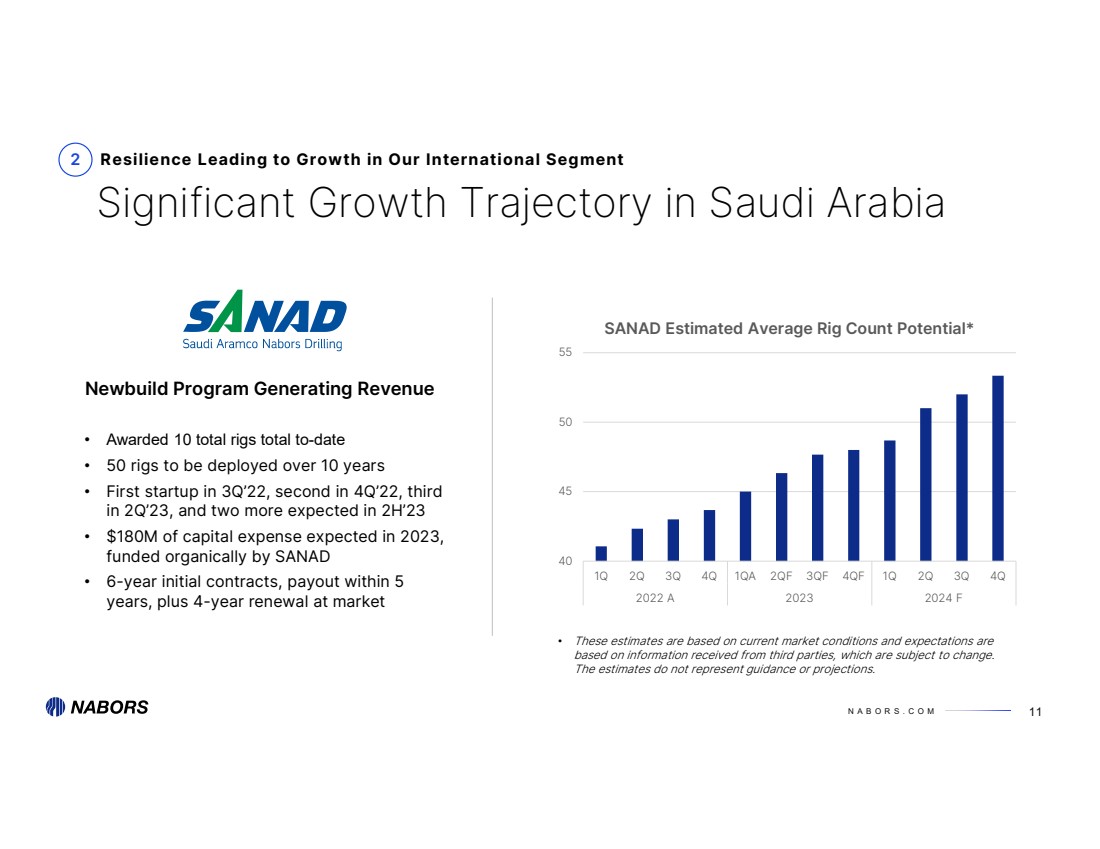
| N A B O R S . C O M 40 45 50 55 1Q 2Q 3Q 4Q 1QA 2QF 3QF 4QF 1Q 2Q 3Q 4Q 2022 A 2023 2024 F SANAD Estimated Average Rig Count Potential* 11 Significant Growth Trajectory in Saudi Arabia Resilience Leading to Growth in Our International Segment • Awarded 10 total rigs total to-date • 50 rigs to be deployed over 10 years • First startup in 3Q’22, second in 4Q’22, third in 2Q’23, and two more expected in 2H’23 • $180M of capital expense expected in 2023, funded organically by SANAD • 6-year initial contracts, payout within 5 years, plus 4-year renewal at market Newbuild Program Generating Revenue • These estimates are based on current market conditions and expectations are based on information received from third parties, which are subject to change. The estimates do not represent guidance or projections. 2 |
| N A B O R S . C O M Performance excellence in the Lower-48 Expanding & enhancing our International segment Advancing technology & innovation with demonstrated results Progress on our commitment to de-lever Leading in Sustainability and the Energy Transition 1 2 3 4 5 Five Keys to Excellence |
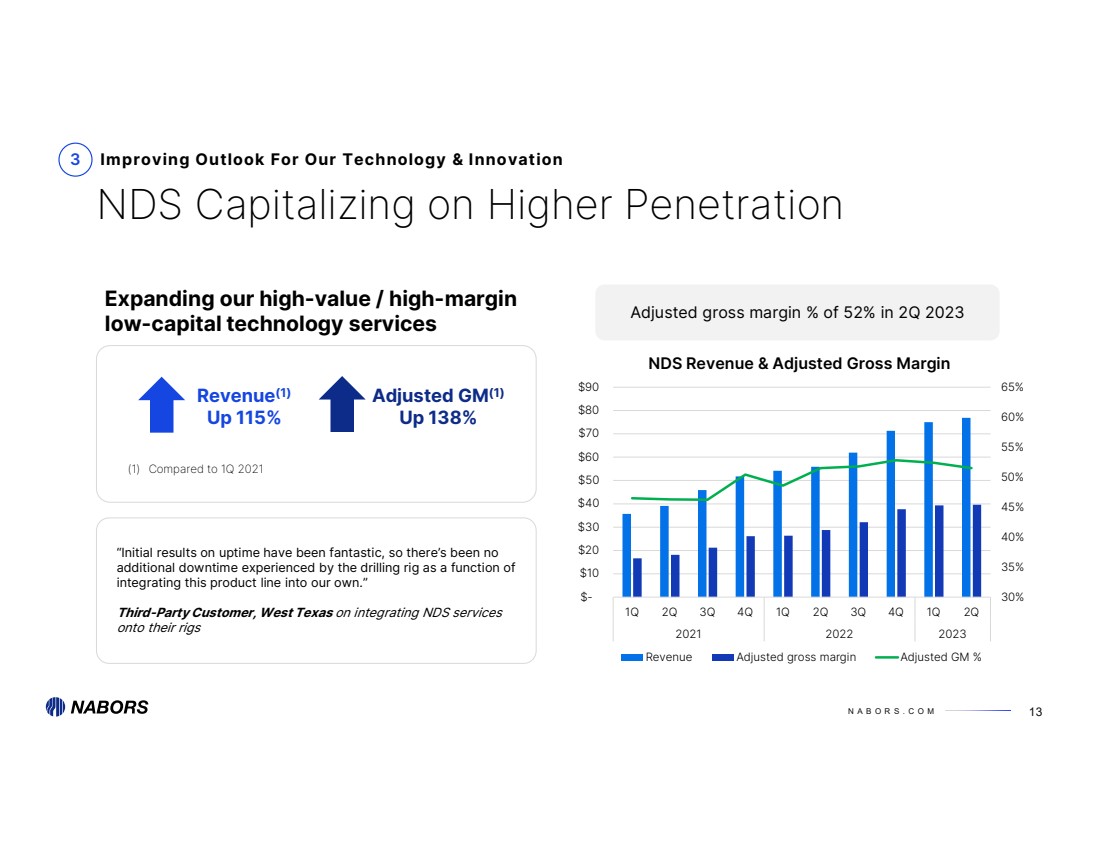
| N A B O R S . C O M 30% 35% 40% 45% 50% 55% 60% 65% $- $10 $20 $30 $40 $50 $60 $70 $80 $90 1Q 2Q 3Q 4Q 1Q 2Q 3Q 4Q 1Q 2Q 2021 2022 2023 NDS Revenue & Adjusted Gross Margin Revenue Adjusted gross margin Adjusted GM % 13 NDS Capitalizing on Higher Penetration Improving Outlook For Our Technology & Innovation Revenue(1) Up 115% Adjusted GM(1) Up 138% Expanding our high-value / high-margin low-capital technology services 3 Adjusted gross margin % of 52% in 2Q 2023 (1) Compared to 1Q 2021 “Initial results on uptime have been fantastic, so there’s been no additional downtime experienced by the drilling rig as a function of integrating this product line into our own.” Third-Party Customer, West Texas on integrating NDS services onto their rigs |
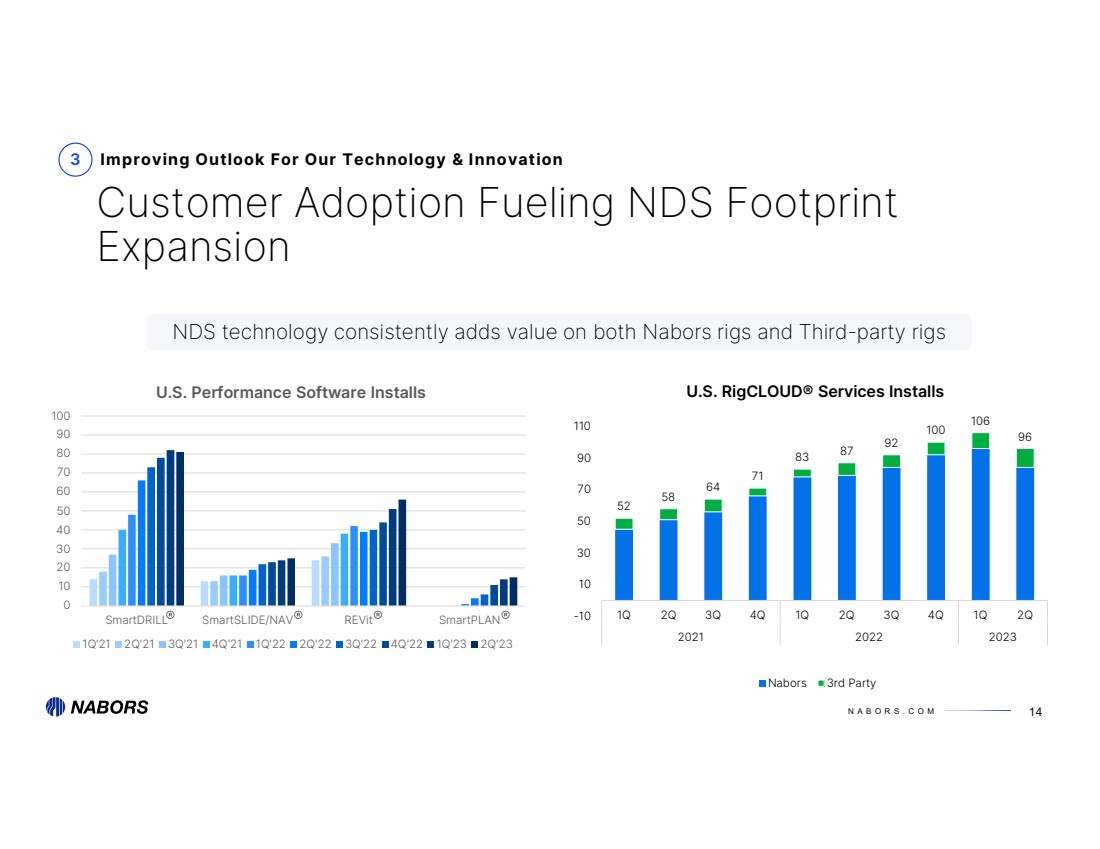
| N A B O R S . C O M 52 58 64 71 83 87 92 100 106 96 -10 10 30 50 70 90 110 1Q 2Q 3Q 4Q 1Q 2Q 3Q 4Q 1Q 2Q 2021 2022 2023 U.S. RigCLOUD® Services Installs Nabors 3rd Party 0 10 20 30 40 50 60 70 80 90 100 SmartDRILL SmartSLIDE/NAV REVit SmartPLAN U.S. Performance Software Installs 1Q'21 2Q'21 3Q'21 4Q'21 1Q'22 2Q'22 3Q'22 4Q'22 1Q'23 2Q'23 Customer Adoption Fueling NDS Footprint Expansion 14 Improving Outlook For Our Technology & Innovation NDS technology consistently adds value on both Nabors rigs and Third-party rigs ® 3 ® ® ® |
| N A B O R S . C O M 15 3 Improving Outlook For Our Technology & Innovation Collaboration on Leading Well Construction Automation • Collaborate on technologies including the Halliburton Well Construction 4.0, the LOGIX® Autonomous Drilling Platform, and Nabors SmartROS® and RigCLOUD® • Automate well construction services from planning to execution across both surface and subsurface equipment and environments • Initially deployed in Iraq |
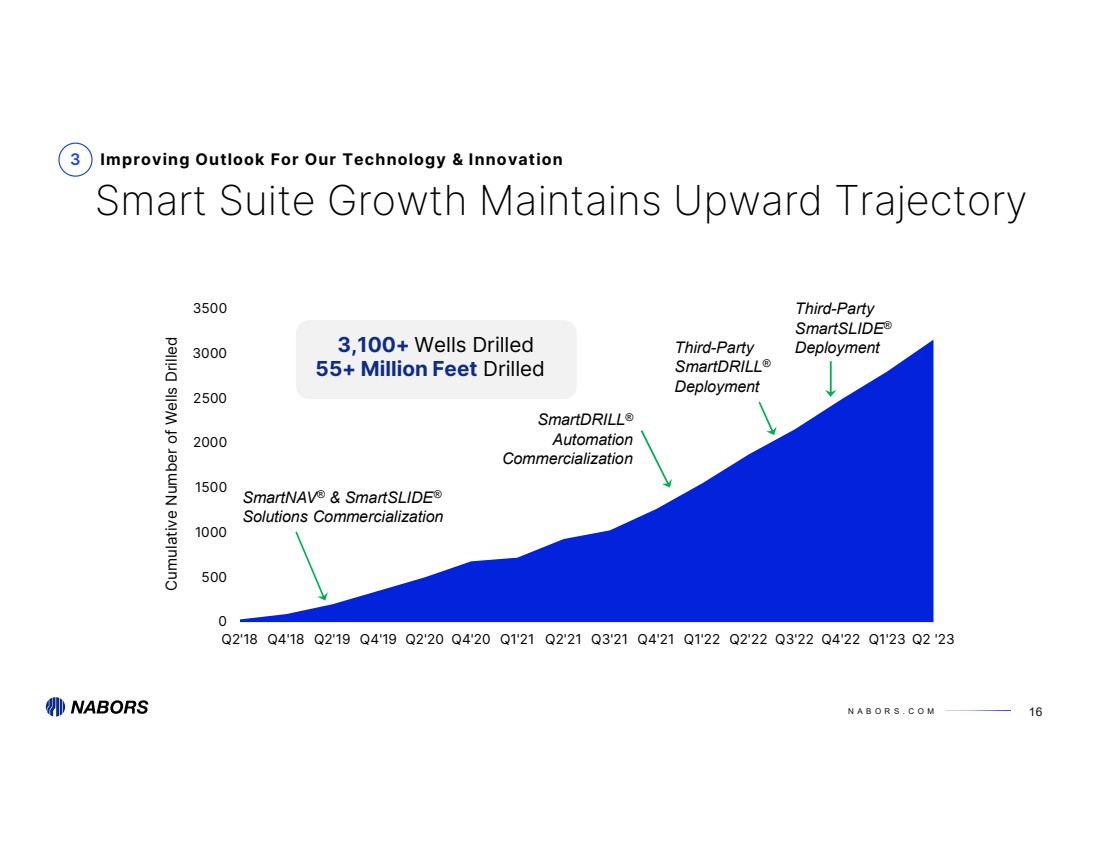
| N A B O R S . C O M 0 500 1000 1500 2000 2500 3000 3500 Q2'18 Q4'18 Q2'19 Q4'19 Q2'20 Q4'20 Q1'21 Q2'21 Q3'21 Q4'21 Q1'22 Q2'22 Q3'22 Q4'22 Q1'23 Q2 '23 Cumulative Number of Wells Drilled 16 Smart Suite Growth Maintains Upward Trajectory Improving Outlook For Our Technology & Innovation 3,100+ Wells Drilled 55+ Million Feet Drilled SmartDRILL® Automation Commercialization SmartNAV® & SmartSLIDE® Solutions Commercialization Third-Party SmartDRILL® Deployment 3 Third-Party SmartSLIDE® Deployment |
| N A B O R S . C O M Performance excellence in the Lower-48 Expanding & enhancing our International segment Advancing technology & innovation with demonstrated results Progress on our commitment to de-lever Leading in Sustainability and the Energy Transition 1 2 3 4 5 Five Keys to Excellence |
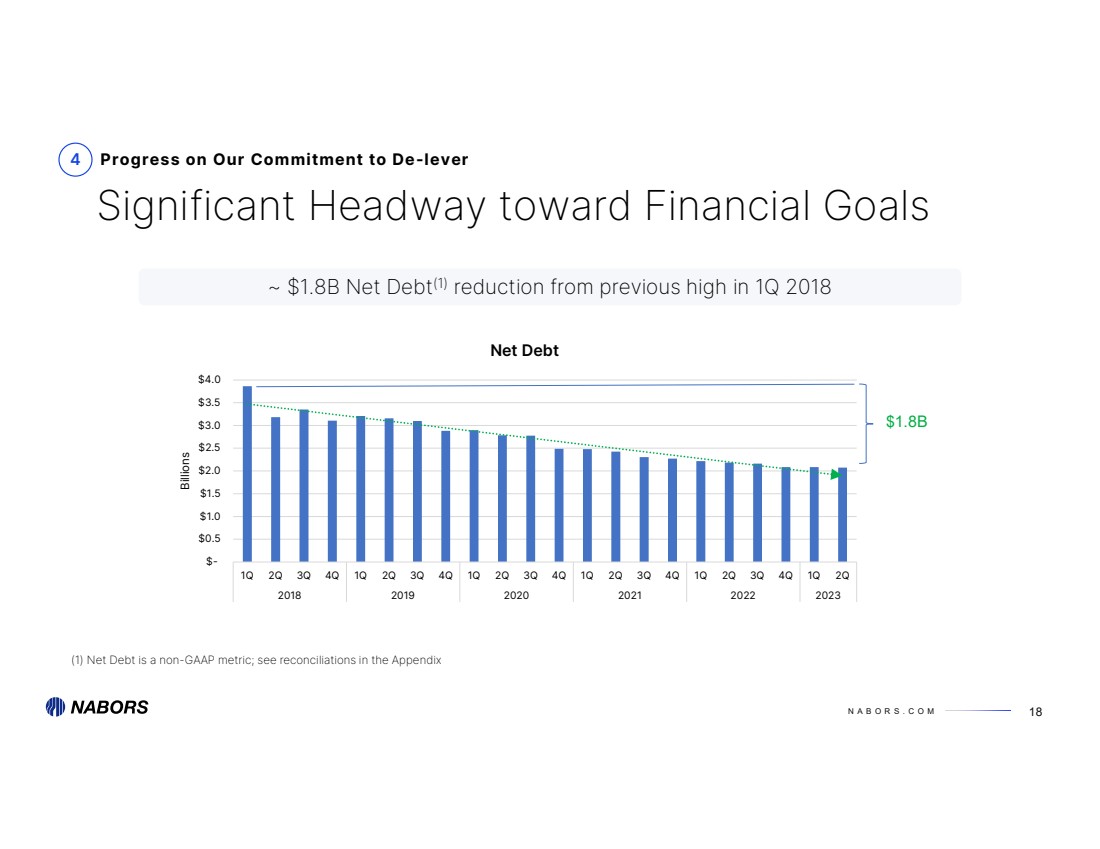
| N A B O R S . C O M $- $0.5 $1.0 $1.5 $2.0 $2.5 $3.0 $3.5 $4.0 1Q 2Q 3Q 4Q 1Q 2Q 3Q 4Q 1Q 2Q 3Q 4Q 1Q 2Q 3Q 4Q 1Q 2Q 3Q 4Q 1Q 2Q 2018 2019 2020 2021 2022 2023 Billions Net Debt 18 Significant Headway toward Financial Goals 4 Progress on Our Commitment to De-lever ~ $1.8B Net Debt(1) reduction from previous high in 1Q 2018 $1.8B (1) Net Debt is a non-GAAP metric; see reconciliations in the Appendix |
| N A B O R S . C O M Performance excellence in the Lower-48 Expanding & enhancing our International segment Advancing technology & innovation with demonstrated results Progress on our commitment to de-lever Leading in Sustainability and the Energy Transition 1 2 3 4 5 Five Keys to Excellence |
| N A B O R S . C O M Expanding penetration on third-party rigs Energy Efficiency & Emission Reduction Technologies Geothermal Development Leveraging IP to applications beyond the rigs, including carbon capture Expansion Beyond Oil & Gas Differentiates Nabors rigs Developing new verticals in: hydrogen, fuel efficiency and energy storage Providing expertise in drilling and engineering services & solutions Adding to the long-term power solution – creating Geothermal 2.0 20 5 Leading in Sustainability and the Energy Transition Moving Forward on the Energy Transition |
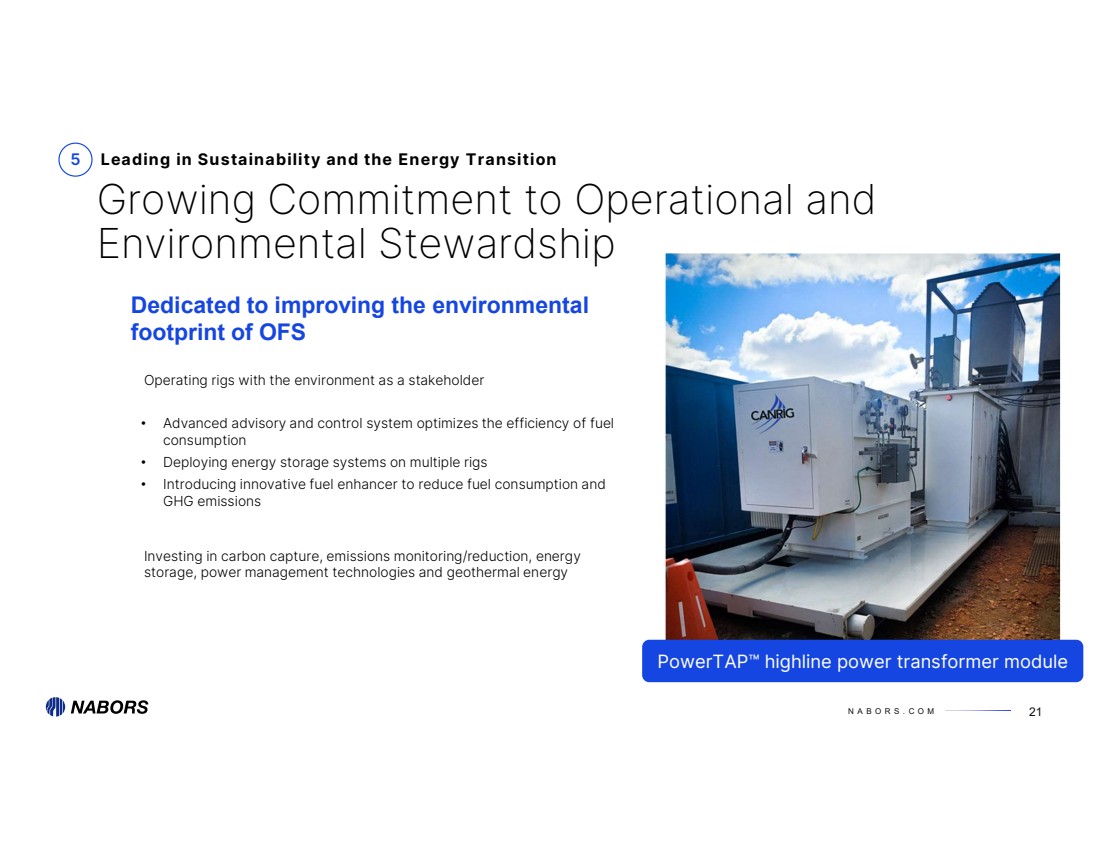
| N A B O R S . C O M 21 Leading in Sustainability and the Energy Transition • Advanced advisory and control system optimizes the efficiency of fuel consumption • Deploying energy storage systems on multiple rigs • Introducing innovative fuel enhancer to reduce fuel consumption and GHG emissions Operating rigs with the environment as a stakeholder Investing in carbon capture, emissions monitoring/reduction, energy storage, power management technologies and geothermal energy Dedicated to improving the environmental footprint of OFS 5 Growing Commitment to Operational and Environmental Stewardship PowerTAP™ highline power transformer module |
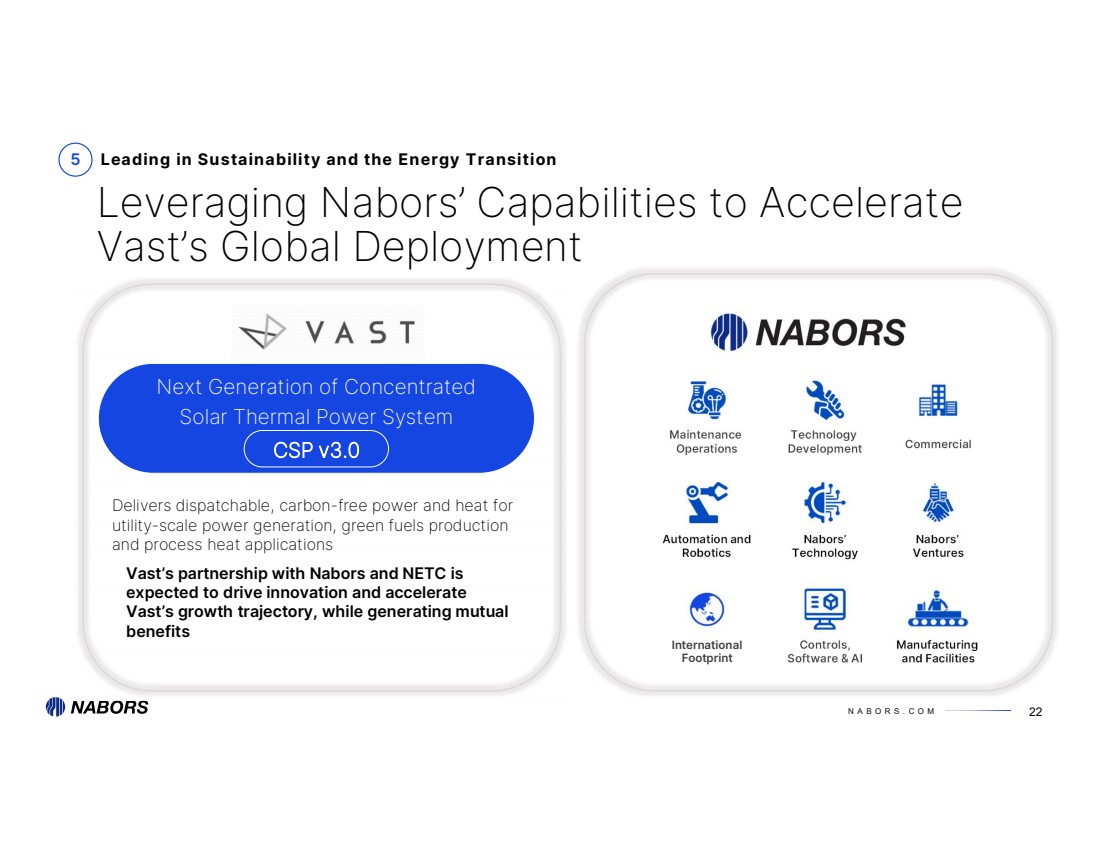
| N A B O R S . C O M 22 Leveraging Nabors’ Capabilities to Accelerate Vast’s Global Deployment Leading in Sustainability and the Energy Transition Automation and Robotics Manufacturing and Facilities Controls, Software & AI Nabors’ Technology Nabors’ Ventures Commercial Technology Development Maintenance Operations Delivers dispatchable, carbon-free power and heat for utility-scale power generation, green fuels production and process heat applications Vast’s partnership with Nabors and NETC is expected to drive innovation and accelerate Vast’s growth trajectory, while generating mutual benefits Next Generation of Concentrated Solar Thermal Power System 5 CSP v3.0 International Footprint |
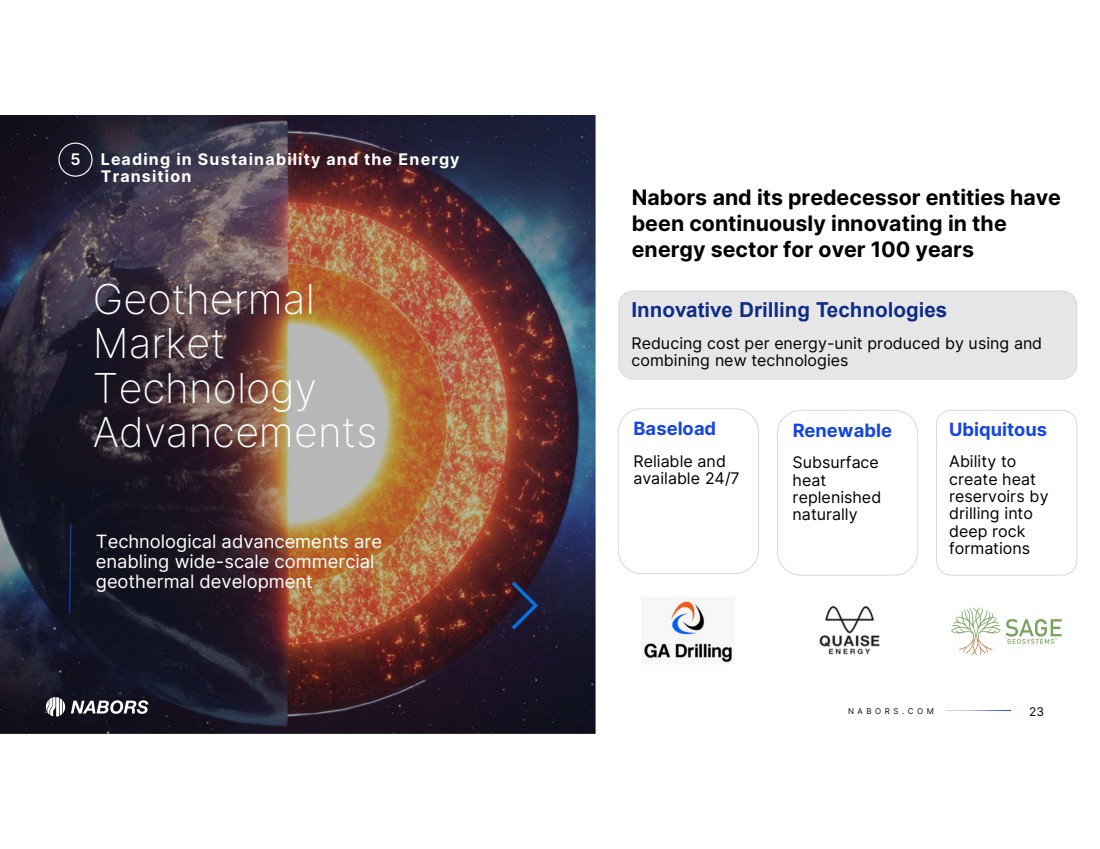
| N A B O R S . C O M 23 Ubiquitous Ability to create heat reservoirs by drilling into deep rock formations Innovative Drilling Technologies Reducing cost per energy-unit produced by using and combining new technologies Baseload Reliable and available 24/7 Renewable Subsurface heat replenished naturally Nabors and its predecessor entities have been continuously innovating in the energy sector for over 100 years Geothermal Market Technology Advancements Technological advancements are enabling wide-scale commercial geothermal development Leading in Sustainability and the Energy Transition 5 |
| N A B O R S . C O M Appendix 24 |
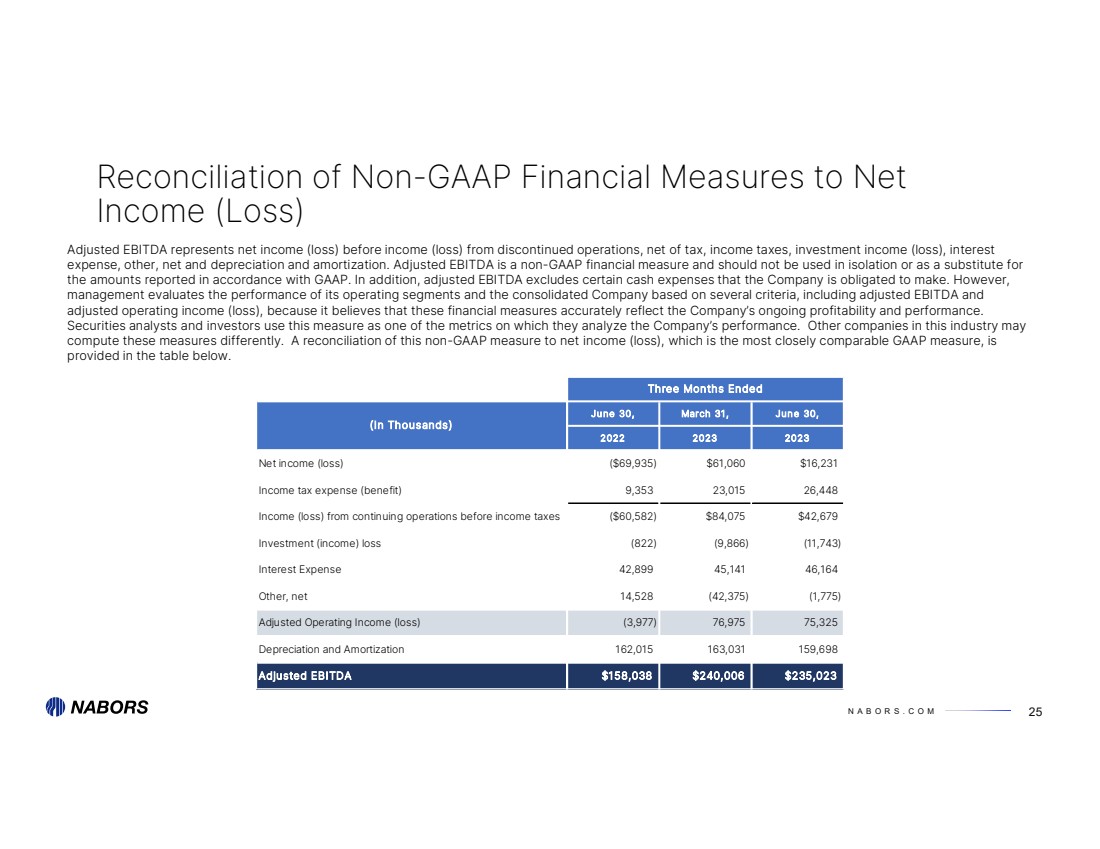
| N A B O R S . C O M June 30, March 31, June 30, 2022 2023 2023 Net income (loss) ($69,935) $61,060 $16,231 Income tax expense (benefit) 9,353 23,015 26,448 Income (loss) from continuing operations before income taxes ($60,582) $84,075 $42,679 Investment (income) loss (822) (9,866) (11,743) Interest Expense 42,899 45,141 46,164 Other, net 14,528 (42,375) (1,775) Adjusted Operating Income (loss) (3,977) 76,975 75,325 Depreciation and Amortization 162,015 163,031 159,698 Adjusted EBITDA $158,038 $240,006 $235,023 (In Thousands) Three Months Ended 25 Reconciliation of Non-GAAP Financial Measures to Net Income (Loss) Adjusted EBITDA represents net income (loss) before income (loss) from discontinued operations, net of tax, income taxes, investment income (loss), interest expense, other, net and depreciation and amortization. Adjusted EBITDA is a non-GAAP financial measure and should not be used in isolation or as a substitute for the amounts reported in accordance with GAAP. In addition, adjusted EBITDA excludes certain cash expenses that the Company is obligated to make. However, management evaluates the performance of its operating segments and the consolidated Company based on several criteria, including adjusted EBITDA and adjusted operating income (loss), because it believes that these financial measures accurately reflect the Company’s ongoing profitability and performance. Securities analysts and investors use this measure as one of the metrics on which they analyze the Company’s performance. Other companies in this industry may compute these measures differently. A reconciliation of this non-GAAP measure to net income (loss), which is the most closely comparable GAAP measure, is provided in the table below. |
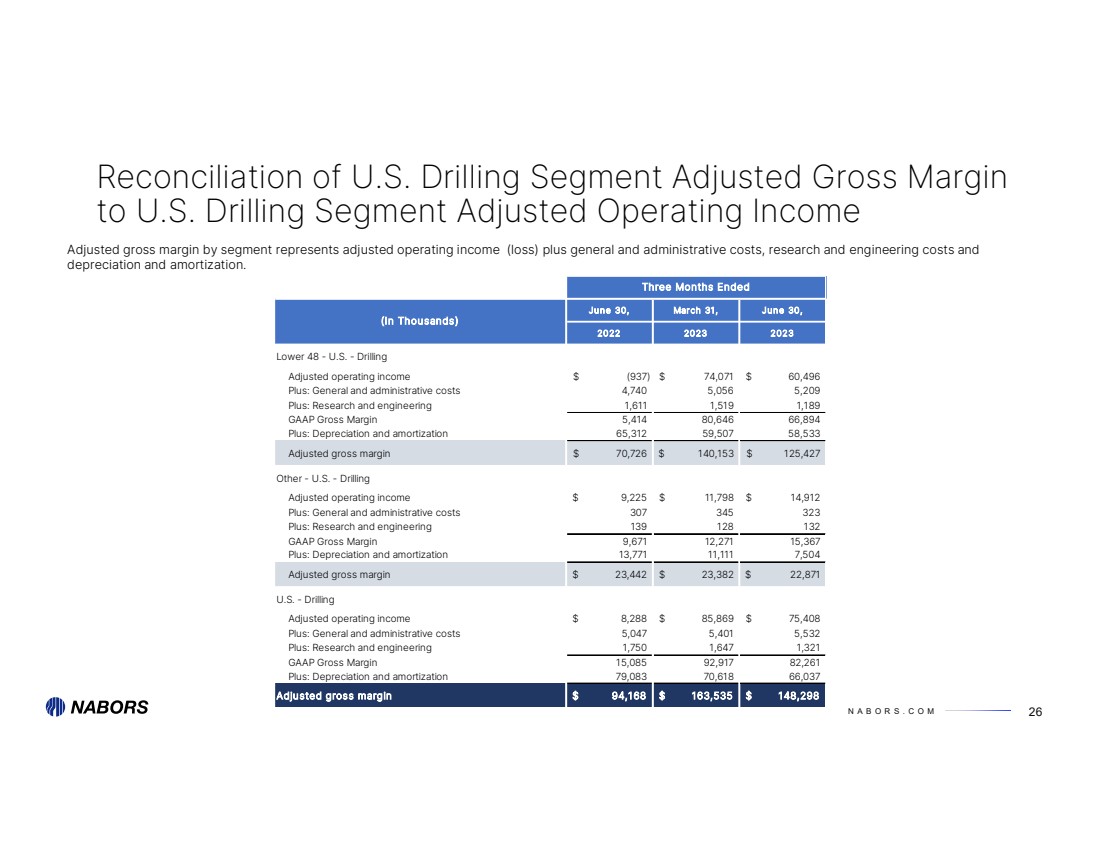
| N A B O R S . C O M June 30, March 31, June 30, 2022 2023 2023 Lower 48 - U.S. - Drilling Adjusted operating income (937) $ 74,071 $ 60,496 $ Plus: General and administrative costs 4,740 5,056 5,209 Plus: Research and engineering 1,611 1,519 1,189 GAAP Gross Margin 5,414 80,646 66,894 Plus: Depreciation and amortization 65,312 59,507 58,533 Adjusted gross margin 70,726 $ 140,153 $ 125,427 $ Other - U.S. - Drilling Adjusted operating income 9,225 $ 11,798 $ 14,912 $ Plus: General and administrative costs 307 345 323 Plus: Research and engineering 139 128 132 GAAP Gross Margin 9,671 12,271 15,367 Plus: Depreciation and amortization 13,771 11,111 7,504 Adjusted gross margin 23,442 $ 23,382 $ 22,871 $ U.S. - Drilling Adjusted operating income 8,288 $ 85,869 $ 75,408 $ Plus: General and administrative costs 5,047 5,401 5,532 Plus: Research and engineering 1,750 1,647 1,321 GAAP Gross Margin 15,085 92,917 82,261 Plus: Depreciation and amortization 79,083 70,618 66,037 Adjusted gross margin 94,168 $ 163,535 $ 148,298 $ (In Thousands) Three Months Ended 26 Reconciliation of U.S. Drilling Segment Adjusted Gross Margin to U.S. Drilling Segment Adjusted Operating Income Adjusted gross margin by segment represents adjusted operating income (loss) plus general and administrative costs, research and engineering costs and depreciation and amortization. |
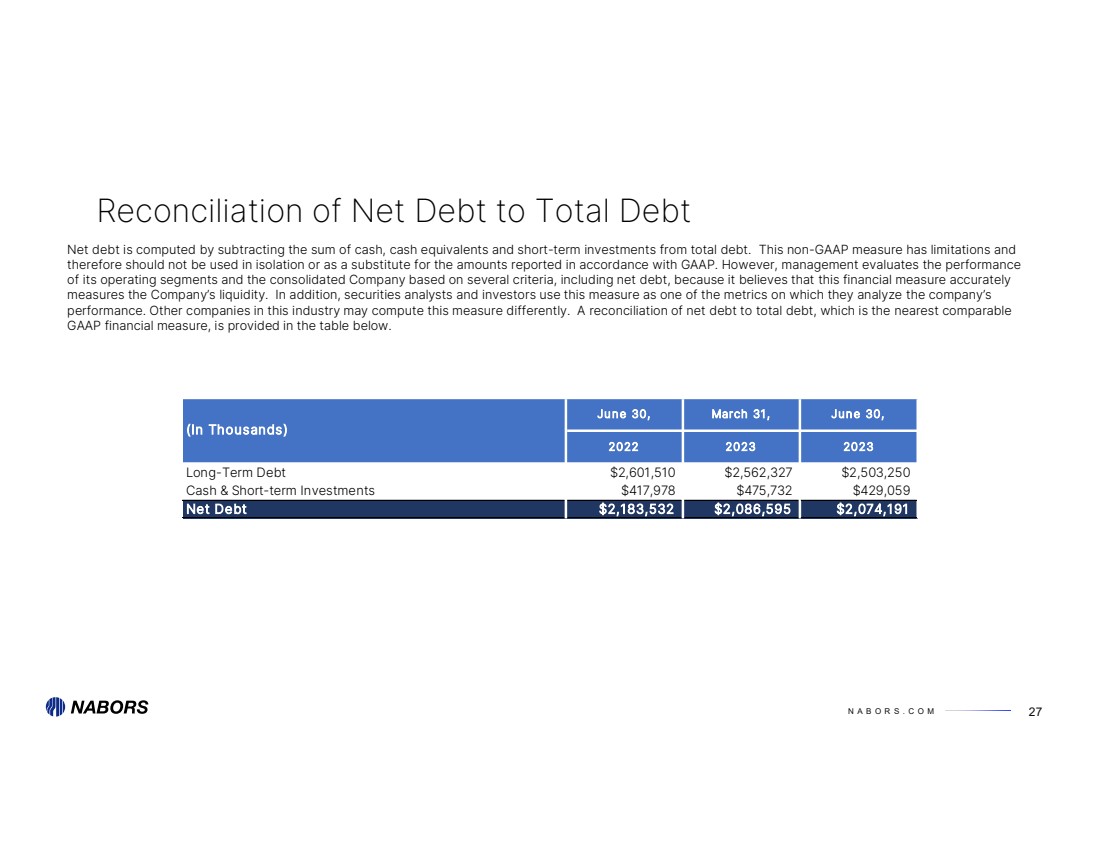
| N A B O R S . C O M June 30, March 31, June 30, 2022 2023 2023 Long-Term Debt $2,601,510 $2,562,327 $2,503,250 Cash & Short-term Investments $417,978 $475,732 $429,059 Net Debt $2,183,532 $2,086,595 $2,074,191 (In Thousands) 27 Reconciliation of Net Debt to Total Debt Net debt is computed by subtracting the sum of cash, cash equivalents and short-term investments from total debt. This non-GAAP measure has limitations and therefore should not be used in isolation or as a substitute for the amounts reported in accordance with GAAP. However, management evaluates the performance of its operating segments and the consolidated Company based on several criteria, including net debt, because it believes that this financial measure accurately measures the Company’s liquidity. In addition, securities analysts and investors use this measure as one of the metrics on which they analyze the company’s performance. Other companies in this industry may compute this measure differently. A reconciliation of net debt to total debt, which is the nearest comparable GAAP financial measure, is provided in the table below. |
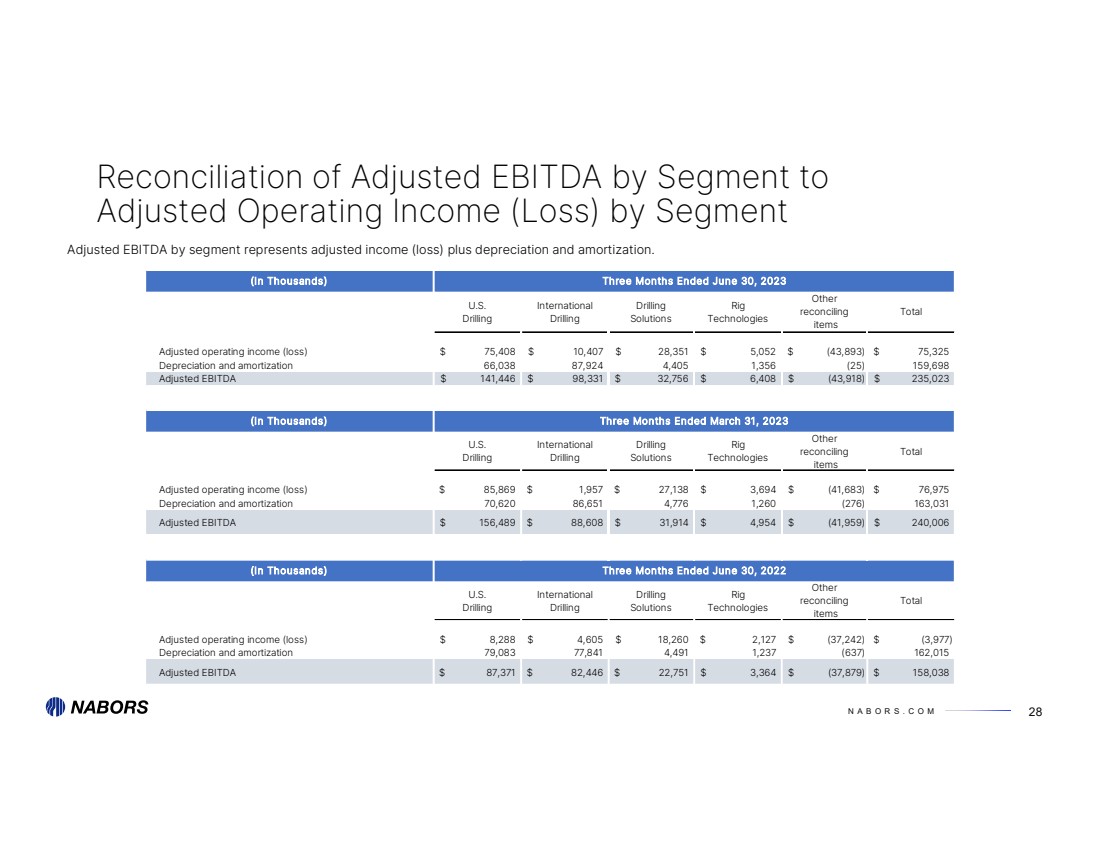
| N A B O R S . C O M (In Thousands) Three Months Ended June 30, 2023 U.S. Drilling International Drilling Drilling Solutions Rig Technologies Other reconciling items Total Adjusted operating income (loss) 75,408 $ 10,407 $ 28,351 $ 5,052 $ (43,893) $ 75,325 $ Depreciation and amortization 66,038 87,924 4,405 1,356 (25) 159,698 Adjusted EBITDA 141,446 $ 98,331 $ 32,756 $ 6,408 $ (43,918) $ 235,023 $ (In Thousands) Three Months Ended March 31, 2023 U.S. Drilling International Drilling Drilling Solutions Rig Technologies Other reconciling items Total Adjusted operating income (loss) 85,869 $ 1,957 $ 27,138 $ 3,694 $ (41,683) $ 76,975 $ Depreciation and amortization 70,620 86,651 4,776 1,260 (276) 163,031 Adjusted EBITDA 156,489 $ 88,608 $ 31,914 $ 4,954 $ (41,959) $ 240,006 $ (In Thousands) Three Months Ended June 30, 2022 U.S. Drilling International Drilling Drilling Solutions Rig Technologies Other reconciling items Total Adjusted operating income (loss) 8,288 $ 4,605 $ 18,260 $ 2,127 $ (37,242) $ (3,977) $ Depreciation and amortization 79,083 77,841 4,491 1,237 (637) 162,015 Adjusted EBITDA 87,371 $ 82,446 $ 22,751 $ 3,364 $ (37,879) $ 158,038 $ 28 Reconciliation of Adjusted EBITDA by Segment to Adjusted Operating Income (Loss) by Segment Adjusted EBITDA by segment represents adjusted income (loss) plus depreciation and amortization. |
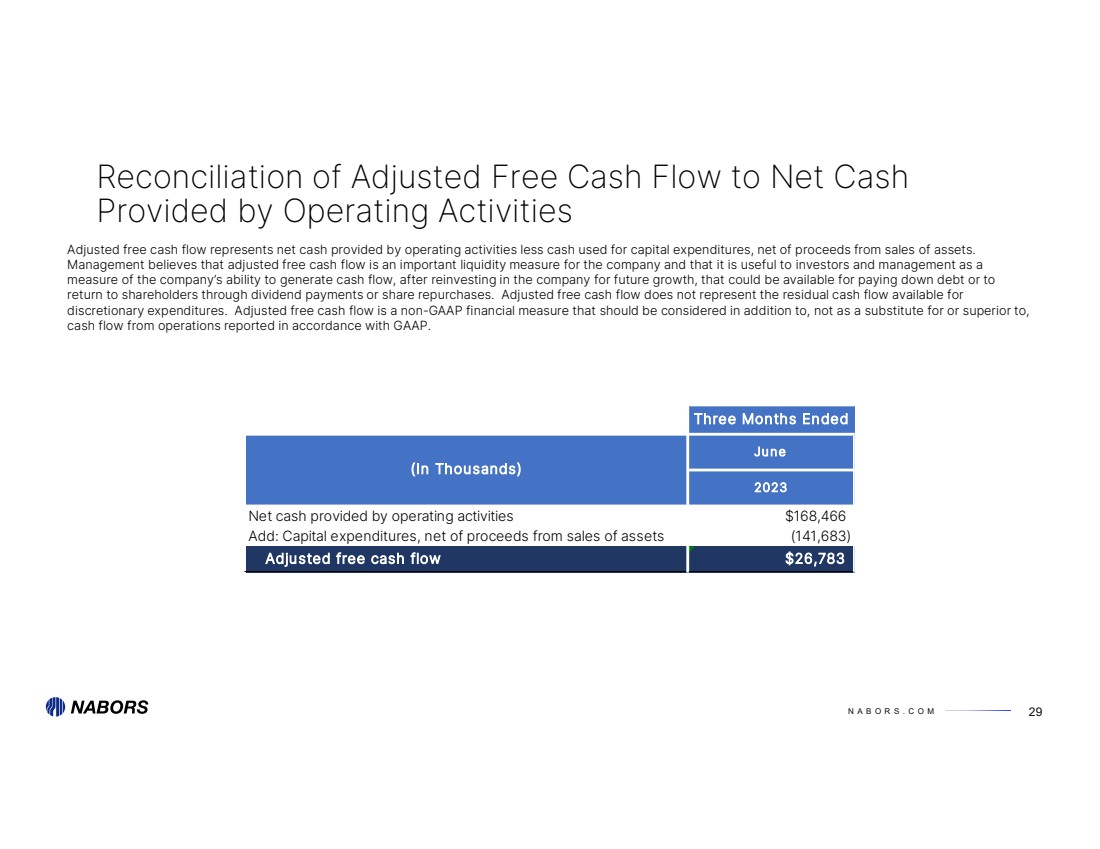
| N A B O R S . C O M Three Months Ended June 2023 Net cash provided by operating activities $168,466 Add: Capital expenditures, net of proceeds from sales of assets (141,683) Adjusted free cash flow $26,783 (In Thousands) 29 Reconciliation of Adjusted Free Cash Flow to Net Cash Provided by Operating Activities Adjusted free cash flow represents net cash provided by operating activities less cash used for capital expenditures, net of proceeds from sales of assets. Management believes that adjusted free cash flow is an important liquidity measure for the company and that it is useful to investors and management as a measure of the company’s ability to generate cash flow, after reinvesting in the company for future growth, that could be available for paying down debt or to return to shareholders through dividend payments or share repurchases. Adjusted free cash flow does not represent the residual cash flow available for discretionary expenditures. Adjusted free cash flow is a non-GAAP financial measure that should be considered in addition to, not as a substitute for or superior to, cash flow from operations reported in accordance with GAAP. |
| NABORS INDUSTRIES LTD. NABORS.COM NABORS CORPORATE SERVICES 515 W. Greens Road Suite 1200 Houston, TX 77067-4525 @ n a b o r s g l o b a l Contact Us: William C. Conroy, CFA VP - Corporate Development and Investor Relations William.Conroy@nabors.com Kara K. Peak Director - Corporate Development and Investor Relations Kara.Peak@nabors.com |
Cover |
Jul. 25, 2023 |
|---|---|
| Cover [Abstract] | |
| Document Type | 8-K |
| Amendment Flag | false |
| Document Period End Date | Jul. 25, 2023 |
| Entity File Number | 001-32657 |
| Entity Registrant Name | NABORS INDUSTRIES LTD. |
| Entity Central Index Key | 0001163739 |
| Entity Tax Identification Number | 98-0363970 |
| Entity Incorporation, State or Country Code | D0 |
| Entity Address, Address Line One | Crown House |
| Entity Address, Address Line Two | 4 Par-la-Ville Road |
| Entity Address, Address Line Three | Second Floor |
| Entity Address, City or Town | Hamilton |
| Entity Address, Country | BM |
| Entity Address, Postal Zip Code | HM08 |
| City Area Code | 441 |
| Local Phone Number | 292-1510 |
| Written Communications | false |
| Soliciting Material | false |
| Pre-commencement Tender Offer | false |
| Pre-commencement Issuer Tender Offer | false |
| Title of 12(b) Security | Common shares |
| Trading Symbol | NBR |
| Security Exchange Name | NYSE |
| Entity Emerging Growth Company | false |
1 Year Nabors Industries Chart |
1 Month Nabors Industries Chart |

It looks like you are not logged in. Click the button below to log in and keep track of your recent history.
Support: +44 (0) 203 8794 460 | support@advfn.com
By accessing the services available at ADVFN you are agreeing to be bound by ADVFN's Terms & Conditions
 Hot Features