
We could not find any results for:
Make sure your spelling is correct or try broadening your search.
| Share Name | Share Symbol | Market | Type |
|---|---|---|---|
| Magna International Inc | NYSE:MGA | NYSE | Common Stock |
| Price Change | % Change | Share Price | High Price | Low Price | Open Price | Shares Traded | Last Trade | |
|---|---|---|---|---|---|---|---|---|
| 0.37 | 0.84% | 44.53 | 43.93 | 43.44 | 43.71 | 1,556,415 | 01:00:00 |
UNITED STATES
SECURITIES AND EXCHANGE COMMISSION
Washington, D.C. 20549
FORM 6-K
Report of Foreign Private Issuer Pursuant to
Rule 13a-16 or 15d-16
under the Securities Exchange Act of 1934
For the month of November 2023
Commission File Number 001-11444
| MAGNA INTERNATIONAL INC. |
| (Exact Name of Registrant as specified in its Charter) |
| 337 Magna Drive, Aurora, Ontario, Canada L4G 7K1 |
| (Address of principal executive office) |
Indicate by check mark whether the registrant files or will file annual reports under cover Form 20-F or Form 40-F.
Form 20-F ¨ Form 40-F x
SIGNATURES
Pursuant to the requirements of the Securities Exchange Act of 1934, the registrant has duly caused this report to be signed on its behalf by the undersigned, thereunto duly authorized.
| MAGNA INTERNATIONAL INC. | ||
| (Registrant) | ||
| Date: November 3, 2023 | ||
| By: | /s/ “Bassem Shakeel” | |
| Bassem A. Shakeel, | ||
| Vice-President, Associate General Counsel and Corporate Secretary | ||
EXHIBITS
Exhibit 99.1

 |
PRESS RELEASE |
| MAGNA ANNOUNCES THIRD QUARTER 2023 RESULTS |
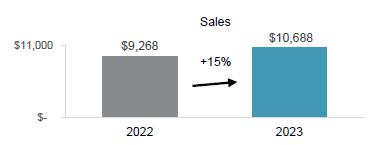
| · | Sales increased 15% to $10.7 billion, compared to a global light vehicle production increase of 4% |
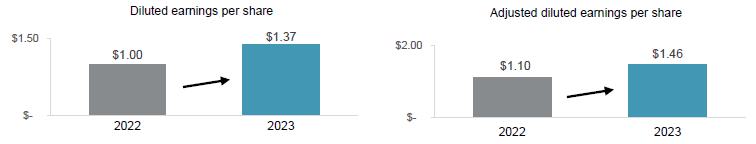
| · | Diluted earnings per share were $1.37 |
| · | Adjusted diluted earnings per share increased 33% to $1.46 |
| · | Raised Outlook for Adjusted EBIT Margin and Adjusted Net Income attributable to Magna, including UAW strike impact |
AURORA, Ontario, November 3, 2023 — Magna International Inc. (TSX: MG; NYSE: MGA) today reported financial results for the third quarter ended September 30, 2023.
| THREE
MONTHS ENDED SEPTEMBER 30, | NINE
MONTHS ENDED SEPTEMBER 30, | |||||||||||||||
| 2023 | 2022 | 2023 | 2022 | |||||||||||||
| Reported | ||||||||||||||||
| Sales | $ | 10,688 | $ | 9,268 | $ | 32,343 | $ | 28,272 | ||||||||
| Income from operations before income taxes | $ | 538 | $ | 400 | $ | 1,296 | $ | 732 | ||||||||
| Net income attributable to Magna International Inc. | $ | 394 | $ | 289 | $ | 942 | $ | 497 | ||||||||
| Diluted earnings per share | $ | 1.37 | $ | 1.00 | $ | 3.29 | $ | 1.70 | ||||||||
| Non-GAAP Financial Measures(1) | ||||||||||||||||
| Adjusted EBIT | $ | 615 | $ | 452 | $ | 1,680 | $ | 1,341 | ||||||||
| Adjusted diluted earnings per share | $ | 1.46 | $ | 1.10 | $ | 4.15 | $ | 3.29 | ||||||||
All results are reported in millions of U.S. dollars, except per share figures, which are in U.S. dollars
| (1) | Adjusted EBIT and Adjusted diluted earnings per share are Non-GAAP financial measures that have no standardized meaning under U.S. GAAP, and as a result may not be comparable to the calculation of similar measures by other companies. Effective July 1, 2023, we revised our calculations of Adjusted EBIT and Adjusted diluted earnings per share to exclude the amortization of acquired intangible assets. The historical presentation of these Non-GAAP measures within this press release has also been updated to reflect the revised calculations. Further information and a reconciliation of these Non-GAAP financial measures is included in the back of this press release. |
| MAGNA ANNOUNCES THIRD QUARTER 2023 RESULTS | CONNECT WITH MAGNA | 1 |
 |
“We continue to execute across all segments of our business through a combination of launching new programs, working to offset inflationary pressures, reducing expenses, and optimizing our cost structure. Our raised Outlook reflects our relentless focus on delivering short- and long-term margin expansion and increased returns on investment.”
- Swamy Kotagiri, Magna’s Chief Executive Officer |
THREE MONTHS ENDED SEPTEMBER 30, 2023
We posted sales of $10.7 billion for the third quarter of 2023, an increase of 15% over the third quarter of 2022, which compares to global light vehicle production that increased 4%, including 7% and 14% higher production in North America and Europe, respectively, and 2% lower production in China. Excluding the impact of foreign currency translation and acquisitions net of divestitures, sales increased 10%, largely reflecting the launch of new programs and higher global light vehicle production.
Adjusted EBIT increased to $615 million in the third quarter of 2023 compared to $452 million in the third quarter of 2022. Our ongoing focus on operational excellence and cost initiatives helped drive strong earnings on higher sales. In addition, the Adjusted EBIT increase mainly reflected higher customer recoveries net of production input costs and productivity and efficiency improvements, including lower costs at previously underperforming facilities, partially offset by the net unfavourable impact of commerical items, and acquisitions, net of divestitures.
Income from operations before income taxes increased to $538 million for the third quarter of 2023 compared to $400 million in the third quarter of 2022. Included in income from operations before income taxes were other (income) expense, net items and amortization of acquired intangibles totaling $28 million and $34 million in the third quarters of 2023 and 2022, respectively. Excluding other (income) expense, net and amortization of acquired intangibles from both periods, income from operations before income taxes increased $132 million in the third quarter of 2023 compared to the third quarter of 2022.
Net income attributable to Magna International Inc. was $394 million for the third quarter of 2023 compared to $289 million in the third quarter of 2022. Included in net income attributable to Magna International Inc. were other (income) expense, net items and amortization of acquired intangibles totaling $25 million after tax and income attributable to non-controlling interests in the third quarter of 2023, compared to $28 million after tax and income attributable to non-controlling interests in the third quarter of 2022. Excluding other (income) expense, net and amortization of acquired intangibles after tax from both periods, net income attributable to Magna International Inc. increased $105 million in the third quarter of 2023 compared to the third quarter of 2022.
Diluted earnings per share was $1.37 in the third quarter of 2023, compared to $1.00 in the comparable period. Adjusted diluted earnings per share was $1.46 compared to $1.10 for the third quarter of 2022.
In the third quarter of 2023, we generated cash from operations before changes in operating assets and liabilities of $797 million and used $24 million in operating assets and liabilities. Investment activities for the third quarter of 2023 included $630 million in fixed asset additions, $176 million in investments, other assets and intangible assets and $7 million in private equity investments.
| MAGNA ANNOUNCES THIRD QUARTER 2023 RESULTS | CONNECT WITH MAGNA | 2 |
NINE MONTHS ENDED SEPTEMBER 30, 2023
We posted sales of $32.3 billion for the nine months ended September 30, 2023, an increase of 14% over the nine months ended September 30, 2022, as global light vehicle production increased 8%.
Adjusted EBIT increased to $1.7 billion for the nine months ended September 30, 2023 compared to $1.3 billion for the nine months ended September 30, 2022, primarily due to earnings on higher sales, higher customer recoveries net of production input costs, productivity and efficiency improvements, including lower costs at previously underperforming facilities and higher equity income, partially offset by acquisitions, net of divestitures, the net unfavourable impact of commerical items and higher launch, engineering, and other costs associated with the launch of new assembly business.
During the nine months ended September 30, 2023, income from operations before income taxes was $1.3 billion, net income attributable to Magna International Inc. was $942 million and diluted earnings per share was $3.29, increases of $564 million, $445 million, and $1.59, respectively, each compared to the first nine months of 2022.
During the nine months ended September 30, 2023, Adjusted diluted earnings per share increased 26% to $4.15, compared to the first nine months of 2022.
During the nine months ended September 30, 2023, we generated cash from operations before changes in operating assets and liabilities of $2.27 billion and invested $697 million in operating assets and liabilities. Investment activities for the first nine months of 2023 included $1.48 billion to purchase Veoneer Active Safety, $1.56 billion in fixed asset additions, a $373 million increase in investments, other assets and intangible assets and $10 million in public and private equity investments.
RETURN OF CAPITAL
During the three months ended September 30, 2023, we paid $128 million in dividends.
Our Board of Directors declared a third quarter dividend of $0.46 per Common Share, payable on December 1, 2023 to shareholders of record as of the close of business on November 17, 2023.
| MAGNA ANNOUNCES THIRD QUARTER 2023 RESULTS | CONNECT WITH MAGNA | 3 |
SEGMENT SUMMARY
| For the three months ended September 30, | ||||||||||||||||||||||||
| Sales | Adjusted EBIT | |||||||||||||||||||||||
| ($Millions unless otherwise noted) | 2023 | 2022 | Change | 2023 | 2022 | Change | ||||||||||||||||||
| Body Exteriors & Structures | $ | 4,354 | $ | 3,976 | $ | 378 | $ | 358 | $ | 227 | $ | 131 | ||||||||||||
| Power & Vision | 3,745 | 2,911 | 834 | 221 | 124 | 97 | ||||||||||||||||||
| Seating Systems | 1,529 | 1,295 | 234 | 70 | 37 | 33 | ||||||||||||||||||
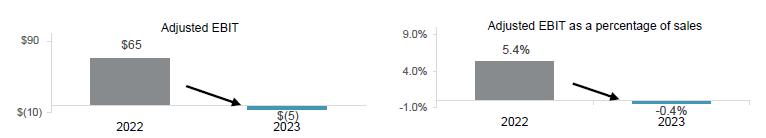
| Complete Vehicles | 1,185 | 1,213 | (28 | ) | (5 | ) | 65 | (70 | ) | |||||||||||||||
| Corporate and Other | (125 | ) | (127 | ) | 2 | (29 | ) | (1 | ) | (28 | ) | |||||||||||||
| Total Reportable Segments | $ | 10,688 | $ | 9,268 | $ | 1,420 | $ | 615 | $ | 452 | $ | 163 | ||||||||||||
| For the three months ended September 30, | ||||||||||||||||||||||||
Adjusted
EBIT as a | ||||||||||||||||||||||||
| 2023 | 2022 | Change | ||||||||||||||||||||||
| Body Exteriors & Structures | 8.2 | % | 5.7 | % | 2.5 | % | ||||||||||||||||||
| Power & Vision | 5.9 | % | 4.3 | % | 1.6 | % | ||||||||||||||||||
| Seating Systems | 4.6 | % | 2.9 | % | 1.7 | % | ||||||||||||||||||
| Complete Vehicles | (0.4 | )% | 5.4 | % | (5.8 | )% | ||||||||||||||||||
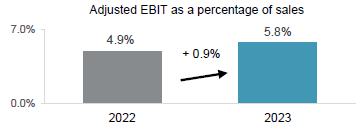
| Consolidated Average | 5.8 | % | 4.9 | % | 0.9 | % | ||||||||||||||||||
| For the nine months ended September 30, | ||||||||||||||||||||||||
| Sales | Adjusted EBIT | |||||||||||||||||||||||
| ($Millions unless otherwise noted) | 2023 | 2022 | Change | 2023 | 2022 | Change | ||||||||||||||||||
| Body Exteriors & Structures | $ | 13,333 | $ | 12,000 | $ | 1,333 | $ | 1,024 | $ | 652 | $ | 372 | ||||||||||||
| Power & Vision | 10,530 | 8,845 | 1,685 | 437 | 386 | 51 | ||||||||||||||||||
| Seating Systems | 4,618 | 3,924 | 694 | 174 | 90 | 84 | ||||||||||||||||||
| Complete Vehicles | 4,337 | 3,891 | 446 | 81 | 178 | (97 | ) | |||||||||||||||||
| Corporate and Other | (475 | ) | (388 | ) | (87 | ) | (36 | ) | 35 | (71 | ) | |||||||||||||
| Total Reportable Segments | $ | 32,343 | $ | 28,272 | $ | 4,071 | $ | 1,680 | $ | 1,341 | $ | 339 | ||||||||||||
| For the nine months ended September 30, | ||||||||||||||||||||||||
| Adjusted
EBIT as a percentage of sales | ||||||||||||||||||||||||
| 2023 | 2022 | Change | ||||||||||||||||||||||
| Body Exteriors & Structures | 7.7 | % | 5.4 | % | 2.3 | % | ||||||||||||||||||
| Power & Vision | 4.2 | % | 4.4 | % | (0.2 | )% | ||||||||||||||||||
| Seating Systems | 3.8 | % | 2.3 | % | 1.5 | % | ||||||||||||||||||
| Complete Vehicles | 1.9 | % | 4.6 | % | (2.7 | )% | ||||||||||||||||||
| Consolidated Average | 5.2 | % | 4.7 | % | 0.5 | % | ||||||||||||||||||
For further details on our segment results, please see our Management’s Discussion and Analysis of Results of Operations and Financial Position and our Interim Financial Statements.
| MAGNA ANNOUNCES THIRD QUARTER 2023 RESULTS | CONNECT WITH MAGNA | 4 |
2023 OUTLOOK
We first disclose a full-year Outlook annually in February, with quarterly updates. The following Outlook is an update to our previous Outlook in August 2023.
Updated 2023 Outlook Assumptions
| Current | Previous | |||
| Light Vehicle Production (millions of units) | ||||
| North America | 15.2 | 15.2 | ||
| Europe | 17.6 | 17.0 | ||
| China | 27.1 | 26.2 | ||
| Average Foreign exchange rates: | ||||
| 1 Canadian dollar equals | U.S. $0.743 | U.S. $0.746 | ||
| 1 euro equals | U.S. $1.075 | U.S. $1.096 |
Updated 2023 Outlook
| Current | Previous | |||
| Segment Sales | ||||
| Body Exteriors & Structures | $17.2 - $17.6 billion | $17.3 - $17.9 billion | ||
| Power & Vision | $14.1 - $14.4 billion | $14.0 - $14.4 billion | ||
| Seating Systems | $5.9 - $6.1 billion | $5.8 - $6.1 billion | ||
| Complete Vehicles | $5.4 - $5.6 billion | $5.4 - $5.7 billion | ||
| Total Sales | $42.1 - $43.1 billion | $41.9 - $43.5 billion | ||
| Adjusted EBIT Margin(2) | 5.1% - 5.4% | 4.9% - 5.3%(3) | ||
| Equity Income (included in EBIT) | $125 - $150 million | $110 - $140 million | ||
| Interest Expense, net | Approximately $150 million | Approximately $150 million | ||
| Income Tax Rate(4) | Approximately 21% | Approximately 21% | ||
| Adjusted Net Income attributable to Magna(5) | $1.55 - $1.65 billion | $1.4 - $1.6 billion | ||
| Capital Spending | Approximately $2.5 billion | Approximately $2.5 billion |
Notes:
(2) Adjusted EBIT Margin is the ratio of Adjusted EBIT to Total Sales. Refer to the reconciliation of Non-GAAP financial measures in the back of this press release for further information.
(3) The Adjusted EBIT Margin of 4.9% - 5.3% presented as the Previous Outlook above excludes the amortization of all acquired intangible assets. This has been revised from the Current Outlook of 4.8% - 5.2% disclosed in the Updated 2023 Outlook issued on August 4, 2023, which only excluded the amortization of intangible assets related to the acquisition of the Veoneer Active Safety business.
(4) The Income Tax Rate has been calculated using Adjusted EBIT and is based on current tax legislation
(5) Adjusted Net Income attributable to Magna represents Net Income excluding Other expense, net and amortization of acquired intangible assets, net of tax
Our Outlook above reflects the impact of the UAW labour strike at certain customers.
Our Outlook is intended to provide information about management's current expectations and plans and may not be appropriate for other purposes. Although considered reasonable by Magna as of the date of this document, the 2023 Outlook above and the underlying assumptions may prove to be inaccurate. Accordingly, our actual results could differ materially from our expectations as set forth herein. The risks identified in the “Forward-Looking Statements” section below represent the primary factors which we believe could cause actual results to differ materially from our expectations.
| MAGNA ANNOUNCES THIRD QUARTER 2023 RESULTS | CONNECT WITH MAGNA | 5 |
Key Drivers of Our Business
Our operating results are primarily dependent on the levels of North American, European, and Chinese car and light truck production by our customers. While we supply systems and components to every major original equipment manufacturer (“OEM”), we do not supply systems and components for every vehicle, nor is the value of our content consistent from one vehicle to the next. As a result, customer and program mix relative to market trends, as well as the value of our content on specific vehicle production programs, are also important drivers of our results.
OEM production volumes are generally aligned with vehicle sales levels and thus affected by changes in such levels. Aside from vehicle sales levels, production volumes are typically impacted by a range of factors, including: general economic and political conditions; labour disruptions; free trade arrangements; tariffs; relative currency values; commodities prices; supply chains and infrastructure; availability and relative cost of skilled labour; regulatory considerations, including those related to environmental emissions and safety standards; and other factors. Additionally, COVID-19 can impact vehicle production volumes, including through: mandatory stay-at-home orders which restrict production; elevated employee absenteeism; and supply chain disruptions.
Overall vehicle sales levels are significantly affected by changes in consumer confidence levels, which may in turn be impacted by consumer perceptions and general trends related to the job, housing, and stock markets, as well as other macroeconomic and political factors. Other factors which typically impact vehicle sales levels and thus production volumes include: interest rates and/or availability of credit; fuel and energy prices; relative currency values; regulatory restrictions on use of vehicles in certain megacities; and other factors. Additionally, COVID-19 can impact vehicle sales, including through mandatory stay-at-home orders which restrict operations of car dealerships, as well as through a deterioration in consumer confidence.
| MAGNA ANNOUNCES THIRD QUARTER 2023 RESULTS | CONNECT WITH MAGNA | 6 |
NON-GAAP FINANCIAL MEASURES RECONCILIATION
Effective July 1, 2023, we revised our calculation of Adjusted EBIT and Adjusted diluted earnings per share to exclude the amortization of acquired intangible assets. Revenue generated from acquired intangible assets is included within revenue in determining net income attributable to Magna. We believe that excluding the amortization of acquired intangible assets from these Non-GAAP measures helps management and investors in understanding our underlying performance and improves comparability between our segmented results of operations and our peers.
The historical presentation of these Non-GAAP measures within this press release has also been updated to reflect the revised calculations.
Adjusted EBIT
The following table reconciles net income to Adjusted EBIT:
| THREE MONTHS
ENDED SEPTEMBER 30, | NINE MONTHS
ENDED SEPTEMBER 30, | |||||||||||||||
| 2023 | 2022 | 2023 | 2022 | |||||||||||||
| Net Income | $ | 417 | $ | 296 | $ | 988 | $ | 530 | ||||||||
| Add: | ||||||||||||||||
| Amortization of acquired intangible assets | 32 | 11 | 57 | 35 | ||||||||||||
| Interest expense, net | 49 | 18 | 103 | 64 | ||||||||||||
| Other (income) expense, net | (4 | ) | 23 | 224 | 510 | |||||||||||
| Income taxes | 121 | 104 | 308 | 202 | ||||||||||||
| Adjusted EBIT | $ | 615 | $ | 452 | $ | 1,680 | $ | 1,341 | ||||||||
Adjusted EBIT as a percentage of sales (“Adjusted EBIT margin”)
Adjusted EBIT as a percentage of sales is calculated in the table below:
| Sales | $ | 10,688 | $ | 9,268 | $ | 32,343 | $ | 28,272 | ||||||||
| Adjusted EBIT | $ | 615 | $ | 452 | $ | 1,680 | $ | 1,341 | ||||||||
| Adjusted EBIT as a percentage of sales | 5.8 | % | 4.9 | % | 5.2 | % | 4.7 | % |
Adjusted diluted earnings per share
The following table reconciles net income attributable to Magna International Inc. to Adjusted diluted earnings per share:
| Net income attributable to Magna International Inc. | $ | 394 | $ | 289 | $ | 942 | $ | 497 | ||||||||
| Add (deduct): | ||||||||||||||||
| Amortization of acquired intangible assets | 32 | 11 | 57 | 35 | ||||||||||||
| Other (income) expense, net | (4 | ) | 23 | 224 | 510 | |||||||||||
| Tax effect on Amortization of acquired intangible assets and Other (income) expense, net | (3 | ) | (6 | ) | (34 | ) | (50 | ) | ||||||||
| Adjustments to Deferred Tax Valuation Allowances | — | — | — | (29 | ) | |||||||||||
| Adjusted net income attributable to Magna International Inc. | $ | 419 | $ | 317 | $ | 1,189 | $ | 963 | ||||||||
| Diluted weighted average number of Common Shares outstanding during the period (millions): | 286.8 | 288.5 | 286.6 | 292.8 | ||||||||||||
| Adjusted diluted earnings per shares | $ | 1.46 | $ | 1.10 | $ | 4.15 | $ | 3.29 |
| MAGNA ANNOUNCES THIRD QUARTER 2023 RESULTS | CONNECT WITH MAGNA | 7 |
Certain of the forward-looking financial measures above are provided on a Non-GAAP basis. We do not provide a reconciliation of such forward-looking measures to the most directly comparable financial measures calculated and presented in accordance with U.S. GAAP. To do so would be potentially misleading and not practical given the difficulty of projecting items that are not reflective of on-going operations in any future period. The magnitude of these items, however, may be significant.
This press release together with our Management’s Discussion and Analysis of Results of Operations and Financial Position and our Interim Financial Statements are available in the Investor Relations section of our website at www.magna.com/company/investors and filed electronically through the System for Electronic Document Analysis and Retrieval (SEDAR) which can be accessed at www.sedar.com as well as on the United States Securities and Exchange Commission’s Electronic Data Gathering, Analysis and Retrieval System (EDGAR), which can be accessed at www.sec.gov.
We will hold a conference call for interested analysts and shareholders to discuss our third quarter ended September 30, 2023 results on Friday, November 3, 2023 at 8:00 a.m. ET. The conference call will be chaired by Swamy Kotagiri, Chief Executive Officer. The number to use for this call from North America is 1-800-908-9207. International callers should use 1-416-620-9188. Please call in at least 10 minutes prior to the call start time. We will also webcast the conference call at www.magna.com. The slide presentation accompanying the conference call as well as our financial review summary will be available on our website Friday prior to the call.
TAGS
Quarterly earnings, raised outlook, financial results, vehicle production
INVESTOR CONTACT
Louis Tonelli, Vice-President, Investor Relations
louis.tonelli@magna.com │ 905.726.7035
MEDIA CONTACT
Tracy Fuerst, Vice-President, Corporate Communications & PR
tracy.fuerst@magna.com │ 248.761.7004
TELECONFERENCE CONTACT
Nancy Hansford, Executive Assistant, Investor Relations
nancy.hansford@magna.com │ 905.726.7108
OUR BUSINESS (6)
Magna is more than one of the world’s largest suppliers in the automotive space. We are a mobility technology company built to innovate, with a global, entrepreneurial-minded team of over 181,000(7) employees across 344 manufacturing operations and 104 product development, engineering and sales centres spanning 29 countries. With 65+ years of expertise, our ecosystem of interconnected products combined with our complete vehicle expertise uniquely positions us to advance mobility in an expanded transportation landscape.
For further information about Magna (NYSE:MGA; TSX:MG), please visit www.magna.com or follow us on social.
(6) Manufacturing operations, product development, engineering and sales centres include certain operations accounted for under the equity method.
(7) Number of employees includes over 168,000 employees at our wholly owned or controlled entities and over 13,000 employees at certain operations accounted for under the equity method.
| MAGNA ANNOUNCES THIRD QUARTER 2023 RESULTS | CONNECT WITH MAGNA | 8 |
FORWARD-LOOKING STATEMENTS
Certain statements in this press release constitute "forward-looking information" or "forward-looking statements" (collectively, "forward-looking statements"). Any such forward-looking statements are intended to provide information about management's current expectations and plans and may not be appropriate for other purposes. Forward-looking statements may include financial and other projections, as well as statements regarding our future plans, strategic objectives or economic performance, or the assumptions underlying any of the foregoing, and other statements that are not recitations of historical fact. We use words such as "may", "would", "could", "should", "will", "likely", "expect", "anticipate", "believe", "intend", "plan", "aim", "forecast", "outlook", "project", "estimate", "target" and similar expressions suggesting future outcomes or events to identify forward-looking statements. The following table identifies the material forward-looking statements contained in this document, together with the material potential risks that we currently believe could cause actual results to differ materially from such forward-looking statements. Readers should also consider all of the risk factors which follow below the table:
| Material Forward-Looking Statement | Material Potential Risks Related to Applicable Forward-Looking Statement | |
| Light Vehicle Production | · | Light vehicle sales levels |
| · | Production disruptions, including as a result of labour strikes | |
| · | Supply disruptions | |
| · | Production allocation decisions by OEMs | |
| Total Sales | · | Same risks as for Light Vehicle Production above |
| Segment Sales | · | The impact of elevated interest rates and availability of credit on consumer confidence and in turn vehicle sales and production |
| · | The impact of deteriorating vehicle affordability on consumer demand, and in turn vehicle sales and production | |
| · | Concentration of sales with six customers | |
| · | Shifts in market shares among vehicles or vehicle segments | |
| · | Shifts in consumer “take rates” for products we sell | |
| · | Relative foreign exchange rates | |
| Adjusted EBIT Margin | · | Same risks as for Total Sales and Segment Sales above |
| Net Income Attributable to Magna | · | Successful execution of critical program launches, including complete vehicle manufacturing of the Fisker Ocean SUV |
| · | Operational underperformance | |
| · | Product warranty/recall risks | |
| · | Production inefficiencies in our operations due to volatile vehicle production allocation decisions by OEMs | |
| · | Higher costs incurred to mitigate the risk of supply disruptions | |
| · | Inflationary pressures | |
| · | Our ability to secure cost recoveries from customers and/or otherwise offset higher input costs | |
| · | Price concessions | |
| · | Commodity cost volatility | |
| · | Scrap steel price volatility | |
| · | Higher labour costs | |
| · | Tax risks | |
| Equity Income | · | Same risks as Adjusted EBIT Margin and Net Income Attributable to Magna |
| · | Risks related to conducting business through joint ventures | |
| MAGNA ANNOUNCES THIRD QUARTER 2023 RESULTS | CONNECT WITH MAGNA | 9 |
Forward-looking statements are based on information currently available to us and are based on assumptions and analyses made by us in light of our experience and our perception of historical trends, current conditions and expected future developments, as well as other factors we believe are appropriate in the circumstances. While we believe we have a reasonable basis for making any such forward-looking statements, they are not a guarantee of future performance or outcomes. In addition to the factors in the table above, whether actual results and developments conform to our expectations and predictions is subject to a number of risks, assumptions, and uncertainties, many of which are beyond our control, and the effects of which can be difficult to predict, including, without limitation:
Macroeconomic, Geopolitical and Other Risks
| · | inflationary pressures; |
| · | interest rate levels; |
Risks Related to the Automotive Industry
| · | economic cyclicality; |
| · | regional production volume declines; |
| · | intense competition; |
| · | deteriorating vehicle affordability; |
| · | potential consumer hesitancy with respect to Electric Vehicles (“EVs”); |
Strategic Risks
| · | alignment of our product mix with the “Car of the Future”; |
| · | our ability to consistently develop and commercialize innovative products or processes; |
| · | our investments in mobility and technology companies; |
| · | our changing business risk profile as a result of increased investment in electrification and autonomous/assisted driving, including: higher R&D and engineering costs, and challenges in quoting for profitable returns on products for which we may not have significant quoting experience; |
| · | strategic and other risks related to the transition to electromobility; |
| · | inability to achieve future investment returns that equal or exceed past returns; |
Customer-Related Risks
| · | the impact of OEM production-related disruptions, including as a result of labour strikes; |
| · | concentration of sales with six customers; |
| · | inability to significantly grow our business with Asian customers; |
| · | emergence of potentially disruptive EV OEMs, including risks related to limited revenues/operating history of new OEM entrants; |
| · | OEM consolidation and cooperation; |
| · | Evolving counterparty risk profile; |
| · | shifts in market shares among vehicles or vehicle segments; |
| · | shifts in consumer "take rates" for products we sell; |
| · | dependence on outsourcing; |
| · | quarterly sales fluctuations; |
| · | potential loss of any material purchase orders; |
Supply Chain Risks
| · | a deterioration of the financial condition of our supply base; |
| · | supply disruptions and applicable costs related to supply disruption mitigation initiatives, including with respect to semiconductor chips; |
| · | regional energy shortages/disruptions and pricing; |
IT Security/Cybersecurity Risk
| · | IT/Cybersecurity breach; |
| · | product Cybersecurity breach; |
Pricing Risks
| · | pricing risks between time of quote and start of production; |
| · | price concessions; |
| · | commodity price volatility; |
| · | declines in scrap steel/aluminum prices; |
Warranty/Recall Risks
| · | costs related to repair or replacement of defective products, including due to a recall; |
| · | warranty or recall costs that exceed warranty provision or insurance coverage limits; |
| · | product liability claims; |
Acquisition Risks
| · | competition for strategic acquisition targets; |
| · | inherent merger and acquisition risks; |
| · | acquisition integration risk; |
Other Business Risks
| · | risks related to conducting business through joint ventures; |
| · | transition and physical risks related to climate change; |
| · | intellectual property risks; |
| · | risks of conducting business in foreign markets; |
| · | fluctuations in relative currency values; |
| · | tax risks; |
| · | reduced financial flexibility as a result of an economic shock; |
| · | changes in credit ratings assigned to us; |
| · | the unpredictability of, and fluctuation in, the trading price of our Common Shares; |
Legal, Regulatory and Other Risks
| · | antitrust risk; |
| · | legal claims and/or regulatory actions against us; |
| · | changes in laws and regulations, including those related to vehicle emissions, taxation, or supply chain due diligence; |
| · | potential restrictions on free trade; and |
| · | trade disputes/tariffs. |
| MAGNA ANNOUNCES THIRD QUARTER 2023 RESULTS | CONNECT WITH MAGNA | 10 |
Manufacturing/Operational Risks
| · | product and new facility launch risks; |
| · | operational underperformance; |
| · | restructuring costs; |
| · | impairment charges; |
| · | labour disruptions; |
| · | skilled labour attraction/retention; |
| · | risks related to COVID-19 |
| · | leadership expertise and succession; |
In evaluating forward-looking statements or forward-looking information, we caution readers not to place undue reliance on any forward-looking statement. Additionally, readers should specifically consider the various factors which could cause actual events or results to differ materially from those indicated by such forward-looking statements, including the risks, assumptions and uncertainties above which are:
| · | discussed under the “Industry Trends and Risks” heading of our Management’s Discussion and Analysis; and |
| · | set out in our revised Annual Information Form filed with securities commissions in Canada, our annual report on Form 40-F / 40-F/A filed with the United States Securities and Exchange commission, and subsequent filings. |
Readers should also consider discussion of our risk mitigation activities with respect to certain risk factors, which can be also found in our Annual Information Form. Additional information about Magna, including our Annual Information Form, is available through the System for Electronic Data Analysis and Retrieval+ (SEDAR+) at www.sedarplus.com.
| MAGNA ANNOUNCES THIRD QUARTER 2023 RESULTS | CONNECT WITH MAGNA | 11 |
Exhibit 99.2

Magna International Inc.
Third Quarter Report
2023
MAGNA INTERNATIONAL INC.
Management's Discussion and Analysis of Results of Operations and Financial Position
Unless otherwise noted, all amounts in this Management's Discussion and Analysis of Results of Operations and Financial Position ["MD&A"] are in U.S. dollars and all tabular amounts are in millions of U.S. dollars, except per share figures, which are in U.S. dollars. When we use the terms "we", "us", "our" or "Magna", we are referring to Magna International Inc. and its subsidiaries and jointly controlled entities, unless the context otherwise requires.
This MD&A should be read in conjunction with the unaudited interim consolidated financial statements for the three and nine months ended September 30, 2023 included in this Quarterly Report, and the audited consolidated financial statements and MD&A for the year ended December 31, 2022 included in our 2022 Annual Report to Shareholders.
This MD&A may contain statements that are forward looking. Refer to the "Forward-Looking Statements" section in this MD&A for a more detailed discussion of our use of forward-looking statements.
This MD&A has been prepared as at November 2, 2023.
HIGHLIGHTS
Comparing the third quarter of 2023 to the third quarter of 2022:
| · | Global light vehicle production rose 4%, including increases of 7% and 14% in North America and Europe, respectively, and a 2% decline in China. | |
| · | Total sales increased 15% to $10.7 billion, largely reflecting higher global production, the launch of new programs, the acquisition of Veoneer Active Safety ["Veoneer AS"] in the second quarter of 2023 and the net strengthening of foreign currencies against the U.S. dollar. These were partially offset by lower sales associated with the United Automobile, Aerospace, and Agricultural Implement Workers of America ["UAW"] labour strike and lower assembly sales as our Complete Vehicles business undergoes a program changeover. | |
| · | Diluted earnings per share were $1.37 and Adjusted diluted earnings per share(1) increased 33% or $0.36 to $1.46 primarily due to contribution on higher sales, the impact of operational excellence and cost initiatives and lower net input costs, partially offset by commercial items in the third quarter of 2023 and 2022, which had a net unfavourable impact on a year over year basis, acquisitions, net of divestitures, subsequent to the third quarter of 2022 and lost contribution on lower sales associated with the UAW labour strike. | |
| · | Cash from operating activities increased $559 million to $797 million. |
OVERVIEW
OUR BUSINESS(2)
Magna is more than one of the world’s largest suppliers in the automotive space. We are a mobility technology company built to innovate, with a global, entrepreneurial-minded team of over 181,000(3) employees across 344 manufacturing operations and 104 product development, engineering and sales centres spanning 29 countries. With 65+ years of expertise, our ecosystem of interconnected products combined with our complete vehicle expertise uniquely positions us to advance mobility in an expanded transportation landscape. For further information about Magna (NYSE:MGA; TSX:MG), please visit www.magna.com or follow us on social.
1 Adjusted diluted earnings per share is a non-GAAP financial measure. Refer to the section "Use of Non-GAAP Financial Measures".
2 Manufacturing operations, product development, engineering and sales centres include certain operations accounted for under the equity method.
3 Number of employees includes over 168,000 employees at our wholly owned or controlled entities and over 13,000 employees at operations accounted for under the equity method.
| Magna International Inc. Third Quarter Report 2023 1 |
INDUSTRY TRENDS & RISKS
Our operating results are primarily dependent on the levels of North American, European, and Chinese car and light truck production by our customers. While we supply systems and components to every major original equipment manufacturer ["OEM"], we do not supply systems and components for every vehicle, nor is the value of our content consistent from one vehicle to the next. As a result, customer and program mix relative to market trends, as well as the value of our content on specific vehicle production programs, are also important drivers of our results.
Ordinarily, OEM production volumes are aligned with vehicle sales levels and thus affected by changes in such levels. Aside from vehicle sales levels, production volumes are typically impacted by a range of factors, including: general economic and political conditions; labour disruptions; free trade arrangements; tariffs; relative currency values; commodities prices; supply chains and infrastructure; availability and relative cost of skilled labour; regulatory considerations, including those related to environmental emissions and safety standards; and other factors.
Overall vehicle sales levels are significantly affected by changes in consumer confidence levels, which may in turn be impacted by consumer perceptions and general trends related to the job, housing, and stock markets, as well as other macroeconomic and political factors. Other factors which typically impact vehicle sales levels and thus production volumes include: interest rates and/or availability of credit; fuel and energy prices; relative currency values; regulatory restrictions on use of vehicles in certain megacities; and other factors.
While the foregoing economic, political, and other factors are part of the general context in which the global automotive industry operates, there have been a number of significant industry trends that are shaping the future of the industry and creating opportunities and risks for automotive suppliers. We continue to implement a business strategy which is rooted in our best assessment as to the rate and direction of change in the automotive industry, including with respect to trends related to vehicle electrification and advanced driver assistance systems, as well as new mobility business models/"mobility-as-a-service" ["MaaS"]. Our short- and medium-term operational success, as well as our ability to create long-term value through our business strategy, are subject to a number of risks and uncertainties. Significant industry trends, our business strategy, and the major risks we face, are discussed in our revised Annual Information Form ["AIF"] and Annual Report on Form 40-F / 40-F/A ["Form 40-F"] in respect of the year ended December 31, 2022, together with subsequent filings. Those industry trends and risk factors remain substantially unchanged in respect of the third quarter ended September 30, 2023, except that three of our largest customers – General Motors, Stellantis and Ford – experienced labour disruptions at certain of their respective operations in the U.S. during and subsequent to the quarter. The UAW commenced targeted strikes on September 15, 2023, with subsequent escalations increasing the number of OEM customer facilities affected. Although each of Ford, General Motors and Stellantis has negotiated a collective bargaining agreement with the UAW, such agreements remain subject to retification by union members. The failure of UAW members to ratify a collective bargaining agreement followed by extended labour disruptions and lost production could have a material adverse effect on our sales and profitability.
| 2 Magna International Inc. Third Quarter Report 2023 |
USE OF NON-GAAP FINANCIAL MEASURES
In addition to results presented in accordance with accounting principles generally accepted in the United States of America ["U.S. GAAP"], this report includes the use of Adjusted earnings before interest and taxes ["Adjusted EBIT"], Adjusted EBIT as a percentage of sales, Adjusted diluted earnings per share, Return on Invested Capital, and Adjusted Return on Invested Capital [collectively, the "Non-GAAP Measures"]. We believe these Non-GAAP financial measures provide additional information that is useful to investors in understanding our underlying performance and trends through the same financial measures employed by our management for this purpose. Readers should be aware that Non-GAAP Measures have no standardized meaning under U.S. GAAP and accordingly may not be comparable to the calculation of similar measures by other companies. We believe that Return on Invested Capital is useful to both management and investors in their analysis of our results of operations reflects our ability to generate returns. Similarly, we believe that Adjusted EBIT, Adjusted EBIT as a percentage of sales, Adjusted diluted earnings per share and Adjusted Return on Invested Capital provide useful information to our investors for measuring our operational performance as they exclude certain items that are not reflective of ongoing operating profit or loss and facilitate a comparison with prior periods. The presentation of any Non-GAAP Measures should not be considered in isolation or as a substitute for our related financial results prepared in accordance with U.S. GAAP. Non-GAAP financial measures are presented together with the most directly comparable U.S. GAAP financial measure, and a reconciliation to the most directly comparable U.S. GAAP financial measure, can be found in the "Non-GAAP Financial Measures Reconciliation" section of this MD&A.
Effective July 1, 2023 we revised our calculations of Adjusted EBIT, Adjusted diluted earnings per share and Adjusted Return on Invested Capital to exclude the amortization of acquired intangible assets. The historical presentation of these Non-GAAP measures within this MD&A has also been updated to reflect the revised calculations. Refer to the "Non-GAAP Financial Measures Reconciliation" section of this MD&A for further information.
| Magna International Inc. Third Quarter Report 2023 3 |
RESULTS OF OPERATIONS
AVERAGE FOREIGN EXCHANGE
| For the three months | For the nine months | |||||||||||||||||||||||
| ended September 30, | ended September 30, | |||||||||||||||||||||||
| 2023 | 2022 | Change | 2023 | 2022 | Change | |||||||||||||||||||
| 1 Canadian dollar equals U.S. dollars | 0.746 | 0.765 | - | 2 | % | 0.744 | 0.779 | - | 4 | % | ||||||||||||||
| 1 euro equals U.S. dollars | 1.088 | 1.006 | + | 8 | % | 1.083 | 1.064 | + | 2 | % | ||||||||||||||
| 1 Chinese renminbi equals U.S. dollars | 0.138 | 0.146 | - | 5 | % | 0.142 | 0.152 | - | 7 | % | ||||||||||||||
The preceding table reflects the average foreign exchange rates between the most common currencies in which we conduct business and our U.S. dollar reporting currency.
The results of operations for which the functional currency is not the U.S. dollar are translated into U.S. dollars using the average exchange rates for the relevant period. Throughout this MD&A, reference is made to the impact of translation of foreign operations on reported U.S. dollar amounts where relevant.
Our results can also be affected by the impact of movements in exchange rates on foreign currency transactions (such as raw material purchases or sales denominated in foreign currencies). However, as a result of hedging programs employed by us, foreign currency transactions in the current period have not been fully impacted by movements in exchange rates. We record foreign currency transactions at the hedged rate where applicable.
Finally, foreign exchange gains and losses on revaluation and/or settlement of monetary items denominated in a currency other than an operation's functional currency impact reported results. These gains and losses are recorded in selling, general and administrative expense.
LIGHT VEHICLE PRODUCTION VOLUMES
Our operating results are mostly dependent on light vehicle production in the regions reflected in the table below:
Light Vehicle Production Volumes (thousands of units)
| For the three months | For the nine months | |||||||||||||||||||||||
| ended September 30, | ended September 30, | |||||||||||||||||||||||
| 2023 | 2022 | Change | 2023 | 2022 | Change | |||||||||||||||||||
| North America | 3,874 | 3,607 | + | 7 | % | 11,842 | 10,779 | + | 10 | % | ||||||||||||||
| Europe | 4,088 | 3,593 | + | 14 | % | 13,263 | 11,593 | + | 14 | % | ||||||||||||||
| China | 7,108 | 7,230 | - | 2 | % | 19,865 | 19,082 | + | 4 | % | ||||||||||||||
| Other | 6,867 | 6,710 | + | 2 | % | 20,688 | 19,168 | + | 8 | % | ||||||||||||||
| Global | 21,937 | 21,140 | + | 4 | % | 65,658 | 60,622 | + | 8 | % | ||||||||||||||
Overall, global light vehicle production increased 4% over the third quarter of 2022. This increase largely reflects the rebalancing of supply chains in 2023 compared to the significant industry production disruptions during 2022 caused by global semiconductor chip shortages.
| 4 Magna International Inc. Third Quarter Report 2023 |
RESULTS OF OPERATIONS – FOR THE THREE MONTHS ENDED SEPTEMBER 30, 2023
SALES
Sales increased 15% or $1.42 billion to $10.69 billion for the third quarter of 2023 compared to $9.27 billion for the third quarter of 2022 primarily due to:
| · | the launch of new programs during or subsequent to the third quarter of 2022; | |
| · | higher global light vehicle production; | |
| · | acquisitions, net of divestitures, subsequent to the third quarter of 2022, which increased sales by $379 million; | |
| · | the net strengthening of foreign currencies against the U.S. dollar, which increased reported U.S. dollar sales by $155 million; and | |
| · | customer price increases to recover certain higher production input costs. |
These factors were partially offset by the negative impact of lost vehicle production as a result of the UAW labour strike at certain customers during the third quarter of 2023, which decreased sales by approximately $50 million and net customer price concessions subsequent to the third quarter of 2022.
COST OF GOODS SOLD
| For the three months | ||||||||||||
| ended September 30, | ||||||||||||
| 2023 | 2022 | Change | ||||||||||
| Material | $ | 6,512 | $ | 5,732 | $ | 780 | ||||||
| Direct labour | 745 | 676 | 69 | |||||||||
| Overhead | 2,007 | 1,718 | 289 | |||||||||
| Cost of goods sold | $ | 9,264 | $ | 8,126 | $ | 1,138 | ||||||
Cost of goods sold increased $1.14 billion to $9.26 billion for the third quarter of 2023 compared to $8.13 billion for the third quarter of 2022, primarily due to:
| · | higher material, direct labour and overhead associated with higher sales; |
| · | acquisitions, net of divestitures, subsequent to the third quarter of 2022; |
| · | the net strengthening of foreign currencies against the U.S. dollar, which increased reported U.S. dollar costs of goods sold by $150 million; |
| · | commercial items in the third quarters of 2023 and 2022, which had a net unfavourable impact on a year over year basis; |
| · | higher launch, engineering and other costs associated with the launch of new assembly business; and |
| · | higher net prodcution input costs, including for labour, partially offset by lower prices for commodities and energy. |
These factors were partially offset by:
| · | productivity and efficiency improvements, including lower costs at certain previously underperforming facilities; |
| · | the negative impact of the UAW labour strike at certain customers during the third quarter of 2023; and |
| · | the impact of operational excellence and cost initiatives. |
DEPRECIATION
Depreciation increased $28 million to $358 million for the third quarter of 2023 compared to $330 million for the third quarter of 2022 primarily due to increased capital deployed at new and existing facilities to support the launch of programs, acquisitions, net of divestitures, subsequent to the third quarter of 2022, and the net strengthening of foreign currencies against the U.S. dollar, which increased reported U.S. dollar depreciation by $7 million, partially offset by the end of production of certain programs.
| Magna International Inc. Third Quarter Report 2023 5 |
AMORTIZATION OF ACQUIRED INTANGIBLE ASSETS
Amortization of acquired intangible assets increased $21 million to $32 million for the third quarter of 2023 compared to $11 million for the third quarter of 2022 primarily due to the acquisition of Veoneer AS during the second quarter of 2023.
SELLING, GENERAL AND ADMINISTRATIVE ["SG&A"]
SG&A expense increased $104 million to $491 million for the third quarter of 2023 compared to $387 million for the third quarter of 2022, primarily as a result of:
| · | acquisitions, net of divestitures, subsequent to the third quarter of 2022; |
| · | higher labour and benefit costs; |
| · | higher incentive compensation; |
| · | the net strengthening of foreign currencies against the U.S. dollar, which increased SG&A by $5 million; and |
| · | higher costs to accelerate our operational excellence initiatives. |
INTEREST EXPENSE, NET
During the third quarter of 2023, we recorded net interest expense of $49 million compared to $18 million for the third quarter of 2022. The $31 million increase is primarily a result of interest expense on the $1.6 billion of Senior Notes issued during the first quarter of 2023, higher interest expense due to an increase in borrowings, and higher interest rates.
EQUITY INCOME
Equity income increased $13 million to $40 million for the third quarter of 2023 compared to $27 million for the third quarter of 2022, primarily as a result of earnings on higher sales at certain equity-accounted entities and commercial items in the third quarters of 2023 and 2022, which had a net favourable impact on a year over year basis partially offset by higher launch costs.
OTHER (INCOME) EXPENSE, NET
| For the three months | ||||||||
| ended September 30, | ||||||||
| 2023 | 2022 | |||||||
| Investments (1) | $ | (19 | ) | $ | 9 | |||
| Restructuring (2) | (1 | ) | — | |||||
| Operations in Russia (3) | 16 | — | ||||||
| Impairments (4) | — | 14 | ||||||
| $ | (4 | ) | $ | 23 | ||||
| (1) | Investments |
| For the three months | ||||||||
| ended September 30, | ||||||||
| 2023 | 2022 | |||||||
| Revaluation of public company warrants | $ | (18 | ) | $ | 7 | |||
| Revaluation of public and private equity investments | (1 | ) | 2 | |||||
| Other (income) expense, net | (19 | ) | 9 | |||||
| Tax effect | 5 | (2 | ) | |||||
| Net (income) loss attributable to Magna | $ | (14 | ) | $ | 7 | |||
| (2) | Restructuring |
During the third quarter of 2023, we recorded restructuring charges of $7 million [$5 million after tax] and an $8 million [$7 million after tax] gain on the sale of a building as a result of restructuring activities in our Power & Vision segment.
| (3) | Operations in Russia |
During the third quarter of 2023, we completed the sale of all of our investments in Russia resulting in a loss of $16 million [$16 million after tax] including a net cash outflow of $23 million.
| (4) | Impairments |
During the third quarter of 2022, we recorded impairment charges of $10 million [$9 million after tax] in our Body Exteriors & Structures segment and $4 million [$3 million after tax] in our Power & Vision segment, respectively.
| 6 Magna International Inc. Third Quarter Report 2023 |
INCOME FROM OPERATIONS BEFORE INCOME TAXES
Income from operations before income taxes was $538 million for the third quarter of 2023 compared to $400 million for the third quarter of 2022. This $138 million increase is a result of the following changes, each as discussed above:
| For the three months | ||||||||||||
| ended September 30, | ||||||||||||
| 2023 | 2022 | Change | ||||||||||
| Sales | $ | 10,688 | $ | 9,268 | $ | 1,420 | ||||||
| Costs and expenses | ||||||||||||
| Cost of goods sold | 9,264 | 8,126 | 1,138 | |||||||||
| Depreciation | 358 | 330 | 28 | |||||||||
| Amortization of acquired intangible assets | 32 | 11 | 21 | |||||||||
| Selling, general and administrative | 491 | 387 | 104 | |||||||||
| Interest expense, net | 49 | 18 | 31 | |||||||||
| Equity income | (40 | ) | (27 | ) | (13 | ) | ||||||
| Other (income) expense, net | (4 | ) | 23 | (27 | ) | |||||||
| Income from operations before income taxes | $ | 538 | $ | 400 | $ | 138 | ||||||
INCOME TAXES
| For the three months ended September 30, | ||||||||||||||||
| 2023 | 2022 | |||||||||||||||
| Income Taxes as reported | $ | 121 | 22.5 | % | $ | 104 | 26.0 | % | ||||||||
| Tax effect on Other (income) expense, net and | ||||||||||||||||
| Amortization of acquired intangible assets | 3 | (0.6 | ) | 6 | (0.7 | ) | ||||||||||
| $ | 124 | 21.9 | % | $ | 110 | 25.3 | % | |||||||||
Excluding the tax effect on Other (income) expense, net, and Amortization of acquired intangible assets, our effective income tax rate decreased to 21.9% for the third quarter of 2023 compared to 25.3% for the third quarter of 2022 primarily due to lower losses not benefitted in Europe and lower accrued tax on undistributed foreign earnings. These factors were partially offset by lower favourable changes in our reserves for uncertain tax positions.
INCOME ATTRIBUTABLE TO NON-CONTROLLING INTERESTS
Income attributable to non-controlling interests was $23 million for the third quarter of 2023 compared to $7 million for the third quarter of 2022. This $16 million increase was primarily due to higher net income at our non-wholly owned operations in China.
| Magna International Inc. Third Quarter Report 2023 7 |
NET INCOME ATTRIBUTABLE TO MAGNA INTERNATIONAL INC.
Net income attributable to Magna International Inc. was $394 million for the third quarter of 2023 compared to $289 million for the third quarter of 2022. This $105 million increase was as a result of: an increase in income from operations before income taxes of $138 million; partially offset by an increase in income taxes of $17 million; and an increase of $16 million in income attributable to non-controlling interests.
EARNINGS PER SHARE
| For the three months | ||||||||||||
| ended September 30, | ||||||||||||
| 2023 | 2022 | Change | ||||||||||
| Earnings per Common Share | ||||||||||||
| Basic | $ | 1.37 | $ | 1.01 | + | 36 | % | |||||
| Diluted | $ | 1.37 | $ | 1.00 | + | 37 | % | |||||
| Weighted average number of Common Shares outstanding (millions) | ||||||||||||
| Basic | 286.3 | 287.9 | - | 1 | % | |||||||
| Diluted | 286.8 | 288.5 | - | 1 | % | |||||||
| Adjusted diluted earnings per share | $ | 1.46 | $ | 1.10 | + | 33 | % | |||||
Diluted earnings per share was $1.37 for the third quarter of 2023 compared to $1.00 for the third quarter of 2022. The $0.37 increase was as a result of higher net income attributable to Magna International Inc., as discussed above, and a decrease in the weighted average number of diluted shares outstanding during the third quarter of 2023. The decrease in the weighted average number of diluted shares outstanding was primarily due to the purchase and cancellation of Common Shares, during or subsequent to the third quarter of 2022, pursuant to our normal course issuer bids.
Other (income) expense, net, after tax, and Amortization of acquired intangible assets, after tax, negatively impacted diluted earnings per share by $0.09 in the third quarter of 2023 and $0.10 in the third quarter of 2022, respectively, as discussed in the "Other (income) expense, net", "Amortization of acquired intangible assets", and "Income Taxes" sections above. Adjusted diluted earnings per share, as reconciled in the "Non-GAAP Financial Measures Reconciliation" section, was $1.46 for the third quarter of 2023 compared to $1.10 in the third quarter of 2022, an increase of $0.36.
8 Magna International Inc. Third Quarter Report 2023
NON-GAAP PERFORMANCE MEASURES – FOR THE THREE MONTHS ENDED SEPTEMBER 30, 2023
ADJUSTED EBIT AS A PERCENTAGE OF SALES
The table below shows the change in Magna's Sales and Adjusted EBIT by segment and the impact each segment's changes had on Magna's Adjusted EBIT as a percentage of sales for the third quarter of 2023 compared to the third quarter of 2022:
| Adjusted EBIT | ||||||||||||
| Adjusted | as a percentage | |||||||||||
| Sales | EBIT | of sales | ||||||||||
| Third quarter of 2022 | $ | 9,268 | $ | 452 | 4.9 | % | ||||||
| Increase (decrease) related to: | ||||||||||||
| Body Exteriors & Structures | 378 | 131 | + | 1.1 | % | |||||||
| Power & Vision | 834 | 97 | + | 0.5 | % | |||||||
| Seating Systems | 234 | 33 | + | 0.2 | % | |||||||
| Complete Vehicles | (28 | ) | (70 | ) | - | 0.6 | % | |||||
| Corporate and Other | 2 | (28 | ) | - | 0.3 | % | ||||||
| Third quarter of 2023 | $ | 10,688 | $ | 615 | 5.8 | % | ||||||
Adjusted EBIT as a percentage of sales increased to 5.8% for the third quarter of 2023 compared to 4.9% for the third quarter of 2022 primarily due to:
| · | earnings on higher sales including higher margins as a result of the impact of operational excellence and cost initiatives; |
| · | higher customer recoveries net of production input costs, including for energy and commodities, partially offset by higher prices for labour; |
| · | productivity and efficiency improvements, including lower costs at certain previously underperforming facilities; |
| · | lower net warranty costs; and |
| · | lower net engineering costs including spending related to our electrification and active safety businesses. |
These factors were partially offset by:
| · | commercial items in the third quarters of 2023 and 2022, which had a net unfavourable impact on a year over year basis; |
| · | acquisitions, net of divestitures, subsequent to the third quarter of 2022; |
| · | lower amortization related to the initial value of public company securities; |
| · | higher launch, engineering and other costs associated with the launch of new assembly business; and |
| · | the negative impact of the UAW labour strike at certain customers during the third quarter of 2023. |
Magna International Inc. Third Quarter Report 2023 9
ADJUSTED RETURN ON INVESTED CAPITAL AND RETURN ON INVESTED CAPITAL
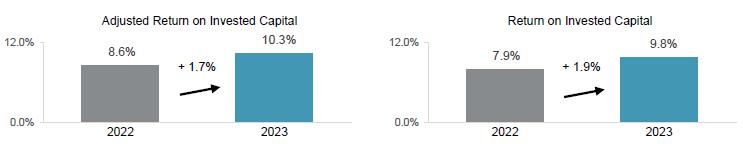
Adjusted Return on Invested Capital increased to 10.3% for the third quarter of 2023 compared to 8.6% for the third quarter of 2022 as a result of an increase in Adjusted After-tax operating profits partially offset by higher Average Invested Capital. Other (income) expense, net, after tax and Amortization of acquired intangible assets, after tax negatively impacted Return on Invested Capital by 0.5% in the third quarter of 2023 and by 0.7% in the third quarter of 2022.
Average Invested Capital increased $3.02 billion to $18.64 billion for the third quarter of 2023 compared to $15.62 billion for the third quarter of 2022, primarily due to:
| · | acquisitions, net of divestitures, during and subsequent to the third quarter of 2022; |
| · | average investment in fixed assets in excess of our average depreciation expense on fixed assets; |
| · | an increase in average operating assets and liabilities; and |
| · | the net strengthening of foreign currencies against the U.S. dollar. |
These factors were partially offset by lower net investments and the impairment of our Russian assets recorded during the second quarter of 2022.
10 Magna International Inc. Third Quarter Report 2023
SEGMENT ANALYSIS
We are a global automotive supplier that has complete vehicle engineering and contract manufacturing expertise, as well as product capabilities which include body, chassis, exterior, seating, powertrain, active safety, electronics, mechatronics, mirrors, lighting and roof systems. We also have electronic and software capabilities across many of these areas.
Our reporting segments are: Body Exteriors & Structures; Power & Vision; Seating Systems; and Complete Vehicles.
| For the three months ended September 30, | ||||||||||||||||||||||||
| Sales | Adjusted EBIT | |||||||||||||||||||||||
| 2023 | 2022 | Change | 2023 | 2022 | Change | |||||||||||||||||||
| Body Exteriors & Structures | $ | 4,354 | $ | 3,976 | $ | 378 | $ | 358 | $ | 227 | $ | 131 | ||||||||||||
| Power & Vision | 3,745 | 2,911 | 834 | 221 | 124 | 97 | ||||||||||||||||||
| Seating Systems | 1,529 | 1,295 | 234 | 70 | 37 | 33 | ||||||||||||||||||
| Complete Vehicles | 1,185 | 1,213 | (28 | ) | (5 | ) | 65 | (70 | ) | |||||||||||||||
| Corporate and Other | (125 | ) | (127 | ) | 2 | (29 | ) | (1 | ) | (28 | ) | |||||||||||||
| Total reportable segments | $ | 10,688 | $ | 9,268 | $ | 1,420 | $ | 615 | $ | 452 | $ | 163 | ||||||||||||
BODY EXTERIORS & STRUCTURES
| For the three months | ||||||||||||||||
| ended September 30, | ||||||||||||||||
| 2023 | 2022 | Change | ||||||||||||||
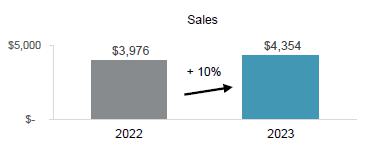
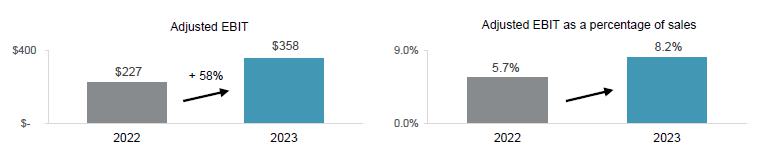
| Sales | $ | 4,354 | $ | 3,976 | $ | 378 | + | 10 | % | |||||||
| Adjusted EBIT | $ | 358 | $ | 227 | $ | 131 | + | 58 | % | |||||||
| Adjusted EBIT as a percentage of sales | 8.2 | % | 5.7 | % | + | 2.5 | % | |||||||||
Sales – Body Exteriors & Structures
Sales increased 10% or $378 million to $4.35 billion for the third quarter of 2023 compared to $3.98 billion for the third quarter of 2022 primarily due to:
| · | the launch of programs during or subsequent to the third quarter of 2022, including the: |
| · | Jeep Grand Cherokee; |
| · | GMC Hummer EV SUV; |
| · | Ford F-Series Super Duty; and |
| · | BMW X1 & iX1; |
| · | higher global light vehicle production; |
| · | the net strengthening of foreign currencies against the U.S. dollar, which increased reported U.S. dollar sales by $32 million; and |
| · | customer price increases to recover certain higher production input costs. |
These factors were partially offset by:
| · | the negative impact of lost vehicle production as a result of the UAW labour strike at certain customers during the third quarter of 2023, which negatively impacted sales by approximately $35 million; and |
| · | net customer price concessions subsequent to the third quarter of 2022. |
Magna International Inc. Third Quarter Report 2023 11
Adjusted EBIT and Adjusted EBIT as a percentage of sales – Body Exteriors & Structures
Adjusted EBIT increased $131 million to $358 million for the third quarter of 2023 compared to $227 million for the third quarter of 2022 and Adjusted EBIT as a percentage of sales increased to 8.2% from 5.7%. These increases were primarily as a result of earnings on higher sales including higher margins due to the impact of operational excellence and cost initiatives. Other factors positively impacting Adjusted EBIT and Adjusted EBIT as a percentage of sales include:
| · | higher customer recoveries net of production input costs, including for energy and commodities, partially offset by higher prices for labour; and |
| · | productivity and efficiency improvements, including lower costs at certain previously underperforming facilities. |
These factors were partially offset by:
| · | commercial items in the third quarters of 2023 and 2022, which had a net unfavourable impact on a year over year basis; |
| · | the negative impact of the UAW labour strike during the third quarter of 2023; and |
| · | the net weakening of foreign currencies against the U.S. dollar, which had a $4 million unfavourable impact on reported U.S. dollar Adjusted EBIT. |
POWER & VISION
| For the three months | ||||||||||||||||
| ended September 30, | ||||||||||||||||
| 2023 | 2022 | Change | ||||||||||||||
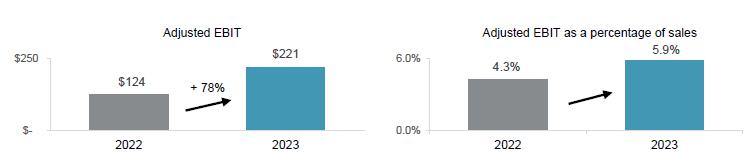
| Sales | $ | 3,745 | $ | 2,911 | $ | 834 | + | 29 | % | |||||||
| Adjusted EBIT | $ | 221 | $ | 124 | $ | 97 | + | 78 | % | |||||||
| Adjusted EBIT as a percentage of sales | 5.9 | % | 4.3 | % | + | 1.6 | % | |||||||||

Sales – Power & Vision
Sales increased 29% or $834 million to $3.75 billion for the third quarter of 2023 compared to $2.91 billion for the third quarter of 2022 primarily due to:
| · | acquisitions, net of divestitures, subsequent to the third quarter of 2022, which increased sales by $380 million; |
| · | the launch of programs during or subsequent to the third quarter of 2022, including the: |
| · | BMW X1 & iX1; |
| · | Chery Arrizo 8; |
| · | Fisker Ocean; and |
| · | Chevrolet Equinox & Blazer; |
| · | higher global light vehicle production; |
| · | the net strengthening of foreign currencies against the U.S. dollar, which increased reported U.S. dollar sales by $43 million; and |
| · | customer price increases to recover certain higher production input costs. |
These factors were partially offset by net customer price concessions subsequent to the third quarter of 2022.
12 Magna International Inc. Third Quarter Report 2023
Adjusted EBIT and Adjusted EBIT as a percentage of sales – Power & Vision
Adjusted EBIT increased $97 million to $221 million for the third quarter of 2023 compared to $124 million for the third quarter of 2022 and Adjusted EBIT as a percentage of sales increased to 5.9% from 4.3%. These increases were primarily as a result of earnings on higher sales including higher margins due to the impact of operational excellence and cost initiatives. Other factors positively impacting Adjusted EBIT and Adjusted EBIT as a percentage of sales include:
| · | higher customer recoveries net of production input costs, including for commodities, energy, and freight, partially offset by higher prices for labour; |
| · | lower net warranty costs of $18 million; |
| · | higher equity income; |
| · | lower net engineering costs including spending related to our electrification and active safety businesses; and |
| · | cost savings and efficiencies realized, including as a result of restructuring actions taken. |
These factors were partially offset by:
| · | acquisitions, net of divestitures, subsequent to the third quarter of 2022; |
| · | commercial items in the third quarters of 2023 and 2022, which had a net unfavourable impact on a year over year basis; and |
| · | the net weakening of foreign currencies against the U.S. dollar, which had a $5 million unfavourable impact on reported U.S. dollar Adjusted EBIT. |
SEATING SYSTEMS
| For the three months | ||||||||||||||||
| ended September 30, | ||||||||||||||||
| 2023 | 2022 | Change | ||||||||||||||
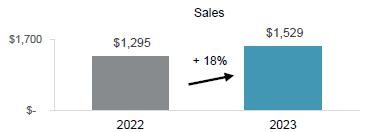
| Sales | $ | 1,529 | $ | 1,295 | $ | 234 | + | 18 | % | |||||||
| Adjusted EBIT | $ | 70 | $ | 37 | $ | 33 | + | 89 | % | |||||||
| Adjusted EBIT as a percentage of sales | 4.6 | % | 2.9 | % | + | 1.7 | % | |||||||||
Sales – Seating Systems
Sales increased 18% or $234 million to $1.53 billion for the third quarter of 2023 compared to $1.30 billion for the third quarter of 2022 primarily due to:
| · | higher global light vehicle production; and |
| · | the launch of programs during or subsequent to the third quarter of 2022, including the: |
| · | Jeep Grand Cherokee; |
| · | Changan Shenlan S7; |
| · | Geely Galaxy L7; and |
| · | BMW XM; and |
| · | customer price increases to recover certain higher production input costs. |
These factors were partially offset by net customer price concessions subsequent to the third quarter of 2022.
Magna International Inc. Third Quarter Report 2023 13

Adjusted EBIT and Adjusted EBIT as a percentage of sales – Seating Systems
Adjusted EBIT increased $33 million to $70 million for the third quarter of 2023 compared to $37 million for the third quarter of 2022 and Adjusted EBIT as a percentage of sales increased to 4.6% from 2.9%. These increases were primarily as a result of earnings on higher sales including higher margins due to the impact of operational excellence and cost initiatives. Other factors positively impacting Adjusted EBIT and Adjusted EBIT as a percentage of sales include:
| · | productivity and efficiency improvements, including lower costs at certain previously underperforming facilities; and |
| · | lower launch costs. |
These factors were partially offset by commercial items in the third quarters of 2023 and 2022, which had a net unfavourable impact on a year over year basis.
COMPLETE VEHICLES
| For the three months | ||||||||||||||||
| ended September 30, | ||||||||||||||||
| 2023 | 2022 | Change | ||||||||||||||
| Complete Vehicle Assembly Volumes (thousands of units)(i) | 22.9 | 25.6 | (2.7 | ) | - | 11 | % | |||||||||
| Sales | $ | 1,185 | $ | 1,213 | $ | (28 | ) | - | 2 | % | ||||||
| Adjusted EBIT | $ | (5 | ) | $ | 65 | $ | (70 | ) | ¾ | |||||||
| Adjusted EBIT as a percentage of sales | (0.4 | )% | 5.4 | % | - | 5.8 | % | |||||||||
(i) Vehicles produced at our Complete Vehicle operations are included in Europe Light Vehicle Production volumes.

Sales – Complete Vehicles
Sales decreased 2% or $28 million to $1.19 billion for the third quarter of 2023 compared to $1.21 billion for the third quarter of 2022 while assembly volumes decreased 11%. The decrease in sales is primarily a result of unfavourable program mix and lower assembly volumes which are partially offset by a $87 million increase in reported U.S. dollar sales as a result of the strengthening of the euro against the U.S. dollar.
14 Magna International Inc. Third Quarter Report 2023
Adjusted EBIT and Adjusted EBIT as a percentage of sales – Complete Vehicles
Adjusted EBIT decreased $70 million to a loss of $5 million for the third quarter of 2023 compared to income of $65 million for the third quarter of 2022 and Adjusted EBIT as a percentage of sales decreased to -0.4% from 5.4%. These decreases were primarily due to:
| · | commercial items in the third quarters of 2023 and 2022, which had a net unfavourable impact on a year over year basis; |
| · | higher launch, engineering and other costs associated with the launch of new assembly business; and |
| · | lower earnings on lower assembly volumes, net of contractual fixed cost recoveries on certain programs. |
CORPORATE AND OTHER
Adjusted EBIT was a loss of $29 million for the third quarter of 2023 compared to a loss of $1 million for the third quarter of 2022. The $28 million decrease was primarily the result of:
| · | lower amortization related to the initial value of public company securities; |
| · | higher net transactional foreign exchange losses; |
| · | higher investments in research, development and new mobility; |
| · | higher incentive compensation; and |
| · | higher labour and benefit costs. |
These factors were partially offset by an increase in fees received from our divisions.
Magna International Inc. Third Quarter Report 2023 15
FINANCIAL CONDITION, LIQUIDITY AND CAPITAL RESOURCES
OPERATING ACTIVITIES

| For the three months | ||||||||||||
| ended September 30, | ||||||||||||
| 2023 | 2022 | Change | ||||||||||
| Net income | $ | 417 | $ | 296 | ||||||||
| Items not involving current cash flows | 404 | 295 | ||||||||||
| 821 | 591 | $ | 230 | |||||||||
| Changes in operating assets and liabilities | (24 | ) | (353 | ) | 329 | |||||||
| Cash provided from operating activities | $ | 797 | $ | 238 | $ | 559 | ||||||
Cash provided from operating activities
Comparing the third quarter of 2023 to 2022, cash provided from operating activities increased $559 million primarily as a result of:
| · | a $1.99 billion increase in cash received from customers; |
| · | a $136 million decrease in cash taxes; and |
| · | higher dividends received from equity investments of $28 million. |
These factors were partially offset by:
| · | a $1.25 billion increase in cash paid for materials and overhead; |
| · | a $305 million increase in cash paid for labour; and |
| · | a $45 million increase in cash interest paid. |
Changes in operating assets and liabilities
During the third quarter of 2023, we used $24 million for operating assets and liabilities primarily consisting of:
| · | a $130 million increase in production inventory due to a combination of volume increases, the UAW labour strike and safety stock builds; |
| · | a $105 million increase in tooling investment for current and upcoming program launches; and |
| · | a $14 million decrease in other accrued liabilities. |
These uses of cash were partially offset by:
| · | a $66 million decrease in cash taxes paid; |
| · | a $60 million increase in accrued wages and salaries, primarily related to bonuses and profit sharing that are paid annually; |
| · | a $40 million increase in accounts payable; |
| · | a $35 million decrease in production and other receivables; and |
| · | a $25 million decrease in prepaids and other. |
16 Magna International Inc. Third Quarter Report 2023
INVESTING ACTIVITIES
| For the three months ended September 30, | ||||||||||||
| 2023 | 2022 | Change | ||||||||||
| Fixed asset additions | $ | (630 | ) | $ | (364 | ) | ||||||
| Increase in public and private equity investments | (7 | ) | (25 | ) | ||||||||
| Increase in investments, other assets and intangible assets | (176 | ) | (125 | ) | ||||||||
| Fixed assets, investments, other assets and intangible assets additions | (813 | ) | (514 | ) | ||||||||
| Net cash (outflow) inflow from disposal of facilities | (23 | ) | — | |||||||||
| Proceeds from dispositions | 32 | 41 | ||||||||||
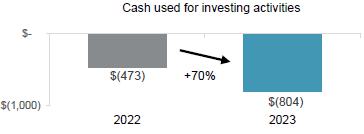
| Cash used for investing activities | $ | (804 | ) | $ | (473 | ) | $ | (331 | ) | |||
Cash used for investing activities in the third quarter of 2023 was $331 million higher compared to the third quarter of 2022. The change between the third quarter of 2023 and the third quarter of 2022 was primarily a result of increased capital spending related to future program launches as well as increased other asset spending related to capitalized tooling and engineering.
During the third quarter of 2023, we completed the sale of all of our investments in Russia resulting in a net cash outflow of $23 million.
FINANCING ACTIVITIES
| For the three months ended September 30, | ||||||||||||
| 2023 | 2022 | Change | ||||||||||
| Increase in short-term borrowings | $ | (145 | ) | $ | 2 | |||||||
| Dividends | (128 | ) | (125 | ) | ||||||||
| Dividends paid to non-controlling interests | (18 | ) | (10 | ) | ||||||||
| Repayments of debt | (14 | ) | (26 | ) | ||||||||
| Repurchase of Commons Shares | — | (180 | ) | |||||||||
| Issue of Common Shares on exercise of stock options | 8 | 1 | ||||||||||
| Issues of debt | 24 | 14 | ||||||||||
| Cash used for financing activities | $ | (273 | ) | $ | (324 | ) | $ | 51 | ||||
Short-term borrowings decreased $145 million in third quarter of 2023 primarily due to the repayment of $150 million in Commercial Paper.
Cash dividends paid per Common Share were $0.46 for the third quarter of 2023 compared to $0.45 for the third quarter of 2022.
| Magna International Inc. Third Quarter Report 2023 | 17 |
FINANCING RESOURCES
| As at September 30, 2023 | As at December 31, 2022 | Change | ||||||||||
| Liabilities | ||||||||||||
| Short-term borrowings | $ | 2 | $ | 8 | ||||||||
| Long-term debt due within one year | 1,398 | 654 | ||||||||||
| Current portion of operating lease liabilities | 384 | 276 | ||||||||||
| Long-term debt | 4,135 | 2,847 | ||||||||||
| Operating lease liabilities | 1,289 | 1,288 | ||||||||||
| $ | 7,208 | $ | 5,073 | $ | 2,135 | |||||||
Financial liabilities increased $2.14 billion to $7.21 billion as at September 30, 2023 primarily as a result of the $1.64 billion issuance of Senior Notes during the first quarter of 2023 and the $400 million increase in the Term Loan.
CASH RESOURCES
In the third quarter of 2023, our cash resources decreased by $0.3 billion to $1.0 billion, primarily as a result of cash used for investing and financing activities partially offset by cash provided from operating activities, as discussed above. In addition to our cash resources at September 30, 2023, we had term and operating lines of credit totaling $4.1 billion, of which $3.5 billion was unused and available.
On March 6, 2023, we entered into a Term Loan with a 3-year tranche of $800 million and a 5-year tranche of $600 million. During the second quarter of 2023, we drew $100 million from the 3-yr tranche and $300 million from the 5-year tranche. The remaining balance of the facility was subsequently cancelled.
On April 27, 2023, we amended our $2.7 billion syndicated revolving credit facility, including to: (i) extend the maturity date from June 24, 2027 to June 24, 2028, and (ii) cancel the $150 million Asian tranche and allocate the equivalent amount to the Canadian tranche. As of September, 30, 2023, we have had limited borrowing under this credit facility.
On May 26, 2023, we extended the maturity date of our $800 million 364-day syndicated revolving credit facility from June 24, 2023 to June 24, 2024. As of September 30, 2023, we have not borrowed any funds under this credit facility.
MAXIMUM NUMBER OF SHARES ISSUABLE
The following table presents the maximum number of shares that would be outstanding if all of the outstanding options at November 2, 2023 were exercised:
| Common Shares | 286,361,423 | |||
| Stock options (i) | 6,132,439 | |||
| 292,493,862 |
| (i) | Options to purchase Common Shares are exercisable by the holder in accordance with the vesting provisions and upon payment of the exercise price as may be determined from time to time pursuant to our stock option plans. |
CONTRACTUAL OBLIGATIONS
During the second quarter of 2023, we acquired Veoneer AS. Other than the addition of Veoneer AS operations, there have been no material changes with respect to the contractual obligations requiring annual payments during the third quarter of 2023 that are outside the ordinary course of our business. Refer to our MD&A included in our 2022 Annual Report.
| 18 | Magna International Inc. Third Quarter Report 2023 |
RESULTS OF OPERATIONS – FOR THE NINE MONTHS ENDED SEPTEMBER 30, 2023
| For the nine months ended September 30, | ||||||||||||||||||||||||
| Sales | Adjusted EBIT | |||||||||||||||||||||||
| 2023 | 2022 | Change | 2023 | 2022 | Change | |||||||||||||||||||
| Body Exteriors & Structures | $ | 13,333 | $ | 12,000 | $ | 1,333 | $ | 1,024 | $ | 652 | $ | 372 | ||||||||||||
| Power & Vision | 10,530 | 8,845 | 1,685 | 437 | 386 | 51 | ||||||||||||||||||
| Seating Systems | 4,618 | 3,924 | 694 | 174 | 90 | 84 | ||||||||||||||||||
| Complete Vehicles | 4,337 | 3,891 | 446 | 81 | 178 | (97 | ) | |||||||||||||||||
| Corporate and Other | (475 | ) | (388 | ) | (87 | ) | (36 | ) | 35 | (71 | ) | |||||||||||||
| Total reportable segments | $ | 32,343 | $ | 28,272 | $ | 4,071 | $ | 1,680 | $ | 1,341 | $ | 339 | ||||||||||||
BODY EXTERIORS & STRUCTURES
| For the nine months ended September 30, | ||||||||||||||||
| 2023 | 2022 | Change | ||||||||||||||
| Sales | $ | 13,333 | $ | 12,000 | $ | 1,333 | + | 11 | % | |||||||
| Adjusted EBIT | $ | 1,024 | $ | 652 | $ | 372 | + | 57 | % | |||||||
| Adjusted EBIT as a percentage of sales | 7.7 | % | 5.4 | % | + | 2.3 | % | |||||||||
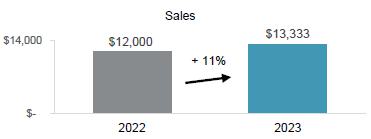
Sales – Body Exteriors & Structures
Sales increased 11% or $1.33 billion to $13.33 billion for the nine months ended September 30, 2023 compared to $12.00 billion for the nine months ended September 30, 2022, primarily due to:
| · | the launch of programs during or subsequent to the first nine months of 2022, including the: |
| · | Jeep Grand Cherokee; | |
| · | Rivian R1T & R1S; | |
| · | Honda CR-V; and | |
| · | Ford F-Series Super Duty; |
| · | higher global light vehicle production; and | |
| · | customer price increases to recover certain higher production input costs. |
These factors were partially offset by:
| · | the net weakening of foreign currencies against the U.S. dollar, which decreased reported U.S. dollar sales by $148 million; | |
| · | lower sales as a result of the substantial idling of our Russian facilities; and | |
| · | net customer price concessions subsequent to the first nine months of 2022. |
| Magna International Inc. Third Quarter Report 2023 | 19 |
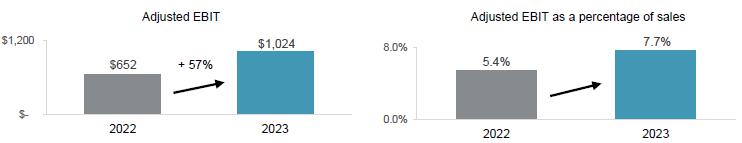
Adjusted EBIT and Adjusted EBIT as a percentage of sales – Body Exteriors & Structures
Adjusted EBIT increased $372 million to $1,024 million for the nine months ended September 30, 2023 compared to $652 million for the nine months ended September 30, 2022 and Adjusted EBIT as a percentage of sales increased to 7.7% from 5.4%. These increases were primarily as a result of earnings on higher sales including higher margins due to the impact of operational excellence and cost initiatives. Other factors positively impacting Adjusted EBIT and Adjusted EBIT as a percentage of sales include:
| · | higher customer recoveries net of production input costs, including for energy, partially offset by higher prices for labour and commodities; | |
| · | commercial items in the first nine months of 2023 and 2022, which had a net favourable impact on a year over year basis; and | |
| · | productivity and efficiency improvements, including lower costs at certain previously underperforming facilities. |
These factors were partially offset by:
| · | higher pre-operating costs incurred at new facilities; | |
| · | higher launch costs; and | |
| · | the net weakening of foreign currencies against the U.S. dollar, which had a $20 million unfavourable impact on reported U.S. dollar Adjusted EBIT. |
POWER & VISION
| For the nine months ended September 30, | ||||||||||||||||
| 2023 | 2022 | Change | ||||||||||||||
| Sales | $ | 10,530 | $ | 8,845 | $ | 1,685 | + | 19 | % | |||||||
| Adjusted EBIT | $ | 437 | $ | 386 | $ | 51 | + | 13 | % | |||||||
| Adjusted EBIT as a percentage of sales | 4.2 | % | 4.4 | % | - | 0.2 | % | |||||||||
| 20 Magna International Inc. Third Quarter Report 2023 |
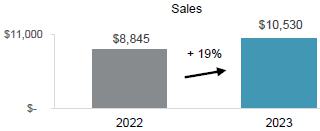
Sales – Power & Vision
Sales increased 19% or $1.69 billion to $10.53 billion for the nine months ended September 30, 2023 compared to $8.85 billion for the nine months ended September 30, 2022, primarily due to:
| · | the launch of programs during or subsequent to the first nine months of 2022, including the: |
| · | BMW X1 & iX1; | |
| · | Chery Arrizo 8; | |
| · | Chery Tiggo 9; and | |
| · | Fisker Ocean; |
| · | acquisitions, net of divestitures, subsequent to the first nine months of 2022, which increased sales by $447 million; | |
| · | higher global light vehicle production; and | |
| · | customer price increases to recover certain higher production input costs. |
These factors were partially offset by the net weakening of foreign currencies against the U.S. dollar, which decreased reported U.S. dollar sales by $106 million and net customer price concessions subsequent to the first nine months of 2022.
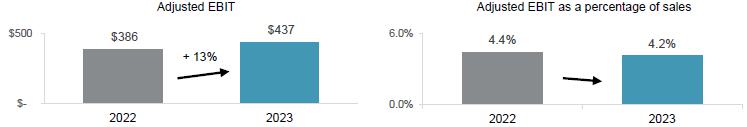
Adjusted EBIT and Adjusted EBIT as a percentage of sales – Power & Vision
Adjusted EBIT increased $51 million to $437 million for the nine months ended September 30, 2023 compared to $386 million for the nine months ended September 30, 2022 while Adjusted EBIT as a percentage of sales decreased to 4.2% from 4.4%.
Adjusted EBIT was higher primarily as a result of earnings on higher sales including higher margins due the impact of operational excellence and cost initiatives. Excluding this factor, Adjusted EBIT and Adjusted EBIT as a percentage of sales were lower primarily due to:
| · | commercial items in the first nine months of 2023 and 2022, which had a net unfavourable impact on a year over year basis; | |
| · | acquisitions, net of divestitures, subsequent to the first nine months of 2022; | |
| · | the net weakening of foreign currencies against the U.S. dollar, which had a $20 million unfavourable impact on reported U.S. dollar Adjusted EBIT; | |
| · | higher net engineering costs including spending related to our electrification and active safety businesses; and | |
| · | higher net warranty costs of $9 million. |
These factors were partially offset by:
| · | higher equity income; and | |
| · | higher customer recoveries net of production input costs, including for commodities, energy, and freight, partially offset by higher prices for labour. |
| Magna International Inc. Third Quarter Report 2023 21 |
SEATING SYSTEMS
| For the nine months ended September 30, | ||||||||||||||||
| 2023 | 2022 | Change | ||||||||||||||
| Sales | $ | 4,618 | $ | 3,924 | $ | 694 | + | 18 | % | |||||||
| Adjusted EBIT | $ | 174 | $ | 90 | $ | 84 | + | 93 | % | |||||||
| Adjusted EBIT as a percentage of sales | 3.8 | % | 2.3 | % | + | 1.5 | % | |||||||||

Sales – Seating Systems
Sales increased 18% or $694 million to $4.62 billion for the nine months ended September 30, 2023 compared to $3.92 billion for the nine months ended September 30, 2022, primarily due to:
| · | the launch of programs during or subsequent to the first nine months of 2022, including the: |
| · | Nissan Frontier; | |
| · | Jeep Grand Cherokee; | |
| · | Changan Oshan Z6; and | |
| · | BMW XM; |
| · | higher global light vehicle production; and | |
| · | customer price increases to recover certain higher production input costs. |
These factors were partially offset by the net weakening of foreign currencies against the U.S. dollar, which decreased reported U.S. dollar sales by $62 million and net customer price concessions subsequent to the first nine months of 2022.
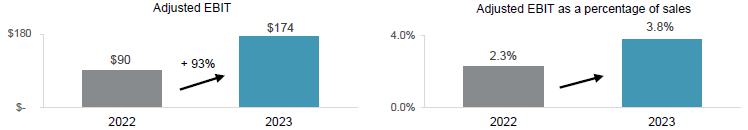
Adjusted EBIT and Adjusted EBIT as a percentage of sales – Seating Systems
Adjusted EBIT increased $84 million to $174 million for the nine months ended September 30, 2023 compared to $90 million for the nine months ended September 30, 2022 and Adjusted EBIT as a percentage of sales increased to 3.8% from 2.3%. These increases were substantially as a result of earnings on higher sales. Other factors positively impacting Adjusted EBIT and Adjusted EBIT as a percentage of sales include:
| · | productivity and efficiency improvements, including lower costs at certain previously underperforming facilities; and | |
| · | commercial items in the first nine months of 2023 and 2022, which had a net favourable impact on a year over year basis; |
These factors were partially offset by:
| · | higher launch costs; and | |
| · | the net weakening of foreign currencies against the U.S. dollar, which had a $5 million unfavourable impact on reported U.S. dollar Adjusted EBIT. |
| 22 Magna International Inc. Third Quarter Report 2023 |
COMPLETE VEHICLES
| For the nine months | ||||||||||||||||
| ended September 30, | ||||||||||||||||
| 2023 | 2022 | Change | ||||||||||||||
| Complete Vehicle Assembly Volumes (thousands of units)(i) | 83.7 | 83.6 | + | 0.1 | — | |||||||||||
| Sales | $ | 4,337 | $ | 3,891 | $ | 446 | + | 11 | % | |||||||
| Adjusted EBIT | $ | 81 | $ | 178 | $ | (97 | ) | - | 54 | % | ||||||
| Adjusted EBIT as a percentage of sales | 1.9 | % | 4.6 | % | - | 2.7 | % | |||||||||
| (i) | Vehicles produced at our Complete Vehicle operations are included in Europe Light Vehicle Production volumes. |
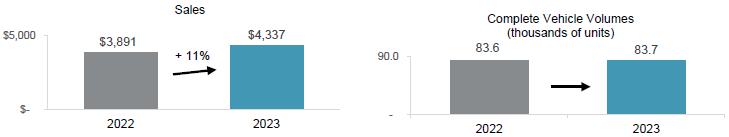
Sales – Complete Vehicles
Sales increased 11% or $446 million to $4.34 billion for the nine months ended September 30, 2023 compared to $3.89 billion for the nine months ended September 30, 2022. The increase in sales is primarily a result of favourable program mix, and a $46 million increase in reported U.S. dollar sales as a result of the strengthening of the euro against the U.S. dollar.
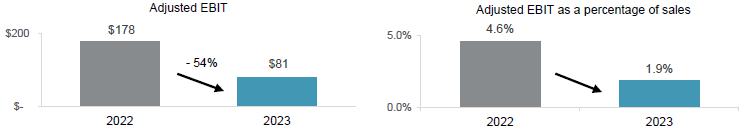
Adjusted EBIT and Adjusted EBIT as a percentage of sales – Complete Vehicles
Adjusted EBIT decreased $97 million to $81 million for the nine months ended September 30, 2023 compared to $178 million for the nine months ended September 30, 2022 and Adjusted EBIT as a percentage of sales decreased to 1.9% from 4.6%. These decreases were primarily due to:
| · | higher launch, engineering and other costs associated with the launch of new assembly business; |
| · | commercial items in first nine months of 2023 and 2022, which had a net unfavourable impact on a year over year basis; and |
| · | the net weakening of foreign currencies against the euro, which had a $5 million unfavourable impact on reported U.S. dollar Adjusted EBIT. |
These factors were partially offset by earnings on higher sales and favourable program mix, net of contractual fixed cost recoveries on certain programs.
| Magna International Inc. Third Quarter Report 2023 23 |
CORPORATE AND OTHER
Adjusted EBIT was a loss of $36 million for the nine months ended September 30, 2023 compared to income of $35 million for the nine months ended September 30, 2022. The $71 million decrease was primarily the result of:
| · | lower amortization related to the initial value of public company securities; | |
| · | higher incentive compensation; | |
| · | higher investments in research, development and new mobility; | |
| · | higher labour and benefit costs; and | |
| · | higher costs to accelerate our operational excellence initiatives. |
These factors were partially offset by:
| · | an increase in fees received from our divisions; and | |
| · | net transactional foreign exchange gains in the first nine months of 2023 compared to net transactional foreign exchange losses in the first nine months of 2022. |
NON-GAAP PERFORMANCE MEASURES - FOR THE NINE MONTHS ENDED SEPTEMBER 30, 2023
ADJUSTED EBIT AS A PERCENTAGE OF SALES
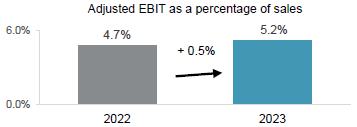
The table below shows the change in Magna's Sales and Adjusted EBIT by segment and the impact each segment's changes have on Magna's Adjusted EBIT as a percentage of sales for the nine months ended September 30, 2023 compared to the nine months ended September 30, 2022:
| Sales | Adjusted EBIT | Adjusted
EBIT as a percentage of sales | ||||||||||
| Nine months ended September 30, 2022 | $ | 28,272 | $ | 1,341 | 4.7 | % | ||||||
| Increase (decrease) related to: | ||||||||||||
| Body Exteriors & Structures | 1,333 | 372 | + | 1.0 | % | |||||||
| Power & Vision | 1,685 | 51 | - | 0.1 | % | |||||||
| Seating Systems | 694 | 84 | + | 0.2 | % | |||||||
| Complete Vehicles | 446 | (97 | ) | - | 0.4 | % | ||||||
| Corporate and Other | (87 | ) | (71 | ) | - | 0.2 | % | |||||
| Nine months ended September 30, 2023 | $ | 32,343 | $ | 1,680 | 5.2 | % |
Adjusted EBIT as a percentage of sales increased to 5.2% for the nine months ended September 30, 2023 compared to 4.7% for the nine months ended September 30, 2022 primarily due to:
| · | earnings on higher sales; | |
| · | higher customer recoveries net of production input costs, including for energy, commodities and freight, partially offset by higher prices for labour; | |
| · | productivity and efficiency improvements, including lower costs at certain previously underperforming facilities; and | |
| · | higher equity income. |
These factors were partially offset by:
| · | acquisitions, net of divestitures, subsequent to the first nine months of 2022; | |
| · | commercial items in the first nine months of 2023 and 2022, which had a net unfavourable impact on a year over year basis; | |
| · | higher launch, engineering and other costs associated with the launch of new assembly business; | |
| · | lower amortization related to the initial value of public company securities; | |
| · | higher launch costs; and | |
| · | higher pre-operating costs incurred at new facilities. |
| 24 Magna International Inc. Third Quarter Report 2023 |
ADJUSTED RETURN ON INVESTED CAPITAL AND RETURN ON INVESTED CAPITAL
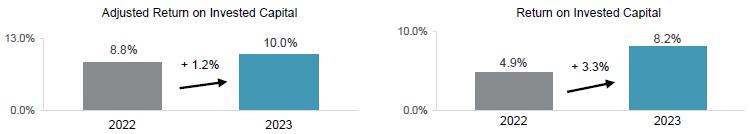
Adjusted Return on Invested Capital increased to 10.0% for the nine months ended September 30, 2023 compared to 8.8% for the nine months ended September 30, 2022 as a result of an increase in Adjusted After-tax operating profits partially offset by higher Average Invested Capital. Other (income) expense, net, after tax, Amortization of acquired intangible assets, after tax and Adjustments to Deferred Tax Valuation Allowances negatively impacted Return on Invested Capital by 1.8% in the first nine months of 2023 and by 3.9% in the first nine months of 2022.
Average Invested Capital increased $1.58 billion to $17.48 billion for the nine months ended September 30, 2023 compared to $15.90 billion for the nine months ended September 30, 2022, primarily due to:
| · | acquisitions, net of divestitures, during and subsequent to the first nine months of 2022; | |
| · | average investment in fixed assets in excess of our average depreciation expense on fixed assets; and | |
| · | an increase in average operating assets and liabilities. |
These factors were partially offset by:
| · | the net weakening of foreign currencies against the U.S. dollar; | |
| · | the impairment of our Russian assets recorded during the second quarter of 2022; and | |
| · | lower net investments. |
| Magna International Inc. Third Quarter Report 2023 25 |
NON-GAAP FINANCIAL MEASURES RECONCILIATION
Effective July 1, 2023, we revised our calculations of Adjusted EBIT, Adjusted diluted earnings per share and Adjusted Return on Invested Capital to exclude the amortization of acquired intangible assets. Revenue generated from acquired intangible assets is included within revenue in determining net income attributable to Magna. We believe that excluding the amortization of acquired intangible assets from these Non-GAAP measures helps management and investors in understanding our underlying performance and improves comparability between our segmented results of operations and our peers.
The historical presentation of these Non-GAAP measures within this MD&A has also been updated to reflect the revised calculations.
The reconciliation of Non-GAAP financial measures is as follows:
ADJUSTED EBIT
| For the
three months ended September 30, | For the
nine months ended September 30, | |||||||||||||||
| 2023 | 2022 | 2023 | 2022 | |||||||||||||
| Net income | $ | 417 | $ | 296 | $ | 988 | $ | 530 | ||||||||
| Add: | ||||||||||||||||
| Amortization of acquired intangible assets | 32 | 11 | 57 | 35 | ||||||||||||
| Interest expense, net | 49 | 18 | 103 | 64 | ||||||||||||
| Other (income) expense, net | (4 | ) | 23 | 224 | 510 | |||||||||||
| Income taxes | 121 | 104 | 308 | 202 | ||||||||||||
| Adjusted EBIT | $ | 615 | $ | 452 | $ | 1,680 | $ | 1,341 | ||||||||
ADJUSTED EBIT AS A PERCENTAGE OF SALES
| For the three months | For the nine months | |||||||||||||||
| ended September 30, | ended September 30, | |||||||||||||||
| 2023 | 2022 | 2023 | 2022 | |||||||||||||
| Sales | $ | 10,688 | $ | 9,268 | $ | 32,343 | $ | 28,272 | ||||||||
| Adjusted EBIT | $ | 615 | $ | 452 | $ | 1,680 | $ | 1,341 | ||||||||
| Adjusted EBIT as a percentage of sales | 5.8 | % | 4.9 | % | 5.2 | % | 4.7 | % | ||||||||
ADJUSTED DILUTED EARNINGS PER SHARE
| For the three months ended September 30, | For the nine
months ended September 30, | |||||||||||||||
| 2023 | 2022 | 2023 | 2022 | |||||||||||||
| Net income attributable to Magna International Inc. | $ | 394 | $ | 289 | $ | 942 | $ | 497 | ||||||||
| Add (deduct): | ||||||||||||||||
| Amortization of acquired intangible assets | 32 | 11 | 57 | 35 | ||||||||||||
| Other (income) expense, net | (4 | ) | 23 | 224 | 510 | |||||||||||
| Tax effect on Amortization of acquired intangible assets and Other (income) expense, net | (3 | ) | (6 | ) | (34 | ) | (50 | ) | ||||||||
| Adjustments to Deferred Tax Valuation Allowances | — | — | — | (29 | ) | |||||||||||
| Adjusted net income attributable to Magna International Inc. | 419 | 317 | 1,189 | 963 | ||||||||||||
| Diluted weighted average number of Common Shares outstanding during the period (millions) | 286.8 | 288.5 | 286.6 | 292.8 | ||||||||||||
| Adjusted diluted earnings per share | $ | 1.46 | $ | 1.10 | $ | 4.15 | $ | 3.29 | ||||||||
| 26 Magna International Inc. Third Quarter Report 2023 |
RETURN ON INVESTED CAPITAL AND ADJUSTED RETURN ON INVESTED CAPITAL
Return on Invested Capital is calculated as After-tax operating profits divided by Average Invested Capital for the period. Adjusted Return on Invested Capital is calculated as Adjusted After-tax operating profits divided by Average Invested Capital for the period. Average Invested Capital for the three month period is averaged on a two-fiscal quarter basis and for the nine month period is averaged on a four-fiscal quarter basis.
| For the three months | For the nine months | |||||||||||||||
| ended September 30, | ended September 30, | |||||||||||||||
| 2023 | 2022 | 2023 | 2022 | |||||||||||||
| Net income | $ | 417 | $ | 296 | $ | 988 | $ | 530 | ||||||||
| Add (deduct): | ||||||||||||||||
| Interest expense, net | 49 | 18 | 103 | 64 | ||||||||||||
| Income taxes on interest expense, net at Magna's effective income tax rate: | (11 | ) | (5 | ) | (22 | ) | (14 | ) | ||||||||
| After-tax operating profits | 455 | 309 | 1,069 | 580 | ||||||||||||
| Amortization of acquired intangible assets | 32 | 11 | 57 | 35 | ||||||||||||
| Other (income) expense, net | (4 | ) | 23 | 224 | 510 | |||||||||||
| Tax effect on Amortization of acquired intangible assets and Other (income) expense, net | (3 | ) | (6 | ) | (34 | ) | (50 | ) | ||||||||
| Adjustments to Deferred Tax Valuation Allowances | — | — | — | (29 | ) | |||||||||||
| Adjusted After-tax operating profits | $ | 480 | $ | 337 | $ | 1,316 | $ | 1,046 | ||||||||
| As at September 30, | ||||||||
| 2023 | 2022 | |||||||
| Total Assets | $ | 31,675 | $ | 26,667 | ||||
| Excluding: | ||||||||
| Cash and cash equivalents | (1,022 | ) | (1,102 | ) | ||||
| Deferred tax assets | (527 | ) | (488 | ) | ||||
| Less Current Liabilities | (13,165 | ) | (9,878 | ) | ||||
| Excluding: | ||||||||
| Short-term borrowing | 2 | — | ||||||
| Long-term debt due within one year | 1,398 | 95 | ||||||
| Current portion of operating lease liabilities | 384 | 266 | ||||||
| Invested Capital | $ | 18,745 | $ | 15,560 | ||||
| For the three months | For the nine months | |||||||||||||||
| ended September 30, | ended September 30, | |||||||||||||||
| 2023 | 2022 | 2023 | 2022 | |||||||||||||
| After-tax operating profits | $ | 455 | $ | 309 | $ | 1,069 | $ | 580 | ||||||||
| Average Invested Capital | $ | 18,644 | $ | 15,624 | $ | 17,481 | $ | 15,904 | ||||||||
| Return on Invested Capital | 9.8 | % | 7.9 | % | 8.2 | % | 4.9 | % | ||||||||
| For the three months | For the nine months | |||||||||||||||
| ended September 30, | ended September 30, | |||||||||||||||
| 2023 | 2022 | 2023 | 2022 | |||||||||||||
| Adjusted After-tax operating profits | $ | 480 | $ | 337 | $ | 1,316 | $ | 1,046 | ||||||||
| Average Invested Capital | $ | 18,644 | $ | 15,624 | $ | 17,481 | $ | 15,904 | ||||||||
| Adjusted Return on Invested Capital | 10.3 | % | 8.6 | % | 10.0 | % | 8.8 | % | ||||||||
| Magna International Inc. Third Quarter Report 2023 27 |
COMMITMENTS AND CONTINGENCIES
From time to time, we may be contingently liable for litigation, legal and/or regulatory actions and proceedings and other claims. Refer to Note 13, "Contingencies" of our unaudited interim consolidated financial statements for the three and nine months ended September 30, 2023, which describes these claims.
For a discussion of risk factors relating to legal and other claims/actions against us, refer to "Item 5. Risk Factors" in our AIF and Form 40-F, each in respect of the year ended December 31, 2022.
CONTROLS AND PROCEDURES
During the second quarter of 2023, we acquired Veoneer AS. Other than the addition of Veoneer AS operations to our internal control over financial reporting and any related changes in controls to integrate Veoneer AS, there have been no changes in our internal control over financial reporting that occurred during the three months ended September 30, 2023, that have materially affected or are reasonably likely to materially affect, our internal control over financial reporting.
| 28 Magna International Inc. Third Quarter Report 2023 |
FORWARD-LOOKING STATEMENTS
Certain statements in this MD&A may constitute "forward-looking information" or "forward-looking statements" (collectively, "forward-looking statements"). Any such forward-looking statements are intended to provide information about management's current expectations and plans and may not be appropriate for other purposes. Forward-looking statements may include financial and other projections, as well as statements regarding our future plans, strategic objectives or economic performance, or the assumptions underlying any of the foregoing, and other statements that are not recitations of historical fact. We use words such as "may", "would", "could", "should", "will", "likely", "expect", "anticipate", "believe", "intend", "plan", "aim", "forecast", "outlook", "project", "estimate", "target" and similar expressions suggesting future outcomes or events to identify forward-looking statements.
Forward-looking statements are based on information currently available to us, and are based on assumptions and analyses made by us in light of our experience and our perception of historical trends, current conditions and expected future developments, as well as other factors we believe are appropriate in the circumstances. While we believe we have a reasonable basis for making any such forward-looking statements, they are not a guarantee of future performance or outcomes. Whether actual results and developments conform to our expectations and predictions is subject to a number of risks, assumptions and uncertainties, many of which are beyond our control, and the effects of which can be difficult to predict, including, without limitation:
Macroeconomic, Geopolitical and Other Risks
| ● | inflationary pressures; |
| ● | interest rate levels; |
Risks Related to the Automotive Industry
| ● | economic cyclicality; |
| ● | regional production volume declines; |
| ● | intense competition; |
| ● | deteriorating vehicle affordability; |
| ● | potential consumer hesitancy with respect to Electric Vehicles ("EVs"); |
Strategic Risks
| ● | alignment of our product mix with the "Car of the Future"; |
| ● | our ability to consistently develop and commercialize innovative products or processes; |
| ● | our investments in mobility and technology companies; |
| ● | our changing business risk profile as a result of increased investment in electrification and autonomous/assisted driving, including: higher R&D and engineering costs, and challenges in quoting for profitable returns on products for which we may not have significant quoting experience; |
| ● | strategic and other risks related to the transition to electromobility; |
| ● | inability to achieve future investment returns that equal or exceed past returns; |
Customer-Related Risks
| ● | the impact of OEM production-related disruptions, including as a result of labour strikes; |
| ● | concentration of sales with six customers; |
| ● | inability to significantly grow our business with Asian customers; |
| ● | emergence of potentially disruptive EV OEMs, including risks related to limited revenues/operating history of new OEM entrants; |
| ● | OEM consolidation and cooperation; |
| ● | evolving counterparty risk profile; |
| ● | shifts in market shares among vehicles or vehicle segments; |
| ● | shifts in consumer "take rates" for products we sell; |
| ● | dependence on outsourcing; |
| ● | quarterly sales fluctuations; |
| ● | potential loss of any material purchase orders; |
Supply Chain Risks
| ● | a deterioration of the financial condition of our supply base; |
| ● | supply disruptions and applicable costs related to supply disruption mitigation initiatives, including with respect to semiconductor chips; |
| ● | regional energy shortages/disruptions and pricing; |
IT Security/Cybersecurity Risks
| ● | IT/Cybersecurity breach; |
| ● | Product cybersecurity breach; |
Pricing Risks
| ● | pricing risks following time of quote or award of new business; |
| ● | price concessions; |
| ● | commodity cost volatility; |
| ● | declines in scrap steel/aluminum prices; |
Warranty/Recall Risks
| ● | costs related to repair or replace defective products, including due to a recall; |
| ● | warranty or recall costs that exceed warranty provision or insurance coverage limits; |
| ● | product liability claims; |
Acquisition Risks
| ● | competition for strategic acquisition targets; |
| ● | inherent merger and acquisition risks; |
| ● | acquisition integration risk; |
Other Business Risks
| ● | risks related to conducting business through joint ventures; |
| ● | transition and physical risks related to climate change; |
| ● | intellectual property risks; |
| ● | risks of conducting business in foreign markets; |
| ● | fluctuations in relative currency values; |
| ● | tax risks; |
| ● | reduced financial flexibility as a result of an economic shock; |
| ● | changes in credit ratings assigned to us; |
| ● | the unpredictability of, and fluctuation in, the trading price of our Common Shares; |
| Magna International Inc. Third Quarter Report 2023 29 |
Manufacturing/Operational Risks
| ● | product and new facility launch risks; |
| ● | operational underperformance; |
| ● | restructuring costs; |
| ● | impairment charges; |
| ● | labour disruptions; |
| ● | skilled labour attraction/retention; |
| ● | risks related to COVID-19; |
| ● | leadership expertise and succession; |
Legal, Regulatory and Other Risks
| ● | antitrust risk; |
| ● | legal claims and/or regulatory actions against us; |
| ● | changes in laws and regulations, including those related to vehicle emissions, taxation or supply chain due diligence; |
| ● | potential restrictions on free trade; and |
| ● | trade disputes/tariffs; |
In evaluating forward-looking statements, we caution readers not to place undue reliance on any forward-looking statement. Additionally, readers should specifically consider the various factors which could cause actual events or results to differ materially from those indicated by such forward-looking statements, including the risks, assumptions and uncertainties above which are:
| ● | discussed under the "Industry Trends and Risks" heading of our Management's Discussion and Analysis; and |
| ● | set out in our revised Annual Information Form filed with securities commissions in Canada, our annual report on Form 40-F / 40-F/A filed with the United States Securities and Exchange Commission, and subsequent filings. |
Readers should also consider discussion of our risk mitigation activities with respect to certain risk factors, which can also be found in our Annual Information Form. Additional information about Magna, including our Annual Information Form, is available through the System for Electronic Data Analysis and Retrieval+ (SEDAR+) at www.sedarplus.com.
| 30 Magna International Inc. Third Quarter Report 2023 |
MAGNA INTERNATIONAL INC.
CONSOLIDATED STATEMENTS OF INCOME
[Unaudited]
[U.S. dollars in millions, except per share figures]
| Three months ended | Nine months ended | |||||||||||||||||
| September 30, | September 30, | |||||||||||||||||
| Note | 2023 | 2022 | 2023 | 2022 | ||||||||||||||
| Sales | 16 | $ | 10,688 | $ | 9,268 | $ | 32,343 | $ | 28,272 | |||||||||
| Costs and expenses | ||||||||||||||||||
| Cost of goods sold | 9,264 | 8,126 | 28,224 | 24,785 | ||||||||||||||
| Depreciation | 358 | 330 | 1,064 | 1,035 | ||||||||||||||
| Amortization of acquired intangible assets | 32 | 11 | 57 | 35 | ||||||||||||||
| Selling, general and administrative | 491 | 387 | 1,484 | 1,183 | ||||||||||||||
| Interest expense, net | 49 | 18 | 103 | 64 | ||||||||||||||
| Equity income | (40 | ) | (27 | ) | (109 | ) | (72 | ) | ||||||||||
| Other (income) expense, net | 2 | (4 | ) | 23 | 224 | 510 | ||||||||||||
| Income from operations before income taxes | 538 | 400 | 1,296 | 732 | ||||||||||||||
| Income taxes | 11 | 121 | 104 | 308 | 202 | |||||||||||||
| Net income | 417 | 296 | 988 | 530 | ||||||||||||||
| Income attributable to non-controlling interests | (23 | ) | (7 | ) | (46 | ) | (33 | ) | ||||||||||
| Net income attributable to Magna International Inc. | $ | 394 | $ | 289 | $ | 942 | $ | 497 | ||||||||||
| Earnings per Common Share: | 3 | |||||||||||||||||
| Basic | $ | 1.37 | $ | 1.01 | $ | 3.29 | $ | 1.70 | ||||||||||
| Diluted | $ | 1.37 | $ | 1.00 | $ | 3.29 | $ | 1.70 | ||||||||||
| Cash dividends paid per Common Share | $ | 0.46 | $ | 0.45 | $ | 1.38 | $ | 1.35 | ||||||||||
| Weighted average number of Common Shares outstanding during the period [in millions]: | 3 | |||||||||||||||||
| Basic | 286.3 | 287.9 | 286.1 | 291.9 | ||||||||||||||
| Diluted | 286.8 | 288.5 | 286.6 | 292.8 | ||||||||||||||
See accompanying notes
| Magna International Inc. Third Quarter Report 2023 31 |
MAGNA INTERNATIONAL INC.
CONSOLIDATED STATEMENTS OF COMPREHENSIVE LOSS
[Unaudited]
[U.S. dollars in millions]
| Three months ended | Nine months ended | |||||||||||||||||
| September 30, | September 30, | |||||||||||||||||
| Note | 2023 | 2022 | 2023 | 2022 | ||||||||||||||
| Net income | $ | 417 | $ | 296 | $ | 988 | $ | 530 | ||||||||||
| Other comprehensive loss, net of tax: | 13 | |||||||||||||||||
| Net unrealized loss on translation of net investment in foreign operations | (153 | ) | (474 | ) | (187 | ) | (920 | ) | ||||||||||
| Net unrealized (loss) gain on cash flow hedges | (23 | ) | (56 | ) | 66 | (51 | ) | |||||||||||
| Reclassification of net gain on cash flow hedges to net income | (21 | ) | (6 | ) | (38 | ) | (25 | ) | ||||||||||
| Reclassification of net loss on pensions to net income | 1 | 2 | 2 | 4 | ||||||||||||||
| Pension and post retirement benefits | — | — | (4 | ) | 1 | |||||||||||||
| Reserve for cumulative translation losses | — | — | — | 203 | ||||||||||||||
| Other comprehensive loss | (196 | ) | (534 | ) | (161 | ) | (788 | ) | ||||||||||
| Comprehensive income (loss) | 221 | (238 | ) | 827 | (258 | ) | ||||||||||||
| Comprehensive (income) loss attributable to non-controlling interests | (21 | ) | 16 | (20 | ) | 14 | ||||||||||||
| Comprehensive income (loss) attributable to Magna International Inc. | $ | 200 | $ | (222 | ) | $ | 807 | $ | (244 | ) | ||||||||
See accompanying notes
| 32 Magna International Inc. Third Quarter Report 2023 |
MAGNA INTERNATIONAL INC.
CONSOLIDATED BALANCE SHEETS
[Unaudited]
[U.S. dollars in millions]
| As at | As at | |||||||||
| September 30, | December 31, | |||||||||
| Note | 2023 | 2022 | ||||||||
| ASSETS | ||||||||||
| Current assets | ||||||||||
| Cash and cash equivalents | 4 | $ | 1,022 | $ | 1,234 | |||||
| Accounts receivable | 8,477 | 6,791 | ||||||||
| Inventories | 6 | 4,751 | 4,180 | |||||||
| Prepaid expenses and other | 387 | 320 | ||||||||
| 14,637 | 12,525 | |||||||||
| Investments | 7 | 1,311 | 1,429 | |||||||
| Fixed assets, net | 8,778 | 8,173 | ||||||||
| Operating lease right-of-use assets | 1,696 | 1,595 | ||||||||
| Intangible assets, net | 779 | 452 | ||||||||
| Goodwill | 2,733 | 2,031 | ||||||||
| Deferred tax assets | 527 | 491 | ||||||||
| Other assets | 8 | 1,214 | 1,093 | |||||||
| $ | 31,675 | $ | 27,789 | |||||||
| LIABILITIES AND SHAREHOLDERS' EQUITY | ||||||||||
| Current liabilities | ||||||||||
| Short-term borrowing | $ | 2 | $ | 8 | ||||||
| Accounts payable | 7,911 | 6,999 | ||||||||
| Other accrued liabilities | 9 | 2,537 | 2,118 | |||||||
| Accrued salaries and wages | 900 | 850 | ||||||||
| Income taxes payable | 33 | 93 | ||||||||
| Long-term debt due within one year | 1,398 | 654 | ||||||||
| Current portion of operating lease liabilities | 384 | 276 | ||||||||
| 13,165 | 10,998 | |||||||||
| Long-term debt | 10 | 4,135 | 2,847 | |||||||
| Operating lease liabilities | 1,289 | 1,288 | ||||||||
| Long-term employee benefit liabilities | 564 | 548 | ||||||||
| Other long-term liabilities | 453 | 461 | ||||||||
| Deferred tax liabilities | 317 | 312 | ||||||||
| 19,923 | 16,454 | |||||||||
| Shareholders' equity | ||||||||||
| Capital stock | ||||||||||
| Common Shares | ||||||||||
| [issued: 286,361,423; December 31, 2022 – 285,931,816] | 12 | 3,333 | 3,299 | |||||||
| Contributed surplus | 123 | 111 | ||||||||
| Retained earnings | 9,173 | 8,639 | ||||||||
| Accumulated other comprehensive loss | 13 | (1,249 | ) | (1,114 | ) | |||||
| 11,380 | 10,935 | |||||||||
| Non-controlling interests | 372 | 400 | ||||||||
| 11,752 | 11,335 | |||||||||
| $ | 31,675 | $ | 27,789 | |||||||
See accompanying notes
| Magna International Inc. Third Quarter Report 2023 33 |
MAGNA INTERNATIONAL INC.
CONSOLIDATED STATEMENTS OF CASH FLOWS
[Unaudited]
[U.S. dollars in millions]
| Three months ended | Nine months ended | |||||||||||||||||
| September 30, | September 30, | |||||||||||||||||
| Note | 2023 | 2022 | 2023 | 2022 | ||||||||||||||
| Cash provided from (used for): | ||||||||||||||||||
| OPERATING ACTIVITIES | ||||||||||||||||||
| Net income | $ | 417 | $ | 296 | $ | 988 | $ | 530 | ||||||||||
| Items not involving current cash flows | 4 | 404 | 295 | 1,280 | 1,370 | |||||||||||||
| 821 | 591 | 2,268 | 1,900 | |||||||||||||||
| Changes in operating assets and liabilities | 4 | (24 | ) | (353 | ) | (697 | ) | (1,061 | ) | |||||||||
| Cash provided from operating activities | 797 | 238 | 1,571 | 839 | ||||||||||||||
| INVESTMENT ACTIVITIES | ||||||||||||||||||
| Acquisitions | — | — | (1,475 | ) | — | |||||||||||||
| Fixed asset additions | (630 | ) | (364 | ) | (1,556 | ) | (931 | ) | ||||||||||
| Increase in investments, other assets and intangible assets | (176 | ) | (125 | ) | (373 | ) | (269 | ) | ||||||||||
| Net cash (outflow) inflow from disposal of facilities | 2, 4 | (23 | ) | — | (48 | ) | 6 | |||||||||||
| Increase in public and private equity investments | (7 | ) | (25 | ) | (10 | ) | (29 | ) | ||||||||||
| Proceeds from dispositions | 32 | 41 | 95 | 104 | ||||||||||||||
| Cash used for investing activities | (804 | ) | (473 | ) | (3,367 | ) | (1,119 | ) | ||||||||||
| FINANCING ACTIVITIES | ||||||||||||||||||
| Issues of debt | 24 | 14 | 2,067 | 45 | ||||||||||||||
| (Decrease) increase in short-term borrowings | (145 | ) | 2 | (5 | ) | 3 | ||||||||||||
| Repayments of debt | (14 | ) | (26 | ) | (17 | ) | (417 | ) | ||||||||||
| Issue of Common Shares on exercise of stock options | 8 | 1 | 14 | 5 | ||||||||||||||
| Tax withholdings on vesting of equity awards | — | — | (10 | ) | (15 | ) | ||||||||||||
| Contributions to subsidiaries by non-controlling interests | — | — | — | 5 | ||||||||||||||
| Repurchase of Common Shares | 12 | — | (180 | ) | (11 | ) | (775 | ) | ||||||||||
| Dividends paid to non-controlling interests | (18 | ) | (10 | ) | (49 | ) | (22 | ) | ||||||||||
| Dividends | (128 | ) | (125 | ) | (389 | ) | (388 | ) | ||||||||||
| Cash (used for) provided from financing activities | (273 | ) | (324 | ) | 1,600 | (1,559 | ) | |||||||||||
| Effect of exchange rate changes on cash and cash equivalents | 21 | (3 | ) | (16 | ) | (7 | ) | |||||||||||
| Net decrease in cash, cash equivalents during the period | (259 | ) | (562 | ) | (212 | ) | (1,846 | ) | ||||||||||
| Cash and cash equivalents, beginning of period | 1,281 | 1,664 | 1,234 | 2,948 | ||||||||||||||
| Cash and cash equivalents, end of period | 4 | $ | 1,022 | $ | 1,102 | $ | 1,022 | $ | 1,102 | |||||||||
See accompanying notes
| 34 Magna International Inc. Third Quarter Report 2023 |
MAGNA INTERNATIONAL INC.
CONSOLIDATED STATEMENTS OF CHANGES IN EQUITY
[Unaudited]
[U.S. dollars in millions]
| Nine months ended September 30, 2023 | |||||||||||||||||||||||||||||||
| Common Shares | Non- | ||||||||||||||||||||||||||||||
| Stated | Contributed | Retained | controlling | Total | |||||||||||||||||||||||||||
| Note | Number | Value | Surplus | Earnings | AOCL[i] | Interest | Equity | ||||||||||||||||||||||||
| [in millions] | |||||||||||||||||||||||||||||||
| Balance, December 31, 2022 | 285.9 | $ | 3,299 | $ | 111 | $ | 8,639 | $ | (1,114 | ) | $ | 400 | $ | 11,335 | |||||||||||||||||
| Net income | 942 | 46 | 988 | ||||||||||||||||||||||||||||
| Other comprehensive loss | (135 | ) | (26 | ) | (161 | ) | |||||||||||||||||||||||||
| Shares issued on exercise of stock options | 0.4 | 17 | (3 | ) | 14 | ||||||||||||||||||||||||||
| Release of stock and stock units | 0.4 | 19 | (19 | ) | — | ||||||||||||||||||||||||||
| Tax withholdings on vesting of equity rewards | (0.2 | ) | (2 | ) | (8 | ) | (10 | ) | |||||||||||||||||||||||
| Repurchase and cancellation under normal course issuer bid | 12 | (0.2 | ) | (2 | ) | (9 | ) | (11 | ) | ||||||||||||||||||||||
| Stock-based compensation expense | 34 | 34 | |||||||||||||||||||||||||||||
| Dividends paid to non-controlling interests | (48 | ) | (48 | ) | |||||||||||||||||||||||||||
| Dividends paid | 0.1 | 2 | (391 | ) | (389 | ) | |||||||||||||||||||||||||
| Balance, September 30, 2023 | 286.4 | $ | 3,333 | $ | 123 | $ | 9,173 | $ | (1,249 | ) | $ | 372 | $ | 11,752 | |||||||||||||||||
| Three months ended September 30, 2023 | |||||||||||||||||||||||||||||||
| Common Shares | Non- | ||||||||||||||||||||||||||||||
| Stated | Contributed | Retained | controlling | Total | |||||||||||||||||||||||||||
| Note | Number | Value | Surplus | Earnings | AOCL[i] | Interest | Equity | ||||||||||||||||||||||||
| [in millions] | |||||||||||||||||||||||||||||||
| Balance, June 30, 2023 | 286.2 | $ | 3,323 | $ | 113 | $ | 8,907 | $ | (1,055 | ) | $ | 368 | $ | 11,656 | |||||||||||||||||
| Net income | 394 | 23 | 417 | ||||||||||||||||||||||||||||
| Other comprehensive loss | (194 | ) | (2 | ) | (196 | ) | |||||||||||||||||||||||||
| Shares issued on exercise of stock options | 0.2 | 10 | (2 | ) | 8 | ||||||||||||||||||||||||||
| Stock-based compensation expense | 12 | 12 | |||||||||||||||||||||||||||||
| Dividends paid to non-controlling interests | (17 | ) | (17 | ) | |||||||||||||||||||||||||||
| Dividends paid | (128 | ) | (128 | ) | |||||||||||||||||||||||||||
| Balance, September 30, 2023 | 286.4 | $ | 3,333 | $ | 123 | $ | 9,173 | $ | (1,249 | ) | $ | 372 | $ | 11,752 | |||||||||||||||||
[i] AOCL is Accumulated Other Comprehensive Loss.
See accompanying notes
| Magna International Inc. Third Quarter Report 2023 35 |
MAGNA INTERNATIONAL INC.
CONSOLIDATED STATEMENTS OF CHANGES IN EQUITY
[Unaudited]
[U.S. dollars in millions]
| Nine months ended September 30, 2022 | |||||||||||||||||||||||||||||||
| Common Shares | Non- | ||||||||||||||||||||||||||||||
| Stated | Contributed | Retained | controlling | Total | |||||||||||||||||||||||||||
| Note | Number | Value | Surplus | Earnings | AOCL[i] | Interest | Equity | ||||||||||||||||||||||||
| [in millions] | |||||||||||||||||||||||||||||||
| Balance, December 31, 2021 | 297.9 | $ | 3,403 | $ | 102 | $ | 9,231 | $ | (900 | ) | $ | 389 | $ | 12,225 | |||||||||||||||||
| Net income | 497 | 33 | 530 | ||||||||||||||||||||||||||||
| Other comprehensive loss | (741 | ) | (47 | ) | (788 | ) | |||||||||||||||||||||||||
| Shares issued on exercise of stock options | 0.1 | 6 | (1 | ) | 5 | ||||||||||||||||||||||||||
| Release of stock and stock units | 0.5 | 20 | (20 | ) | |||||||||||||||||||||||||||
| Tax withholdings on vesting of equity rewards | (0.2 | ) | (2 | ) | (13 | ) | (15 | ) | |||||||||||||||||||||||
| Repurchase and cancellation under normal course issuer bid | 12 | (12.4 | ) | (140 | ) | (644 | ) | 9 | (775 | ) | |||||||||||||||||||||
| Stock-based compensation expense | 22 | 22 | |||||||||||||||||||||||||||||
| Business Combinations | 47 | 47 | |||||||||||||||||||||||||||||
| Contribution by non-controlling interests | 5 | 5 | |||||||||||||||||||||||||||||
| Dividends paid to non-controlling interests | (22 | ) | (22 | ) | |||||||||||||||||||||||||||
| Dividends paid | 7 | (395 | ) | (388 | ) | ||||||||||||||||||||||||||
| Balance, September 30, 2022 | 285.9 | $ | 3,294 | $ | 103 | $ | 8,676 | $ | (1,632 | ) | $ | 405 | $ | 10,846 | |||||||||||||||||
| Three months ended September 30, 2022 | |||||||||||||||||||||||||||||||
| Common Shares | Non- | ||||||||||||||||||||||||||||||
| Stated | Contributed | Retained | controlling | Total | |||||||||||||||||||||||||||
| Note | Number | Value | Surplus | Earnings | AOCL[i] | Interest | Equity | ||||||||||||||||||||||||
| [in millions] | |||||||||||||||||||||||||||||||
| Balance, June 30, 2022 | 289.0 | $ | 3,326 | $ | 96 | $ | 8,662 | $ | (1,124 | ) | $ | 384 | $ | 11,344 | |||||||||||||||||
| Net income | 289 | 7 | 296 | ||||||||||||||||||||||||||||
| Other comprehensive loss | (511 | ) | (23 | ) | (534 | ) | |||||||||||||||||||||||||
| Shares issued on exercise of stock options | 1 | 1 | |||||||||||||||||||||||||||||
| Repurchase and cancellation under normal course issuer bid | 12 | (3.1 | ) | (36 | ) | (147 | ) | 3 | (180 | ) | |||||||||||||||||||||
| Stock-based compensation expense | 7 | 7 | |||||||||||||||||||||||||||||
| Business Combinations | 47 | 47 | |||||||||||||||||||||||||||||
| Dividends paid to non-controlling interests | (10 | ) | (10 | ) | |||||||||||||||||||||||||||
| Dividends paid | 3 | (128 | ) | (125 | ) | ||||||||||||||||||||||||||
| Balance, September 30, 2022 | 285.9 | $ | 3,294 | $ | 103 | $ | 8,676 | $ | (1,632 | ) | $ | 405 | $ | 10,846 | |||||||||||||||||
[i] AOCL is Accumulated Other Comprehensive Loss.
See accompanying notes
| 36 Magna International Inc. Third Quarter Report 2023 |
MAGNA INTERNATIONAL INC.
NOTES TO INTERIM CONSOLIDATED FINANCIAL STATEMENTS
[Unaudited]
[All amounts in U.S. dollars and all tabular amounts in millions unless otherwise noted]
| 1. | SIGNIFICANT ACCOUNTING POLICIES |
| [a] | Basis of presentation |
The unaudited interim consolidated financial statements of Magna International Inc. and its subsidiaries [collectively "Magna" or the "Company"] have been prepared in U.S. dollars following accounting principles generally accepted in the United States of America ["GAAP"]. The unaudited interim consolidated financial statements do not conform in all respects to the requirements of GAAP for annual consolidated financial statements. Accordingly, these unaudited interim consolidated financial statements should be read in conjunction with the December 31, 2022 audited consolidated financial statements and notes thereto included in the Company's 2022 Annual Report.
The unaudited interim consolidated financial statements reflect all adjustments, which consist only of normal and recurring adjustments, necessary to present fairly the financial position as at September 30, 2023 and the results of operations, changes in equity, and cash flows for the three and nine-month periods ended September 30, 2023 and 2022.
For the three and nine months ended September 30, 2022, $11 million and $35 million has been reclassified from Depreciation and amortization to Amortization of acquired intangible assets on the consolidated statements of income to conform with current period presentation.
| [b] | Use of Estimates |
The preparation of the unaudited interim consolidated financial statements in conformity with GAAP requires management to make estimates and assumptions that affect the amounts reported and disclosed in the interim consolidated financial statements and accompanying notes. Due to the inherent uncertainty involved in making estimates, actual results could ultimately differ from those estimates.
| Magna International Inc. Third Quarter Report 2023 37 |
MAGNA INTERNATIONAL INC.
NOTES TO INTERIM CONSOLIDATED FINANCIAL STATEMENTS
[Unaudited]
[All amounts in U.S. dollars and all tabular amounts in millions unless otherwise noted]
| 2. | OTHER (INCOME) EXPENSE, NET |
| Three months ended | Nine months ended | |||||||||||||||||
| September 30, | September 30, | |||||||||||||||||
| 2023 | 2022 | 2023 | 2022 | |||||||||||||||
| Operations in Russia | [a] | $ | 16 | $ | — | $ | 16 | $ | 376 | |||||||||
| Restructuring | [b] | (1 | ) | — | 82 | — | ||||||||||||
| Investments | [c] | (19 | ) | 9 | 103 | 120 | ||||||||||||
| Veoneer Active Safety Business transaction costs | [d] | — | — | 23 | — | |||||||||||||
| Impairments | [e] | — | 14 | — | 14 | |||||||||||||
| $ | (4 | ) | $ | 23 | $ | 224 | $ | 510 | ||||||||||
| [a] | Operations in Russia |
During the second quarter of 2022, the Company recorded a $376 million [$361 million after tax] impairment charge related to its investment in Russia as a result of the expected lack of future cashflows and the uncertainties connected with the Russian economy. This included net asset impairments of $173 million and a $203 million reserve against the related foreign currency translation losses that were included in accumulated other comprehensive loss. The net asset impairments consisted of $163 million and $10 million in its Body Exteriors & Structures and Seating Systems segments, respectively.
During the third quarter of 2023, the Company completed the sale of all of its investments in Russia resulting in a loss of $16 million [$16 million after tax] including a net cash outflow of $23 million.
| [b] | Restructuring |
For the three months ended September 30, 2023, the Company recorded restructuring charges of $7 million [$5 million after tax] and an $8 million [$7 million after tax] gain on the sale of a building as a result of restructuring activities in its Power & Vision segment.
For the nine months ended September 30, 2023, the Company recorded restructuring charges of $60 million [$46 million after tax] in its Power & Vision segment, and $22 million [$18 million after tax] in its Body Exteriors & Structures segment, respectively.
| [c] | Investments |
| Three months ended | Nine months ended | |||||||||||||||
| September 30, | September 30, | |||||||||||||||
| 2023 | 2022 | 2023 | 2022 | |||||||||||||
| Non-cash impairment charge [i] | $ | — | $ | — | $ | 85 | $ | — | ||||||||
| Revaluation of public company warrants | (18 | ) | 7 | 17 | 96 | |||||||||||
| Revaluation of public and private equity investments | (1 | ) | 2 | 1 | 27 | |||||||||||
| Gain on sale of public equity investments | — | — | — | (3 | ) | |||||||||||
| Other (income) expense, net | (19 | ) | 9 | 103 | 120 | |||||||||||
| Tax effect | 5 | (2 | ) | (4 | ) | (27 | ) | |||||||||
| Net (income) loss attributable to Magna | $ | (14 | ) | $ | 7 | $ | 99 | $ | 93 | |||||||
[i] The non-cash impairment charge relates to impairment of a private equity investment and related long-term receivables within Other assets.
| [d] | Veoneer Active Safety Business transaction costs |
During 2023, the Company incurred $23 million [$22 million after tax] of transaction costs related to the acquisition of the Veoneer Active Safety Business [“Veoneer AS”]. Refer to Note 5, “Business Combination”, in these consolidated financial statements.
| [e] | Impairments |
During the third quarter of 2022, the Company recorded a provision against its assets related to the closure of a customer in China of $10 million [$9 million after tax] in its Body Exteriors & Structures segment and $4 million [$3 million after tax] in its Power & Vision segment, respectively.
| 38 Magna International Inc. Third Quarter Report 2023 |
MAGNA INTERNATIONAL INC.
NOTES TO INTERIM CONSOLIDATED FINANCIAL STATEMENTS
[Unaudited]
[All amounts in U.S. dollars and all tabular amounts in millions unless otherwise noted]
| 3. | EARNINGS PER SHARE |
| Three months ended | Nine months ended | |||||||||||||||
| September 30, | September 30, | |||||||||||||||
| 2023 | 2022 | 2023 | 2022 | |||||||||||||
| Basic earnings per Common Share: | ||||||||||||||||
| Net income attributable to Magna International Inc. | $ | 394 | $ | 289 | $ | 942 | $ | 497 | ||||||||
| Weighted average number of Common Shares outstanding | 286.3 | 287.9 | 286.1 | 291.9 | ||||||||||||
| Basic earnings per Common Share | $ | 1.37 | $ | 1.01 | $ | 3.29 | $ | 1.70 | ||||||||
| Diluted earnings per Common Share [a]: | ||||||||||||||||
| Net income attributable to Magna International Inc. | $ | 394 | $ | 289 | $ | 942 | $ | 497 | ||||||||
| Weighted average number of Common Shares outstanding Adjustments | 286.3 | 287.9 | 286.1 | 291.9 | ||||||||||||
| Stock options and restricted stock | 0.5 | 0.6 | 0.5 | 0.9 | ||||||||||||
| 286.8 | 288.5 | 286.6 | 292.8 | |||||||||||||
| Diluted earnings per Common Share | $ | 1.37 | $ | 1.00 | $ | 3.29 | $ | 1.70 | ||||||||
| [a] | For the three and nine months ended September 30, 2023, diluted earnings per Common Share excluded 1.4 million and 2.3 million [2022 – 1.4 million and 1.3 million] Common Shares, respectively, issuable under the Company's Incentive Stock Option Plan because these options were not "in-the-money". The dilutive effect of participating securities using the two-class method was excluded from the calculation of earnings per share because the effect would be immaterial. |
| Magna International Inc. Third Quarter Report 2023 39 |
MAGNA INTERNATIONAL INC.
NOTES TO INTERIM CONSOLIDATED FINANCIAL STATEMENTS
[Unaudited]
[All amounts in U.S. dollars and all tabular amounts in millions unless otherwise noted]
| 4. | DETAILS OF CASH FROM OPERATING ACTIVITIES |
Cash from operating activities
| [a] | Cash, and cash equivalents: |
| September 30, | December 31, | |||||||
| 2023 | 2022 | |||||||
| Bank term deposits and bankers' acceptances | $ | 407 | $ | 720 | ||||
| Cash | 615 | 514 | ||||||
| $ | 1,022 | $ | 1,234 | |||||
| [b] | Items not involving current cash flows: |
| Three months ended | Nine months ended | |||||||||||||||
| September 30, | September 30, | |||||||||||||||
| 2023 | 2022 | 2023 | 2022 | |||||||||||||
| Depreciation | $ | 358 | $ | 330 | $ | 1,064 | $ | 1,035 | ||||||||
| Amortization of acquired intangible assets | 32 | 11 | 57 | 35 | ||||||||||||
| Amortization of other assets and intangible assets included in cost of goods sold | 53 | 49 | 171 | 127 | ||||||||||||
| Deferred revenue amortization | (42 | ) | (54 | ) | (131 | ) | (163 | ) | ||||||||
| Dividends received in excess of equity income | (11 | ) | (26 | ) | 26 | (16 | ) | |||||||||
| Deferred tax expense (recovery) | 28 | (22 | ) | (44 | ) | (141 | ) | |||||||||
| Other non-cash charges (recoveries) | 2 | (2 | ) | 31 | 12 | |||||||||||
| Non-cash portion of Other (income) expense, net [note 2] | (16 | ) | 9 | 21 | 120 | |||||||||||
| Impairment Charges | — | — | 85 | 361 | ||||||||||||
| $ | 404 | $ | 295 | $ | 1,280 | $ | 1,370 | |||||||||
| [c] | Changes in operating assets and liabilities: |
| Three months ended | Nine months ended | |||||||||||||||
| September 30, | September 30, | |||||||||||||||
| 2023 | 2022 | 2023 | 2022 | |||||||||||||
| Accounts receivable | $ | (35 | ) | $ | (601 | ) | $ | (1,616 | ) | $ | (1,339 | ) | ||||
| Inventories | (160 | ) | (208 | ) | (438 | ) | (527 | ) | ||||||||
| Prepaid expenses and other | 25 | (7 | ) | 32 | 6 | |||||||||||
| Accounts payable | 33 | 427 | 832 | 680 | ||||||||||||
| Accrued salaries and wages | 61 | 78 | 27 | 33 | ||||||||||||
| Other accrued liabilities | (14 | ) | (5 | ) | 542 | 180 | ||||||||||
| Income taxes payable | 66 | (37 | ) | (76 | ) | (94 | ) | |||||||||
| $ | (24 | ) | $ | (353 | ) | $ | (697 | ) | $ | (1,061 | ) | |||||
Cash from investment activities
During the fourth quarter of 2022, the Company entered into an agreement to sell a European Power & Vision operation. Under the terms of the arrangement, the Company is contractually obligated to provide the buyer with up to $42 million of funding. During the first quarter of 2023, the Company completed the sale of this operation which resulted in a net cash outflow of $25 million.
| 40 Magna International Inc. Third Quarter Report 2023 |
MAGNA INTERNATIONAL INC.
NOTES TO INTERIM CONSOLIDATED FINANCIAL STATEMENTS
[Unaudited]
[All amounts in U.S. dollars and all tabular amounts in millions unless otherwise noted]
| 5. | BUSINESS COMBINATION |
On June 1, 2023, the Company completed the acquisition of 100% of the common shares and voting interests of the entities holding the Veoneer AS. Veoneer AS supplies active safety products globally including active safety integration systems, radar, camera systems, internal cabin sensing, thermal sensing, and light detection. The purchase price was $1,475 million [net of $111 million cash acquired] and is subject to working capital and other customary purchase price adjustments.
The acquisition of Veoneer AS was accounted for as a business combination and is recorded in the Company’s Power & Vision segment. The Company recorded a purchase price allocation for the assets acquired and liabilities assumed based on their estimated fair values as of June 1, 2023. The following table summarizes the preliminary purchase price allocation:
| Non-cash working capital | $ | 170 | ||
| Fixed assets | 204 | |||
| Other assets | 79 | |||
| Intangible assets | 395 | |||
| Goodwill | 728 | |||
| Other liabilities | (84 | ) | ||
| Deferred tax liabilities | (17 | ) | ||
| Net cash outflow | $ | 1,475 |
The estimated fair values of the assets acquired and liabilities assumed are based on the Company’s preliminary estimates and assumptions. The preliminary purchase price allocation is subject to change within the measurement period and will be subsequently adjusted to reflect final valuation results and other adjustments, primarily related to measurement of fixed assets, and identification and measurement of intangible assets and goodwill.
Recognized goodwill is attributable to the assembled workforce, expected synergies and other intangible assets that do not qualify for separate recognition.
| 6. | INVENTORIES |
Inventories consist of:
| September 30, | December 31, | |||||||
| 2023 | 2022 | |||||||
| Raw materials and supplies | $ | 1,854 | $ | 1, 640 | ||||
| Work-in-process | 475 | 427 | ||||||
| Finished goods | 566 | 537 | ||||||
| Tooling and engineering | 1,856 | 1,576 | ||||||
| $ | 4,751 | $ | 4,180 | |||||
Tooling and engineering inventory represents costs incurred on tooling and engineering services contracts in excess of billed and unbilled amounts included in accounts receivable.
| 7. | INVESTMENTS |
| September 30, | December 31, | |||||||
| 2023 | 2022 | |||||||
| Equity method investments | $ | 950 | $ | 997 | ||||
| Public and private equity investments | 229 | 290 | ||||||
| Warrants | 125 | 142 | ||||||
| Debt investments | 7 | — | ||||||
| $ | 1,311 | $ | 1,429 | |||||
Cumulative unrealized gains and losses on equity securities held as at September 30, 2023 were $49 million and $230 million [$74 million and $205 million as at December 31, 2022], respectively.
| Magna International Inc. Third Quarter Report 2023 41 |
MAGNA INTERNATIONAL INC.
NOTES TO INTERIM CONSOLIDATED FINANCIAL STATEMENTS
[Unaudited]
[All amounts in U.S. dollars and all tabular amounts in millions unless otherwise noted]
| 8. | OTHER ASSETS |
Other assets consist of:
| September 30, | December 31, | |||||||
| 2023 | 2022 | |||||||
| Preproduction costs related to long-term supply agreements | $ | 762 | $ | 679 | ||||
| Long-term receivables | 306 | 262 | ||||||
| Pension overfunded status | 40 | 41 | ||||||
| Unrealized gain on cash flow hedges | 4 | 26 | ||||||
| Other, net | 102 | 85 | ||||||
| $ | 1,214 | $ | 1,093 | |||||
| 9. | WARRANTY |
The following is a continuity of the Company's warranty accruals, included in Other accrued liabilities:
| 2023 | 2022 | |||||||
| Balance, beginning of period | $ | 257 | $ | 247 | ||||
| Expense, net | 49 | 17 | ||||||
| Settlements | (23 | ) | (4 | ) | ||||
| Foreign exchange and other | 1 | (5 | ) | |||||
| Balance, March 31 | 284 | 255 | ||||||
| Expense, net | 5 | 7 | ||||||
| Settlements | (20 | ) | (14 | ) | ||||
| Acquisition | 3 | — | ||||||
| Foreign exchange and other | 22 | (9 | ) | |||||
| Balance, June 30 | 294 | 239 | ||||||
| Expense, net | 14 | 30 | ||||||
| Settlements | (11 | ) | (34 | ) | ||||
| Foreign exchange and other | (11 | ) | (8 | ) | ||||
| Balance, September 30 | $ | 286 | $ | 227 | ||||
| 42 Magna International Inc. Third Quarter Report 2023 |
MAGNA INTERNATIONAL INC.
NOTES TO INTERIM CONSOLIDATED FINANCIAL STATEMENTS
[Unaudited]
[All amounts in U.S. dollars and all tabular amounts in millions unless otherwise noted]
| 10. | DEBT |
| [a] | During the second quarter of 2023, the Company drew $100 million from the 3-year tranche and $300 million from the 5-year tranche of its unsecured, delayed draw term loan (the “Term Loan”). The remaining balance of the facility was subsequently cancelled. The amounts are drawn in advances of 1,3 or 6-month loans and may be rolled over until the end of the 3 and 5 year terms. |
| [b] | On May 26, 2023, the Company extended the maturity date from June 24, 2023 to June 24, 2024 of its $800 million 364-day syndicated revolving credit facility. The Company had not borrowed any funds under this credit facility. |
| [c] | On April 27, 2023, the Company amended its $2.7 billion syndicated revolving credit facility, including to: (i) extend the maturity date from June 24, 2027 to June 24, 2028, and (ii) cancel the $150 million Asian tranche and allocate the equivalent amount to the Canadian tranche. The Company had limited borrowing under this credit facility. |
| [d] | During the first quarter of 2023, the Company issued the following Senior Notes: |
| Issuance Date | Amount
in USD at Issuance Date |
Maturity Date | ||||
| Cdn$350 million Senior Notes at 4.950% [i] | March 10, 2023 | $258 million | January 31, 2031 | |||
| €550 million Senior Notes at 4.375% [ii] | March 17, 2023 | $591 million | March 17, 2032 | |||
| $300 million Senior Notes at 5.980% [i] | March 21, 2023 | $300 million | March 21, 2026 | |||
| $500 million Senior Notes at 5.500% [i] | March 21, 2023 | $500 million | March 21, 2033 |
The total cash proceeds received from the Senior Note issuances was $1,637 million, which consists of $1,649 million of Senior Notes less debt issuance costs of $12 million.
The Senior Notes are unsecured obligations and do not include any financial covenants. The Company may redeem the notes in whole or in part at any time, and from time to time, at specified redemption prices determined in accordance with the terms of the indenture governing the Senior Notes.
| [i] | The Cdn$350 million Senior Notes, $300 million Senior Notes, and $500 million Senior Notes were issued to both finance a portion of the cost of the acquisition of Veoneer AS and to pay related fees and expenses, and for general corporate purposes. |
| [ii] | The €550 million Senior Notes were issued for general corporate purposes, which may include the repayment of the Company’s existing indebtedness of €550 million in Senior Notes coming due in November 2023. |
| Magna International Inc. Third Quarter Report 2023 43 |
MAGNA INTERNATIONAL INC.
NOTES TO INTERIM CONSOLIDATED FINANCIAL STATEMENTS
[Unaudited]
[All amounts in U.S. dollars and all tabular amounts in millions unless otherwise noted]
| 11. | INCOME TAX |
For the three and nine months ended September 30, 2022, the Company’s effective income tax rate does not reflect the customary rate due to losses not benefited in Europe. The nine-month rate is also adversely affected by impairment charges offset by a partial release of valuation allowances against deferred tax assets resulting from a tax reorganization.
| 12. | CAPITAL STOCK |
| [a] | During the nine month period ended September 30, 2023, the Company repurchased 0.2 million shares under a normal course issuer bid for cash consideration of $11 million to settle certain equity compensation plans. |
| [b] | The following table presents the maximum number of shares that would be outstanding if all the dilutive instruments outstanding at November 3, 2023 were exercised or converted: |
| Common Shares | 286,361,423 | |||
| Stock options [i] | 6,132,439 | |||
| 292,493,862 |
| [i] | Options to purchase Common Shares are exercisable by the holder in accordance with the vesting provisions and upon payment of the exercise price as may be determined from time to time pursuant to the Company's stock option plans. |
| 44 Magna International Inc. Third Quarter Report 2023 |
MAGNA INTERNATIONAL INC.
NOTES TO INTERIM CONSOLIDATED FINANCIAL STATEMENTS
[Unaudited]
[All amounts in U.S. dollars and all tabular amounts in millions unless otherwise noted]
| 13. | ACCUMULATED OTHER COMPREHENSIVE LOSS |
The following is a continuity schedule of accumulated other comprehensive loss:
| 2023 | 2022 | |||||||
| Accumulated net unrealized loss on translation of net investment in foreign operations | ||||||||
| Balance, beginning of period | $ | (1,018 | ) | $ | (735 | ) | ||
| Net unrealized gain (loss) | 43 | (96 | ) | |||||
| Repurchase of shares under normal course issuer bid | 1 | 3 | ||||||
| Balance, March 31 | (974 | ) | (828 | ) | ||||
| Repurchase of shares under normal course issuer bid | (1 | ) | 3 | |||||
| Reserve for cumulative translation losses | — | 203 | ||||||
| Net unrealized loss | (53 | ) | (326 | ) | ||||
| Balance, June 30 | (1,028 | ) | (948 | ) | ||||
| Net unrealized loss | (151 | ) | (451 | ) | ||||
| Repurchase of shares under normal course issuer bid | — | 3 | ||||||
| Balance, September 30 | (1,179 | ) | (1,396 | ) | ||||
| Accumulated net unrealized gain (loss) on cash flow hedges [i] | ||||||||
| Balance, beginning of period | 5 | 24 | ||||||
| Net unrealized gain | 41 | 55 | ||||||
| Reclassification of net gain to net income | (3 | ) | (6 | ) | ||||
| Balance, March 31 | 43 | 73 | ||||||
| Net unrealized gain (loss) | 48 | (50 | ) | |||||
| Reclassification of net gain to net income | (14 | ) | (13 | ) | ||||
| Balance, June 30 | 77 | 10 | ||||||
| Net unrealized loss | (23 | ) | (56 | ) | ||||
| Reclassification of net gain to net income | (21 | ) | (6 | ) | ||||
| Balance, September 30 | 33 | (52 | ) | |||||
| Accumulated net unrealized loss on pensions | ||||||||
| Balance, beginning of period | (101 | ) | (189 | ) | ||||
| Revaluation | (5 | ) | 1 | |||||
| Reclassification of net loss to net income | 1 | 1 | ||||||
| Balance, March 31 | (105 | ) | (187 | ) | ||||
| Revaluation | 1 | — | ||||||
| Reclassification of net loss to net income | — | 1 | ||||||
| Balance, June 30 | (104 | ) | (186 | ) | ||||
| Reclassification of net loss to net income | 1 | 2 | ||||||
| Balance, September 30 | (103 | ) | (184 | ) | ||||
| Total accumulated other comprehensive loss | $ | (1,249 | ) | $ | (1,632 | ) | ||
| [i] | The amount of income tax expense that has been netted in the accumulated net unrealized gain on cash flow hedges is as follows: |
| 2023 | 2022 | |||||||
| Balance, beginning of period | $ | — | $ | (8 | ) | |||
| Net unrealized loss | (15 | ) | (18 | ) | ||||
| Reclassifications of net gain to net income | 1 | 2 | ||||||
| Balance, March 31 | (14 | ) | (24 | ) | ||||
| Net unrealized (loss) gains | (17 | ) | 17 | |||||
| Reclassifications of net gain to net income | 4 | 4 | ||||||
| Balance, June 30 | (27 | ) | (3 | ) | ||||
| Net unrealized loss | 7 | 20 | ||||||
| Reclassifications of net gain to net income | 7 | 2 | ||||||
| Balance, September 30 | $ | (13 | ) | $ | 19 | |||
The amount of other comprehensive gain that is expected to be reclassified to net income over the next 12 months is $65 million.
| Magna International Inc. Third Quarter Report 2023 45 |
MAGNA INTERNATIONAL INC.
NOTES TO INTERIM CONSOLIDATED FINANCIAL STATEMENTS
[Unaudited]
[All amounts in U.S. dollars and all tabular amounts in millions unless otherwise noted]
| 14. | FINANCIAL INSTRUMENTS |
| [a] | Financial assets and liabilities |
The Company's financial assets and financial liabilities consist of the following:
| September 30, | December 31, | |||||||
| 2023 | 2022 | |||||||
| Financial assets | ||||||||
| Cash and cash equivalents | $ | 1,022 | $ | 1,234 | ||||
| Accounts receivable | 8,477 | 6,791 | ||||||
| Warrants and public and private equity investments | 354 | 432 | ||||||
| Long-term receivables included in other assets | 306 | 262 | ||||||
| $ | 10,159 | $ | 8,719 | |||||
| Financial liabilities | ||||||||
| Short-term borrowing | $ | 2 | $ | 8 | ||||
| Long-term debt (including portion due within one year) | 5,533 | 3,501 | ||||||
| Accounts payable | 7,911 | 6,999 | ||||||
| $ | 13,446 | $ | 10,508 | |||||
| Derivatives designated as effective hedges, measured at fair value | ||||||||
| Foreign currency contracts | ||||||||
| Prepaid expenses | $ | 99 | $ | 65 | ||||
| Other assets | 4 | 26 | ||||||
| Other accrued liabilities | (31 | ) | (43 | ) | ||||
| Other long-term liabilities | (16 | ) | (31 | ) | ||||
| $ | 56 | $ | 17 | |||||
| [b] | Supplier financing program |
The Company has a supplier financing program with third-party financial institutions that provides financing to suppliers who provide tooling related materials. This arrangement allows these suppliers to elect to be paid by a financial institution at a discount earlier than the maturity date of the receivable, which may extend from 6 to 18 months. The Company will pay the full amount owing to the financial institution on the maturity dates. Amounts outstanding under this program as at September 30, 2023 were $117 million [$135 million at December 31, 2022] and are presented within accounts payable.
| 46 Magna International Inc. Third Quarter Report 2023 |
MAGNA INTERNATIONAL INC.
NOTES TO INTERIM CONSOLIDATED FINANCIAL STATEMENTS
[Unaudited]
[All amounts in U.S. dollars and all tabular amounts in millions unless otherwise noted]
| 14. | FINANCIAL INSTRUMENTS (CONTINUED) |
| [c] | Fair value |
The Company determined the estimated fair values of its financial instruments based on valuation methodologies it believes are appropriate; however, considerable judgment is required to develop these estimates. Accordingly, these estimated fair values are not necessarily indicative of the amounts the Company could realize in a current market exchange. The estimated fair value amounts can be materially affected by the use of different assumptions or methodologies. The methods and assumptions used to estimate the fair value of financial instruments are described below:
Cash and cash equivalents, accounts receivable, accounts payable and short-term borrowings
Due to the short period to maturity of the instruments, the carrying values as presented in the consolidated balance sheets are reasonable estimates of fair values.
Publicly traded and private equity securities
The fair value of the Company’s investments in publicly traded equity securities is determined using the closing price on the measurement date, as reported on the stock exchange on which the securities are traded. [Level 1 input based on the GAAP fair value hierarchy.]
The Company estimates the value of its private equity securities based on valuation methods using the observable transaction price at the transaction date and other observable inputs including rights and obligations of the securities held by the Company. [Level 3 input based on the GAAP fair value hierarchy.]
Warrants
The Company estimates the value of its warrants based on the quoted prices in the active market for Fisker's common shares. [Level 2 inputs based on the GAAP fair value hierarchy.]
Term Loan
The Company's Term Loan consists of advances, which are rolled over until repayment for up to 3 years and 5 years, respectively. Due to the short-term maturity of each loan, the carrying value as presented in the consolidated balance sheets is a reasonable estimate of its fair value.
Senior Notes
At September 30, 2023, the net book value of the Company's Senior Notes was $5.0 billion and the estimated fair value was $4.8 billion. The net book value of the Company’s Senior Notes due within one year is $1.3 billion. The fair value of our Senior Notes are classified as Level 1 when we use quoted prices in active markets and Level 2 when the quoted prices are from less active markets or when other observable inputs are used to determine fair value.
| [d] | Interest rate risk |
The Company is not exposed to significant interest rate risk due to the short-term maturity of its monetary current assets and current liabilities. In particular, the amount of interest income earned on cash and cash equivalents is impacted more by investment decisions made and the demands to have available cash on hand, than by movements in interest rates over a given period.
The Company is exposed to interest rate risk on its Term Loan as the interest rate is variable, however the Company is not exposed to interest rate risk on Senior Notes as the interest rates are fixed.
| Magna International Inc. Third Quarter Report 2023 47 |
MAGNA INTERNATIONAL INC.
NOTES TO INTERIM CONSOLIDATED FINANCIAL STATEMENTS
[Unaudited]
[All amounts in U.S. dollars and all tabular amounts in millions unless otherwise noted]
| 14. | FINANCIAL INSTRUMENTS (CONTINUED) |
| [e] | Credit risk |
The Company's financial assets that are exposed to credit risk consist primarily of cash and cash equivalents, accounts receivable, long-term receivables, and foreign exchange forward contracts with positive fair values.
Cash and cash equivalents which consists of short-term investments, are only invested in bank term deposits and bank commercial paper with primarily an investment grade credit rating. Credit risk is further reduced by limiting the amount which is invested in certain major financial institutions.
The Company is also exposed to credit risk from the potential default by any of its counterparties on its foreign exchange forward contracts. The Company mitigates this credit risk by dealing with counterparties who are major financial institutions that the Company anticipates will satisfy their obligations under the contracts.
In the normal course of business, the Company is exposed to credit risk from its customers, substantially all of which are in the automotive industry and are subject to credit risks associated with the automotive industry. For the three and nine months ended September 30, 2023, sales to the Company's six largest customers represented 75% and 77%, respectively, of the Company's total sales; and substantially all of its sales are to customers in which the Company has ongoing contractual relationships. The Company continues to develop and conduct business with newer electric vehicle-focused customers, which poses incremental credit risk due to their relatively short operating histories; limited financial resources; less mature product development and validation processes; uncertain market acceptance of their products/services; and untested business models. These factors may elevate our risks in dealing with such customers, particularly with respect to recovery of: pre-production (including tooling, engineering, and launch) and production receivables; inventory; fixed assets and capitalized preproduction expenditures; as well as other third party obligations related to such items. As at September 30, 2023, the Company’s balance sheet exposure related to newer electric vehicle-focused customers was approximately $450 million, the majority of which related to Fisker. In determining the allowance for expected credit losses, the Company considers changes in customer's credit ratings, liquidity, customer's historical payments and loss experience, current economic conditions and the Company's expectations of future economic conditions.
| [f] | Currency risk and foreign exchange contracts |
The Company is exposed to fluctuations in foreign exchange rates when manufacturing facilities have committed to the delivery of products, and/or the purchase of materials and equipment in currencies other than the facilities' functional currency. In an effort to manage this net foreign exchange exposure, the Company employs hedging programs, primarily through the use of foreign exchange forward contracts.
At September 30, 2023, the Company had outstanding foreign exchange forward contracts representing commitments to buy and sell various foreign currencies. Significant commitments are as follows:
| For Canadian dollars | For U.S. dollars | For Euros | ||||||||||||||||||||||||||||||
| Weighted | Weighted | Weighted | Czech | Weighted | ||||||||||||||||||||||||||||
| U.S. dollar | average | Peso | average | U.S. dollar | average | Koruna | average | |||||||||||||||||||||||||
| amount | rate | amount | rate | amount | rate | Amount | rate | |||||||||||||||||||||||||
| Buy | 22 | 0.78548 | 6,638 | 0.04316 | 35 | 0.85911 | 2,535 | 0.03695 | ||||||||||||||||||||||||
| (Sell) | (869 | ) | 1.28374 | (8 | ) | 0.00113 | (80 | ) | 1.12672 | — | — | |||||||||||||||||||||
Forward contracts mature at various dates through 2025. Foreign currency exposures are reviewed quarterly.
| [g] | Equity price risk |
Public equity securities and warrants
The Company's public equity securities and warrants are subject to market price risk due to the risk of loss in value that would result from a decline in the market price of the common shares or underlying common shares.
| 48 Magna International Inc. Third Quarter Report 2023 |
MAGNA INTERNATIONAL INC.
NOTES TO INTERIM CONSOLIDATED FINANCIAL STATEMENTS
[Unaudited]
[All amounts in U.S. dollars and all tabular amounts in millions unless otherwise noted]
| 15. | CONTINGENCIES |
From time to time, the Company may become involved in regulatory proceedings, or become liable for legal, contractual and other claims by various parties, including customers, suppliers, former employees, class action plaintiffs and others. On an ongoing basis, the Company attempts to assess the likelihood of any adverse judgments or outcomes to these proceedings or claims, together with potential ranges of probable costs and losses. A determination of the provision required, if any, for these contingencies is made after analysis of each individual issue. The required provision may change in the future due to new developments in each matter or changes in approach such as a change in settlement strategy in dealing with these matters.
The Company's policy is to comply with all applicable laws, including antitrust and competition laws. Based on a previously completed global review of legacy antitrust risks which led to a September 2020 settlement with the European Commission and a June 2022 settlement with Brazil’s federal competition authority involving in both cases the supply of closure systems, Magna does not currently anticipate any material liabilities. However, we could be subject to restitution settlements, civil proceedings, reputational damage and other consequences, including as a result of the matters specifically referred to above.
| 16. | SEGMENTED INFORMATION |
Magna is a global automotive supplier which has complete vehicle engineering and contract manufacturing expertise, as well as product capabilities which include body, chassis, exterior, seating, powertrain, active driver assistance, electronics, mirrors & lighting, mechatronics, and roof systems. Magna also has electronic and software capabilities across many of these areas.
The Company is organized under four operating segments: Body Exteriors & Structures, Power & Vision, Seating Systems, and Complete Vehicles. These segments have been determined on the basis of technological opportunities, product similarities, and market and operating factors, and are also the Company's reportable segments.
The Company's chief operating decision maker uses Adjusted Earnings before Interest and Income Taxes ["Adjusted EBIT"] as the measure of segment profit or loss, since management believes Adjusted EBIT is the most appropriate measure of operational profitability or loss for its reporting segments. Adjusted EBIT is calculated by taking Net income and adding back Amortization of acquired intangible assets, Income taxes, Interest expense, net and Other (income) expense, net.
Effective July 1, 2023, the Company revised its calculation of Adjusted EBIT to exclude the amortization of acquired intangible assets. The Company believes that excluding the amortization of acquired intangible assets from Adjusted EBIT helps management and investors in understanding its underlying performance and improves comparability between its segmented results of operations and its peers. The Adjusted EBIT presented in the tables below, including for the prior period, have been updated to reflect the revised calculation.
| Magna International Inc. Third Quarter Report 2023 49 |
MAGNA INTERNATIONAL INC.
NOTES TO INTERIM CONSOLIDATED FINANCIAL STATEMENTS
[Unaudited]
[All amounts in U.S. dollars and all tabular amounts in millions unless otherwise noted]
| 16. | Segmented Information (CONTINUED) |
| [a] | The following tables show segment information for the Company's reporting segments and a reconciliation of Adjusted EBIT to the Company's consolidated net income: |
| Three months ended September 30, 2023 | ||||||||||||||||||||||||
| Equity | Fixed | |||||||||||||||||||||||
| Total | External | Adjusted | loss | asset | ||||||||||||||||||||
| sales | sales | EBIT [ii] | Depreciation | (income) | additions | |||||||||||||||||||
| Body Exteriors & Structures | $ | 4,354 | $ | 4,297 | $ | 358 | $ | 178 | $ | 2 | $ | 424 | ||||||||||||
| Power & Vision | 3,745 | 3,685 | 221 | 133 | (46 | ) | 156 | |||||||||||||||||
| Seating Systems | 1,529 | 1,526 | 70 | 20 | 5 | 24 | ||||||||||||||||||
| Complete Vehicles | 1,185 | 1,176 | (5 | ) | 24 | (1 | ) | 21 | ||||||||||||||||
| Corporate & Other [i] | (125 | ) | 4 | (29 | ) | 3 | — | 5 | ||||||||||||||||
| Total Reportable Segments | $ | 10,688 | $ | 10,688 | $ | 615 | $ | 358 | $ | (40 | ) | $ | 630 | |||||||||||
| Three months ended September 30, 2022 | ||||||||||||||||||||||||
| Equity | Fixed | |||||||||||||||||||||||
| Total | External | Adjusted | loss | asset | ||||||||||||||||||||
| sales | sales | EBIT [ii] | Depreciation | (income) | additions | |||||||||||||||||||
| Body Exteriors & Structures | $ | 3,976 | $ | 3,918 | $ | 227 | $ | 169 | $ | 5 | $ | 184 | ||||||||||||
| Power & Vision | 2,911 | 2,852 | 124 | 115 | (31 | ) | 140 | |||||||||||||||||
| Seating Systems | 1,295 | 1,292 | 37 | 18 | (5 | ) | 24 | |||||||||||||||||
| Complete Vehicles | 1,213 | 1,203 | 65 | 25 | (1 | ) | 16 | |||||||||||||||||
| Corporate & Other [i] | (127 | ) | 3 | (1 | ) | 3 | 5 | — | ||||||||||||||||
| Total Reportable Segments | $ | 9,268 | $ | 9,268 | $ | 452 | $ | 330 | $ | (27 | ) | $ | 364 | |||||||||||
| Nine months ended September 30, 2023 | ||||||||||||||||||||||||
| Equity | Fixed | |||||||||||||||||||||||
| Total | External | Adjusted | loss | asset | ||||||||||||||||||||
| sales | sales | EBIT [ii] | Depreciation | (income) | additions | |||||||||||||||||||
| Body Exteriors & Structures | $ | 13,333 | $ | 13,083 | $ | 1,024 | $ | 538 | $ | 3 | $ | 1,005 | ||||||||||||
| Power & Vision | 10,530 | 10,336 | 437 | 378 | (108 | ) | 422 | |||||||||||||||||
| Seating Systems | 4,618 | 4,603 | 174 | 62 | (3 | ) | 64 | |||||||||||||||||
| Complete Vehicles | 4,337 | 4,310 | 81 | 75 | (3 | ) | 45 | |||||||||||||||||
| Corporate & Other [i] | (475 | ) | 11 | (36 | ) | 11 | 2 | 20 | ||||||||||||||||
| Total Reportable Segments | $ | 32,343 | $ | 32,343 | $ | 1,680 | $ | 1,064 | $ | (109 | ) | $ | 1,556 | |||||||||||
| Nine months ended September 30, 2022 | ||||||||||||||||||||||||
| Equity | Fixed | |||||||||||||||||||||||
| Total | External | Adjusted | loss | asset | ||||||||||||||||||||
| sales | sales | EBIT [ii] | Depreciation | (income) | additions | |||||||||||||||||||
| Body Exteriors & Structures | $ | 12,000 | $ | 11,818 | $ | 652 | $ | 528 | $ | 10 | $ | 487 | ||||||||||||
| Power & Vision | 8,845 | 8,675 | 386 | 356 | (72 | ) | 341 | |||||||||||||||||
| Seating Systems | 3,924 | 3,908 | 90 | 60 | (9 | ) | 59 | |||||||||||||||||
| Complete Vehicles | 3,891 | 3,862 | 178 | 79 | (3 | ) | 41 | |||||||||||||||||
| Corporate & Other [i] | (388 | ) | 9 | 35 | 12 | 2 | 3 | |||||||||||||||||
| Total Reportable Segments | $ | 28,272 | $ | 28,272 | $ | 1,341 | $ | 1,035 | $ | (72 | ) | $ | 931 | |||||||||||
| [i] | Included in Corporate and Other Adjusted EBIT are intercompany fees charged to the automotive segments. |
| 50 Magna International Inc. Third Quarter Report 2023 |
MAGNA INTERNATIONAL INC.
NOTES TO INTERIM CONSOLIDATED FINANCIAL STATEMENTS
[Unaudited]
[All amounts in U.S. dollars and all tabular amounts in millions unless otherwise noted]
| 16. | Segmented Information (CONTINUED) |
| [ii] | The following table reconciles Net income to Adjusted EBIT: |
| Three months ended | Nine months ended | |||||||||||||||
| September 30, | September 30, | |||||||||||||||
| 2023 | 2022 | 2023 | 2022 | |||||||||||||
| Net income | $ | 417 | $ | 296 | $ | 988 | $ | 530 | ||||||||
| Add: | ||||||||||||||||
| Amortization of acquired intangible assets | 32 | 11 | 57 | 35 | ||||||||||||
| Interest expense, net | 49 | 18 | 103 | 64 | ||||||||||||
| Other (income) expense, net | (4 | ) | 23 | 224 | 510 | |||||||||||
| Income taxes | 121 | 104 | 308 | 202 | ||||||||||||
| Adjusted EBIT | $ | 615 | $ | 452 | $ | 1,680 | $ | 1,341 | ||||||||
| [b] | The following table shows Goodwill for the Company's reporting segments: |
| September 30, | December 31, | |||||||
| 2023 | 2022 | |||||||
| Body Exteriors & Structures | $ | 441 | $ | 448 | ||||
| Power & Vision | 1,915 | 1,198 | ||||||
| Seating Systems | 253 | 260 | ||||||
| Complete Vehicles | 104 | 105 | ||||||
| Corporate and Other | 20 | 20 | ||||||
| Total Reportable Segments | $ | 2,733 | $ | 2,031 | ||||
| [c] | The following table shows Net Assets for the Company's reporting segments: |
| September 30, | December 31, | |||||||
| 2023 | 2022 | |||||||
| Body Exteriors & Structures | $ | 8,089 | $ | 7,168 | ||||
| Power & Vision | 7,740 | 6,104 | ||||||
| Seating Systems | 1,343 | 1,377 | ||||||
| Complete Vehicles | 566 | 632 | ||||||
| Corporate & Other | 1,003 | 802 | ||||||
| Total Reportable Segments | $ | 18,741 | $ | 16,083 | ||||
The following table reconciles Total Assets to Net Assets:
| September 30, | December 31, | |||||||
| 2023 | 2022 | |||||||
| Total Assets | $ | 31,675 | $ | 27,789 | ||||
| Deduct assets not included in segment net assets: | ||||||||
| Cash and cash equivalents | (1,022 | ) | (1,234 | ) | ||||
| Deferred tax assets | (527 | ) | (491 | ) | ||||
| Long-term receivables from joint venture partners | (37 | ) | (14 | ) | ||||
| Deduct liabilities included in segment net assets: | ||||||||
| Accounts payable | (7,911 | ) | (6,999 | ) | ||||
| Accrued salaries and wages | (900 | ) | (850 | ) | ||||
| Other accrued liabilities | (2,537 | ) | (2,118 | ) | ||||
| Segment Net Assets | $ | 18,741 | $ | 16,083 | ||||
| Magna International Inc. Third Quarter Report 2023 51 |
CORPORATE OFFICE
Magna International Inc.
337 Magna Drive
Aurora, Ontario
Canada L4G 7K1
Telephone: (905) 726-2462
www.magna.com
TRANSFER AGENT AND REGISTRAR
Canada – Common Shares
Computershare Trust Company of Canada
100 University Avenue, 8th Floor
Toronto, Ontario, Canada M5J 2Y1
Telephone: 1 (800) 564-6253
United States – Common Shares
Computershare Trust Company, N.A.
462 S. 4th Street
Louisville, Kentucky, USA 40202
Telephone: 1 (800) 962-4284
From all other countries
Telephone: 1 (514) 982-7555
www.computershare.com
EXCHANGE LISTINGS
Common Shares
| Toronto Stock Exchange | MG | |
| The New York Stock Exchange | MGA |
Shareholders wishing to communicate with the non-management members of the Magna Board of Directors may do so by contacting the Chairman of Board through the office of Magna’s Corporate Secretary at 337 Magna Drive, Aurora, Ontario, Canada L4G 7K1 (905) 726-7070.
Annual Report
Copies of the Annual Report may be obtained from: The Corporate Secretary, Magna International Inc., 337 Magna Drive, Aurora, Ontario, Canada L4G 7K1 or www.magna.com. Copies of financial data and other publicly filed documents are available through the internet on the Canadian Securities Administrators’ System for Electronic Document Analysis and Retrieval (SEDAR) which can be accessed at www.sedar.com, and on the United States Securities and Exchange Commission's Electronic Data Gathering, Analysis and Retrieval System (EDGAR) which can be accessed at www.sec.gov.
Exhibit 99.3
FORM 52-109F2
CERTIFICATION OF INTERIM FILINGS
FULL CERTIFICATE
I, Seetarama (Swamy) Kotagiri, Chief Executive Officer of Magna International Inc., certify the following:
1. Review: I have reviewed the interim financial report and interim MD&A (together, the “interim filings”) of Magna International Inc. (the “issuer”) for the interim period ended September 30, 2023.
2. No misrepresentations: Based on my knowledge, having exercised reasonable diligence, the interim filings do not contain any untrue statement of a material fact or omit to state a material fact required to be stated or that is necessary to make a statement not misleading in light of the circumstances under which it was made, with respect to the period covered by the interim filings.
3. Fair presentation: Based on my knowledge, having exercised reasonable diligence, the interim financial report together with the other financial information included in the interim filings fairly present in all material respects the financial condition, financial performance and cash flows of the issuer, as of the date of and for the periods presented in the interim filings.
4. Responsibility: The issuer’s other certifying officer(s) and I are responsible for establishing and maintaining disclosure controls and procedures (DC&P) and internal control over financial reporting (ICFR), as those terms are defined in National Instrument 52-109 Certification of Disclosure in Issuer’s Annual and Interim Filings, for the issuer.
5. Design: Subject to the limitations, if any, described in paragraphs 5.2 and 5.3, the issuer’s other certifying officer(s) and I have, as at the end of the period covered by the interim filings
(a) designed DC&P, or caused it to be designed under our supervision, to provide reasonable assurance that
(i) material information relating to the issuer is made known to us by others, particularly during the period in which the interim filings are being prepared; and
(ii) information required to be disclosed by the issuer in its annual filings, interim filings or other reports filed or submitted by it under securities legislation is recorded, processed, summarized and reported within the time periods specified in securities legislation; and
(b) designed ICFR, or caused it to be designed under our supervision, to provide reasonable assurance regarding the reliability of financial reporting and the preparation of financial statements for external purposes in accordance with the issuer’s GAAP.
5.1 Control framework: The control framework the issuer’s other certifying officer(s) and I used to design the issuer’s ICFR is the Internal Control - Integrated Framework issued by the Committee of Sponsoring Organizations of the Treadway Commission (COSO).
5.2 N/A
5.3 N/A
6. Reporting changes in ICFR: The issuer has disclosed in its interim MD&A any change in the issuer’s ICFR that occurred during the period beginning on July 1, 2023 and ended on September 30, 2023 that has materially affected, or is reasonably likely to materially affect, the issuer’s ICFR.
Date: November 3, 2023.
| /s/ “Swamy Kotagiri” | |
| Seetarama (Swamy) Kotagiri | |
| Chief Executive Officer |
Exhibit 99.4
FORM 52-109F2
CERTIFICATION OF INTERIM FILINGS
FULL CERTIFICATE
I, Patrick W.D. McCann, Executive Vice-President and Chief Financial Officer of Magna International Inc., certify the following:
1. Review: I have reviewed the interim financial report and interim MD&A (together, the “interim filings”) of Magna International Inc. (the “issuer”) for the interim period ended September 30, 2023.
2. No misrepresentations: Based on my knowledge, having exercised reasonable diligence, the interim filings do not contain any untrue statement of a material fact or omit to state a material fact required to be stated or that is necessary to make a statement not misleading in light of the circumstances under which it was made, with respect to the period covered by the interim filings.
3. Fair presentation: Based on my knowledge, having exercised reasonable diligence, the interim financial report together with the other financial information included in the interim filings fairly present in all material respects the financial condition, financial performance and cash flows of the issuer, as of the date of and for the periods presented in the interim filings.
4. Responsibility: The issuer’s other certifying officer(s) and I are responsible for establishing and maintaining disclosure controls and procedures (DC&P) and internal control over financial reporting (ICFR), as those terms are defined in National Instrument 52-109 Certification of Disclosure in Issuer’s Annual and Interim Filings, for the issuer.
5. Design: Subject to the limitations, if any, described in paragraphs 5.2 and 5.3, the issuer’s other certifying officer(s) and I have, as at the end of the period covered by the interim filings
(a) designed DC&P, or caused it to be designed under our supervision, to provide reasonable assurance that
(i) material information relating to the issuer is made known to us by others, particularly during the period in which the interim filings are being prepared; and
(ii) information required to be disclosed by the issuer in its annual filings, interim filings or other reports filed or submitted by it under securities legislation is recorded, processed, summarized and reported within the time periods specified in securities legislation; and
(b) designed ICFR, or caused it to be designed under our supervision, to provide reasonable assurance regarding the reliability of financial reporting and the preparation of financial statements for external purposes in accordance with the issuer’s GAAP.
5.1 Control framework: The control framework the issuer’s other certifying officer(s) and I used to design the issuer’s ICFR is the Internal Control - Integrated Framework issued by the Committee of Sponsoring Organizations of the Treadway Commission (COSO).
5.2 N/A
5.3 N/A
6. Reporting changes in ICFR: The issuer has disclosed in its interim MD&A any change in the issuer’s ICFR that occurred during the period beginning on July 1, 2023 and ended on September 30, 2023 that has materially affected, or is reasonably likely to materially affect, the issuer’s ICFR.
Date: November 3, 2023.
| /s/ “Patrick McCann” | |
| Patrick W.D. McCann | |
| Executive Vice-President and Chief Financial Officer |
1 Year Magna Chart |
1 Month Magna Chart |

It looks like you are not logged in. Click the button below to log in and keep track of your recent history.
Support: +44 (0) 203 8794 460 | support@advfn.com
By accessing the services available at ADVFN you are agreeing to be bound by ADVFN's Terms & Conditions
 Hot Features