ADVFN Logo ADVFN

We could not find any results for:
Make sure your spelling is correct or try broadening your search.

Trending Now

Toplists

It looks like you aren't logged in.
Click the button below to log in and view your recent history.

Hot Features

Registration Strip Icon for default Register for Free to get streaming real-time quotes, interactive charts, live options flow, and more.

LEO BNY Mellon Strategic Municipals Inc

6.17
-0.03 (-0.48%)
Last Updated: 17:39:19
Delayed by 15 minutes
Share Name Share Symbol Market Type
BNY Mellon Strategic Municipals Inc NYSE:LEO NYSE Common Stock
  Price Change % Change Share Price High Price Low Price Open Price Shares Traded Last Trade
  -0.03 -0.48% 6.17 6.20 6.17 6.19 96,527 17:39:19

Dreyfus Strategic Municipals, Inc. (LEO) Releases Fund Statistics

19/07/2006 4:38pm

Business Wire


BNY Mellon Strategic Mun... (NYSE:LEO)
Historical Stock Chart


From Jul 2019 to Jul 2024
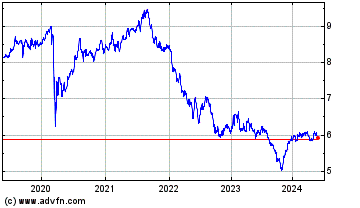
Click Here for more BNY Mellon Strategic Mun... Charts.
The following information for Dreyfus Strategic Municipals, Inc. (NYSE: LEO) is as of June 30, 2006 (except as otherwise noted), and is subject to change at any time. All percentages are based on total net assets. -0- *T Dreyfus Strategic Municipals, Inc. Symbol : "LEO" As of June 30, 2006 ---------------------- ------------- ------------------------ ------ Portfolio Overview Sector Distribution (Top Five) ---------------------- ------------- ------------------------ ------ Subject to AMT (As a percentage of net 23% assets) ---------------------- ------------- ------------------------ ------ Number of Issues 176 Health Care 13% ---------------------- ------------- ------------------------ ------ Average maturity 20 years Transportation 10% ---------------------- ------------- ------------------------ ------ Effective maturity 7 years Other Revenue 6% ---------------------- ------------- ------------------------ ------ Duration 4.964 Education 8% ---------------------- ------------- ------------------------ ------ Average rating* A General Obligations 7% ---------------------- ------------- ------------------------ ------ Average coupon 5.988 ---------------------- ------------- ------------------------ ------ Average dollar price State Distribution (Top $102.014 Five) ---------------------- ------------- ------------------------ ------ Pre-refunded (As a percentage of net securities 17.95% assets) ---------------------- ------------- ------------------------ ------ Leverage 34% Illinois 8% ---------------------- ------------- ------------------------ ------ Texas 8% ---------------------- ------------- ------------------------ ------ Market Summary California 7% ---------------------- ------------- ------------------------ ------ Market price range (52 Wisconsin weeks) $8.26-$9.20 5% ---------------------- ------------- ------------------------ ------ NAV range (52 weeks) $9.17-$9.52 Michigan 5% ---------------------- ------------- ------------------------ ------ Market price $8.60 ---------------------- ------------- ------------------------ ------ NAV Call Schedule (Through $9.21 2009) ---------------------- ------------- ------------------------ ------ Premium/(discount) (6.623) 2006 12% ---------------------- ------------- ------------------------ ------ Average daily volume (52 weeks) 62,606 2007 1% ---------------------- ------------- ------------------------ ------ Shares outstanding 60.59mm 2008 4% ---------------------- ------------- ------------------------ ------ Net assets $843,222,508 2009 8% ---------------------- ------------- ------------------------ ------ 2010 5% ---------------------- ------------- ------------------------ ------ Portfolio Quality* ---------------------- ------------- ------------------------ ------ AAA Market Yield and 34% Dividend Rate** ---------------------- ------------- ------------------------ ------ AA 8% Current market yield 5.86% ---------------------- ------------- ------------------------ ------ A 15% Current dividend rate $.042 ---------------------- ------------- ------------------------ ------ BBB 28% ---------------------- ------------- ------------------------ ------ Below investment grade 15% ---------------------- ------------- ------------------------ ------ * The percentages of **The market yield is these ratings are calculated by calculated based on multiplying the current the higher of market distribution by Standard & Poor's or 12 and dividing by the Moody's for individual market price per share issues and on a of $8.60 as of June 30, Dreyfus rating for 2006. Past Performance non-rated issues. is no guarantee of future performance and price and yield will vary. *T

1 Year BNY Mellon Strategic Mun... Chart

1 Year BNY Mellon Strategic Mun... Chart

1 Month BNY Mellon Strategic Mun... Chart

1 Month BNY Mellon Strategic Mun... Chart