We could not find any results for:
Make sure your spelling is correct or try broadening your search.
| Share Name | Share Symbol | Market | Type |
|---|---|---|---|
| Eaton Vance Tax Advantaged Dividend Income Fund | NYSE:EVT | NYSE | Common Stock |
| Price Change | % Change | Share Price | High Price | Low Price | Open Price | Shares Traded | Last Trade | |
|---|---|---|---|---|---|---|---|---|
| 0.05 | 0.21% | 23.66 | 23.72 | 23.59 | 23.67 | 95,460 | 21:06:02 |

| 2 | |
| 4 | |
| 5 | |
| 6 | |
| 13 | |
| 14 | |
| 15 | |
| 16 | |
| 17 | |
| 34 | |
| 35 | |
| 36 | |
| 37 | |
| 39 | |
| 43 | |
| 46 | |
| 48 |
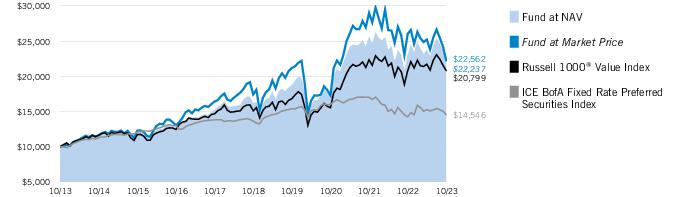
% Average Annual Total Returns 1,2 |
Inception Date |
One Year |
Five Years |
Ten Years |
| Fund at NAV | 09/30/2003 | (1.99)% | 6.91% | 8.47% |
| Fund at Market Price | — | (14.54) | 4.99 | 8.32 |
| Russell 1000® Value Index | — | 0.13% | 6.59% | 7.59% |
| ICE BofA Fixed Rate Preferred Securities Index | — | 2.18 | 1.29 | 3.82 |
| Blended Index | — | 0.83 | 5.20 | 6.62 |
% Premium/Discount to NAV 3 |
|
| As of period end | (10.57)% |
Distributions 4 |
|
| Total Distributions per share for the period | $1.786 |
| Distribution Rate at NAV | 8.28% |
| Distribution Rate at Market Price | 9.26 |
% Total Leverage 5 |
|
| Borrowings | 21.75% |
1 |
Excludes cash and cash equivalents. |
Common shareholder transaction expenses |
|
| Sales load paid by you ( |
1 |
| Offering expenses ( |
2 |
| Dividend reinvestment plan fees | $ 3 |
Annual expenses |
Percentage of net assets attributable to common shares 4 |
| Investment adviser fee | 5 |
| Interest payments on borrowed funds | 6, 7 |
| Other expenses | |
| Acquired fund fees and expenses | |
| Total annual Fund operating expenses |
1 Year |
3 Years |
5 Years |
10 Years |
| $ |
$ |
$ |
$ |
Market Price ($) |
NAV per Share on Date of Market Price ($) |
NAV Premium/(Discount) on Date of Market Price (%) | ||||||
Fiscal Quarter Ended |
High |
Low |
High |
Low |
High |
Low | ||
| October 31, 2023 | ( |
( | ||||||
| July 31, 2023 | ( |
( | ||||||
| April 30, 2023 | ( |
( | ||||||
| January 31, 2023 | ( |
( | ||||||
| October 31, 2022 | ( | |||||||
| July 31, 2022 | ( |
( | ||||||
| April 30, 2022 | ( | |||||||
| January 31, 2022 | ( | |||||||
Fiscal Year Ended |
Borrowings/Notes Payable Outstanding (in 000's) |
Asset Coverage per $1,000 of Borrowings/Notes Payable¹ |
October 3 1, 2023 |
$ |
$ |
October 31, 2022 |
||
October 31, 202 1 |
||
| October 31, 2020 | ||
| October 31, 2019 | ||
| October 31, 2018 2 |
||
| August 31, 2018 | ||
| August 31, 2017 | ||
| August 31, 2016 | ||
| August 31, 2015 | ||
| August 31, 2014 |
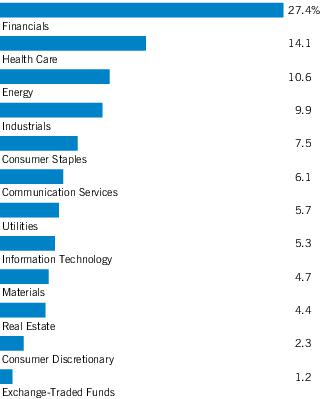
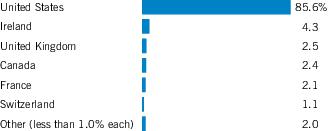
| Country Concentration of Portfolio | ||
Country |
Percentage of Total Investments |
Value |
| United States | 84.4% | $1,732,438,660 |
| Ireland | 4.3 | 87,601,001 |
| United Kingdom | 2.5 | 51,983,885 |
| Canada | 2.4 | 49,059,074 |
| France | 2.1 | 43,853,016 |
| Switzerland | 1.1 | 22,570,434 |
| Mexico | 0.7 | 14,288,498 |
| Australia | 0.6 | 12,610,034 |
| Italy | 0.3 | 6,771,668 |
| Spain | 0.2 | 4,461,000 |
| Netherlands | 0.1 | 1,456,358 |
| Colombia | 0.1 | 1,089,000 |
| Exchange-Traded Funds | 1.2 | 24,953,181 |
Total Investments |
100.0% |
$2,053,135,809 |
Abbreviations: | |
| REITs | – Real Estate Investment Trusts |
| SOFR | – Secured Overnight Financing Rate |
October 31, 2023 | |
| Assets | |
| Unaffiliated investments, at value (identified cost $1,867,316,115) — including $392,588,598 of securities on loan | $2,036,336,610 |
| Affiliated investments, at value (identified cost $16,799,199) | 16,799,199 |
| Cash | 97,703 |
| Foreign currency, at value (identified cost $2,617) | 2,413 |
| Interest and dividends receivable | 6,063,970 |
| Dividends receivable from affiliated investments | 101,792 |
| Tax reclaims receivable | 49,627 |
| Trustees' deferred compensation plan | 245,038 |
Total assets |
$2,059,696,352 |
| Liabilities | |
| Liquidity Agreement borrowings | $447,000,000 |
| Payable to affiliates: | |
| Investment adviser fee | 1,503,147 |
| Trustees' fees | 9,042 |
| Trustees' deferred compensation plan | 245,038 |
| Accrued expenses | 2,778,236 |
Total liabilities |
$451,535,463 |
Net Assets |
$1,608,160,889 |
| Sources of Net Assets | |
| Common shares, $0.01 par value, unlimited number of shares authorized | $745,428 |
| Additional paid-in capital | 1,425,380,066 |
| Distributable earnings | 182,035,395 |
Net Assets |
$1,608,160,889 |
| Net Asset Value Per Common Share | |
Net assets ÷ common shares issued and outstanding |
$21.57 |
Year Ended | |
October 31, 2023 | |
| Investment Income | |
| Dividend income (net of foreign taxes withheld of $328,205) | $47,605,256 |
| Dividend income from affiliated investments | 595,873 |
| Interest income | 20,456,327 |
| Other income | 12,935,682 |
Total investment income |
$81,593,138 |
| Expenses | |
| Investment adviser fee | $18,707,733 |
| Trustees’ fees and expenses | 108,319 |
| Custodian fee | 476,636 |
| Transfer and dividend disbursing agent fees | 18,940 |
| Legal and accounting services | 144,839 |
| Printing and postage | 518,222 |
| Interest expense and fees | 24,728,797 |
| Miscellaneous | 115,452 |
Total expenses |
$44,818,938 |
| Deduct: | |
| Waiver and/or reimbursement of expenses by affiliates | $18,124 |
Total expense reductions |
$18,124 |
Net expenses |
$44,800,814 |
Net investment income |
$36,792,324 |
| Realized and Unrealized Gain (Loss) | |
| Net realized gain (loss): | |
| Investment transactions | $100,707,159 |
| Proceeds from securities litigation settlements | 33,068 |
| Foreign currency transactions | (100,258) |
Net realized gain |
$100,639,969 |
| Change in unrealized appreciation (depreciation): | |
| Investments | $(170,898,408) |
| Foreign currency | 23,315 |
Net change in unrealized appreciation (depreciation) |
$(170,875,093) |
Net realized and unrealized loss |
$(70,235,124) |
Net decrease in net assets from operations |
$(33,442,800) |
Year Ended October 31, | ||
2023 |
2022 | |
| Increase (Decrease) in Net Assets | ||
| From operations: | ||
| Net investment income | $36,792,324 | $42,568,109 |
| Net realized gain | 100,639,969 | 100,954,837 |
| Net change in unrealized appreciation (depreciation) | (170,875,093) | (354,193,412) |
Net decrease in net assets from operations |
$(33,442,800) |
$(210,670,466) |
Distributions to shareholders |
$(133,103,592) |
$(144,381,379) |
| Capital share transactions: | ||
| Proceeds from shelf offering, net of offering costs (see Note 5) | $— | $17,268,194 |
| Reinvestment of distributions | — | 5,492,334 |
Net increase in net assets from capital share transactions |
$— |
$22,760,528 |
Net decrease in net assets |
$(166,546,392) |
$(332,291,317) |
| Net Assets | ||
| At beginning of year | $1,774,707,281 | $2,106,998,598 |
At end of year |
$1,608,160,889 |
$1,774,707,281 |
Year Ended | |
October 31, 2023 | |
| Cash Flows From Operating Activities | |
| Net decrease in net assets from operations | $(33,442,800) |
| Adjustments to reconcile net decrease in net assets from operations to net cash provided by operating activities: | |
| Investments purchased | (648,779,860) |
| Investments sold | 762,840,701 |
| Increase in short-term investments, net | (16,799,199) |
| Net amortization/accretion of premium (discount) | 335,019 |
| Decrease in interest and dividends receivable | 414,798 |
| Increase in dividends receivable from affiliated investments | (71,481) |
| Decrease in receivable from the transfer agent | 553,202 |
| Decrease in tax reclaims receivable | 71,616 |
| Increase in Trustees’ deferred compensation plan | (245,038) |
| Decrease in payable to affiliate for investment adviser fee | (23,001) |
| Decrease in payable to affiliate for Trustees' fees | (181) |
| Increase in payable to affiliate for Trustees' deferred compensation plan | 245,038 |
| Increase in accrued expenses | 1,005,107 |
| Net change in unrealized (appreciation) depreciation from investments | 170,898,408 |
| Net realized gain from investments | (100,707,159) |
Net cash provided by operating activities |
$136,295,170 |
| Cash Flows From Financing Activities | |
| Cash distributions paid | $(133,103,592) |
| Decrease in due to custodian | (3,091,462) |
Net cash used in financing activities |
$(136,195,054) |
Net increase in cash* |
$100,116 |
Cash at beginning of year (including foreign currency) |
$— |
Cash at end of year (including foreign currency) |
$100,116 |
| Supplemental disclosure of cash flow information: | |
| Cash paid for interest and fees on borrowings | $23,776,166 |
| * | Includes net change in unrealized (appreciation) depreciation on foreign currency of $204. |
Year Ended October 31, | |||||
2023 |
2022 |
2021 |
2020 |
2019 | |
| Net asset value — Beginning of year | $23.810 | $28.610 | $21.010 | $24.340 | $22.640 |
| Income (Loss) From Operations | |||||
| Net investment income (1) |
$0.494 | $0.575 | $0.603 | $0.622 | $0.577 |
| Net realized and unrealized gain (loss) | (0.948) | (3.428) | 8.790 | (2.212) | 2.862 |
Total income (loss) from operations |
$(0.454) |
$(2.853) |
$9.393 |
$(1.590) |
$3.439 |
| Less Distributions | |||||
| From net investment income | $(0.444) | $(0.581) | $(0.594) | $(0.591) | $(0.560) |
| From net realized gain | (1.342) | (1.370) | (1.199) | (1.149) | (1.180) |
Total distributions |
$(1.786) |
$(1.951) |
$(1.793) |
$(1.740) |
$(1.740) |
Premium from common shares sold through shelf offering (see Note 5) (1) |
$— |
$0.004 |
$0.000 (2) |
$0.000 (2) |
$0.001 |
Net asset value — End of year |
$21.570 |
$23.810 |
$28.610 |
$21.010 |
$24.340 |
Market value — End of year |
$19.290 |
$24.420 |
$29.360 |
$18.730 |
$24.950 |
Total Investment Return on Net Asset Value (3) |
(1.99)% |
(10.19)% |
45.70% |
(6.13)% |
16.02% |
Total Investment Return on Market Value (3) |
(14.54)% |
(10.24)% |
67.72% |
(18.36)% |
21.44% |
| Ratios/Supplemental Data | |||||
| Net assets, end of year (000’s omitted) | $1,608,161 | $1,774,707 | $2,106,999 | $1,544,154 | $1,784,376 |
| Ratios (as a percentage of average daily net assets): | |||||
| Expenses excluding interest and fees | 1.13% | 1.11% | 1.10% | 1.17% | 1.14% |
| Interest and fee expense | 1.40% | 0.40% | 0.14% | 0.42% | 0.81% |
| Total expenses | 2.53% (4) |
1.51% (4) |
1.24% | 1.59% | 1.95% |
| Net investment income | 2.08% | 2.21% | 2.26% | 2.81% | 2.51% |
| Portfolio Turnover | 29% | 31% | 30% | 54% | 49% |
| Senior Securities: | |||||
| Total amount outstanding (in 000’s) | $447,000 | $447,000 | $447,000 | $447,000 | $447,000 |
| Asset coverage per $1,000 (5) |
$4,598 | $4,970 | $5,714 | $4,454 | $4,992 |
(1) |
Computed using average shares outstanding. |
(2) |
Amount is less than $0.0005. |
(3) |
Returns are historical and are calculated by determining the percentage change in net asset value or market value with all distributions reinvested. Distributions are assumed to be reinvested at prices obtained under the Fund's dividend reinvestment plan. |
(4) |
Includes a reduction by the investment adviser of a portion of its adviser fee due to the Fund's investment in the Liquidity Fund (equal to less than 0.005% of average daily net assets for the years ended October 31, 2023 and 2022). |
(5) |
Calculated by subtracting the Fund’s total liabilities (not including the borrowings payable/notes payable) from the Fund’s total assets, and dividing the result by the borrowings payable/notes payable balance in thousands. |
Year Ended October 31, | ||
2023 |
2022 | |
| Ordinary income | $33,096,554 | $43,017,993 |
| Long-term capital gains | $100,007,038 | $101,363,386 |
| Undistributed long-term capital gains | $ 11,127,994 |
| Net unrealized appreciation | 168,991,070 |
| Other temporary differences | 1,916,331 |
Distributable earnings |
$182,035,395 |
Aggregate cost |
$1,884,144,533 |
| Gross unrealized appreciation | $360,376,102 |
| Gross unrealized depreciation | (191,384,826) |
Net unrealized appreciation |
$168,991,276 |
Average Daily Gross Assets |
Annual Fee Rate |
| Up to and including $1.5 billion | 0.850% |
| Over $1.5 billion up to and including $3 billion | 0.830% |
| Over $3 billion up to and including $5 billion | 0.810% |
| Over $5 billion | 0.790% |
Name |
Value, beginning of period |
Purchases |
Sales proceeds |
Net realized gain (loss) |
Change in unrealized appreciation (depreciation) |
Value, end of period |
Dividend income |
Shares, end of period |
Short-Term Investments | ||||||||
| Liquidity Fund | $ — | $384,271,688 | $(367,472,489) | $ — | $ — | $16,799,199 | $595,873 | 16,799,199 |
| • | Level 1 – quoted prices in active markets for identical investments |
| • | Level 2 – other significant observable inputs (including quoted prices for similar investments, interest rates, prepayment speeds, credit risk, etc.) |
| • | Level 3 – significant unobservable inputs (including a fund's own assumptions in determining the fair value of investments) |
Asset Description |
Level 1 |
Level 2 |
Level 3 |
Total |
| Common Stocks: | ||||
| Communication Services | $ 112,369,217 | $ — | $ — | $ 112,369,217 |
| Consumer Discretionary | 46,637,853 | — | — | 46,637,853 |
| Consumer Staples | 144,569,293 | — | — | 144,569,293 |
| Energy | 160,876,798 | — | — | 160,876,798 |
| Financials | 282,231,390 | — | — | 282,231,390 |
| Health Care | 259,889,541 | 28,985,441 | — | 288,874,982 |
| Industrials | 202,749,887 | — | — | 202,749,887 |
| Information Technology | 110,075,061 | — | — | 110,075,061 |
| Materials | 95,744,412 | — | — | 95,744,412 |
| Real Estate | 81,951,580 | — | — | 81,951,580 |
| Utilities | 89,770,428 | — | — | 89,770,428 |
Total Common Stocks |
$1,586,865,460 |
$28,985,441* |
$ — |
$1,615,850,901 |
| Corporate Bonds | $ — | $310,163,089 | $ — | $ 310,163,089 |
| Exchange-Traded Funds | 24,953,181 | — | — | 24,953,181 |
| Preferred Stocks: | ||||
| Communication Services | 5,836,488 | — | — | 5,836,488 |
| Energy | 24,348,085 | — | — | 24,348,085 |
| Financials | 25,889,293 | 10,124,822 | — | 36,014,115 |
| Real Estate | 8,017,633 | — | — | 8,017,633 |
| Utilities | 11,153,118 | — | — | 11,153,118 |
Total Preferred Stocks |
$ 75,244,617 |
$ 10,124,822 |
$ — |
$ 85,369,439 |
| Short-Term Investments | $ 16,799,199 | $ — | $ — | $ 16,799,199 |
Total Investments |
$1,703,862,457 |
$349,273,352 |
$ — |
$2,053,135,809 |
| * | Includes foreign equity securities whose values were adjusted to reflect market trading of comparable securities or other correlated instruments that occurred after the close of trading in their applicable foreign markets. |
Number of Shares | ||||
Nominees for Trustee |
For |
Withheld | ||
| Alan C. Bowser | 58,758,768 | 3,151,944 | ||
| Keith Quinton | 58,934,708 | 2,976,004 | ||
| Scott E. Wennerholm | 58,834,129 | 3,076,583 | ||
| Please print exact name on account | |
| Shareholder signature | Date |
| Shareholder signature | Date |
| Please sign exactly as your common shares are registered. All persons whose names appear on the share certificate must sign. | |
Name and Year of Birth |
Fund Position(s) |
Length of Service |
Principal Occupation(s) and Other Directorships During Past Five Years and Other Relevant Experience |
| Interested Trustee | |||
| Anchal Pachnanda (1) 1980 |
Class III Trustee |
Until 2024. 3 years. Since 2023. |
Co-Head of Strategy of MSIM (since 2019). Formerly, Head of Strategy of MSIM (2017-2019). Ms. Pachnanda is an interested person because of her position with MSIM, which is an affiliate of the Fund. Other Directorships |
| Noninterested Trustees | |||
| Alan C. Bowser (2) 1962 |
Class II Trustee |
Until 2026. 3 years. Since 2023. |
Private investor. Formerly, Chief Diversity Officer, Partner and a member of the Operating Committee, and formerly served as Senior Advisor on Diversity and Inclusion for the firm's chief executive officer, Co-Head of the Americas Region, and Senior Client Advisor of Bridgewater Associates, an asset management firm (2011- 2023). Other Directorships |
| Mark R. Fetting 1954 |
Class III Trustee |
Until 2024. 3 years. Since 2016. |
Private investor. Formerly held various positions at Legg Mason, Inc. (investment management firm) (2000-2012), including President, Chief Executive Officer, Director and Chairman (2008-2012), Senior Executive Vice President (2004-2008) and Executive Vice President (2001-2004). Formerly, President of Legg Mason family of funds (2001-2008). Formerly, Division President and Senior Officer of Prudential Financial Group, Inc. and related companies (investment management firm) (1991-2000). Other Directorships. |
| Cynthia E. Frost 1961 |
Class I Trustee |
Until 2025. 3 years. Since 2014. |
Private investor. Formerly, Chief Investment Officer of Brown University (university endowment) (2000-2012). Formerly, Portfolio Strategist for Duke Management Company (university endowment manager) (1995-2000). Formerly, Managing Director, Cambridge Associates (investment consulting company) (1989-1995). Formerly, Consultant, Bain and Company (management consulting firm) (1987-1989). Formerly, Senior Equity Analyst, BA Investment Management Company (1983-1985). Other Directorships. |
| George J. Gorman 1952 |
Chairperson of the Board and Class III Trustee |
Until 2024. 3 years. Chairperson of the Board since 2021 and Trustee since 2014. |
Principal at George J. Gorman LLC (consulting firm). Formerly, Senior Partner at Ernst & Young LLP (a registered public accounting firm) (1974-2009). Other Directorships. |
Name and Year of Birth |
Fund Position(s) |
Length of Service |
Principal Occupation(s) and Other Directorships During Past Five Years and Other Relevant Experience |
| Noninterested Trustees | |||
| Valerie A. Mosley 1960 |
Class I Trustee |
Until 2025. 3 years. Since 2014. |
Chairwoman and Chief Executive Officer of Valmo Ventures (a consulting and investment firm). Founder of Upward Wealth, Inc., dba BrightUP, a fintech platform. Formerly, Partner and Senior Vice President, Portfolio Manager and Investment Strategist at Wellington Management Company, LLP (investment management firm) (1992-2012). Formerly, Chief Investment Officer, PG Corbin Asset Management (1990-1992). Formerly worked in institutional corporate bond sales at Kidder Peabody (1986-1990). Other Directorships. |
| Keith Quinton 1958 |
Class II Trustee |
Until 2026. 3 years Since 2018. |
Private investor, researcher and lecturer. Formerly, Independent Investment Committee Member at New Hampshire Retirement System (2017-2021). Formerly, Portfolio Manager and Senior Quantitative Analyst at Fidelity Investments (investment management firm) (2001-2014). Other Directorships. |
| Marcus L. Smith 1966 |
Class III Trustee |
Until 2024. 3 years. Since 2018. |
Private investor and independent corporate director. Formerly, Chief Investment Officer, Canada (2012-2017), Chief Investment Officer, Asia (2010-2012), Director of Asian Research (2004-2010) and portfolio manager (2001-2017) at MFS Investment Management (investment management firm). Other Directorships. |
| Susan J. Sutherland 1957 |
Class I Trustee |
Until 2025. 3 years. Since 2015. |
Private investor. Director of Ascot Group Limited and certain of its subsidiaries (insurance and reinsurance) (since 2017). Formerly, Director of Hagerty Holding Corp. (insurance) (2015-2018) and Montpelier Re Holdings Ltd. (insurance and reinsurance) (2013-2015). Formerly, Associate, Counsel and Partner at Skadden, Arps, Slate, Meagher & Flom LLP (law firm) (1982-2013). Other Directorships. |
| Scott E. Wennerholm 1959 |
Class II Trustee |
Until 2026. 3 years. Since 2016 |
Private Investor. Formerly, Trustee at Wheelock College (postsecondary institution) (2012-2018). Formerly, Consultant at GF Parish Group (executive recruiting firm) (2016-2017). Formerly, Chief Operating Officer and Executive Vice President at BNY Mellon Asset Management (investment management firm) (2005-2011). Formerly, Chief Operating Officer and Chief Financial Officer at Natixis Global Asset Management (investment management firm) (1997-2004). Formerly, Vice President at Fidelity Investments Institutional Services (investment management firm) (1994-1997). Other Directorships. |
| Nancy A. Wiser 1967 |
Class I Trustee |
Until 2025. 3 years. Since 2022. |
Formerly, Executive Vice President and the Global Head of Operations at Wells Fargo Asset Management (2011-2021). Other Directorships. |
Name and Year of Birth |
Fund Position(s) |
Length of Service |
Principal Occupation(s) During Past Five Years |
| Principal Officers who are not Trustees | |||
| R. Kelly Williams, Jr. 1971 |
President | Since 2023 | President and Chief Operating Officer of Atlanta Capital Management Company, LLC. Officer of 21 registered investment companies managed by Eaton Vance or BMR. |
| Deidre E. Walsh 1971 |
Vice President and Chief Legal Officer |
Since 2009 | Vice President of EVM and BMR. Also Vice President of CRM. |
| James F. Kirchner 1967 |
Treasurer | Since 2007 | Vice President of EVM and BMR. Also Vice President of CRM. |
Name and Year of Birth |
Fund Position(s) |
Length of Service |
Principal Occupation(s) During Past Five Years |
| Principal Officers who are not Trustees | |||
| Nicholas S. Di Lorenzo 1987 |
Secretary | Since 2022 | Formerly, associate (2012-2021) and counsel (2022) at Dechert LLP. |
| Richard F. Froio 1968 |
Chief Compliance Officer |
Since 2017 | Vice President of EVM and BMR since 2017. Formerly, Deputy Chief Compliance Officer (Adviser/Funds) and Chief Compliance Officer (Distribution) at PIMCO (2012-2017) and Managing Director at BlackRock/Barclays Global Investors (2009-2012). |
| Privacy Notice | April 2021 |
FACTS |
WHAT DOES EATON VANCE DO WITH YOUR PERSONAL INFORMATION? |
Why? |
Financial companies choose how they share your personal information. Federal law gives consumers the right to limit some but not all sharing. Federal law also requires us to tell you how we collect, share, and protect your personal information. Please read this notice carefully to understand what we do. |
What? |
The types of personal information we collect and share depend on the product or service you have with us. This information can include:■ Social Security number and income ■ investment experience and risk tolerance ■ checking account number and wire transfer instructions |
How? |
All financial companies need to share customers’ personal information to run their everyday business. In the section below, we list the reasons financial companies can share their customers’ personal information; the reasons Eaton Vance chooses to share; and whether you can limit this sharing. |
Reasons we can share your personal information |
Does Eaton Vance share? |
Can you limit this sharing? |
For our everyday business purposes — such as to process your transactions, maintain your account(s), respond to court orders and legal investigations, or report to credit bureaus |
Yes | No |
For our marketing purposes — to offer our products and services to you |
Yes | No |
For joint marketing with other financial companies |
No | We don’t share |
For our investment management affiliates’ everyday business purposes — information about your transactions, experiences, and creditworthiness |
Yes | Yes |
For our affiliates’ everyday business purposes — information about your transactions and experiences |
Yes | No |
For our affiliates’ everyday business purposes — information about your creditworthiness |
No | We don’t share |
For our investment management affiliates to market to you |
Yes | Yes |
For our affiliates to market to you |
No | We don’t share |
For nonaffiliates to market to you |
No | We don’t share |
To limit our sharing |
Call toll-free 1-800-262-1122 or email: EVPrivacy@eatonvance.com Please note: new no longer |
Questions? |
Call toll-free 1-800-262-1122 or email: EVPrivacy@eatonvance.com |
| Privacy Notice — continued | April 2021 |
Who we are | |
Who is providing this notice? |
Eaton Vance Management, Eaton Vance Distributors, Inc., Eaton Vance Trust Company, Eaton Vance Management (International) Limited, Eaton Vance Advisers International Ltd., Eaton Vance Global Advisors Limited, Eaton Vance Management’s Real Estate Investment Group, Boston Management and Research, Calvert Research and Management, Eaton Vance and Calvert Fund Families and our investment advisory affiliates (“Eaton Vance”) (see Investment Management Affiliates definition below) |
What we do | |
How does Eaton Vance protect my personal information? |
To protect your personal information from unauthorized access and use, we use security measures that comply with federal law. These measures include computer safeguards and secured files and buildings. We have policies governing the proper handling of customer information by personnel and requiring third parties that provide support to adhere to appropriate security standards with respect to such information. |
How does Eaton Vance collect my personal information? |
We collect your personal information, for example, when you■ open an account or make deposits or withdrawals from your account ■ buy securities from us or make a wire transfer ■ give us your contact informationWe also collect your personal information from others, such as credit bureaus, affiliates, or other companies. |
Why can’t I limit all sharing? |
Federal law gives you the right to limit only■ sharing for affiliates’ everyday business purposes — information about your creditworthiness ■ affiliates from using your information to market to you ■ sharing for nonaffiliates to market to youState laws and individual companies may give you additional rights to limit sharing. See below for more on your rights under state law. |
Definitions | |
Investment Management Affiliates |
Eaton Vance Investment Management Affiliates include registered investment advisers, registered broker- dealers, and registered and unregistered funds. Investment Management Affiliates does not include entities associated with Morgan Stanley Wealth Management, such as Morgan Stanley Smith Barney LLC and Morgan Stanley & Co. |
Affiliates |
Companies related by common ownership or control. They can be financial and nonfinancial companies.■ Our affiliates include companies with a Morgan Stanley name and financial companies such as Morgan Stanley Smith Barney LLC and Morgan Stanley & Co. |
Nonaffiliates |
Companies not related by common ownership or control. They can be financial and nonfinancial companies.■ Eaton Vance does not share with nonaffiliates so they can market to you. |
Joint marketing |
A formal agreement between nonaffiliated financial companies that together market financial products or services to you.■ Eaton Vance doesn’t jointly market. |
Other important information | |
Vermont: Except as permitted by law, we will not share personal information we collect about Vermont residents with Nonaffiliates unless you provide us with your written consent to share such information. California: Except as permitted by law, we will not share personal information we collect about California residents with Nonaffiliates and we will limit sharing such personal information with our Affiliates to comply with California privacy laws that apply to us. | |
Item 2. Code of Ethics
The registrant (sometimes referred to as the “Fund”) has adopted a code of ethics applicable to its Principal Executive Officer, Principal Financial Officer and Principal Accounting Officer. The registrant undertakes to provide a copy of such code of ethics to any person upon request, without charge, by calling 1-800-262-1122. The registrant has not amended the code of ethics as described in Form N-CSR during the period covered by this report. The registrant has not granted any waiver, including an implicit waiver, from a provision of the code of ethics as described in Form N-CSR during the period covered by this report.
Item 3. Audit Committee Financial Expert
The registrant’s Board of Trustees (the “Board”) has designated George J. Gorman and Scott E. Wennerholm, each an independent trustee, as audit committee financial experts. Mr. Gorman is a certified public accountant who is the Principal at George J. Gorman LLC (a consulting firm). Previously, Mr. Gorman served in various capacities at Ernst & Young LLP (a registered public accounting firm), including as Senior Partner.
Mr. Gorman also has experience serving as an independent trustee and audit committee financial expert of other mutual fund complexes. Mr. Wennerholm is a private investor. Previously, Mr. Wennerholm served as a Trustee at Wheelock College (postsecondary institution), as a Consultant at GF Parish Group (executive recruiting firm), Chief Operating Officer and Executive Vice President at BNY Mellon Asset Management (investment management firm), Chief Operating Officer and Chief Financial Officer at Natixis Global Asset Management (investment management firm), and Vice President at Fidelity Investments Institutional Services (investment management firm).
Item 4. Principal Accountant Fees and Services
(a)-(d)
The following table presents the aggregate fees billed to the registrant for the registrant’s fiscal years ended October 31, 2022 and October 31, 2023 by the registrant’s principal accountant, Deloitte & Touche LLP (“D&T”), for professional services rendered for the audit of the registrant’s annual financial statements and fees billed for other services rendered by D&T during such periods.
| Fiscal Years Ended |
10/31/22 | 10/31/23 | ||||||
| Audit Fees |
$ | 68,200 | $ | 70,200 | ||||
| Audit-Related Fees(1) |
$ | 0 | $ | 0 | ||||
| Tax Fees(2) |
$ | 1,850 | $ | 0 | ||||
| All Other Fees(3) |
$ | 0 | $ | 0 | ||||
|
|
|
|
|
|||||
| Total |
$ | 70,050 | $ | 70,200 | ||||
|
|
|
|
|
|||||
| (1) | Audit-related fees consist of the aggregate fees billed for assurance and related services that are reasonably related to the performance of the audit of the registrant’s financial statements and are not reported under the category of audit fees. |
| (2) | Tax fees consist of the aggregate fees billed for professional services rendered by the principal accountant relating to tax compliance, tax advice, and tax planning and specifically include fees for tax return preparation and other related tax compliance/planning matters. |
| (3) | All other fees consist of the aggregate fees billed for products and services provided by the principal accountant other than audit, audit-related, and tax services. |
(e)(1) The registrant’s audit committee has adopted policies and procedures relating to the pre-approval of services provided by the registrant’s principal accountant (the “Pre-Approval Policies”). The Pre-Approval Policies establish a framework intended to assist the audit committee in the proper discharge of its pre-approval responsibilities. As a general matter, the Pre-Approval Policies (i) specify certain types of audit, audit-related, tax, and other services determined to be pre-approved by the audit committee; and (ii) delineate specific procedures governing the mechanics of the pre-approval process, including the approval and monitoring of audit and non-audit service fees. Unless a service is specifically pre-approved under the Pre-Approval Policies, it must be separately pre-approved by the audit committee.
The Pre-Approval Policies and the types of audit and non-audit services pre-approved therein must be reviewed and ratified by the registrant’s audit committee at least annually. The registrant’s audit committee maintains full responsibility for the appointment, compensation, and oversight of the work of the registrant’s principal accountant.
(e)(2) No services described in paragraphs (b)-(d) above were approved by the registrant’s audit committee pursuant to the “de minimis exception” set forth in Rule 2-01 (c)(7)(i)(C) of Regulation S-X.
(f) Not applicable.
(g) The following table presents (i) the aggregate non-audit fees (i.e., fees for audit-related, tax, and other services) billed for services rendered to the registrant by D&T for the registrant’s fiscal years ended October 31, 2022 and October 31, 2023; and (ii) the aggregate non-audit fees (i.e., fees for audit-related, tax, and other services) billed for services rendered to the Eaton Vance organization by D&T for the same time periods.
| Fiscal Years Ended |
10/31/22 | 10/31/23 | ||||||
| Registrant |
$ | 1,850 | $ | 0 | ||||
| Eaton Vance(1) |
$ | 52,836 | $ | 0 | ||||
| (1) | Eaton Vance Management, a subsidiary of Morgan Stanley, acts as the registrant’s investment adviser and administrator. |
(h) The registrant’s audit committee has considered whether the provision by the registrant’s principal accountant of non-audit services to the registrant’s investment adviser and any entity controlling, controlled by, or under common control with the adviser that provides ongoing services to the registrant that were not pre-approved pursuant to Rule 2-01(c)(7)(ii) of Regulation S-X is compatible with maintaining the principal accountant’s independence.
(i) Not applicable.
(j) Not applicable.
Item 5. Audit Committee of Listed Registrants
The registrant has a separately-designated standing audit committee established in accordance with Section 3(a)(58)(A) of the Securities and Exchange Act of 1934, as amended. George J. Gorman, Keith Quinton, Scott E. Wennerholm (Chair), and Nancy A. Wiser are the members of the registrant’s audit committee.
Item 6. Schedule of Investments
Please see schedule of investments contained in the Report to Stockholders included under Item 1 of this Form N-CSR.
Item 7. Disclosure of Proxy Voting Policies and Procedures for Closed-End Management Investment Companies
The Board of the Fund has adopted a proxy voting policy and procedure (the “Fund Policy”), pursuant to which the trustees have delegated proxy voting responsibility to the Fund’s investment adviser and adopted the investment adviser’s proxy voting policies and procedures (the “Policies”) which are described below. The trustees will review the Policies annually. In the event that a conflict of interest arises between the Fund’s shareholders and the investment adviser, the administrator, or any of their affiliates or any affiliate of the Fund, the investment adviser will generally refrain from voting the proxies related to the companies giving rise to such conflict until it consults with the Board, or any committee, sub-committee or group of independent trustees identified by the Board, which will instruct the investment adviser on the appropriate course of action. If the Board Members are unable to meet and the failure to vote a proxy would have a material adverse impact on the Fund, the investment adviser may vote such proxy, provided that it discloses the existence of the material conflict to the Chairperson of the Fund’s Board as soon as practicable and to the Board at its next meeting.
The Policies are designed to promote accountability of a company’s management to its shareholders and to align the interests of management with those shareholders. An independent proxy voting service (“Agent”), currently Institutional Shareholder Services, Inc., has been retained to assist in the voting of proxies through the provision of vote analysis, implementation and recordkeeping and disclosure services. The investment adviser will generally vote proxies through the Agent. The Agent is required to vote all proxies in accordance with customized proxy voting guidelines (the “Guidelines”) and/or refer them back to the investment adviser pursuant to the Policies.
The Agent is required to establish and maintain adequate internal controls and policies in connection with the provision of proxy voting services, including methods to reasonably ensure that its analysis and recommendations are not influenced by a conflict of interest. The Guidelines include voting guidelines for matters relating to, among other things, the election of directors, approval of independent auditors, executive compensation, corporate structure and anti-takeover defenses. The investment adviser may cause the Fund to abstain from voting from time to time where it determines that the costs associated with voting a proxy outweigh the benefits derived from exercising the right to vote or it is unable to access or access timely ballots or other proxy information, among other stated reasons. The Agent will refer Fund proxies to the investment adviser for instructions under circumstances where, among others: (1) the application of the Guidelines is unclear; (2) a particular proxy question is not covered by the Guidelines; or (3) the Guidelines require input from the investment adviser. When a proxy voting issue has been referred to the investment adviser, the analyst (or portfolio manager if applicable) covering the company subject to the proxy proposal determines the final vote (or decision not to vote) and the investment adviser’s Proxy Administrator (described below) instructs the Agent to vote accordingly for securities held by the Fund. Where more than one analyst covers a particular company and the recommendations of such analysts voting a proposal conflict, the investment adviser’s Global Proxy Group (described below) will review such recommendations and any other available information related to the proposal and determine the manner in which it should be voted, which may result in different recommendations for the Fund that may differ from other clients of the investment adviser.
The investment adviser has appointed a Proxy Administrator to assist in the coordination of the voting of client proxies (including the Fund’s) in accordance with the Guidelines and the Policies. The investment adviser and its affiliates have also established a Global Proxy Group. The Global Proxy Group develops the investment adviser’s positions on all major corporate issues, creates the Guidelines and oversees the proxy voting process. The Proxy Administrator maintains a record of all proxy questions that have been referred by the Agent, all applicable recommendations, analysis and research received and any resolution of the matter. Before instructing the Agent to vote contrary to the Guidelines or the recommendation of the Agent, the Proxy Administrator will provide the Global Proxy Group with the Agent’s recommendation for the proposal along with any other relevant materials, including the basis for the analyst’s recommendation. The Proxy Administrator will then instruct the Agent to vote the proxy in the manner determined by the Global Proxy Group. A similar process will be followed if the Agent has a conflict of interest with respect to a proxy. The investment adviser will report to the Fund’s Board any votes cast contrary to the Guidelines or Agent recommendations, as applicable, no less than annually.
The investment adviser’s Global Proxy Group is responsible for monitoring and resolving possible material conflicts with respect to proxy voting. Because the Guidelines are predetermined and designed to be in the best interests of shareholders, application of the Guidelines to vote client proxies should, in most cases, adequately address any possible conflict of interest. The investment adviser will monitor situations that may result in a conflict of interest between any of its clients and the investment adviser or any of its affiliates by maintaining a list of significant existing and prospective corporate clients. The Proxy Administrator will compare such list with the names of companies of which he or she has been referred a proxy statement (the “Proxy Companies”). If a company on the list is also a Proxy Company, the Proxy Administrator will report that fact to the Global Proxy Group. If the Proxy Administrator intends to instruct the Agent to vote in a manner inconsistent with the Guidelines, the Global Proxy Group will first determine, in consultation with legal counsel if necessary,
whether a material conflict exists. If it is determined that a material conflict exists, the investment adviser will seek instruction on how the proxy should be voted from the Fund’s Board, or any committee or subcommittee identified by the Board. If a matter is referred to the Global Proxy Group, the decision made and basis for the decision will be documented by the Proxy Administrator and/or Global Proxy Group.
Information on how the Fund voted proxies relating to portfolio securities during the most recent 12 month period ended June 30 is available (1) without charge, upon request, by calling 1-800-262-1122, and (2) on the Securities and Exchange Commission’s website at http://www.sec.gov.
Item 8. Portfolio Managers of Closed-End Management Investment Companies
Eaton Vance Management (“EVM” or “Eaton Vance”) is the investment adviser of the Fund. Derek J.V. DiGregorio, Aaron S. Dunn, Bradley T. Galko and Joseph Mehlman, CFA comprise the investment team responsible for the overall management of the Fund’s investments.
Mr. DiGregorio is a Vice President of EVM and has been a portfolio manager of the Fund since July 2021. Mr. Dunn is a Vice President of EVM, is a member of EVM’s Equity Strategy Committee and has been a portfolio manager of the Fund since December 2017. Mr. Galko is a Vice President of EVM, has been an equity analyst at EVM since 2013 and has been a portfolio manager of the Fund since February 2020. Mr. Mehlman is a Vice President of EVM and a Managing Director at Morgan Stanley Investment Management Inc., an affiliate of EVM. Mr. Mehlman has been employed by the Morgan Stanley organization for more than five years and has been a portfolio manager of the Fund since November 2022. Messrs. DiGregorio, Dunn and Galko have been employed by EVM for more than five years. This information is provided as of the date of filing this report.
The following table shows, as of the Fund’s most recent fiscal year end, the number of accounts each portfolio manager managed in each of the listed categories and the total assets (in millions of dollars) in the accounts managed within each category. The table also shows the number of accounts with respect to which the advisory fee is based on the performance of the account, if any, and the total assets (in millions of dollars) in those accounts.
| Number of All Accounts |
Total Assets of All Accounts |
Number of Accounts Paying a Performance Fee |
Total Assets of Accounts Paying a Performance Fee |
|||||||||||||
| Derek J.V. DiGregorio(1) |
||||||||||||||||
| Registered Investment Companies |
7 | $ | 6,136.5 | 0 | $ | 0 | ||||||||||
| Other Pooled Investment Vehicles |
0 | $ | 0 | 0 | $ | 0 | ||||||||||
| Other Accounts |
0 | $ | 0 | 0 | $ | 0 | ||||||||||
| Aaron Dunn(2) |
||||||||||||||||
| Registered Investment Companies |
7 | $ | 5,801.7 | 0 | $ | 0 | ||||||||||
| Other Pooled Investment Vehicles |
1 | $ | 42.2 | 0 | $ | 0 | ||||||||||
| Other Accounts |
22 | $ | 101.8 | 0 | $ | 0 | ||||||||||
| Bradley T. Galko(2) |
||||||||||||||||
| Registered Investment Companies |
7 | $ | 5,801.7 | 0 | $ | 0 | ||||||||||
| Other Pooled Investment Vehicles |
1 | $ | 42.2 | 0 | $ | 0 | ||||||||||
| Other Accounts |
22 | $ | 1,650.8 | 0 | $ | 0 | ||||||||||
| Joseph Mehlman |
||||||||||||||||
| Registered Investment Companies |
2 | $ | 624.5 | 0 | $ | 0 | ||||||||||
| Other Pooled Investment Vehicles |
32 | $ | 4,856.9 | 0 | $ | 0 | ||||||||||
| Other Accounts |
41 | $ | 9,841.7 | 3 | $ | 1,455.8 | ||||||||||
| (1) | This portfolio manager serves as portfolio manager of one or more registered investment companies that invests or may invest in one or more underlying registered investment companies in the Eaton Vance family of funds or other pooled investment vehicles sponsored by Eaton Vance. The underlying investment companies may be managed by this portfolio manager or another portfolio manager. |
| (2) | This portfolio manager provides advisory services for certain of the “Other Accounts” on a nondiscretionary or model basis. For “Other Accounts” that are part of a wrap or model account program, the number of accounts is the number of sponsors for which the portfolio manager provides advisory services rather than the number of individual customer accounts within each wrap or model account program. The assets managed may include assets advised on a nondiscretionary or model basis. |
The following table shows the dollar range of Fund shares beneficially owned by each portfolio manager as of the Fund’s most recent fiscal year end.
| Portfolio Manager |
Dollar Range of Equity Securities Beneficially Owned in the Fund | |
| Derek J.V. DiGregorio |
None | |
| Aaron S. Dunn | $1 - $10,000 | |
| Bradley T. Galko | $1 - $10,000 | |
| Joseph Mehlman |
None |
Potential for Conflicts of Interest. It is possible that conflicts of interest may arise in connection with a portfolio manager’s management of the Fund’s investments on the one hand and the investments of other accounts for which a portfolio manager is responsible on the other. For example, a portfolio manager may have conflicts of interest in allocating management time, resources and investment opportunities among the Fund and other accounts he advises. In addition, due to differences in the investment strategies or restrictions between the Fund and the other accounts, the portfolio manager may take action with respect to another account that differs from the action taken with respect to the Fund. In some cases, another account managed by a portfolio manager may compensate the investment adviser based on the performance of the securities held by that account. The existence of such a performance based fee may create additional conflicts of interest for the portfolio manager in the allocation of management time, resources and investment opportunities. Whenever conflicts of interest arise, the portfolio manager will endeavor to exercise his discretion in a manner that he believes is equitable to all interested persons. EVM has adopted several policies and procedures designed to address these potential conflicts including a code of ethics and policies that govern the investment adviser’s trading practices, including among other things the aggregation and allocation of trades among clients, brokerage allocations, cross trades and best execution.
Compensation Structure for EVM
The compensation structure of Eaton Vance and its affiliates that are investment advisers (for purposes of this section “Eaton Vance”) is based on a total reward system of base salary and incentive compensation, which is paid either in the form of cash bonus, or for employees meeting the specified deferred compensation eligibility threshold, partially as a cash bonus and partially as mandatory deferred compensation. Deferred compensation granted to Eaton Vance employees is generally granted as a mix of deferred cash awards under the Investment Management Alignment Plan (IMAP) and equity-based awards in the form of stock units. The portion of incentive compensation granted in the form of a deferred compensation award and the terms of such awards are determined annually by the Compensation, Management Development and Succession Committee of Morgan Stanley.
Base salary compensation. Generally, portfolio managers receive base salary compensation based on the level of their position with the adviser.
Incentive compensation. In addition to base compensation, portfolio managers may receive discretionary year-end compensation. Incentive compensation may include:
| • | Cash bonus |
| • | Deferred compensation: |
| • | A mandatory program that defers a portion of incentive compensation into restricted stock units or other awards based on Morgan Stanley common stock or other plans that are subject to vesting and other conditions. |
| • | IMAP is a cash-based deferred compensation plan designed to increase the alignment of participants’ interests with the interests of clients. For eligible employees, a portion of their deferred compensation is mandatorily deferred into IMAP on an annual basis. Awards granted under IMAP are notionally invested in referenced funds available pursuant to the plan, which are funds advised by MSIM and its affiliates that are investment advisers. Portfolio managers are required to notionally invest a minimum of 40% of their account balance in the designated funds that they manage and are included in the IMAP notional investment fund menu. |
| • | Deferred compensation awards are typically subject to vesting over a multi-year period and are subject to cancellation through the payment date for competition, cause (i.e., any act or omission that constitutes a breach of obligation to the Funds, including failure to comply with internal compliance, ethics or risk management standards, and failure or refusal to perform duties satisfactorily, including supervisory and management duties), disclosure of proprietary information, and solicitation of employees or clients. Awards are also subject to clawback through the payment date if an employee’s act or omission (including with respect to direct supervisory responsibilities) causes a restatement of the firm’s consolidated financial results, constitutes a violation of the firm’s global risk management principles, policies and standards, or causes a loss of revenue associated with a position on which the employee was paid and the employee operated outside of internal control policies. |
Eaton Vance compensates employees based on principles of pay-for-performance, market competitiveness and risk management. Eligibility for, and the amount of any, discretionary compensation is subject to a multi-dimensional process. Specifically, consideration is given to one or more of the following factors, which can vary by portfolio management team and circumstances:
| • | Revenue and profitability of the business and/or each fund/account managed by the portfolio manager |
| • | Revenue and profitability of the Firm |
| • | Return on equity and risk factors of both the business units and Morgan Stanley |
| • | Assets managed by the portfolio manager |
| • | External market conditions |
| • | New business development and business sustainability |
| • | Contribution to client objectives |
| • | Team, product and/or MSIM and its affiliates that are investment advisers (including Eaton Vance) performance |
| • | The pre-tax investment performance of the funds/accounts managed by the portfolio manager (which may, in certain cases, be measured against the applicable benchmark(s) and/or peer group(s) over one, three and five-year periods) |
| • | Individual contribution and performance |
Further, the firm’s Global Incentive Compensation Discretion Policy requires compensation managers to consider Further the only legitimate, business related factors when exercising discretion in determining variable incentive compensation, including adherence to Morgan Stanley’s core values, conduct, disciplinary actions in the current performance year, risk management and risk outcomes.
Item 9. Purchases of Equity Securities by Closed-End Management Investment Company and Affiliated Purchasers
No such purchases this period.
Item 10. Submission of Matters to a Vote of Security Holders
No material changes.
Item 11. Controls and Procedures
(a) It is the conclusion of the registrant’s principal executive officer and principal financial officer that the effectiveness of the registrant’s current disclosure controls and procedures (such disclosure controls and procedures having been evaluated within 90 days of the date of this filing) provide reasonable assurance that the information required to be disclosed by the registrant has been recorded, processed, summarized and reported within the time period specified in the Commission’s rules and forms and that the information required to be disclosed by the registrant has been accumulated and communicated to the registrant’s principal executive officer and principal financial officer in order to allow timely decisions regarding required disclosure.
(b) There have been no changes in the registrant’s internal controls over financial reporting during the period covered by this report that has materially affected, or is reasonably likely to materially affect, the registrant’s internal control over financial reporting.
Item 12. Disclosure of Securities Lending Activities for Closed-End Management Investment Companies
The registrant did not accrue any income or fees/compensation related to its securities lending activities during its most recent fiscal year. See Liquidity Agreement note in the financial statements for further information.
Item 13. Exhibits
| (a)(1) | Registrant’s Code of Ethics – Not applicable (please see Item 2). | |
| (a)(2)(i) | Treasurer’s Section 302 certification. | |
| (a)(2)(ii) | President’s Section 302 certification. | |
| (b) | Combined Section 906 certification. | |
| (c) | Registrant’s notices to shareholders pursuant to Registrant’s exemptive order granting an exemption from Section 19(b) of the 1940 Act and Rule 19b-1 thereunder regarding distributions paid pursuant to the Registrant’s Managed Distribution Plan. | |
| (d) | Consent of Independent Registered Public Accounting Firm. | |
Signatures
Pursuant to the requirements of the Securities Exchange Act of 1934 and the Investment Company Act of 1940, the registrant has duly caused this report to be signed on its behalf by the undersigned, thereunto duly authorized.
| Eaton Vance Tax-Advantaged Dividend Income Fund | ||
| By: | /s/ R. Kelly Williams, Jr. | |
| R. Kelly Williams, Jr. | ||
| President | ||
| Date: | December 22, 2023 | |
Pursuant to the requirements of the Securities Exchange Act of 1934 and the Investment Company Act of 1940, this report has been signed below by the following persons on behalf of the registrant and in the capacities and on the dates indicated.
| By: | /s/ James F. Kirchner | |
| James F. Kirchner | ||
| Treasurer | ||
| Date: | December 22, 2023 | |
| By: | /s/ R. Kelly Williams, Jr. | |
| R. Kelly Williams, Jr. | ||
| President | ||
| Date: | December 22, 2023 | |
Eaton Vance Tax-Advantaged Dividend Income Fund
FORM N-CSR
Exhibit 13(a)(2)(i)
CERTIFICATION
I, James F. Kirchner, certify that:
1. I have reviewed this report on Form N-CSR of Eaton Vance Tax-Advantaged Dividend Income Fund;
2. Based on my knowledge, this report does not contain any untrue statement of a material fact or omit to state a material fact necessary to make the statements made, in light of the circumstances under which such statements were made, not misleading with respect to the period covered by this report;
3. Based on my knowledge, the financial statements, and other financial information included in this report, fairly present in all material respects the financial condition, results of operations, changes in net assets, and cash flows (if the financial statements are required to include a statement of cash flows) of the registrant as of, and for, the periods presented in this report;
4. The registrant’s other certifying officer(s) and I are responsible for establishing and maintaining disclosure controls and procedures (as defined in Rule 30a-3(c) under the Investment Company Act of 1940) and internal control over financial reporting (as defined in Rule 30a-3(d) under the Investment Company Act of 1940) for the registrant and have:
(a) Designed such disclosure controls and procedures, or caused such disclosure controls and procedures to be designed under our supervision, to ensure that material information relating to the registrant, including its consolidated subsidiaries, is made known to us by others within those entities, particularly during the period in which this report is being prepared;
(b) Designed such internal control over financial reporting, or caused such internal control over financial reporting to be designed under our supervision, to provide reasonable assurance regarding the reliability of financial reporting and the preparation of financial statements for external purposes in accordance with generally accepted accounting principles;
(c) Evaluated the effectiveness of the registrant’s disclosure controls and procedures and presented in this report our conclusions about the effectiveness of the disclosure controls and procedures, as of a date within 90 days prior to the filing date of this report based on such evaluation; and
(d) Disclosed in this report any change in the registrant’s internal control over financial reporting that occurred during the period covered by this report that has materially affected, or is reasonably likely to materially affect, the registrant’s internal control over financial reporting; and
5. The registrant’s other certifying officer(s) and I have disclosed to the registrant’s auditors and the audit committee of the registrant’s board of directors (or persons performing the equivalent functions):
(a) All significant deficiencies and material weaknesses in the design or operation of internal control over financial reporting which are reasonably likely to adversely affect the registrant’s ability to record, process, summarize, and report financial information; and
(b) Any fraud, whether or not material, that involves management or other employees who have a significant role in the registrant’s internal control over financial reporting.
| Date: December 22, 2023 | /s/ James F. Kirchner | |||||
| James F. Kirchner | ||||||
| Treasurer |
Eaton Vance Tax-Advantaged Dividend Income Fund
FORM N-CSR
Exhibit 13(a)(2)(ii)
CERTIFICATION
I, R. Kelly Williams, Jr., certify that:
1. I have reviewed this report on Form N-CSR of Eaton Vance Tax-Advantaged Dividend Income Fund;
2. Based on my knowledge, this report does not contain any untrue statement of a material fact or omit to state a material fact necessary to make the statements made, in light of the circumstances under which such statements were made, not misleading with respect to the period covered by this report;
3. Based on my knowledge, the financial statements, and other financial information included in this report, fairly present in all material respects the financial condition, results of operations, changes in net assets, and cash flows (if the financial statements are required to include a statement of cash flows) of the registrant as of, and for, the periods presented in this report;
4. The registrant’s other certifying officer(s) and I are responsible for establishing and maintaining disclosure controls and procedures (as defined in Rule 30a-3(c) under the Investment Company Act of 1940) and internal control over financial reporting (as defined in Rule 30a-3(d) under the Investment Company Act of 1940) for the registrant and have:
(a) Designed such disclosure controls and procedures, or caused such disclosure controls and procedures to be designed under our supervision, to ensure that material information relating to the registrant, including its consolidated subsidiaries, is made known to us by others within those entities, particularly during the period in which this report is being prepared;
(b) Designed such internal control over financial reporting, or caused such internal control over financial reporting to be designed under our supervision, to provide reasonable assurance regarding the reliability of financial reporting and the preparation of financial statements for external purposes in accordance with generally accepted accounting principles;
(c) Evaluated the effectiveness of the registrant’s disclosure controls and procedures and presented in this report our conclusions about the effectiveness of the disclosure controls and procedures, as of a date within 90 days prior to the filing date of this report based on such evaluation; and
(d) Disclosed in this report any change in the registrant’s internal control over financial reporting that occurred during the period covered by this report that has materially affected, or is reasonably likely to materially affect, the registrant’s internal control over financial reporting; and
5. The registrant’s other certifying officer(s) and I have disclosed to the registrant’s auditors and the audit committee of the registrant’s board of directors (or persons performing the equivalent functions):
(a) All significant deficiencies and material weaknesses in the design or operation of internal control over financial reporting which are reasonably likely to adversely affect the registrant’s ability to record, process, summarize, and report financial information; and
(b) Any fraud, whether or not material, that involves management or other employees who have a significant role in the registrant’s internal control over financial reporting.
| Date: December 22, 2023 | /s/ R. Kelly Williams, Jr. | |||||
| R. Kelly Williams, Jr. | ||||||
| President |
Form N-CSR Item 13(b) Exhibit
CERTIFICATION PURSUANT TO
18 U.S.C. SECTION 1350,
AS ADOPTED PURSUANT TO
SECTION 906 OF THE SARBANES-OXLEY ACT OF 2002
The undersigned hereby certify in their capacity as Treasurer and President, respectively, of Eaton Vance Tax-Advantaged Dividend Income Fund (the “Fund”), that:
| (a) | The Annual Report of the Fund on Form N-CSR for the period ended October 31, 2023 (the “Report”) fully complies with the requirements of Section 13(a) or 15(d) of the Securities Exchange Act of 1934, as amended; and |
| (b) | The information contained in the Report fairly presents, in all material respects, the financial condition and the results of operations of the Fund for such period. |
A signed original of this written statement required by section 906 has been provided to the Fund and will be retained by the Fund and furnished to the Securities and Exchange Commission or its staff upon request.
Eaton Vance Tax-Advantaged Dividend Income Fund
| Date: December 22, 2023 |
| /s/ James F. Kirchner |
| James F. Kirchner |
| Treasurer |
| Date: December 22, 2023 |
| /s/ R. Kelly Williams, Jr. |
| R. Kelly Williams, Jr. |
| President |
Form N-CSR Item 13(c) Exhibit

Dear Eaton Vance Fund Shareholder:
This notice provides shareholders of the Eaton Vance Tax-Advantaged Dividend Income Fund (NYSE: EVT) with important information concerning the distribution declared in May 2023. You are receiving this notice as a requirement of the Fund’s managed distribution plan (Plan). The Board of Trustees approved the implementation of the Plan to make monthly cash distributions to common shareholders, stated in terms of a fixed amount per common share. This information is sent to you for informational purposes only and is an estimate of the sources of the May distribution. It is not determinative of the tax character of the Fund’s distributions for the 2023 calendar year.
The amounts and sources of distributions reported in this notice are estimates, are not being provided for tax reporting purposes and the distribution may later be determined to be from other sources including realized short-term gains, long-term gains, to the extent permitted by law, and return of capital. The actual amounts and sources for tax reporting purposes will depend upon the Fund’s investment experience during the remainder of its fiscal year and may be subject to changes based on tax regulations. The Fund will send you a Form 1099-DIV for the calendar year that will tell you how to report these distributions for federal income tax purposes.
Distribution Period: May 2023
Distribution Amount per Common Share: $0.1488
The following table sets forth an estimate of the sources of the Fund’s May distribution and its cumulative distributions paid this fiscal year to date. Amounts are expressed on a per common share basis and as a percentage of the distribution amount.
Eaton Vance Tax-Advantaged Dividend Income Fund
| Source |
Current Distribution |
% of Current Distribution |
Cumulative Distributions for the Fiscal Year-to-Date1 |
% of the Cumulative Distributions for the Fiscal Year-to-Date1 |
||||||||||||
| Net Investment Income |
$ | 0.0394 | 26.5 | % | $ | 0.1989 | 19.1 | % | ||||||||
| Net Realized Short-Term Capital Gains |
$ | 0.0000 | 0.0 | % | $ | 0.0000 | 0.0 | % | ||||||||
| Net Realized Long-Term Capital Gains |
$ | 0.1094 | 73.5 | % | $ | 0.8427 | 80.9 | % | ||||||||
| Return of Capital or Other Capital Source(s) |
$ | 0.0000 | 0.0 | % | $ | 0.0000 | 0.0 | % | ||||||||
|
|
|
|
|
|
|
|
|
|||||||||
| Total per common share |
$ | 0.1488 | 100.0 | % | $ | 1.0416 | 100.0 | % | ||||||||
|
|
|
|
|
|
|
|
|
|||||||||
| 1 | The Fund’s fiscal year is November 1, 2022 to October 31, 2023 |
IMPORTANT DISCLOSURE: You should not draw any conclusions about the Fund’s investment performance from the amount of this distribution or from the terms of the Fund’s Plan. The Fund estimates that it has distributed more than its income and net realized capital gains; therefore, a portion of your distribution may be a return of capital. A return of capital may occur for example, when some or all of the money that you invested in the Fund is paid back to you. A return of capital distribution does not necessarily reflect the Fund’s investment performance and should not be confused with ‘yield’ or ‘income.’ The amounts and sources of distributions reported in this Notice are only estimates and are not being provided for tax reporting purposes. The actual amounts and sources of the amounts for accounting and/or tax reporting purposes will depend upon the Fund’s investment experience during the remainder of its fiscal year and may be subject to changes based on tax regulations. The Fund will send you a Form 1099-DIV for the calendar year that will tell you how to report these distributions for federal income tax purposes.
Set forth in the table below is information relating to the Fund’s performance based on its net asset value (NAV) for certain periods.
| Average annual total return at NAV for the 5-year period ended on April 30, 20231 |
8.47 | % | ||
| Annualized current distribution rate expressed as a percentage of NAV as of April 30, 20232 |
7.55 | % | ||
| Cumulative total return at NAV for the fiscal year through April 30, 20233 |
3.13 | % | ||
| Cumulative fiscal year to date distribution rate as a percentage of NAV as of April 30, 20234 |
3.78 | % |
| 1 | Average annual total return at NAV represents the change in NAV of the Fund, with all distributions reinvested, for the 5-year period ended on April 30, 2023. |
| 2 | The annualized current distribution rate is the cumulative distribution rate annualized as a percentage of the Fund’s NAV as of April 30, 2023. |
| 3 | Cumulative total return at NAV is the percentage change in the Fund’s NAV for the period from the beginning of its fiscal year to April 30, 2023 including distributions paid and assuming reinvestment of those distributions. |
| 4 | Cumulative fiscal year distribution rate for the period from the beginning of its fiscal year to April 30, 2023 measured on the dollar value of distributions in the year-to-date period as a percentage of the Fund’s NAV as of April 30, 2023. |
If you have any questions regarding this information, please contact your investment advisor or an Eaton Vance Investor Services associate at 1-866-328-6681. Our associates are available to assist you Monday-Friday 8:30 a.m. to 5:30 p.m., Eastern Time.
NOTE: This correspondence is for informational purposes only and should not be relied upon to project the tax character of actual Fund distributions for the 2023 calendar year.
NO ACTION IS REQUIRED ON YOUR PART.
Eaton Vance Tax-Advantaged Dividend Income Fund
May 31, 2023
Dear Eaton Vance Fund Shareholder:
This notice provides shareholders of the Eaton Vance Tax-Advantaged Dividend Income Fund (NYSE: EVT) with important information concerning the distribution declared in June 2023. You are receiving this notice as a requirement of the Fund’s managed distribution plan (Plan). The Board of Trustees approved the implementation of the Plan to make monthly cash distributions to common shareholders, stated in terms of a fixed amount per common share. This information is sent to you for informational purposes only and is an estimate of the sources of the June distribution. It is not determinative of the tax character of the Fund’s distributions for the 2023 calendar year.
The amounts and sources of distributions reported in this notice are estimates, are not being provided for tax reporting purposes and the distribution may later be determined to be from other sources including realized short-term gains, long-term gains, to the extent permitted by law, and return of capital. The actual amounts and sources for tax reporting purposes will depend upon the Fund’s investment experience during the remainder of its fiscal year and may be subject to changes based on tax regulations. The Fund will send you a Form 1099-DIV for the calendar year that will tell you how to report these distributions for federal income tax purposes.
Distribution Period: June 2023
Distribution Amount per Common Share: $0.1488
The following table sets forth an estimate of the sources of the Fund’s June distribution and its cumulative distributions paid this fiscal year to date. Amounts are expressed on a per common share basis and as a percentage of the distribution amount.
Eaton Vance Tax-Advantaged Dividend Income Fund
| Source |
Current Distribution |
% of Current Distribution |
Cumulative Distributions for the Fiscal Year-to-Date1 |
% of the Cumulative Distributions for the Fiscal Year-to-Date1 |
||||||||||||
| Net Investment Income |
$ | 0.0391 | 26.3 | % | $ | 0.2381 | 20.0 | % | ||||||||
| Net Realized Short-Term Capital Gains |
$ | 0.0000 | 0.0 | % | $ | 0.0000 | 0.0 | % | ||||||||
| Net Realized Long-Term Capital Gains |
$ | 0.1097 | 73.7 | % | $ | 0.9523 | 80.0 | % | ||||||||
| Return of Capital or Other Capital Source(s) |
$ | 0.0000 | 0.0 | % | $ | 0.0000 | 0.0 | % | ||||||||
|
|
|
|
|
|
|
|
|
|||||||||
| Total per common share |
$ | 0.1488 | 100.0 | % | $ | 1.1904 | 100.0 | % | ||||||||
|
|
|
|
|
|
|
|
|
|||||||||
| 1 | The Fund’s fiscal year is November 1, 2022 to October 31, 2023 |
IMPORTANT DISCLOSURE: You should not draw any conclusions about the Fund’s investment performance from the amount of this distribution or from the terms of the Fund’s Plan. The Fund estimates that it has distributed more than its income and net realized capital gains; therefore, a portion of your distribution may be a return of capital. A return of capital may occur for example, when some or all of the money that you invested in the Fund is paid back to you. A return of capital distribution does not necessarily reflect the Fund’s investment performance and should not be confused with ‘yield’ or ‘income.’ The amounts and sources of distributions reported in this Notice are only estimates and are not being provided for tax reporting purposes. The actual amounts and sources of the amounts for accounting and/or tax reporting purposes will depend upon the Fund’s investment experience during the remainder of its fiscal year and may be subject to changes based on tax regulations. The Fund will send you a Form 1099-DIV for the calendar year that will tell you how to report these distributions for federal income tax purposes.
Set forth in the table below is information relating to the Fund’s performance based on its net asset value (NAV) for certain periods.
| Average annual total return at NAV for the 5-year period ended on May 31, 20231 |
7.62 | % | ||
| Annualized current distribution rate expressed as a percentage of NAV as of May 31, 20232 |
7.90 | % | ||
| Cumulative total return at NAV for the fiscal year through May 31, 20233 |
-0.69 | % | ||
| Cumulative fiscal year to date distribution rate as a percentage of NAV as of May 31, 20234 |
4.61 | % |
| 1 | Average annual total return at NAV represents the change in NAV of the Fund, with all distributions reinvested, for the 5-year period ended on May 31, 2023. |
| 2 | The annualized current distribution rate is the cumulative distribution rate annualized as a percentage of the Fund’s NAV as of May 31, 2023. |
| 3 | Cumulative total return at NAV is the percentage change in the Fund’s NAV for the period from the beginning of its fiscal year to May 31, 2023 including distributions paid and assuming reinvestment of those distributions. |
| 4 | Cumulative fiscal year distribution rate for the period from the beginning of its fiscal year to May 31, 2023 measured on the dollar value of distributions in the year-to-date period as a percentage of the Fund’s NAV as of May 31, 2023. |
If you have any questions regarding this information, please contact your investment advisor or an Eaton Vance Investor Services associate at 1-866-328-6681. Our associates are available to assist you Monday-Friday 8:30 a.m. to 5:30 p.m., Eastern Time.
NOTE: This correspondence is for informational purposes only and should not be relied upon to project the tax character of actual Fund distributions for the 2023 calendar year.
NO ACTION IS REQUIRED ON YOUR PART.
Eaton Vance Tax-Advantaged Dividend Income Fund
June 30, 2023
Dear Eaton Vance Fund Shareholder:
This notice provides shareholders of the Eaton Vance Tax-Advantaged Dividend Income Fund (NYSE: EVT) with important information concerning the distribution declared in July 2023. You are receiving this notice as a requirement of the Fund’s managed distribution plan (Plan). The Board of Trustees approved the implementation of the Plan to make monthly cash distributions to common shareholders, stated in terms of a fixed amount per common share. This information is sent to you for informational purposes only and is an estimate of the sources of the July distribution. It is not determinative of the tax character of the Fund’s distributions for the 2023 calendar year.
The amounts and sources of distributions reported in this notice are estimates, are not being provided for tax reporting purposes and the distribution may later be determined to be from other sources including realized short-term gains, long-term gains, to the extent permitted by law, and return of capital. The actual amounts and sources for tax reporting purposes will depend upon the Fund’s investment experience during the remainder of its fiscal year and may be subject to changes based on tax regulations. The Fund will send you a Form 1099-DIV for the calendar year that will tell you how to report these distributions for federal income tax purposes.
Distribution Period: July 2023
Distribution Amount per Common Share: $0.1488
The following table sets forth an estimate of the sources of the Fund’s July distribution and its cumulative distributions paid this fiscal year to date. Amounts are expressed on a per common share basis and as a percentage of the distribution amount.
Eaton Vance Tax-Advantaged Dividend Income Fund
| Source |
Current Distribution |
% of Current Distribution |
Cumulative Distributions for the Fiscal Year-to-Date1 |
% of the Cumulative Distributions for the Fiscal Year-to-Date1 |
||||||||||||
| Net Investment Income |
$ | 0.0384 | 25.8 | % | $ | 0.2759 | 20.6 | % | ||||||||
| Net Realized Short-Term Capital Gains |
$ | 0.0000 | 0.0 | % | $ | 0.0000 | 0.0 | % | ||||||||
| Net Realized Long-Term Capital Gains |
$ | 0.1104 | 74.2 | % | $ | 1.0633 | 79.4 | % | ||||||||
| Return of Capital or Other Capital Source(s) |
$ | 0.0000 | 0.0 | % | $ | 0.0000 | 0.0 | % | ||||||||
|
|
|
|
|
|
|
|
|
|||||||||
| Total per common share |
$ | 0.1488 | 100.0 | % | $ | 1.3392 | 100.0 | % | ||||||||
|
|
|
|
|
|
|
|
|
|||||||||
| 1 | The Fund’s fiscal year is November 1, 2022 to October 31, 2023 |
IMPORTANT DISCLOSURE: You should not draw any conclusions about the Fund’s investment performance from the amount of this distribution or from the terms of the Fund’s Plan. The Fund estimates that it has distributed more than its income and net realized capital gains; therefore, a portion of your distribution may be a return of capital. A return of capital may occur for example, when some or all of the money that you invested in the Fund is paid back to you. A return of capital distribution does not necessarily reflect the Fund’s investment performance and should not be confused with ‘yield’ or ‘income.’ The amounts and sources of distributions reported in this Notice are only estimates and are not being provided for tax reporting purposes. The actual amounts and sources of the amounts for accounting and/or tax reporting purposes will depend upon the Fund’s investment experience during the remainder of its fiscal year and may be subject to changes based on tax regulations. The Fund will send you a Form 1099-DIV for the calendar year that will tell you how to report these distributions for federal income tax purposes.
Set forth in the table below is information relating to the Fund’s performance based on its net asset value (NAV) for certain periods.
| Average annual total return at NAV for the 5-year period ended on June 30, 20231 |
8.80 | % | ||
| Annualized current distribution rate expressed as a percentage of NAV as of June 30, 20232 |
7.48 | % | ||
| Cumulative total return at NAV for the fiscal year through June 30, 20233 |
5.52 | % | ||
| Cumulative fiscal year to date distribution rate as a percentage of NAV as of June 30, 20234 |
4.99 | % |
| 1 | Average annual total return at NAV represents the change in NAV of the Fund, with all distributions reinvested, for the 5-year period ended on June 30, 2023. |
| 2 | The annualized current distribution rate is the cumulative distribution rate annualized as a percentage of the Fund’s NAV as of June 30, 2023. |
| 3 | Cumulative total return at NAV is the percentage change in the Fund’s NAV for the period from the beginning of its fiscal year to June 30, 2023 including distributions paid and assuming reinvestment of those distributions. |
| 4 | Cumulative fiscal year distribution rate for the period from the beginning of its fiscal year to June 30, 2023 measured on the dollar value of distributions in the year-to-date period as a percentage of the Fund’s NAV as of June 30, 2023. |
If you have any questions regarding this information, please contact your investment advisor or an Eaton Vance Investor Services associate at 1-866-328-6681. Our associates are available to assist you Monday-Friday 8:30 a.m. to 5:30 p.m., Eastern Time.
NOTE: This correspondence is for informational purposes only and should not be relied upon to project the tax character of actual Fund distributions for the 2023 calendar year.
NO ACTION IS REQUIRED ON YOUR PART.
Eaton Vance Tax-Advantaged Dividend Income Fund
July 31, 2023
Dear Eaton Vance Fund Shareholder:
This notice provides shareholders of the Eaton Vance Tax-Advantaged Dividend Income Fund (NYSE: EVT) with important information concerning the distribution declared in August 2023. You are receiving this notice as a requirement of the Fund’s managed distribution plan (Plan). The Board of Trustees approved the implementation of the Plan to make monthly cash distributions to common shareholders, stated in terms of a fixed amount per common share. This information is sent to you for informational purposes only and is an estimate of the sources of the August distribution. It is not determinative of the tax character of the Fund’s distributions for the 2023 calendar year.
The amounts and sources of distributions reported in this notice are estimates, are not being provided for tax reporting purposes and the distribution may later be determined to be from other sources including realized short-term gains, long-term gains, to the extent permitted by law, and return of capital. The actual amounts and sources for tax reporting purposes will depend upon the Fund’s investment experience during the remainder of its fiscal year and may be subject to changes based on tax regulations. The Fund will send you a Form 1099-DIV for the calendar year that will tell you how to report these distributions for federal income tax purposes.
Distribution Period: August 2023
Distribution Amount per Common Share: $0.1488
The following table sets forth an estimate of the sources of the Fund’s August distribution and its cumulative distributions paid this fiscal year to date. Amounts are expressed on a per common share basis and as a percentage of the distribution amount.
Eaton Vance Tax-Advantaged Dividend Income Fund
| Source |
Current Distribution |
% of Current Distribution |
Cumulative Distributions for the Fiscal Year-to-Date1 |
% of the Cumulative Distributions for the Fiscal Year-to-Date1 |
||||||||||||
| Net Investment Income |
$ | 0.0409 | 27.5 | % | $ | 0.3169 | 21.3 | % | ||||||||
| Net Realized Short-Term Capital Gains |
$ | 0.0000 | 0.0 | % | $ | 0.0000 | 0.0 | % | ||||||||
| Net Realized Long-Term Capital Gains |
$ | 0.1079 | 72.5 | % | $ | 1.1711 | 78.7 | % | ||||||||
| Return of Capital or Other Capital Source(s) |
$ | 0.0000 | 0.0 | % | $ | 0.0000 | 0.0 | % | ||||||||
|
|
|
|
|
|
|
|
|
|||||||||
| Total per common share |
$ | 0.1488 | 100.0 | % | $ | 1.4880 | 100.0 | % | ||||||||
|
|
|
|
|
|
|
|
|
|||||||||
| 1 | The Fund’s fiscal year is November 1, 2022 to October 31, 2023 |
IMPORTANT DISCLOSURE: You should not draw any conclusions about the Fund’s investment performance from the amount of this distribution or from the terms of the Fund’s Plan. The Fund estimates that it has distributed more than its income and net realized capital gains; therefore, a portion of your distribution may be a return of capital. A return of capital may occur for example, when some or all of the money that you invested in the Fund is paid back to you. A return of capital distribution does not necessarily reflect the Fund’s investment performance and should not be confused with ‘yield’ or ‘income.’ The amounts and sources of distributions reported in this Notice are only estimates and are not being provided for tax reporting purposes. The actual amounts and sources of the amounts for accounting and/or tax reporting purposes will depend upon the Fund’s investment experience during the remainder of its fiscal year and may be subject to changes based on tax regulations. The Fund will send you a Form 1099-DIV for the calendar year that will tell you how to report these distributions for federal income tax purposes.
Set forth in the table below is information relating to the Fund’s performance based on its net asset value (NAV) for certain periods.
| Average annual total return at NAV for the 5-year period ended on July 31, 20231 |
8.69 | % | ||
| Annualized current distribution rate expressed as a percentage of NAV as of July 31, 20232 |
7.20 | % | ||
| Cumulative total return at NAV for the fiscal year through July 31, 20233 |
10.34 | % | ||
| Cumulative fiscal year to date distribution rate as a percentage of NAV as of July 31, 20234 |
5.40 | % |
| 1 | Average annual total return at NAV represents the change in NAV of the Fund, with all distributions reinvested, for the 5-year period ended on July 31, 2023. |
| 2 | The annualized current distribution rate is the cumulative distribution rate annualized as a percentage of the Fund’s NAV as of July 31, 2023. |
| 3 | Cumulative total return at NAV is the percentage change in the Fund’s NAV for the period from the beginning of its fiscal year to July 31, 2023 including distributions paid and assuming reinvestment of those distributions. |
| 4 | Cumulative fiscal year distribution rate for the period from the beginning of its fiscal year to July 31, 2023 measured on the dollar value of distributions in the year-to-date period as a percentage of the Fund’s NAV as of July 31, 2023. |
If you have any questions regarding this information, please contact your investment advisor or an Eaton Vance Investor Services associate at 1-866-328-6681. Our associates are available to assist you Monday-Friday 8:30 a.m. to 5:30 p.m., Eastern Time.
NOTE: This correspondence is for informational purposes only and should not be relied upon to project the tax character of actual Fund distributions for the 2023 calendar year.
NO ACTION IS REQUIRED ON YOUR PART.
Eaton Vance Tax-Advantaged Dividend Income Fund
August 31, 2023
Dear Eaton Vance Fund Shareholder:
This notice provides shareholders of the Eaton Vance Tax-Advantaged Dividend Income Fund (NYSE: EVT) with important information concerning the distribution declared in September 2023. You are receiving this notice as a requirement of the Fund’s managed distribution plan (Plan). The Board of Trustees approved the implementation of the Plan to make monthly cash distributions to common shareholders, stated in terms of a fixed amount per common share. This information is sent to you for informational purposes only and is an estimate of the sources of the September distribution. It is not determinative of the tax character of the Fund’s distributions for the 2023 calendar year.
The amounts and sources of distributions reported in this notice are estimates, are not being provided for tax reporting purposes and the distribution may later be determined to be from other sources including realized short-term gains, long-term gains, to the extent permitted by law, and return of capital. The actual amounts and sources for tax reporting purposes will depend upon the Fund’s investment experience during the remainder of its fiscal year and may be subject to changes based on tax regulations. The Fund will send you a Form 1099-DIV for the calendar year that will tell you how to report these distributions for federal income tax purposes.
Distribution Period: September 2023
Distribution Amount per Common Share: $0.1488
The following table sets forth an estimate of the sources of the Fund’s September distribution and its cumulative distributions paid this fiscal year to date. Amounts are expressed on a per common share basis and as a percentage of the distribution amount.
Eaton Vance Tax-Advantaged Dividend Income Fund
| Source |
Current Distribution |
% of Current Distribution |
Cumulative Distributions for the Fiscal Year-to-Date1 |
% of the Cumulative Distributions for the Fiscal Year-to-Date1 |
||||||||||||
| Net Investment Income |
$ | 0.0576 | 38.7 | % | $ | 0.3748 | 22.9 | % | ||||||||
| Net Realized Short-Term Capital Gains |
$ | 0.0000 | 0.0 | % | $ | 0.0000 | 0.0 | % | ||||||||
| Net Realized Long-Term Capital Gains |
$ | 0.0912 | 61.3 | % | $ | 1.2620 | 77.1 | % | ||||||||
| Return of Capital or Other Capital Source(s) |
$ | 0.0000 | 0.0 | % | $ | 0.0000 | 0.0 | % | ||||||||
|
|
|
|
|
|
|
|
|
|||||||||
| Total per common share |
$ | 0.1488 | 100.0 | % | $ | 1.6368 | 100.0 | % | ||||||||
|
|
|
|
|
|
|
|
|
|||||||||
| 1 | The Fund’s fiscal year is November 1, 2022 to October 31, 2023 |
IMPORTANT DISCLOSURE: You should not draw any conclusions about the Fund’s investment performance from the amount of this distribution or from the terms of the Fund’s Plan. The Fund estimates that it has distributed more than its income and net realized capital gains; therefore, a portion of your distribution may be a return of capital. A return of capital may occur for example, when some or all of the money that you invested in the Fund is paid back to you. A return of capital distribution does not necessarily reflect the Fund’s investment performance and should not be confused with ‘yield’ or ‘income.’ The amounts and sources of distributions reported in this Notice are only estimates and are not being provided for tax reporting purposes. The actual amounts and sources of the amounts for accounting and/or tax reporting purposes will depend upon the Fund’s investment experience during the remainder of its fiscal year and may be subject to changes based on tax regulations. The Fund will send you a Form 1099-DIV for the calendar year that will tell you how to report these distributions for federal income tax purposes.
Set forth in the table below is information relating to the Fund’s performance based on its net asset value (NAV) for certain periods.
| Average annual total return at NAV for the 5-year period ended on August 31, 20231 |
7.58 | % | ||
| Annualized current distribution rate expressed as a percentage of NAV as of August 31, 20232 |
7.47 | % | ||
| Cumulative total return at NAV for the fiscal year through August 31, 20233 |
7.00 | % | ||
| Cumulative fiscal year to date distribution rate as a percentage of NAV as of August 31, 20234 |
6.23 | % |
| 1 | Average annual total return at NAV represents the change in NAV of the Fund, with all distributions reinvested, for the 5-year period ended on August 31, 2023. |
| 2 | The annualized current distribution rate is the cumulative distribution rate annualized as a percentage of the Fund’s NAV as of August 31, 2023. |
| 3 | Cumulative total return at NAV is the percentage change in the Fund’s NAV for the period from the beginning of its fiscal year to August 31, 2023 including distributions paid and assuming reinvestment of those distributions. |
| 4 | Cumulative fiscal year distribution rate for the period from the beginning of its fiscal year to August 31, 2023 measured on the dollar value of distributions in the year-to-date period as a percentage of the Fund’s NAV as of August 31, 2023. |
If you have any questions regarding this information, please contact your investment advisor or an Eaton Vance Investor Services associate at 1-866-328-6681. Our associates are available to assist you Monday-Friday 8:30 a.m. to 5:30 p.m., Eastern Time.
NOTE: This correspondence is for informational purposes only and should not be relied upon to project the tax character of actual Fund distributions for the 2023 calendar year.
NO ACTION IS REQUIRED ON YOUR PART.
Eaton Vance Tax-Advantaged Dividend Income Fund
September 29, 2023
Dear Eaton Vance Fund Shareholder:
This notice provides shareholders of the Eaton Vance Tax-Advantaged Dividend Income Fund (NYSE: EVT) with important information concerning the distribution declared in October 2023. You are receiving this notice as a requirement of the Fund’s managed distribution plan (Plan). The Board of Trustees approved the implementation of the Plan to make monthly cash distributions to common shareholders, stated in terms of a fixed amount per common share. This information is sent to you for informational purposes only and is an estimate of the sources of the October distribution. It is not determinative of the tax character of the Fund’s distributions for the 2023 calendar year.
The amounts and sources of distributions reported in this notice are estimates, are not being provided for tax reporting purposes and the distribution may later be determined to be from other sources including realized short-term gains, long-term gains, to the extent permitted by law, and return of capital. The actual amounts and sources for tax reporting purposes will depend upon the Fund’s investment experience during the remainder of its fiscal year and may be subject to changes based on tax regulations. The Fund will send you a Form 1099-DIV for the calendar year that will tell you how to report these distributions for federal income tax purposes.
Distribution Period: October 2023
Distribution Amount per Common Share: $0.1488
The following table sets forth an estimate of the sources of the Fund’s October distribution and its cumulative distributions paid this fiscal year to date. Amounts are expressed on a per common share basis and as a percentage of the distribution amount.
Eaton Vance Tax-Advantaged Dividend Income Fund
| Source |
Current Distribution |
% of Current Distribution |
Cumulative Distributions for the Fiscal Year-to-Date1 |
% of the Cumulative Distributions for the Fiscal Year-to-Date1 |
||||||||||||
| Net Investment Income |
$ | 0.0680 | 45.7 | % | $ | 0.4428 | 24.8 | % | ||||||||
| Net Realized Short-Term Capital Gains |
$ | 0.0000 | 0.0 | % | $ | 0.0000 | 0.0 | % | ||||||||
| Net Realized Long-Term Capital Gains |
$ | 0.0808 | 54.3 | % | $ | 1.3428 | 75.2 | % | ||||||||
| Return of Capital or Other Capital Source(s) |
$ | 0.0000 | 0.0 | % | $ | 0.0000 | 0.0 | % | ||||||||
|
|
|
|
|
|
|
|
|
|||||||||
| Total per common share |
$ | 0.1488 | 100.0 | % | $ | 1.7856 | 100.0 | % | ||||||||
|
|
|
|
|
|
|
|
|
|||||||||
| 1 | The Fund’s fiscal year is November 1, 2022 to October 31, 2023 |
IMPORTANT DISCLOSURE: You should not draw any conclusions about the Fund’s investment performance from the amount of this distribution or from the terms of the Fund’s Plan. The Fund estimates that it has distributed more than its income and net realized capital gains; therefore, a portion of your distribution may be a return of capital. A return of capital may occur for example, when some or all of the money that you invested in the Fund is paid back to you. A return of capital distribution does not necessarily reflect the Fund’s investment performance and should not be confused with ‘yield’ or ‘income.’ The amounts and sources of distributions reported in this Notice are only estimates and are not being provided for tax reporting purposes. The actual amounts and sources of the amounts for accounting and/or tax reporting purposes will depend upon the Fund’s investment experience during the remainder of its fiscal year and may be subject to changes based on tax regulations. The Fund will send you a Form 1099-DIV for the calendar year that will tell you how to report these distributions for federal income tax purposes.
Set forth in the table below is information relating to the Fund’s performance based on its net asset value (NAV) for certain periods.
| Average annual total return at NAV for the 5-year period ended on September 30, 20231 |
6.65 | % | ||
| Annualized current distribution rate expressed as a percentage of NAV as of September 30, 20232 |
7.85 | % | ||
| Cumulative total return at NAV for the fiscal year through September 30, 20233 |
2.66 | % | ||
| Cumulative fiscal year to date distribution rate as a percentage of NAV as of September 30, 20234 |
7.19 | % |
| 1 | Average annual total return at NAV represents the change in NAV of the Fund, with all distributions reinvested, for the 5-year period ended on September 30, 2023. |
| 2 | The annualized current distribution rate is the cumulative distribution rate annualized as a percentage of the Fund’s NAV as of September 30, 2023. |
| 3 | Cumulative total return at NAV is the percentage change in the Fund’s NAV for the period from the beginning of its fiscal year to September 30, 2023 including distributions paid and assuming reinvestment of those distributions. |
| 4 | Cumulative fiscal year distribution rate for the period from the beginning of its fiscal year to September 30, 2023 measured on the dollar value of distributions in the year-to-date period as a percentage of the Fund’s NAV as of September 30, 2023. |
If you have any questions regarding this information, please contact your investment advisor or an Eaton Vance Investor Services associate at 1-866-328-6681. Our associates are available to assist you Monday-Friday 8:30 a.m. to 5:30 p.m., Eastern Time.
NOTE: This correspondence is for informational purposes only and should not be relied upon to project the tax character of actual Fund distributions for the 2023 calendar year.
NO ACTION IS REQUIRED ON YOUR PART.
Eaton Vance Tax-Advantaged Dividend Income Fund
October 31, 2023
Form N-CSR Item 13(d) Exhibit
CONSENT OF INDEPENDENT REGISTERED PUBLIC ACCOUNTING FIRM
We consent to the incorporation by reference in the Registration Statement No. 333-262832 on Form N-2 of our report dated December 19, 2023, relating to the financial statements and financial highlights of Eaton Vance Tax-Advantaged Dividend Income Fund (the “Fund”), appearing in this Annual Report on Form N-CSR of the Fund for the year ended October 31, 2023.
| /s/ Deloitte & Touche LLP |
| Boston, Massachusetts |
| December 22, 2023 |
N-2 - USD ($) |
3 Months Ended | 12 Months Ended | ||||||||||||||||||||||||||||||||||||||||||||||||||||||||||||||||||||||||||||||||||||||||||||||||||||||||||||
|---|---|---|---|---|---|---|---|---|---|---|---|---|---|---|---|---|---|---|---|---|---|---|---|---|---|---|---|---|---|---|---|---|---|---|---|---|---|---|---|---|---|---|---|---|---|---|---|---|---|---|---|---|---|---|---|---|---|---|---|---|---|---|---|---|---|---|---|---|---|---|---|---|---|---|---|---|---|---|---|---|---|---|---|---|---|---|---|---|---|---|---|---|---|---|---|---|---|---|---|---|---|---|---|---|---|---|---|---|---|---|
Oct. 31, 2023 |
Jul. 31, 2023 |
Apr. 30, 2023 |
Jan. 31, 2023 |
Oct. 31, 2022 |
Jul. 31, 2022 |
Apr. 30, 2022 |
Jan. 31, 2022 |
Oct. 31, 2023 |
Oct. 31, 2021 |
Oct. 31, 2020 |
Oct. 31, 2019 |
Oct. 31, 2018 |
[8] | Aug. 31, 2018 |
Aug. 31, 2017 |
Aug. 31, 2016 |
Aug. 31, 2015 |
Aug. 31, 2014 |
||||||||||||||||||||||||||||||||||||||||||||||||||||||||||||||||||||||||||||||||||||||||||||
| Cover [Abstract] | ||||||||||||||||||||||||||||||||||||||||||||||||||||||||||||||||||||||||||||||||||||||||||||||||||||||||||||||
| Entity Central Index Key | 0001253327 | |||||||||||||||||||||||||||||||||||||||||||||||||||||||||||||||||||||||||||||||||||||||||||||||||||||||||||||
| Amendment Flag | false | |||||||||||||||||||||||||||||||||||||||||||||||||||||||||||||||||||||||||||||||||||||||||||||||||||||||||||||
| Entity Inv Company Type | N-2 | |||||||||||||||||||||||||||||||||||||||||||||||||||||||||||||||||||||||||||||||||||||||||||||||||||||||||||||
| Document Type | N-CSR | |||||||||||||||||||||||||||||||||||||||||||||||||||||||||||||||||||||||||||||||||||||||||||||||||||||||||||||
| Entity Registrant Name | Eaton Vance Tax-Advantaged Dividend Income Fund | |||||||||||||||||||||||||||||||||||||||||||||||||||||||||||||||||||||||||||||||||||||||||||||||||||||||||||||
| Fee Table [Abstract] | ||||||||||||||||||||||||||||||||||||||||||||||||||||||||||||||||||||||||||||||||||||||||||||||||||||||||||||||
| Shareholder Transaction Expenses [Table Text Block] |
1 If common shares are sold to or through underwriters, the Prospectus Supplement will set forth any applicable sales load. 2 Eaton Vance Management (“EVM”) will pay the expenses of the offering (other than the applicable commissions); therefore, offering expenses are not included in the Summary of Fund Expenses. Offering expenses generally include, but are not limited to, the preparation, review and filing with the SEC of the Fund’s registration statement (including its current Prospectus Supplement, the accompanying Prospectus and Statement of Additional Information (“SAI”)), the preparation, review and filing of any associated marketing or similar materials, costs associated with the printing, mailing or other distribution of its current Prospectus Supplement, the accompanying Prospectus, SAI and/or marketing materials, associated filing fees, stock exchange listing fees, and legal and auditing fees associated with the offering. 3 You will be charged a $5.00 service charge and pay brokerage charges if you direct the plan agent to sell your common shares held in a dividend reinvestment account. |
|||||||||||||||||||||||||||||||||||||||||||||||||||||||||||||||||||||||||||||||||||||||||||||||||||||||||||||
| Sales Load [Percent] | [1] | 0.00% | ||||||||||||||||||||||||||||||||||||||||||||||||||||||||||||||||||||||||||||||||||||||||||||||||||||||||||||
| Dividend Reinvestment and Cash Purchase Fees | [2] | $ 5 | ||||||||||||||||||||||||||||||||||||||||||||||||||||||||||||||||||||||||||||||||||||||||||||||||||||||||||||
| Other Transaction Expenses [Abstract] | ||||||||||||||||||||||||||||||||||||||||||||||||||||||||||||||||||||||||||||||||||||||||||||||||||||||||||||||
| Other Transaction Expenses [Percent] | [3] | 0.00% | ||||||||||||||||||||||||||||||||||||||||||||||||||||||||||||||||||||||||||||||||||||||||||||||||||||||||||||
| Annual Expenses [Table Text Block] |
4 Stated as a percentage of average net assets attributable to common shares for the year ended October 31, 2023. 5 The investment adviser fee paid by the Fund to EVM is based on the average daily gross assets of the Fund, including all assets attributable to any form of investment leverage that the Fund may utilize. Accordingly, if the Fund were to increase investment leverage in the future, the investment adviser fee will increase as a percentage of net assets. 6 As of October 31, 2023, the outstanding borrowings represented approximately 21.8% leverage. 7 Includes interest and fee expense on notes payable. |
|||||||||||||||||||||||||||||||||||||||||||||||||||||||||||||||||||||||||||||||||||||||||||||||||||||||||||||
| Management Fees [Percent] | [4],[5] | 1.06% | ||||||||||||||||||||||||||||||||||||||||||||||||||||||||||||||||||||||||||||||||||||||||||||||||||||||||||||
| Interest Expenses on Borrowings [Percent] | [4],[6],[7] | 1.40% | ||||||||||||||||||||||||||||||||||||||||||||||||||||||||||||||||||||||||||||||||||||||||||||||||||||||||||||
| Acquired Fund Fees and Expenses [Percent] | [4] | 0.05% | ||||||||||||||||||||||||||||||||||||||||||||||||||||||||||||||||||||||||||||||||||||||||||||||||||||||||||||
| Other Annual Expenses [Abstract] | ||||||||||||||||||||||||||||||||||||||||||||||||||||||||||||||||||||||||||||||||||||||||||||||||||||||||||||||
| Other Annual Expenses [Percent] | [4] | 0.07% | ||||||||||||||||||||||||||||||||||||||||||||||||||||||||||||||||||||||||||||||||||||||||||||||||||||||||||||
| Total Annual Expenses [Percent] | [4] | 2.58% | ||||||||||||||||||||||||||||||||||||||||||||||||||||||||||||||||||||||||||||||||||||||||||||||||||||||||||||
| Expense Example [Table Text Block] | Example The following Example illustrates the expenses that common shareholders would pay on a $1,000 investment in common shares, assuming (i) total annual expenses of 2.58% of net assets attributable to common shares in years 1 through 10; (ii) a 5% annual return; and (iii) all distributions are reinvested at NAV:
The above table and example and the assumption in the example of a 5% annual return are required by regulations of the U.S. Securities and Exchange Commission (“SEC”) that are applicable to all investment companies; the assumed 5% annual return is not a prediction of, and does not represent, the projected or actual performance of the Fund’s common shares. In addition, while the example assumes reinvestment of all dividends and distributions at NAV, participants in the Fund’s dividend reinvestment plan may receive common shares purchased or issued at a price or value different from NAV. The example does not include sales load or estimated offering costs, which would cause the expenses shown in the example to increase. The example should not be considered a representation of past or future expenses, and the Fund’s actual expenses may be greater or less than those shown. Moreover, the Fund’s actual rate of return may be greater or less than the hypothetical 5% return shown in the example.
|
|||||||||||||||||||||||||||||||||||||||||||||||||||||||||||||||||||||||||||||||||||||||||||||||||||||||||||||
| Expense Example, Year 01 | $ 26 | |||||||||||||||||||||||||||||||||||||||||||||||||||||||||||||||||||||||||||||||||||||||||||||||||||||||||||||
| Expense Example, Years 1 to 3 | 80 | |||||||||||||||||||||||||||||||||||||||||||||||||||||||||||||||||||||||||||||||||||||||||||||||||||||||||||||
| Expense Example, Years 1 to 5 | 137 | |||||||||||||||||||||||||||||||||||||||||||||||||||||||||||||||||||||||||||||||||||||||||||||||||||||||||||||
| Expense Example, Years 1 to 10 | $ 291 | |||||||||||||||||||||||||||||||||||||||||||||||||||||||||||||||||||||||||||||||||||||||||||||||||||||||||||||
| Purpose of Fee Table , Note [Text Block] | The purpose of the table below is to help you understand all fees and expenses that you, as a common shareholder, would bear directly or indirectly. The table shows Fund expenses stated as a percentage of net assets attributable to common shares, and not as a percentage of total assets. | |||||||||||||||||||||||||||||||||||||||||||||||||||||||||||||||||||||||||||||||||||||||||||||||||||||||||||||
| Basis of Transaction Fees, Note [Text Block] | as a percentage of offering price | |||||||||||||||||||||||||||||||||||||||||||||||||||||||||||||||||||||||||||||||||||||||||||||||||||||||||||||
| Other Transaction Fees, Note [Text Block] | Eaton Vance Management (“EVM”) will pay the expenses of the offering (other than the applicable commissions); therefore, offering expenses are not included in the Summary of Fund Expenses. Offering expenses generally include, but are not limited to, the preparation, review and filing with the SEC of the Fund’s registration statement (including its current Prospectus Supplement, the accompanying Prospectus and Statement of Additional Information (“SAI”)), the preparation, review and filing of any associated marketing or similar materials, costs associated with the printing, mailing or other distribution of its current Prospectus Supplement, the accompanying Prospectus, SAI and/or marketing materials, associated filing fees, stock exchange listing fees, and legal and auditing fees associated with the offering. | |||||||||||||||||||||||||||||||||||||||||||||||||||||||||||||||||||||||||||||||||||||||||||||||||||||||||||||
| Management Fee not based on Net Assets, Note [Text Block] | The investment adviser fee paid by the Fund to EVM is based on the average daily gross assets of the Fund, including all assets attributable to any form of investment leverage that the Fund may utilize. Accordingly, if the Fund were to increase investment leverage in the future, the investment adviser fee will increase as a percentage of net assets. | |||||||||||||||||||||||||||||||||||||||||||||||||||||||||||||||||||||||||||||||||||||||||||||||||||||||||||||
| Financial Highlights [Abstract] | ||||||||||||||||||||||||||||||||||||||||||||||||||||||||||||||||||||||||||||||||||||||||||||||||||||||||||||||
| Senior Securities [Table Text Block] | Senior Securities The following table sets forth information regarding the Fund’s outstanding senior securities as of the end of each of the Fund’s last ten fiscal years. The information in the table below was taken from the Fund’s financial statements for each fiscal year in the ten-year period ended October 31, 2023, and such financial statements have been audited by Deloitte & Touche LLP, the Fund’s independent registered public accounting firm.
1 Calculated by subtracting the Fund’s total liabilities (not including the borrowings/notes payable) from the Fund’s total assets, and dividing the result by the borrowings/notes payable balance in thousands. 2 For the two months ended October 31, 2018. Effective September 1, 2018, the fiscal year-end of the Fund changed from August 31 to October 31. |
|||||||||||||||||||||||||||||||||||||||||||||||||||||||||||||||||||||||||||||||||||||||||||||||||||||||||||||
| General Description of Registrant [Abstract] | ||||||||||||||||||||||||||||||||||||||||||||||||||||||||||||||||||||||||||||||||||||||||||||||||||||||||||||||
| Investment Objectives and Practices [Text Block] | Investment Objectives. The Fund’s investment objective is to provide a high level of after-tax total return consisting primarily of tax-advantaged dividend income and capital appreciation. Principal Strategies. Under normal market conditions, the Fund invests at least 80% of its total managed assets in dividend-paying common and preferred stocks that Eaton Vance believes at the time of investment are eligible to pay dividends that qualify for federal income taxation at rates applicable to long-term capital gains (‘‘tax-advantaged dividends’’). For the purposes of the 80% test, total assets is defined as net assets plus any borrowings for investment purposes. The Fund may invest in common and preferred stocks of both domestic and foreign issuers. Preferred stocks may include other hybrid securities. The Fund can invest up to 10% of its net assets in exchange-traded funds (“ETFs”) that invest primarily in preferred stocks. The Fund may also lend its securities. The Fund may invest in preferred stocks of any grade quality. The Fund may invest up to 30% of its total managed assets in securities rated below investment grade quality (which is lower than BBB– as determined by S&P Global Ratings (‘‘S&P’’) or Fitch Ratings (‘‘Fitch’’), Baa3 as determined by Moody’s Investors Service, Inc. (‘‘Moody’s’’) or, if unrated, determined to be of comparable quality by Eaton Vance). Securities of below investment grade quality commonly are referred to as ‘‘junk’’ preferred stocks and bonds, as the case may be. In addition to investing in stocks that pay tax-advantaged dividends, the Fund may also invest a portion of its assets in stocks and other securities (including preferred stocks, hybrid securities, or bonds) that generate fully taxable ordinary income (i.e., income other than tax-advantaged dividends). In seeking its objective, the Fund may engage in dividend capture trading. The Fund may use derivatives principally to seek to manage exposure to certain sectors and/or markets in connection with its use of dividend capture trading. The Fund expects to buy and sell equity index futures contracts for this purpose, but may also engage in other types of derivatives to manage such exposures. Additionally, the Fund may also use derivatives for other purposes, such as hedging, to enhance return or as a substitute for the purchase or sale of securities or currencies. Other permitted derivatives include futures contracts on securities and non-equity indices, options on futures contracts, the purchase of put options and the sale of call options on securities held, equity swaps, interest rate swaps, covered short sales, forward sales of stocks, forward currency exchange contracts and currency futures contracts. The Fund may invest in the foregoing derivatives without limitation and use of derivatives may be extensive. The Fund may also invest in credit derivatives (credit default swaps, total return swaps, credit options and other derivative transactions with substantially similar characteristics and risks), provided that the notional value of such derivative instruments entered into for non-hedging purposes does not exceed 5% of the value of preferred stocks held by the Fund. The Fund may invest a significant portion of its assets in securities of issuers in any single industry or sector of the economy if companies in that industry or sector meet the Fund’s investment criteria. The Fund may not invest 25% or more of its total managed assets in the securities of issuers in any single industry. The Fund may invest a significant portfolio of its assets in the financial services sector. During unusual market conditions, the Fund may invest up to 100% of its assets in cash or cash equivalents temporarily, which may be inconsistent with its investment objectives, principal strategies and other policies. The Fund employs leverage through borrowings to seek opportunities for additional income. Leverage may amplify the Fund’s net asset value of any increase or decrease in the value of investments held. There can be no assurance that the use of borrowings will be successful.
|
|||||||||||||||||||||||||||||||||||||||||||||||||||||||||||||||||||||||||||||||||||||||||||||||||||||||||||||
| Risk Factors [Table Text Block] | Principal Risks Market Discount Risk. As with any security, the market value of the common shares may increase or decrease from the amount initially paid for the common shares. The Fund’s common shares have traded both at a premium and at a discount relative to NAV. The shares of closed-end management investment companies frequently trade at a discount from their NAV. This is a risk separate and distinct from the risk that the Fund’s NAV may decrease. Market Risk. The value of investments held by the Fund may increase or decrease in response to social, economic, political, financial, public health crises or other disruptive events (whether real, expected or perceived) in the U.S. and global markets, and include events such as war, natural disasters, epidemics and pandemics, terrorism, conflicts and social unrest. These events may negatively impact broad segments of businesses and populations and may exacerbate pre-existing risks to the Fund. The frequency and magnitude of resulting changes in the value of the Fund’s investments cannot be predicted. Certain securities and other investments held by the Fund may experience increased volatility, illiquidity, or other potentially adverse effects in reaction to changing market conditions. Monetary and/or fiscal actions taken by U.S. or foreign governments to stimulate or stabilize the global economy may not be effective and could lead to high market volatility. No active trading market may exist for certain investments held by the Fund, which may impair the ability of the Fund to sell or to realize the current valuation of such investments in the event of the need to liquidate such assets. Issuer Risk . The value of common and preferred stocks may decline for a number of reasons which directly relate to the issuer, such as management performance, financial leverage and reduced demand for the issuer’s goods and services. Equity Securities Risk. The value of equity securities and related instruments may decline in response to adverse changes in the economy or the economic outlook; deterioration in investor sentiment; interest rate, currency, and commodity price fluctuations; adverse geopolitical, social or environmental developments; issuer and sector-specific considerations; unexpected trading activity among retail investors; or other factors. Market conditions may affect certain types of stocks to a greater extent than other types of stocks. If the stock market declines in value, the value of the Fund’s equity securities will also likely decline. Although prices can rebound, there is no assurance that values will return to previous levels. Tax-Sensitive Investing Risk. The Fund may hold a security in order to achieve more favorable tax-treatment or to sell a security in order to create tax losses. The Fund’s utilization of various tax-management techniques may be curtailed or eliminated by tax legislation, regulation or interpretations. The Fund may not be able to minimize taxable distributions to shareholders and a portion of the Fund’s distributions may be taxable. Tax Risk. Although the Fund seeks to minimize and defer the federal income taxes incurred by common shareholders in connection with their investment in the Fund, there can be no assurance that it will be successful in this regard. The tax treatment and characterization of the Fund’s distributions may change over time due to changes in the Fund’s mix of investment returns and changes in the federal tax laws, regulations and administrative and judicial interpretations. The Fund’s investment program and the tax treatment of Fund distributions may be affected by IRS interpretations of the Internal Revenue Code of 1986, as amended (the “Code”) and future changes in tax laws and regulations. Distributions paid on the common shares may be characterized variously as non-qualified dividends (taxable at ordinary income rates), qualified dividends (generally taxable at long-term capital gains rates), capital gains dividends (taxable at long-term capital gains rates) or return of capital (generally not currently taxable). The ultimate tax characterization of the Fund’s distributions made in a calendar year may not finally be determined until after the end of that calendar year. Distributions to a common shareholder that are return of capital are tax free to the amount of the common shareholder’s current tax basis in his or her common shares, with any distribution amounts exceeding such basis treated as capital gain on a deemed sale of common shares. common shareholders are required to reduce their tax basis in common shares by the amount of tax-free return of capital distributions received, thereby increasing the amount of capital gain (or decreasing the amount of capital loss) to be recognized upon a later disposition of the common shares. In order for Fund distributions of qualified dividend income to be taxable at favorable long-term capital gains rates, a common shareholder must meet certain prescribed holding period and other requirements with respect to his or her common shares. If positions held by the Fund were treated as “straddles” for federal income tax purposes, dividends on such positions would not constitute qualified dividend income subject to favorable income tax treatment. Currency Risk. Exchange rates for currencies fluctuate daily. The value of foreign investments may be affected favorably or unfavorably by changes in currency exchange rates in relation to the U.S. dollar. Currency markets generally are not as regulated as securities markets and currency transactions are subject to settlement, custodial and other operational risks. Foreign Currency Transactions Risk . The value of foreign assets as measured in U.S. dollars may be affected favorably or unfavorably by changes in foreign currency rates and exchange control regulations. Currency exchange rates can also be affected unpredictably by intervention by U.S. or foreign governments or central banks, or the failure to intervene, or by currency controls or political developments in the U.S. or abroad. Foreign currency exchange transactions may be conducted on a spot (i.e., cash) basis at the spot rate prevailing in the foreign currency exchange market or through entering into derivative currency transactions. Currency futures contracts are exchange-traded and change in value to reflect movements of a currency or a basket of currencies. Settlement must be made in a designated currency. Forward foreign currency exchange contracts are individually negotiated and privately traded so they are dependent upon the creditworthiness of the counterparty. Such contracts may be used when a security denominated in a foreign currency is purchased or sold, or when the receipt in a foreign currency of dividend or interest payments on such a security is anticipated. A forward contract can then ‘‘lock in’’ the U.S. dollar price of the security or the U.S. dollar equivalent of such dividend or interest payment, as the case may be. Additionally, when the Adviser believes that the currency of a particular foreign country may suffer a substantial decline against the U.S. dollar, it may enter into a forward contract to sell, for a fixed amount of dollars, the amount of foreign currency approximating the value of some or all of the securities held that are denominated in such foreign currency. The precise matching of the forward contract amounts and the value of the securities involved will not generally be possible. In addition, it may not be possible to hedge against long-term currency changes. Cross-hedging may be performed by using forward contracts in one currency (or basket of currencies) to hedge against fluctuations in the value of securities denominated in a different currency if the Adviser determines that there is an established historical pattern of correlation between the two currencies (or the basket of currencies and the underlying currency). Use of a different foreign currency magnifies exposure to foreign currency exchange rate fluctuations. Forward contracts may also be used to shift exposure to foreign currency exchange rate changes from one currency to another. Short-term hedging provides a means of fixing the dollar value of only a portion of portfolio assets. Currency transactions are subject to the risk of a number of complex political and economic factors applicable to the countries issuing the underlying currencies. Furthermore, unlike trading in most other types of instruments, there is no systematic reporting of last sale information with respect to the foreign currencies underlying the derivative currency transactions. As a result, available information may not be complete. In an over-the-counter trading environment, there are no daily price fluctuation limits. There may be no liquid secondary market to close out options purchased or written, or forward contracts entered into, until their exercise, expiration or maturity. There is also the risk of default by, or the bankruptcy of, the financial institution serving as a counterparty. Sector Risk. Because the Fund may, under certain market conditions, invest a significant portion of its assets in the utilities and/or financial services sectors, the value of Fund shares may be affected by events that adversely affect those sectors and may fluctuate more than that of a more broadly diversified fund. The industries within the financial services sector are subject to extensive government regulation, which can limit both the amounts and types of loans and other financial commitments they can make, and the interest rates and fees they can charge. Profitability can be largely dependent on the availability and cost of capital funds and the rate of corporate and consumer debt defaults, and can fluctuate significantly when interest rates change. Credit losses resulting from financial difficulties of borrowers can negatively affect the financial services industries. Insurance companies can be subject to severe price competition. The financial services industries are currently undergoing relatively rapid change as existing distinctions between financial service segments become less clear. For example, recent business combinations have included insurance, finance, and securities brokerage under single ownership. Some primarily retail corporations have expanded into securities and insurance industries. Preferred Stock Risk. Although preferred stocks represent an ownership interest in an issuer, preferred stocks generally do not have voting rights or have limited voting rights and have economic characteristics similar to fixed-income securities. Preferred stocks are subject to issuer-specific risks generally applicable to equity securities and credit and interest rate risks generally applicable to fixed-income securities. The value of preferred stock generally declines when interest rates rise and may react more significantly than bonds and other debt instruments to actual or perceived changes in the company’s financial condition or prospects. Hybrid Securities Risk . Hybrid securities generally possess characteristics common to both equity and debt securities. Preferred stocks, convertible securities, and certain debt obligations are types of hybrid securities. Hybrid securities generally have a preference over common stock in the event of the issuer’s liquidation and perpetual or near perpetual terms at time of issuance. Hybrid securities generally do not have voting rights or have limited voting rights. Because hybrid securities have both debt and equity characteristics, their values vary in response to many factors, including general market and economic conditions, issuer-specific events, changes in interest rates, credit spreads and the credit quality of the issuer, and, for convertible securities, factors affecting the securities into which they convert. Contingent Convertible Securities . Contingent convertible securities (sometimes referred to as “CoCos”) are convertible securities with loss absorption characteristics. These securities provide for mandatory conversion into common stock of the issuer under certain circumstances. The mandatory conversion may be automatically triggered, for instance, if a company fails to meet the capital minimum with respect to the security, the company’s regulator makes a determination that the security should convert or the company receives specified levels of extraordinary public support. Since the common stock of the issuer may not pay a dividend, investors in these instruments could experience a reduced income rate, potentially to zero; and conversion would deepen the subordination of the investor, hence worsening standing in a bankruptcy. In addition, some such instruments have a set stock conversion rate that would cause an automatic write-down of capital if the price of the stock is below the conversion price on the conversion date. Under similar circumstances, the liquidation value of certain types of contingent convertible securities may be adjusted downward to below the original par value. The write down of the par value would occur automatically and would not entitle the holders to seek bankruptcy of the company. In certain circumstances, contingent convertible securities may write down to zero and investors could lose the entire value of the investment, even as the issuer remains in business. CoCos may be subject to redemption at the option of the issuer at a predetermined price. Value Investing Risk . The Fund focuses its investments on dividend-paying common and preferred stocks that the Adviser believes are undervalued or inexpensive relative to other investments. These types of securities may present risks in addition to the general risks associated with investing in common and preferred stocks. These securities generally are selected on the basis of an issuer’s fundamentals relative to current market price. Such securities are subject to the risk of misestimation of certain fundamental factors. In addition, during certain time periods, market dynamics may favor ‘‘growth’’ stocks over ‘‘value’’ stocks. Disciplined adherence to a ‘‘value’’ investment mandate during such periods can result in significant underperformance relative to overall market indices and other managed investment vehicles that pursue growth style investments and/or flexible equity style mandates. Income Risk. The Fund’s ability to distribute income to shareholders will depend on the yield available on the common and preferred stocks and other hybrid securities and fixed-income securities held by the Fund. Changes in the dividend policies of companies held by the Fund could make it difficult for the Fund to provide a predictable level of income. Dividend Capture Trading Risk. The use of dividend capture strategies will expose the Fund to higher portfolio turnover, increased trading costs and potential for capital loss or gain, particularly in the event of significant short-term price movements of stocks subject to dividend capture trading. Credit Risk. Investments in fixed income and other debt obligations, including loans, (referred to below as “debt instruments”) are subject to the risk of non-payment of scheduled principal and interest. Changes in economic conditions or other circumstances may reduce the capacity of the party obligated to make principal and interest payments on such instruments and may lead to defaults. Such non-payments and defaults may reduce the value of Fund shares and income distributions. The value of debt instruments also may decline because of concerns about the issuer’s ability to make principal and interest payments. In addition, the credit ratings of debt instruments may be lowered if the financial condition of the party obligated to make payments with respect to such instruments deteriorates. In the event of bankruptcy of the issuer of a debt instrument, the Fund could experience delays or limitations with respect to its ability to realize the benefits of any collateral securing the instrument. In order to enforce its rights in the event of a default, bankruptcy or similar situation, the Fund may be required to retain legal or similar counsel, which may increase the Fund’s operating expenses and adversely affect net asset value. Below Investment Grade Securities Risk . The Fund’s investments in preferred stocks and bonds of below investment grade quality, if any, are predominantly speculative because of the credit risk of their issuers. While offering a greater potential opportunity for capital appreciation and higher yields, preferred stocks and bonds of below investment grade quality entail greater potential price volatility and may be less liquid than higher-rated securities. Issuers of below investment grade quality preferred stocks and bonds are more likely to default on their payments of dividends/interest and liquidation value/principal owed to the Fund, and such defaults will reduce the Fund’s net asset value and income distributions. The prices of these lower quality preferred stocks and bonds are more sensitive to negative developments than higher rated securities. Adverse business conditions, such as a decline in the issuer’s revenues or an economic downturn, generally lead to a higher non-payment rate. In addition, such a security may lose significant value before a default occurs as the market adjusts to expected higher non-payment rates. Interest Rate Risk. In general, the value of income securities will fluctuate based on changes in interest rates. The value of these securities is likely to increase when interest rates fall and decline when interest rates rise. Duration measures the time-weighted expected cash flows of a fixed-income security, while maturity refers to the amount of time until a fixed-income security matures. Generally, securities with longer durations or maturities are more sensitive to changes in interest rates than securities with shorter durations or maturities, causing them to be more volatile. Conversely, fixed-income securities with shorter durations or maturities will be less volatile but may provide lower returns than fixed-income securities with longer durations or maturities. The impact of interest rate changes is significantly less for floating-rate instruments that have relatively short periodic rate resets (e.g., ninety days or less). In a rising interest rate environment, the durations or maturities of income securities that have the ability to be prepaid or called by the issuer may be extended. In a declining interest rate environment, the proceeds from prepaid or maturing instruments may have to be reinvested at a lower interest rate. Certain instruments held by the Fund were historically based on the London Interbank Offered Rate (“LIBOR”), which is the average offered rate for various maturities of short-term loans between certain major international banks. LIBOR was used throughout global banking and financial industries to determine interest rates for a variety of financial instruments (such as debt instruments and derivatives) and borrowing arrangements. Upon a determination by regulators to phase out the use of LIBOR, market participants have been transitioning to the use of alternative reference rates over the past few years. As of June 30, 2023, the administrator of LIBOR ceased publishing LIBOR settings. The impact of the transition away from LIBOR on certain debt securities, derivatives and other financial instruments that utilize LIBOR remains uncertain. The transition away from LIBOR and the use of replacement rates may adversely affect transactions that used LIBOR as a reference rate, financial institutions, funds and other market participants that engaged in such transactions, and the financial markets generally. Lower Rated Investments Risk. Investments rated below investment grade and comparable unrated investments (sometimes referred to as “junk”) are speculative because of increased credit risk relative to other fixed income investments. Changes in economic conditions or other circumstances typically have a greater effect on the ability of issuers of lower rated investments to make principal and interest payments than they do on issuers of higher rated investments. An economic downturn generally leads to a higher non-payment rate, and a lower rated investment may lose significant value before a default occurs. Lower rated investments typically are subject to greater price volatility and illiquidity than higher rated investments. Derivatives Risk. The Fund’s exposure to derivatives involves risks different from, or possibly greater than, the risks associated with investing directly in securities and other investments. The use of derivatives can lead to losses because of adverse movements in the price or value of the security, instrument, index, currency, commodity, economic indicator or event underlying a derivative (“reference instrument”), due to failure of a counterparty or due to tax or regulatory constraints. Derivatives may create leverage in the Fund, which represents a non-cash exposure to the underlying reference instrument. Leverage can increase both the risk and return potential of the Fund. Derivatives risk may be more significant when derivatives are used to enhance return or as a substitute for a cash investment position, rather than solely to hedge the risk of a position held by the Fund. Use of derivatives involves the exercise of specialized skill and judgment, and a transaction may be unsuccessful in whole or in part because of market behavior or unexpected events. Changes in the value of a derivative (including one used for hedging) may not correlate perfectly with the underlying reference instrument. Derivative instruments traded in over-the-counter markets may be difficult to value, may be illiquid, and may be subject to wide swings in valuation caused by changes in the value of the underlying reference instrument. If a derivative’s counterparty is unable to honor its commitments, the value of Fund shares may decline and the Fund could experience delays in (or be unable to achieve) the return of collateral or other assets held by the counterparty. The loss on derivative transactions may substantially exceed the initial investment. A derivative investment also involves the risks relating to the reference instrument underlying the investment. Counterparty Risk . A financial institution or other counterparty with whom the Fund does business (such as trading or as a derivatives counterparty), or that underwrites, distributes or guarantees any instruments that the Fund owns or is otherwise exposed to, may decline in financial condition and become unable to honor its commitments. This could cause the value of Fund shares to decline or could delay the return or delivery of collateral or other assets to the Fund. Counterparty risk is increased for contracts with longer maturities. ETF Risk. ETFs are subject to the risks of investing in the underlying securities or other investments. ETF shares may trade at a premium or discount to net asset value and are subject to secondary market trading risks. In addition, the Fund will bear a pro rata portion of the operating expenses of an ETF in which it invests. Liquidity Risk. The Fund is exposed to liquidity risk when trading volume, lack of a market maker or trading partner, large position size, market conditions, or legal restrictions impair its ability to sell particular investments or to sell them at advantageous market prices. Consequently, the Fund may have to accept a lower price to sell an investment or continue to hold it or keep the position open, sell other investments to raise cash or abandon an investment opportunity, any of which could have a negative effect on the Fund’s performance. These effects may be exacerbated during times of financial or political stress. Inflation Risk. Inflation risk is the risk that the purchasing power of assets or income from investment will be worth less in the future as inflation decreases the value of money. As inflation increases, the real value of the Common Shares and distributions thereon can decline. In addition, during any periods of rising inflation, dividend rates of preferred shares of the Fund would likely increase, which would tend further to reduce returns to Common Shareholders. Leverage Risk. Certain Fund transactions may give rise to leverage. Leverage can result from a non-cash exposure to the underlying reference instrument. Leverage can increase both the risk and return potential of the Fund. The use of leverage may cause the Fund to maintain liquid assets or liquidate portfolio positions when it may not be advantageous to do so to satisfy its obligations or to meet segregation requirements. Leverage may cause the Fund’s share price to be more volatile than if it had not been leveraged, as certain types of leverage may exaggerate the effect of any increase or decrease in the Fund’s portfolio securities. The loss on leveraged investments may substantially exceed the initial investment. Foreign Investment Risk. Foreign investments can be adversely affected by political, economic and market developments abroad, including the imposition of economic and other sanctions by the United States or another country against a particular country or countries, organizations, entities and/or individuals. There may be less publicly available information about foreign issuers because they may not be subject to reporting practices, requirements or regulations comparable to those to which United States companies are subject. Adverse changes in investment regulations, capital requirements or exchange controls could adversely affect the value of the Fund’s investments. Foreign markets may be smaller, less liquid and more volatile than the major markets in the United States, and as a result, Fund share values may be more volatile. Trading in foreign markets typically involves higher expense than trading in the United States. The Fund may have difficulties enforcing its legal or contractual rights in a foreign country. Risks Associated with Active Management. The success of the Fund’s investment strategy depends on portfolio management’s successful application of analytical skills and investment judgment. Active management involves subjective decisions and there is no guarantee that such decisions will produce the desired results or expected returns. Recent Market Conditions. The outbreak of COVID-19 and efforts to contain its spread have resulted in closing borders, enhanced health screenings, changes to healthcare service preparation and delivery, quarantines, cancellations, disruptions to supply chains and customer activity, as well as general concern and uncertainty. The impact of this coronavirus, and the effects of other infectious illness outbreaks, epidemics or pandemics, may be short term or may continue for an extended period of time. Health crises caused by outbreaks of disease, such as the coronavirus outbreak, may exacerbate other pre-existing political, social and economic risks and disrupt normal market conditions and operations. For example, a global pandemic or other widespread health crisis could cause substantial market volatility and exchange trading suspensions and closures. In addition, the increasing interconnectedness of markets around the world may result in many markets being affected by events or conditions in a single country or region or events affecting a single or small number of issuers. The coronavirus outbreak and public and private sector responses thereto have led to large portions of the populations of many countries working from home for indefinite periods of time, temporary or permanent layoffs, disruptions in supply chains, and lack of availability of certain goods. The impact of such responses could adversely affect the information technology and operational systems upon which the Fund and the Fund’s service providers rely, and could otherwise disrupt the ability of the employees of the Fund’s service providers to perform critical tasks relating to the Fund. Any such impact could adversely affect the Fund’s performance, or the performance of the securities in which the Fund invests and may lead to losses on your investment in the Fund. Cybersecurity Risk. With the increased use of technologies by Fund service providers to conduct business, such as the Internet, the Fund is susceptible to operational, information security and related risks. In general, cyber incidents can result from deliberate attacks or unintentional events. Cybersecurity failures by or breaches of the Fund’s investment adviser or administrator and other service providers (including, but not limited to, the custodian or transfer agent), and the issuers of securities in which the Fund invests, may disrupt and otherwise adversely affect their business operations. This may result in financial losses to the Fund, impeded Fund trading, interfere with the Fund’s ability to calculate its net asset value, interfere with Fund shareholders’ ability to transact business or cause violations of applicable privacy and other laws, regulatory fines, penalties, reputational damage, reimbursement or other compensation costs, or additional compliance costs. Market Disruption . Global instability, war, geopolitical tensions and terrorist attacks in the United States and around the world have previously resulted, and may continue to result in market volatility and may have long-term effects on the United States and worldwide financial markets and may cause further economic uncertainties in the United States and worldwide. The Fund cannot predict the effects of significant future events on the global economy and securities markets. A similar disruption of the financial markets could impact interest rates, auctions, secondary trading, ratings, credit risk, inflation and other factors relating to the Common Shares. Anti-Takeover Provisions. The Fund’s Agreement and Declaration of Trust (the “Declaration of Trust”) and Amended and Restated By-Laws include provisions that could have the effect of limiting the ability of other persons or entities to acquire control of the Fund or to change the composition of its Board. For example, pursuant to the Fund’s Declaration of Trust, the Fund Board is divided into three classes of Trustees with each class serving for a three-year term and certain types of transactions require the favorable vote of holders of at least 75% of the outstanding shares of the Fund. General Fund Investing Risks.
The Fund is not a complete investment program and there is no guarantee that the Fund will achieve its investment objective. It is possible to lose money by investing in the Fund. An investment in the Fund is not a deposit in a bank and is not insured or guaranteed by the Federal Deposit Insurance Corporation or any other government agency. |
|||||||||||||||||||||||||||||||||||||||||||||||||||||||||||||||||||||||||||||||||||||||||||||||||||||||||||||
| Share Price [Table Text Block] | Trading and NAV Information The Fund’s common shares have traded both at a premium and a discount to NAV. The Fund cannot predict whether its shares will trade in the future at a premium or discount to NAV. The provisions of the Investment Company Act of 1940, as amended (the “1940 Act”), generally require that the public offering price of common shares (less any underwriting commissions and discounts) must equal or exceed the NAV per share of a company’s common stock. The issuance of common shares may have an adverse effect on prices in the secondary market for the Fund’s common shares by increasing the number of common shares available, which may put downward pressure on the market price for the Fund’s common shares. Shares of common stock of closed-end investment companies frequently trade at a discount from NAV. In addition, the Fund’s Board of Trustees has authorized the Fund to repurchase up to 10% of its common shares outstanding as of the last day of the prior calendar year at market prices when shares are trading at a discount to net asset value. The share repurchase program does not obligate the Fund to purchase a specific amount of shares. The results of the share repurchase program are disclosed in the Fund’s annual and semi-annual reports to shareholders. The following table sets forth for each of the periods indicated the high and low closing market prices for the common shares on the New York Stock Exchange, and the corresponding NAV per share and the premium or discount to NAV per share at which the Fund’s common shares were trading as of such date.
|
|||||||||||||||||||||||||||||||||||||||||||||||||||||||||||||||||||||||||||||||||||||||||||||||||||||||||||||
| Capital Stock, Long-Term Debt, and Other Securities [Abstract] | ||||||||||||||||||||||||||||||||||||||||||||||||||||||||||||||||||||||||||||||||||||||||||||||||||||||||||||||
| Outstanding Security, Title [Text Block] | Common Shares | |||||||||||||||||||||||||||||||||||||||||||||||||||||||||||||||||||||||||||||||||||||||||||||||||||||||||||||
| Outstanding Security, Not Held [Shares] | 74,542,782 | |||||||||||||||||||||||||||||||||||||||||||||||||||||||||||||||||||||||||||||||||||||||||||||||||||||||||||||
| Sector Risk [Member] | ||||||||||||||||||||||||||||||||||||||||||||||||||||||||||||||||||||||||||||||||||||||||||||||||||||||||||||||
| General Description of Registrant [Abstract] | ||||||||||||||||||||||||||||||||||||||||||||||||||||||||||||||||||||||||||||||||||||||||||||||||||||||||||||||
| Risk [Text Block] | Sector Risk. Because the Fund may, under certain market conditions, invest a significant portion of its assets in the utilities and/or financial services sectors, the value of Fund shares may be affected by events that adversely affect those sectors and may fluctuate more than that of a more broadly diversified fund. The industries within the financial services sector are subject to extensive government regulation, which can limit both the amounts and types of loans and other financial commitments they can make, and the interest rates and fees they can charge. Profitability can be largely dependent on the availability and cost of capital funds and the rate of corporate and consumer debt defaults, and can fluctuate significantly when interest rates change. Credit losses resulting from financial difficulties of borrowers can negatively affect the financial services industries. Insurance companies can be subject to severe price competition. The financial services industries are currently undergoing relatively rapid change as existing distinctions between financial service segments become less clear. For example, recent business combinations have included insurance, finance, and securities brokerage under single ownership. Some primarily retail corporations have expanded into securities and insurance industries.
|
|||||||||||||||||||||||||||||||||||||||||||||||||||||||||||||||||||||||||||||||||||||||||||||||||||||||||||||
| Equity Securities Risk [Member] | ||||||||||||||||||||||||||||||||||||||||||||||||||||||||||||||||||||||||||||||||||||||||||||||||||||||||||||||
| General Description of Registrant [Abstract] | ||||||||||||||||||||||||||||||||||||||||||||||||||||||||||||||||||||||||||||||||||||||||||||||||||||||||||||||
| Risk [Text Block] | Equity Securities Risk. The value of equity securities and related instruments may decline in response to adverse changes in the economy or the economic outlook; deterioration in investor sentiment; interest rate, currency, and commodity price fluctuations; adverse geopolitical, social or environmental developments; issuer and sector-specific considerations; unexpected trading activity among retail investors; or other factors. Market conditions may affect certain types of stocks to a greater extent than other types of stocks. If the stock market declines in value, the value of the Fund’s equity securities will also likely decline. Although prices can rebound, there is no assurance that values will return to previous levels.
|
|||||||||||||||||||||||||||||||||||||||||||||||||||||||||||||||||||||||||||||||||||||||||||||||||||||||||||||
| Dividend Capture Trading Risk [Member] | ||||||||||||||||||||||||||||||||||||||||||||||||||||||||||||||||||||||||||||||||||||||||||||||||||||||||||||||
| General Description of Registrant [Abstract] | ||||||||||||||||||||||||||||||||||||||||||||||||||||||||||||||||||||||||||||||||||||||||||||||||||||||||||||||
| Risk [Text Block] | Dividend Capture Trading Risk. The use of dividend capture strategies will expose the Fund to higher portfolio turnover, increased trading costs and potential for capital loss or gain, particularly in the event of significant short-term price movements of stocks subject to dividend capture trading.
|
|||||||||||||||||||||||||||||||||||||||||||||||||||||||||||||||||||||||||||||||||||||||||||||||||||||||||||||
| Interest Rate Risks [Member] | ||||||||||||||||||||||||||||||||||||||||||||||||||||||||||||||||||||||||||||||||||||||||||||||||||||||||||||||
| General Description of Registrant [Abstract] | ||||||||||||||||||||||||||||||||||||||||||||||||||||||||||||||||||||||||||||||||||||||||||||||||||||||||||||||
| Risk [Text Block] | Interest Rate Risk. In general, the value of income securities will fluctuate based on changes in interest rates. The value of these securities is likely to increase when interest rates fall and decline when interest rates rise. Duration measures the time-weighted expected cash flows of a fixed-income security, while maturity refers to the amount of time until a fixed-income security matures. Generally, securities with longer durations or maturities are more sensitive to changes in interest rates than securities with shorter durations or maturities, causing them to be more volatile. Conversely, fixed-income securities with shorter durations or maturities will be less volatile but may provide lower returns than fixed-income securities with longer durations or maturities. The impact of interest rate changes is significantly less for floating-rate instruments that have relatively short periodic rate resets (e.g., ninety days or less). In a rising interest rate environment, the durations or maturities of income securities that have the ability to be prepaid or called by the issuer may be extended. In a declining interest rate environment, the proceeds from prepaid or maturing instruments may have to be reinvested at a lower interest rate. Certain instruments held by the Fund were historically based on the London Interbank Offered Rate (“LIBOR”), which is the average offered rate for various maturities of short-term loans between certain major international banks. LIBOR was used throughout global banking and financial industries to determine interest rates for a variety of financial instruments (such as debt instruments and derivatives) and borrowing arrangements. Upon a determination by regulators to phase out the use of LIBOR, market participants have been transitioning to the use of alternative reference rates over the past few years. As of June 30, 2023, the administrator of LIBOR ceased publishing LIBOR settings. The impact of the transition away from LIBOR on certain debt securities, derivatives and other financial instruments that utilize LIBOR remains uncertain. The transition away from LIBOR and the use of replacement rates may adversely affect transactions that used LIBOR as a reference rate, financial institutions, funds and other market participants that engaged in such transactions, and the financial markets generally.
|
|||||||||||||||||||||||||||||||||||||||||||||||||||||||||||||||||||||||||||||||||||||||||||||||||||||||||||||
| Below Investment Grade Securities Risk [Member] | ||||||||||||||||||||||||||||||||||||||||||||||||||||||||||||||||||||||||||||||||||||||||||||||||||||||||||||||
| General Description of Registrant [Abstract] | ||||||||||||||||||||||||||||||||||||||||||||||||||||||||||||||||||||||||||||||||||||||||||||||||||||||||||||||
| Risk [Text Block] | Below Investment Grade Securities Risk . The Fund’s investments in preferred stocks and bonds of below investment grade quality, if any, are predominantly speculative because of the credit risk of their issuers. While offering a greater potential opportunity for capital appreciation and higher yields, preferred stocks and bonds of below investment grade quality entail greater potential price volatility and may be less liquid than higher-rated securities. Issuers of below investment grade quality preferred stocks and bonds are more likely to default on their payments of dividends/interest and liquidation value/principal owed to the Fund, and such defaults will reduce the Fund’s net asset value and income distributions. The prices of these lower quality preferred stocks and bonds are more sensitive to negative developments than higher rated securities. Adverse business conditions, such as a decline in the issuer’s revenues or an economic downturn, generally lead to a higher non-payment rate. In addition, such a security may lose significant value before a default occurs as the market adjusts to expected higher non-payment rates.
|
|||||||||||||||||||||||||||||||||||||||||||||||||||||||||||||||||||||||||||||||||||||||||||||||||||||||||||||
| Issuer Risk [Member] | ||||||||||||||||||||||||||||||||||||||||||||||||||||||||||||||||||||||||||||||||||||||||||||||||||||||||||||||
| General Description of Registrant [Abstract] | ||||||||||||||||||||||||||||||||||||||||||||||||||||||||||||||||||||||||||||||||||||||||||||||||||||||||||||||
| Risk [Text Block] | Issuer Risk . The value of common and preferred stocks may decline for a number of reasons which directly relate to the issuer, such as management performance, financial leverage and reduced demand for the issuer’s goods and services.
|
|||||||||||||||||||||||||||||||||||||||||||||||||||||||||||||||||||||||||||||||||||||||||||||||||||||||||||||
| Risks Associated with Active Management [Member] | ||||||||||||||||||||||||||||||||||||||||||||||||||||||||||||||||||||||||||||||||||||||||||||||||||||||||||||||
| General Description of Registrant [Abstract] | ||||||||||||||||||||||||||||||||||||||||||||||||||||||||||||||||||||||||||||||||||||||||||||||||||||||||||||||
| Risk [Text Block] | Risks Associated with Active Management. The success of the Fund’s investment strategy depends on portfolio management’s successful application of analytical skills and investment judgment. Active management involves subjective decisions and there is no guarantee that such decisions will produce the desired results or expected returns.
|
|||||||||||||||||||||||||||||||||||||||||||||||||||||||||||||||||||||||||||||||||||||||||||||||||||||||||||||
| Lower Rated Investments Risk [Member] | ||||||||||||||||||||||||||||||||||||||||||||||||||||||||||||||||||||||||||||||||||||||||||||||||||||||||||||||
| General Description of Registrant [Abstract] | ||||||||||||||||||||||||||||||||||||||||||||||||||||||||||||||||||||||||||||||||||||||||||||||||||||||||||||||
| Risk [Text Block] | Lower Rated Investments Risk. Investments rated below investment grade and comparable unrated investments (sometimes referred to as “junk”) are speculative because of increased credit risk relative to other fixed income investments. Changes in economic conditions or other circumstances typically have a greater effect on the ability of issuers of lower rated investments to make principal and interest payments than they do on issuers of higher rated investments. An economic downturn generally leads to a higher non-payment rate, and a lower rated investment may lose significant value before a default occurs. Lower rated investments typically are subject to greater price volatility and illiquidity than higher rated investments.
|
|||||||||||||||||||||||||||||||||||||||||||||||||||||||||||||||||||||||||||||||||||||||||||||||||||||||||||||
| Inflation Risk [Member] | ||||||||||||||||||||||||||||||||||||||||||||||||||||||||||||||||||||||||||||||||||||||||||||||||||||||||||||||
| General Description of Registrant [Abstract] | ||||||||||||||||||||||||||||||||||||||||||||||||||||||||||||||||||||||||||||||||||||||||||||||||||||||||||||||
| Risk [Text Block] | Inflation Risk. Inflation risk is the risk that the purchasing power of assets or income from investment will be worth less in the future as inflation decreases the value of money. As inflation increases, the real value of the Common Shares and distributions thereon can decline. In addition, during any periods of rising inflation, dividend rates of preferred shares of the Fund would likely increase, which would tend further to reduce returns to Common Shareholders.
|
|||||||||||||||||||||||||||||||||||||||||||||||||||||||||||||||||||||||||||||||||||||||||||||||||||||||||||||
| Contingent Convertible Securities [Member] | ||||||||||||||||||||||||||||||||||||||||||||||||||||||||||||||||||||||||||||||||||||||||||||||||||||||||||||||
| General Description of Registrant [Abstract] | ||||||||||||||||||||||||||||||||||||||||||||||||||||||||||||||||||||||||||||||||||||||||||||||||||||||||||||||
| Risk [Text Block] | Contingent Convertible Securities . Contingent convertible securities (sometimes referred to as “CoCos”) are convertible securities with loss absorption characteristics. These securities provide for mandatory conversion into common stock of the issuer under certain circumstances. The mandatory conversion may be automatically triggered, for instance, if a company fails to meet the capital minimum with respect to the security, the company’s regulator makes a determination that the security should convert or the company receives specified levels of extraordinary public support. Since the common stock of the issuer may not pay a dividend, investors in these instruments could experience a reduced income rate, potentially to zero; and conversion would deepen the subordination of the investor, hence worsening standing in a bankruptcy. In addition, some such instruments have a set stock conversion rate that would cause an automatic write-down of capital if the price of the stock is below the conversion price on the conversion date. Under similar circumstances, the liquidation value of certain types of contingent convertible securities may be adjusted downward to below the original par value. The write down of the par value would occur automatically and would not entitle the holders to seek bankruptcy of the company. In certain circumstances, contingent convertible securities may write down to zero and investors could lose the entire value of the investment, even as the issuer remains in business. CoCos may be subject to redemption at the option of the issuer at a predetermined price.
|
|||||||||||||||||||||||||||||||||||||||||||||||||||||||||||||||||||||||||||||||||||||||||||||||||||||||||||||
| Foreign Investment Risk [Member] | ||||||||||||||||||||||||||||||||||||||||||||||||||||||||||||||||||||||||||||||||||||||||||||||||||||||||||||||
| General Description of Registrant [Abstract] | ||||||||||||||||||||||||||||||||||||||||||||||||||||||||||||||||||||||||||||||||||||||||||||||||||||||||||||||
| Risk [Text Block] | Foreign Investment Risk. Foreign investments can be adversely affected by political, economic and market developments abroad, including the imposition of economic and other sanctions by the United States or another country against a particular country or countries, organizations, entities and/or individuals. There may be less publicly available information about foreign issuers because they may not be subject to reporting practices, requirements or regulations comparable to those to which United States companies are subject. Adverse changes in investment regulations, capital requirements or exchange controls could adversely affect the value of the Fund’s investments. Foreign markets may be smaller, less liquid and more volatile than the major markets in the United States, and as a result, Fund share values may be more volatile. Trading in foreign markets typically involves higher expense than trading in the United States. The Fund may have difficulties enforcing its legal or contractual rights in a foreign country.
|
|||||||||||||||||||||||||||||||||||||||||||||||||||||||||||||||||||||||||||||||||||||||||||||||||||||||||||||
| Market Disruption [Member] | ||||||||||||||||||||||||||||||||||||||||||||||||||||||||||||||||||||||||||||||||||||||||||||||||||||||||||||||
| General Description of Registrant [Abstract] | ||||||||||||||||||||||||||||||||||||||||||||||||||||||||||||||||||||||||||||||||||||||||||||||||||||||||||||||
| Risk [Text Block] | Market Disruption . Global instability, war, geopolitical tensions and terrorist attacks in the United States and around the world have previously resulted, and may continue to result in market volatility and may have long-term effects on the United States and worldwide financial markets and may cause further economic uncertainties in the United States and worldwide. The Fund cannot predict the effects of significant future events on the global economy and securities markets. A similar disruption of the financial markets could impact interest rates, auctions, secondary trading, ratings, credit risk, inflation and other factors relating to the Common Shares.
|
|||||||||||||||||||||||||||||||||||||||||||||||||||||||||||||||||||||||||||||||||||||||||||||||||||||||||||||
| Market Discount Risk [Member] | ||||||||||||||||||||||||||||||||||||||||||||||||||||||||||||||||||||||||||||||||||||||||||||||||||||||||||||||
| General Description of Registrant [Abstract] | ||||||||||||||||||||||||||||||||||||||||||||||||||||||||||||||||||||||||||||||||||||||||||||||||||||||||||||||
| Risk [Text Block] | Market Discount Risk. As with any security, the market value of the common shares may increase or decrease from the amount initially paid for the common shares. The Fund’s common shares have traded both at a premium and at a discount relative to NAV. The shares of closed-end management investment companies frequently trade at a discount from their NAV. This is a risk separate and distinct from the risk that the Fund’s NAV may decrease.
|
|||||||||||||||||||||||||||||||||||||||||||||||||||||||||||||||||||||||||||||||||||||||||||||||||||||||||||||
| Foreign Currency Transactions Risk [Member] | ||||||||||||||||||||||||||||||||||||||||||||||||||||||||||||||||||||||||||||||||||||||||||||||||||||||||||||||
| General Description of Registrant [Abstract] | ||||||||||||||||||||||||||||||||||||||||||||||||||||||||||||||||||||||||||||||||||||||||||||||||||||||||||||||
| Risk [Text Block] | Foreign Currency Transactions Risk . The value of foreign assets as measured in U.S. dollars may be affected favorably or unfavorably by changes in foreign currency rates and exchange control regulations. Currency exchange rates can also be affected unpredictably by intervention by U.S. or foreign governments or central banks, or the failure to intervene, or by currency controls or political developments in the U.S. or abroad. Foreign currency exchange transactions may be conducted on a spot (i.e., cash) basis at the spot rate prevailing in the foreign currency exchange market or through entering into derivative currency transactions. Currency futures contracts are exchange-traded and change in value to reflect movements of a currency or a basket of currencies. Settlement must be made in a designated currency. Forward foreign currency exchange contracts are individually negotiated and privately traded so they are dependent upon the creditworthiness of the counterparty. Such contracts may be used when a security denominated in a foreign currency is purchased or sold, or when the receipt in a foreign currency of dividend or interest payments on such a security is anticipated. A forward contract can then ‘‘lock in’’ the U.S. dollar price of the security or the U.S. dollar equivalent of such dividend or interest payment, as the case may be. Additionally, when the Adviser believes that the currency of a particular foreign country may suffer a substantial decline against the U.S. dollar, it may enter into a forward contract to sell, for a fixed amount of dollars, the amount of foreign currency approximating the value of some or all of the securities held that are denominated in such foreign currency. The precise matching of the forward contract amounts and the value of the securities involved will not generally be possible. In addition, it may not be possible to hedge against long-term currency changes. Cross-hedging may be performed by using forward contracts in one currency (or basket of currencies) to hedge against fluctuations in the value of securities denominated in a different currency if the Adviser determines that there is an established historical pattern of correlation between the two currencies (or the basket of currencies and the underlying currency). Use of a different foreign currency magnifies exposure to foreign currency exchange rate fluctuations. Forward contracts may also be used to shift exposure to foreign currency exchange rate changes from one currency to another. Short-term hedging provides a means of fixing the dollar value of only a portion of portfolio assets. Currency transactions are subject to the risk of a number of complex political and economic factors applicable to the countries issuing the underlying currencies. Furthermore, unlike trading in most other types of instruments, there is no systematic reporting of last sale information with respect to the foreign currencies underlying the derivative currency transactions. As a result, available information may not be complete. In an over-the-counter trading environment, there are no daily price fluctuation limits. There may be no liquid secondary market to close out options purchased or written, or forward contracts entered into, until their exercise, expiration or maturity. There is also the risk of default by, or the bankruptcy of, the financial institution serving as a counterparty.
|
|||||||||||||||||||||||||||||||||||||||||||||||||||||||||||||||||||||||||||||||||||||||||||||||||||||||||||||
| Counterparty Risk [Member] | ||||||||||||||||||||||||||||||||||||||||||||||||||||||||||||||||||||||||||||||||||||||||||||||||||||||||||||||
| General Description of Registrant [Abstract] | ||||||||||||||||||||||||||||||||||||||||||||||||||||||||||||||||||||||||||||||||||||||||||||||||||||||||||||||
| Risk [Text Block] | Counterparty Risk . A financial institution or other counterparty with whom the Fund does business (such as trading or as a derivatives counterparty), or that underwrites, distributes or guarantees any instruments that the Fund owns or is otherwise exposed to, may decline in financial condition and become unable to honor its commitments. This could cause the value of Fund shares to decline or could delay the return or delivery of collateral or other assets to the Fund. Counterparty risk is increased for contracts with longer maturities.
|
|||||||||||||||||||||||||||||||||||||||||||||||||||||||||||||||||||||||||||||||||||||||||||||||||||||||||||||
| Recent Market Conditions [Member] | ||||||||||||||||||||||||||||||||||||||||||||||||||||||||||||||||||||||||||||||||||||||||||||||||||||||||||||||
| General Description of Registrant [Abstract] | ||||||||||||||||||||||||||||||||||||||||||||||||||||||||||||||||||||||||||||||||||||||||||||||||||||||||||||||
| Risk [Text Block] | Recent Market Conditions. The outbreak of COVID-19 and efforts to contain its spread have resulted in closing borders, enhanced health screenings, changes to healthcare service preparation and delivery, quarantines, cancellations, disruptions to supply chains and customer activity, as well as general concern and uncertainty. The impact of this coronavirus, and the effects of other infectious illness outbreaks, epidemics or pandemics, may be short term or may continue for an extended period of time. Health crises caused by outbreaks of disease, such as the coronavirus outbreak, may exacerbate other pre-existing political, social and economic risks and disrupt normal market conditions and operations. For example, a global pandemic or other widespread health crisis could cause substantial market volatility and exchange trading suspensions and closures. In addition, the increasing interconnectedness of markets around the world may result in many markets being affected by events or conditions in a single country or region or events affecting a single or small number of issuers. The coronavirus outbreak and public and private sector responses thereto have led to large portions of the populations of many countries working from home for indefinite periods of time, temporary or permanent layoffs, disruptions in supply chains, and lack of availability of certain goods. The impact of such responses could adversely affect the information technology and operational systems upon which the Fund and the Fund’s service providers rely, and could otherwise disrupt the ability of the employees of the Fund’s service providers to perform critical tasks relating to the Fund. Any such impact could adversely affect the Fund’s performance, or the performance of the securities in which the Fund invests and may lead to losses on your investment in the Fund.
|
|||||||||||||||||||||||||||||||||||||||||||||||||||||||||||||||||||||||||||||||||||||||||||||||||||||||||||||
| Credit Risks [Member] | ||||||||||||||||||||||||||||||||||||||||||||||||||||||||||||||||||||||||||||||||||||||||||||||||||||||||||||||
| General Description of Registrant [Abstract] | ||||||||||||||||||||||||||||||||||||||||||||||||||||||||||||||||||||||||||||||||||||||||||||||||||||||||||||||
| Risk [Text Block] | Credit Risk. Investments in fixed income and other debt obligations, including loans, (referred to below as “debt instruments”) are subject to the risk of non-payment of scheduled principal and interest. Changes in economic conditions or other circumstances may reduce the capacity of the party obligated to make principal and interest payments on such instruments and may lead to defaults. Such non-payments and defaults may reduce the value of Fund shares and income distributions. The value of debt instruments also may decline because of concerns about the issuer’s ability to make principal and interest payments. In addition, the credit ratings of debt instruments may be lowered if the financial condition of the party obligated to make payments with respect to such instruments deteriorates. In the event of bankruptcy of the issuer of a debt instrument, the Fund could experience delays or limitations with respect to its ability to realize the benefits of any collateral securing the instrument. In order to enforce its rights in the event of a default, bankruptcy or similar situation, the Fund may be required to retain legal or similar counsel, which may increase the Fund’s operating expenses and adversely affect net asset value.
|
|||||||||||||||||||||||||||||||||||||||||||||||||||||||||||||||||||||||||||||||||||||||||||||||||||||||||||||
| TaxSensitive Investing Risk [Member] | ||||||||||||||||||||||||||||||||||||||||||||||||||||||||||||||||||||||||||||||||||||||||||||||||||||||||||||||
| General Description of Registrant [Abstract] | ||||||||||||||||||||||||||||||||||||||||||||||||||||||||||||||||||||||||||||||||||||||||||||||||||||||||||||||
| Risk [Text Block] | Tax-Sensitive Investing Risk. The Fund may hold a security in order to achieve more favorable tax-treatment or to sell a security in order to create tax losses. The Fund’s utilization of various tax-management techniques may be curtailed or eliminated by tax legislation, regulation or interpretations. The Fund may not be able to minimize taxable distributions to shareholders and a portion of the Fund’s distributions may be taxable.
|
|||||||||||||||||||||||||||||||||||||||||||||||||||||||||||||||||||||||||||||||||||||||||||||||||||||||||||||
| Cybersecurity Risk [Member] | ||||||||||||||||||||||||||||||||||||||||||||||||||||||||||||||||||||||||||||||||||||||||||||||||||||||||||||||
| General Description of Registrant [Abstract] | ||||||||||||||||||||||||||||||||||||||||||||||||||||||||||||||||||||||||||||||||||||||||||||||||||||||||||||||
| Risk [Text Block] | Cybersecurity Risk. With the increased use of technologies by Fund service providers to conduct business, such as the Internet, the Fund is susceptible to operational, information security and related risks. In general, cyber incidents can result from deliberate attacks or unintentional events. Cybersecurity failures by or breaches of the Fund’s investment adviser or administrator and other service providers (including, but not limited to, the custodian or transfer agent), and the issuers of securities in which the Fund invests, may disrupt and otherwise adversely affect their business operations. This may result in financial losses to the Fund, impeded Fund trading, interfere with the Fund’s ability to calculate its net asset value, interfere with Fund shareholders’ ability to transact business or cause violations of applicable privacy and other laws, regulatory fines, penalties, reputational damage, reimbursement or other compensation costs, or additional compliance costs.
|
|||||||||||||||||||||||||||||||||||||||||||||||||||||||||||||||||||||||||||||||||||||||||||||||||||||||||||||
| Derivatives Risk [Member] | ||||||||||||||||||||||||||||||||||||||||||||||||||||||||||||||||||||||||||||||||||||||||||||||||||||||||||||||
| General Description of Registrant [Abstract] | ||||||||||||||||||||||||||||||||||||||||||||||||||||||||||||||||||||||||||||||||||||||||||||||||||||||||||||||
| Risk [Text Block] | Derivatives Risk. The Fund’s exposure to derivatives involves risks different from, or possibly greater than, the risks associated with investing directly in securities and other investments. The use of derivatives can lead to losses because of adverse movements in the price or value of the security, instrument, index, currency, commodity, economic indicator or event underlying a derivative (“reference instrument”), due to failure of a counterparty or due to tax or regulatory constraints. Derivatives may create leverage in the Fund, which represents a non-cash exposure to the underlying reference instrument. Leverage can increase both the risk and return potential of the Fund. Derivatives risk may be more significant when derivatives are used to enhance return or as a substitute for a cash investment position, rather than solely to hedge the risk of a position held by the Fund. Use of derivatives involves the exercise of specialized skill and judgment, and a transaction may be unsuccessful in whole or in part because of market behavior or unexpected events. Changes in the value of a derivative (including one used for hedging) may not correlate perfectly with the underlying reference instrument. Derivative instruments traded in over-the-counter markets may be difficult to value, may be illiquid, and may be subject to wide swings in valuation caused by changes in the value of the underlying reference instrument. If a derivative’s counterparty is unable to honor its commitments, the value of Fund shares may decline and the Fund could experience delays in (or be unable to achieve) the return of collateral or other assets held by the counterparty. The loss on derivative transactions may substantially exceed the initial investment. A derivative investment also involves the risks relating to the reference instrument underlying the investment.
|
|||||||||||||||||||||||||||||||||||||||||||||||||||||||||||||||||||||||||||||||||||||||||||||||||||||||||||||
| Currency Risk [Member] | ||||||||||||||||||||||||||||||||||||||||||||||||||||||||||||||||||||||||||||||||||||||||||||||||||||||||||||||
| General Description of Registrant [Abstract] | ||||||||||||||||||||||||||||||||||||||||||||||||||||||||||||||||||||||||||||||||||||||||||||||||||||||||||||||
| Risk [Text Block] | Currency Risk. Exchange rates for currencies fluctuate daily. The value of foreign investments may be affected favorably or unfavorably by changes in currency exchange rates in relation to the U.S. dollar. Currency markets generally are not as regulated as securities markets and currency transactions are subject to settlement, custodial and other operational risks.
|
|||||||||||||||||||||||||||||||||||||||||||||||||||||||||||||||||||||||||||||||||||||||||||||||||||||||||||||
| Liquidity Risk [Member] | ||||||||||||||||||||||||||||||||||||||||||||||||||||||||||||||||||||||||||||||||||||||||||||||||||||||||||||||
| General Description of Registrant [Abstract] | ||||||||||||||||||||||||||||||||||||||||||||||||||||||||||||||||||||||||||||||||||||||||||||||||||||||||||||||
| Risk [Text Block] | Liquidity Risk. The Fund is exposed to liquidity risk when trading volume, lack of a market maker or trading partner, large position size, market conditions, or legal restrictions impair its ability to sell particular investments or to sell them at advantageous market prices. Consequently, the Fund may have to accept a lower price to sell an investment or continue to hold it or keep the position open, sell other investments to raise cash or abandon an investment opportunity, any of which could have a negative effect on the Fund’s performance. These effects may be exacerbated during times of financial or political stress.
|
|||||||||||||||||||||||||||||||||||||||||||||||||||||||||||||||||||||||||||||||||||||||||||||||||||||||||||||
| Tax Risk [Member] | ||||||||||||||||||||||||||||||||||||||||||||||||||||||||||||||||||||||||||||||||||||||||||||||||||||||||||||||
| General Description of Registrant [Abstract] | ||||||||||||||||||||||||||||||||||||||||||||||||||||||||||||||||||||||||||||||||||||||||||||||||||||||||||||||
| Risk [Text Block] | Tax Risk. Although the Fund seeks to minimize and defer the federal income taxes incurred by common shareholders in connection with their investment in the Fund, there can be no assurance that it will be successful in this regard. The tax treatment and characterization of the Fund’s distributions may change over time due to changes in the Fund’s mix of investment returns and changes in the federal tax laws, regulations and administrative and judicial interpretations. The Fund’s investment program and the tax treatment of Fund distributions may be affected by IRS interpretations of the Internal Revenue Code of 1986, as amended (the “Code”) and future changes in tax laws and regulations. Distributions paid on the common shares may be characterized variously as non-qualified dividends (taxable at ordinary income rates), qualified dividends (generally taxable at long-term capital gains rates), capital gains dividends (taxable at long-term capital gains rates) or return of capital (generally not currently taxable). The ultimate tax characterization of the Fund’s distributions made in a calendar year may not finally be determined until after the end of that calendar year. Distributions to a common shareholder that are return of capital are tax free to the amount of the common shareholder’s current tax basis in his or her common shares, with any distribution amounts exceeding such basis treated as capital gain on a deemed sale of common shares. common shareholders are required to reduce their tax basis in common shares by the amount of tax-free return of capital distributions received, thereby increasing the amount of capital gain (or decreasing the amount of capital loss) to be recognized upon a later disposition of the common shares. In order for Fund distributions of qualified dividend income to be taxable at favorable long-term capital gains rates, a common shareholder must meet certain prescribed holding period and other requirements with respect to his or her common shares. If positions held by the Fund were treated as “straddles” for federal income tax purposes, dividends on such positions would not constitute qualified dividend income subject to favorable income tax treatment.
|
|||||||||||||||||||||||||||||||||||||||||||||||||||||||||||||||||||||||||||||||||||||||||||||||||||||||||||||
| Hybrid Securities Risk [Member] | ||||||||||||||||||||||||||||||||||||||||||||||||||||||||||||||||||||||||||||||||||||||||||||||||||||||||||||||
| General Description of Registrant [Abstract] | ||||||||||||||||||||||||||||||||||||||||||||||||||||||||||||||||||||||||||||||||||||||||||||||||||||||||||||||
| Risk [Text Block] | Hybrid Securities Risk . Hybrid securities generally possess characteristics common to both equity and debt securities. Preferred stocks, convertible securities, and certain debt obligations are types of hybrid securities. Hybrid securities generally have a preference over common stock in the event of the issuer’s liquidation and perpetual or near perpetual terms at time of issuance. Hybrid securities generally do not have voting rights or have limited voting rights. Because hybrid securities have both debt and equity characteristics, their values vary in response to many factors, including general market and economic conditions, issuer-specific events, changes in interest rates, credit spreads and the credit quality of the issuer, and, for convertible securities, factors affecting the securities into which they convert.
|
|||||||||||||||||||||||||||||||||||||||||||||||||||||||||||||||||||||||||||||||||||||||||||||||||||||||||||||
| Preferred Stock Risk [Member] | ||||||||||||||||||||||||||||||||||||||||||||||||||||||||||||||||||||||||||||||||||||||||||||||||||||||||||||||
| General Description of Registrant [Abstract] | ||||||||||||||||||||||||||||||||||||||||||||||||||||||||||||||||||||||||||||||||||||||||||||||||||||||||||||||
| Risk [Text Block] | Preferred Stock Risk. Although preferred stocks represent an ownership interest in an issuer, preferred stocks generally do not have voting rights or have limited voting rights and have economic characteristics similar to fixed-income securities. Preferred stocks are subject to issuer-specific risks generally applicable to equity securities and credit and interest rate risks generally applicable to fixed-income securities. The value of preferred stock generally declines when interest rates rise and may react more significantly than bonds and other debt instruments to actual or perceived changes in the company’s financial condition or prospects.
|
|||||||||||||||||||||||||||||||||||||||||||||||||||||||||||||||||||||||||||||||||||||||||||||||||||||||||||||
| ETF Risk [Member] | ||||||||||||||||||||||||||||||||||||||||||||||||||||||||||||||||||||||||||||||||||||||||||||||||||||||||||||||
| General Description of Registrant [Abstract] | ||||||||||||||||||||||||||||||||||||||||||||||||||||||||||||||||||||||||||||||||||||||||||||||||||||||||||||||
| Risk [Text Block] | ETF Risk. ETFs are subject to the risks of investing in the underlying securities or other investments. ETF shares may trade at a premium or discount to net asset value and are subject to secondary market trading risks. In addition, the Fund will bear a pro rata portion of the operating expenses of an ETF in which it invests.
|
|||||||||||||||||||||||||||||||||||||||||||||||||||||||||||||||||||||||||||||||||||||||||||||||||||||||||||||
| AntiTakeover Provisions [Member] | ||||||||||||||||||||||||||||||||||||||||||||||||||||||||||||||||||||||||||||||||||||||||||||||||||||||||||||||
| General Description of Registrant [Abstract] | ||||||||||||||||||||||||||||||||||||||||||||||||||||||||||||||||||||||||||||||||||||||||||||||||||||||||||||||
| Risk [Text Block] | Anti-Takeover Provisions. The Fund’s Agreement and Declaration of Trust (the “Declaration of Trust”) and Amended and Restated By-Laws include provisions that could have the effect of limiting the ability of other persons or entities to acquire control of the Fund or to change the composition of its Board. For example, pursuant to the Fund’s Declaration of Trust, the Fund Board is divided into three classes of Trustees with each class serving for a three-year term and certain types of transactions require the favorable vote of holders of at least 75% of the outstanding shares of the Fund.
|
|||||||||||||||||||||||||||||||||||||||||||||||||||||||||||||||||||||||||||||||||||||||||||||||||||||||||||||
| Market Risk [Member] | ||||||||||||||||||||||||||||||||||||||||||||||||||||||||||||||||||||||||||||||||||||||||||||||||||||||||||||||
| General Description of Registrant [Abstract] | ||||||||||||||||||||||||||||||||||||||||||||||||||||||||||||||||||||||||||||||||||||||||||||||||||||||||||||||
| Risk [Text Block] | Market Risk. The value of investments held by the Fund may increase or decrease in response to social, economic, political, financial, public health crises or other disruptive events (whether real, expected or perceived) in the U.S. and global markets, and include events such as war, natural disasters, epidemics and pandemics, terrorism, conflicts and social unrest. These events may negatively impact broad segments of businesses and populations and may exacerbate pre-existing risks to the Fund. The frequency and magnitude of resulting changes in the value of the Fund’s investments cannot be predicted. Certain securities and other investments held by the Fund may experience increased volatility, illiquidity, or other potentially adverse effects in reaction to changing market conditions. Monetary and/or fiscal actions taken by U.S. or foreign governments to stimulate or stabilize the global economy may not be effective and could lead to high market volatility. No active trading market may exist for certain investments held by the Fund, which may impair the ability of the Fund to sell or to realize the current valuation of such investments in the event of the need to liquidate such assets.
|
|||||||||||||||||||||||||||||||||||||||||||||||||||||||||||||||||||||||||||||||||||||||||||||||||||||||||||||
| Leverage Risk [Member] | ||||||||||||||||||||||||||||||||||||||||||||||||||||||||||||||||||||||||||||||||||||||||||||||||||||||||||||||
| General Description of Registrant [Abstract] | ||||||||||||||||||||||||||||||||||||||||||||||||||||||||||||||||||||||||||||||||||||||||||||||||||||||||||||||
| Risk [Text Block] | Leverage Risk. Certain Fund transactions may give rise to leverage. Leverage can result from a non-cash exposure to the underlying reference instrument. Leverage can increase both the risk and return potential of the Fund. The use of leverage may cause the Fund to maintain liquid assets or liquidate portfolio positions when it may not be advantageous to do so to satisfy its obligations or to meet segregation requirements. Leverage may cause the Fund’s share price to be more volatile than if it had not been leveraged, as certain types of leverage may exaggerate the effect of any increase or decrease in the Fund’s portfolio securities. The loss on leveraged investments may substantially exceed the initial investment.
|
|||||||||||||||||||||||||||||||||||||||||||||||||||||||||||||||||||||||||||||||||||||||||||||||||||||||||||||
| Value Investing Risk [Member] | ||||||||||||||||||||||||||||||||||||||||||||||||||||||||||||||||||||||||||||||||||||||||||||||||||||||||||||||
| General Description of Registrant [Abstract] | ||||||||||||||||||||||||||||||||||||||||||||||||||||||||||||||||||||||||||||||||||||||||||||||||||||||||||||||
| Risk [Text Block] | Value Investing Risk . The Fund focuses its investments on dividend-paying common and preferred stocks that the Adviser believes are undervalued or inexpensive relative to other investments. These types of securities may present risks in addition to the general risks associated with investing in common and preferred stocks. These securities generally are selected on the basis of an issuer’s fundamentals relative to current market price. Such securities are subject to the risk of misestimation of certain fundamental factors. In addition, during certain time periods, market dynamics may favor ‘‘growth’’ stocks over ‘‘value’’ stocks. Disciplined adherence to a ‘‘value’’ investment mandate during such periods can result in significant underperformance relative to overall market indices and other managed investment vehicles that pursue growth style investments and/or flexible equity style mandates.
|
|||||||||||||||||||||||||||||||||||||||||||||||||||||||||||||||||||||||||||||||||||||||||||||||||||||||||||||
| General Fund Investing Risks [Member] | ||||||||||||||||||||||||||||||||||||||||||||||||||||||||||||||||||||||||||||||||||||||||||||||||||||||||||||||
| General Description of Registrant [Abstract] | ||||||||||||||||||||||||||||||||||||||||||||||||||||||||||||||||||||||||||||||||||||||||||||||||||||||||||||||
| Risk [Text Block] | General Fund Investing Risks. The Fund is not a complete investment program and there is no guarantee that the Fund will achieve its investment objective. It is possible to lose money by investing in the Fund. An investment in the Fund is not a deposit in a bank and is not insured or guaranteed by the Federal Deposit Insurance Corporation or any other government agency.
|
|||||||||||||||||||||||||||||||||||||||||||||||||||||||||||||||||||||||||||||||||||||||||||||||||||||||||||||
| Income Risk [Member] | ||||||||||||||||||||||||||||||||||||||||||||||||||||||||||||||||||||||||||||||||||||||||||||||||||||||||||||||
| General Description of Registrant [Abstract] | ||||||||||||||||||||||||||||||||||||||||||||||||||||||||||||||||||||||||||||||||||||||||||||||||||||||||||||||
| Risk [Text Block] | Income Risk. The Fund’s ability to distribute income to shareholders will depend on the yield available on the common and preferred stocks and other hybrid securities and fixed-income securities held by the Fund. Changes in the dividend policies of companies held by the Fund could make it difficult for the Fund to provide a predictable level of income.
|
|||||||||||||||||||||||||||||||||||||||||||||||||||||||||||||||||||||||||||||||||||||||||||||||||||||||||||||
| Common Share [Member] | ||||||||||||||||||||||||||||||||||||||||||||||||||||||||||||||||||||||||||||||||||||||||||||||||||||||||||||||
| General Description of Registrant [Abstract] | ||||||||||||||||||||||||||||||||||||||||||||||||||||||||||||||||||||||||||||||||||||||||||||||||||||||||||||||
| Lowest Price or Bid | $ 18.7 | $ 21.34 | $ 21.39 | $ 22.49 | $ 21.42 | $ 22.34 | $ 25.35 | $ 26.54 | ||||||||||||||||||||||||||||||||||||||||||||||||||||||||||||||||||||||||||||||||||||||||||||||||||||||
| Highest Price or Bid | 23.49 | 23.6 | 24.74 | 24.79 | 26.61 | 26.36 | 29.44 | 30.08 | ||||||||||||||||||||||||||||||||||||||||||||||||||||||||||||||||||||||||||||||||||||||||||||||||||||||
| Lowest Price or Bid, NAV | 21.1 | 22.68 | 22.11 | 23.64 | 21.91 | 23.12 | 26.45 | 27.42 | ||||||||||||||||||||||||||||||||||||||||||||||||||||||||||||||||||||||||||||||||||||||||||||||||||||||
| Highest Price or Bid, NAV | $ 24.69 | $ 24.8 | $ 25.46 | $ 25.18 | $ 26.09 | $ 26.49 | $ 27.73 | $ 29.09 | ||||||||||||||||||||||||||||||||||||||||||||||||||||||||||||||||||||||||||||||||||||||||||||||||||||||
| Highest Price or Bid, Premium (Discount) to NAV [Percent] | (4.86%) | (4.84%) | (2.83%) | (1.55%) | 1.99% | (0.49%) | 6.17% | 3.40% | ||||||||||||||||||||||||||||||||||||||||||||||||||||||||||||||||||||||||||||||||||||||||||||||||||||||
| Lowest Price or Bid, Premium (Discount) to NAV [Percent] | (11.37%) | (5.91%) | (3.26%) | (4.86%) | (2.24%) | (3.37%) | (4.16%) | (3.21%) | ||||||||||||||||||||||||||||||||||||||||||||||||||||||||||||||||||||||||||||||||||||||||||||||||||||||
| Senior Securities [Member] | ||||||||||||||||||||||||||||||||||||||||||||||||||||||||||||||||||||||||||||||||||||||||||||||||||||||||||||||
| Financial Highlights [Abstract] | ||||||||||||||||||||||||||||||||||||||||||||||||||||||||||||||||||||||||||||||||||||||||||||||||||||||||||||||
| Senior Securities Amount | $ 447,000,000 | $ 447,000,000 | $ 447,000,000 | $ 447,000,000 | $ 447,000,000 | $ 447,000,000 | $ 447,000,000 | $ 447,000,000 | $ 447,000,000 | $ 447,000,000 | $ 447,000,000 | $ 447,000,000 | ||||||||||||||||||||||||||||||||||||||||||||||||||||||||||||||||||||||||||||||||||||||||||||||||||
| Senior Securities Coverage per Unit | [9] | $ 4,598 | $ 4,970 | $ 4,598 | $ 5,714 | $ 4,454 | $ 4,992 | $ 4,692 | $ 4,953 | $ 4,619 | $ 4,521 | $ 4,457 | $ 4,739 | |||||||||||||||||||||||||||||||||||||||||||||||||||||||||||||||||||||||||||||||||||||||||||||||||
| ||||||||||||||||||||||||||||||||||||||||||||||||||||||||||||||||||||||||||||||||||||||||||||||||||||||||||||||
1 Year Eaton Vance Tax Advantag... Chart |
1 Month Eaton Vance Tax Advantag... Chart |

It looks like you are not logged in. Click the button below to log in and keep track of your recent history.
Support: +44 (0) 203 8794 460 | support@advfn.com
By accessing the services available at ADVFN you are agreeing to be bound by ADVFN's Terms & Conditions
 Hot Features