ADVFN Logo ADVFN

We could not find any results for:
Make sure your spelling is correct or try broadening your search.

Trending Now

Toplists

It looks like you aren't logged in.
Click the button below to log in and view your recent history.

Hot Features

Registration Strip Icon for alerts Register for real-time alerts, custom portfolio, and market movers

EVT Eaton Vance Tax Advantaged Dividend Income Fund

24.19
0.31 (1.30%)
After Hours
Last Updated: 21:00:05
Delayed by 15 minutes
Share Name Share Symbol Market Type
Eaton Vance Tax Advantaged Dividend Income Fund NYSE:EVT NYSE Common Stock
  Price Change % Change Share Price High Price Low Price Open Price Shares Traded Last Trade
  0.31 1.30% 24.19 24.23 23.9254 23.94 184,531 21:00:05

Eaton Vance Tax-Advantaged Dividend Income Fund Report of Earnings

29/10/2008 7:04pm

Business Wire


Eaton Vance Tax Advantag... (NYSE:EVT)
Historical Stock Chart


From Jul 2019 to Jul 2024
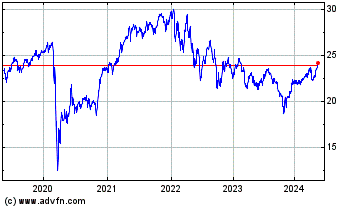
Click Here for more Eaton Vance Tax Advantag... Charts.
Eaton Vance Tax-Advantaged Dividend Income Fund (NYSE: EVT), a diversified closed-end investment company, today announced the earnings of the Fund for the three months ended August 31, 2008 and for the year ended August 31, 2008. The Fund’s fiscal year ended on August 31, 2008. For the three months ended August 31, 2008, the Fund had net investment income of $25,988,224 ($0.357 per common share). For the year ended August 31, 2008, the Fund had net investment income of $161,017,582 ($2.211 per common share). From this amount, the Fund paid dividends on preferred shares of $20,059,122 (equal to $0.275 for each common share), resulting in net investment income after the preferred dividends of $140,958,460 or $1.936 per common share. In comparison, for the three months ended August 31, 2007, the Fund had net investment income of $36,754,685 ($0.505 per common share). From this amount, the Fund paid dividends on preferred shares of $8,276,046 (equal to $0.114 for each common share), resulting in net investment income after the preferred dividends of $28,478,639 or $0.391 per common share. For the year ended August 31, 2007, the Fund had net investment income of $157,161,046 ($2.158 per common share). From this amount, the Fund paid dividends on preferred shares of $31,847,019 (equal to $0.437 for each common share), resulting in net investment income after the preferred dividends of $125,314,027 or $1.721 per common share. Net realized and unrealized losses for the three months ended August 31, 2008 were $338,918,232 ($4.653 per common share) and net realized and unrealized losses for the year ended August 31, 2008 were $441,649,765 ($6.058 per common share). In comparison, net realized and unrealized losses for the three months ended August 31, 2007 were $193,982,210 ($2.663 per common share) and net realized and unrealized gains for the year ended August 31, 2007 were $245,661,653 ($3.369 per common share). On August 31, 2008, net assets of the Fund were $1,771,251,765. The net asset value per share on August 31, 2008 was $24.32 based on 72,835,900 shares outstanding. In comparison, on August 31, 2007, net assets applicable to common shares of the Fund were $2,208,015,098. The net asset value per common share on August 31, 2007 was $30.31 based on 72,835,900 common shares outstanding. The Fund is managed by Eaton Vance Management. Eaton Vance and its affiliates had $144.0 billion in assets under management as of September 30, 2008. Eaton Vance Management will make available periodic summary information regarding portfolio investments. Those interested should call Eaton Vance Marketing at (800) 262-1122. EATON VANCE TAX-ADVANTAGED DIVIDEND INCOME FUND SUMMARY OF RESULTS OF OPERATIONS (in thousands, except per share amounts)         Three Months Ended Year Ended August 31, August 31, 2008 2007 2008 2007 Gross investment income $34,733 $42,193 $189,602 $178,541 Operating expenses (4,150 ) (5,438 ) (20,074 ) (21,380 ) Interest expense (4,595 ) -   (8,510 ) -   Net investment income $25,988 $36,755 $161,018 $157,161 Net realized and unrealized gains (losses) on investments ($338,918 ) ($193,982 ) ($441,650 ) $245,662 Preferred dividends paid (1) $0   ($8,276 ) ($20,059 ) ($31,847 ) Net increase (decrease) in net assets from operations ($312,930 ) ($165,503 ) ($300,691 ) $370,976     Earnings per Common Share Outstanding Gross investment income $0.477 $0.579 $2.603 $2.451 Operating expenses (0.057 ) (0.074 ) (0.276 ) (0.293 ) Interest expense (0.063 ) -   (0.116 ) -   Net investment income $0.357 $0.505 $2.211 $2.158 Net realized and unrealized gains (losses) on investments ($4.653 ) ($2.663 ) ($6.058 ) $3.369 Preferred dividends paid (1) -   (0.114 ) (0.275 ) (0.437 ) Net increase (decrease) in net assets from operations ($4.296 ) ($2.272 ) ($4.122 ) $5.090     Net investment income $0.357 $0.505 $2.211 $2.158 Preferred dividends paid -   (0.114 ) (0.275 ) (0.437 ) Net investment income after preferred dividends $0.357   $0.391   $1.936   $1.721       Net Asset Value at August 31(Common Shares) Net assets (000) $1,771,252 $2,208,015 Shares outstanding (000) 72,836 72,836 Net asset value per share outstanding $24.32 $30.31   Market Value Summary (Common Shares) Market price on NYSE at August 31 $21.05 $27.13 High market price (period ended August 31) $29.40 $30.76 Low market price (period ended August 31) $20.60 $24.32 (1) As of April 23, 2008, all series of preferred shares had been redeemed.

1 Year Eaton Vance Tax Advantag... Chart

1 Year Eaton Vance Tax Advantag... Chart

1 Month Eaton Vance Tax Advantag... Chart

1 Month Eaton Vance Tax Advantag... Chart

Your Recent History

Delayed Upgrade Clock