000128481212/312023Q2false00012848122023-01-012023-06-3000012848122023-07-31xbrli:shares00012848122023-06-30iso4217:USD00012848122022-12-310001284812cns:GLISICAVGRPCIPSICAVGREandSICAVRAPMember2023-06-300001284812cns:GLISICAVGRPCIPSICAVGREandSICAVRAPMember2022-12-31iso4217:USDxbrli:shares0001284812us-gaap:InvestmentAdviceMember2023-04-012023-06-300001284812us-gaap:InvestmentAdviceMember2022-04-012022-06-300001284812us-gaap:InvestmentAdviceMember2023-01-012023-06-300001284812us-gaap:InvestmentAdviceMember2022-01-012022-06-300001284812us-gaap:FinancialServiceMember2023-04-012023-06-300001284812us-gaap:FinancialServiceMember2022-04-012022-06-300001284812us-gaap:FinancialServiceMember2023-01-012023-06-300001284812us-gaap:FinancialServiceMember2022-01-012022-06-300001284812us-gaap:FinancialServiceOtherMember2023-04-012023-06-300001284812us-gaap:FinancialServiceOtherMember2022-04-012022-06-300001284812us-gaap:FinancialServiceOtherMember2023-01-012023-06-300001284812us-gaap:FinancialServiceOtherMember2022-01-012022-06-3000012848122023-04-012023-06-3000012848122022-04-012022-06-3000012848122022-01-012022-06-300001284812us-gaap:CommonStockMember2023-03-310001284812us-gaap:AdditionalPaidInCapitalMember2023-03-310001284812us-gaap:RetainedEarningsMember2023-03-310001284812us-gaap:AccumulatedOtherComprehensiveIncomeMember2023-03-310001284812us-gaap:TreasuryStockCommonMember2023-03-310001284812cns:NonredeemableNoncontrollingInterestMember2023-03-310001284812cns:ParentIncludingNonredeemableNonControllingInterestMember2023-03-310001284812us-gaap:NoncontrollingInterestMember2023-03-310001284812us-gaap:RetainedEarningsMember2023-04-012023-06-300001284812cns:ParentIncludingNonredeemableNonControllingInterestMember2023-04-012023-06-300001284812us-gaap:CommonStockMember2023-04-012023-06-300001284812us-gaap:AdditionalPaidInCapitalMember2023-04-012023-06-300001284812us-gaap:TreasuryStockCommonMember2023-04-012023-06-300001284812cns:NonredeemableNoncontrollingInterestMember2023-04-012023-06-300001284812us-gaap:NoncontrollingInterestMember2023-04-012023-06-300001284812us-gaap:AccumulatedOtherComprehensiveIncomeMember2023-04-012023-06-300001284812us-gaap:CommonStockMember2023-06-300001284812us-gaap:AdditionalPaidInCapitalMember2023-06-300001284812us-gaap:RetainedEarningsMember2023-06-300001284812us-gaap:AccumulatedOtherComprehensiveIncomeMember2023-06-300001284812us-gaap:TreasuryStockCommonMember2023-06-300001284812cns:NonredeemableNoncontrollingInterestMember2023-06-300001284812cns:ParentIncludingNonredeemableNonControllingInterestMember2023-06-300001284812us-gaap:NoncontrollingInterestMember2023-06-300001284812us-gaap:CommonStockMember2022-03-310001284812us-gaap:AdditionalPaidInCapitalMember2022-03-310001284812us-gaap:RetainedEarningsMember2022-03-310001284812us-gaap:AccumulatedOtherComprehensiveIncomeMember2022-03-310001284812us-gaap:TreasuryStockCommonMember2022-03-310001284812cns:ParentIncludingNonredeemableNonControllingInterestMember2022-03-310001284812us-gaap:NoncontrollingInterestMember2022-03-310001284812us-gaap:RetainedEarningsMember2022-04-012022-06-300001284812cns:ParentIncludingNonredeemableNonControllingInterestMember2022-04-012022-06-300001284812us-gaap:CommonStockMember2022-04-012022-06-300001284812us-gaap:AdditionalPaidInCapitalMember2022-04-012022-06-300001284812us-gaap:TreasuryStockCommonMember2022-04-012022-06-300001284812us-gaap:NoncontrollingInterestMember2022-04-012022-06-300001284812us-gaap:AccumulatedOtherComprehensiveIncomeMember2022-04-012022-06-300001284812us-gaap:CommonStockMember2022-06-300001284812us-gaap:AdditionalPaidInCapitalMember2022-06-300001284812us-gaap:RetainedEarningsMember2022-06-300001284812us-gaap:AccumulatedOtherComprehensiveIncomeMember2022-06-300001284812us-gaap:TreasuryStockCommonMember2022-06-300001284812cns:ParentIncludingNonredeemableNonControllingInterestMember2022-06-300001284812us-gaap:NoncontrollingInterestMember2022-06-300001284812us-gaap:CommonStockMember2022-12-310001284812us-gaap:AdditionalPaidInCapitalMember2022-12-310001284812us-gaap:RetainedEarningsMember2022-12-310001284812us-gaap:AccumulatedOtherComprehensiveIncomeMember2022-12-310001284812us-gaap:TreasuryStockCommonMember2022-12-310001284812cns:NonredeemableNoncontrollingInterestMember2022-12-310001284812cns:ParentIncludingNonredeemableNonControllingInterestMember2022-12-310001284812us-gaap:NoncontrollingInterestMember2022-12-310001284812us-gaap:RetainedEarningsMember2023-01-012023-06-300001284812cns:ParentIncludingNonredeemableNonControllingInterestMember2023-01-012023-06-300001284812us-gaap:CommonStockMember2023-01-012023-06-300001284812us-gaap:AdditionalPaidInCapitalMember2023-01-012023-06-300001284812us-gaap:TreasuryStockCommonMember2023-01-012023-06-300001284812cns:NonredeemableNoncontrollingInterestMember2023-01-012023-06-300001284812us-gaap:NoncontrollingInterestMember2023-01-012023-06-300001284812us-gaap:AccumulatedOtherComprehensiveIncomeMember2023-01-012023-06-300001284812us-gaap:CommonStockMember2021-12-310001284812us-gaap:AdditionalPaidInCapitalMember2021-12-310001284812us-gaap:RetainedEarningsMember2021-12-310001284812us-gaap:AccumulatedOtherComprehensiveIncomeMember2021-12-310001284812us-gaap:TreasuryStockCommonMember2021-12-310001284812cns:ParentIncludingNonredeemableNonControllingInterestMember2021-12-310001284812us-gaap:NoncontrollingInterestMember2021-12-310001284812us-gaap:RetainedEarningsMember2022-01-012022-06-300001284812cns:ParentIncludingNonredeemableNonControllingInterestMember2022-01-012022-06-300001284812us-gaap:CommonStockMember2022-01-012022-06-300001284812us-gaap:AdditionalPaidInCapitalMember2022-01-012022-06-300001284812us-gaap:TreasuryStockCommonMember2022-01-012022-06-300001284812us-gaap:NoncontrollingInterestMember2022-01-012022-06-300001284812us-gaap:AccumulatedOtherComprehensiveIncomeMember2022-01-012022-06-3000012848122021-12-3100012848122022-06-300001284812us-gaap:AccumulatedTranslationAdjustmentMember2023-06-300001284812us-gaap:AccumulatedTranslationAdjustmentMember2022-12-310001284812srt:NorthAmericaMember2023-04-012023-06-300001284812srt:NorthAmericaMember2022-04-012022-06-300001284812srt:NorthAmericaMember2023-01-012023-06-300001284812srt:NorthAmericaMember2022-01-012022-06-300001284812country:JP2023-04-012023-06-300001284812country:JP2022-04-012022-06-300001284812country:JP2023-01-012023-06-300001284812country:JP2022-01-012022-06-300001284812srt:EuropeMember2023-04-012023-06-300001284812srt:EuropeMember2022-04-012022-06-300001284812srt:EuropeMember2023-01-012023-06-300001284812srt:EuropeMember2022-01-012022-06-300001284812cns:AsiaExcludingJapanMember2023-04-012023-06-300001284812cns:AsiaExcludingJapanMember2022-04-012022-06-300001284812cns:AsiaExcludingJapanMember2023-01-012023-06-300001284812cns:AsiaExcludingJapanMember2022-01-012022-06-300001284812cns:OpenEndInvestmentFundsMember2023-04-012023-06-300001284812cns:OpenEndInvestmentFundsMember2022-04-012022-06-300001284812cns:OpenEndInvestmentFundsMember2023-01-012023-06-300001284812cns:OpenEndInvestmentFundsMember2022-01-012022-06-300001284812cns:InstitutionalAccountsMember2023-04-012023-06-300001284812cns:InstitutionalAccountsMember2022-04-012022-06-300001284812cns:InstitutionalAccountsMember2023-01-012023-06-300001284812cns:InstitutionalAccountsMember2022-01-012022-06-300001284812cns:ClosedEndInvestmentFundsMember2023-04-012023-06-300001284812cns:ClosedEndInvestmentFundsMember2022-04-012022-06-300001284812cns:ClosedEndInvestmentFundsMember2023-01-012023-06-300001284812cns:ClosedEndInvestmentFundsMember2022-01-012022-06-300001284812cns:TheCohenSteersSICAVGlobalListedInfrastructureFundMember2023-06-300001284812cns:CohenSteersSICAVGlobalRealEstateFundMember2023-06-300001284812cns:CohenSteersCoInvestmentPartnershipMember2023-06-300001284812cns:CohenSteersRealEstateOpportunitiesFundLPMember2023-06-300001284812cns:TheCohenSteersSICAVGlobalListedInfrastructureFundMember2022-12-310001284812cns:CohenSteersSICAVGlobalRealEstateFundMember2022-12-310001284812cns:CohenSteersCoInvestmentPartnershipMember2022-12-310001284812cns:CohenSteersRealEstateOpportunitiesFundLPMember2022-12-310001284812us-gaap:FairValueMeasurementsRecurringMemberus-gaap:FairValueInputsLevel1Member2023-06-300001284812us-gaap:FairValueMeasurementsRecurringMember2023-06-300001284812us-gaap:FairValueMeasurementsRecurringMemberus-gaap:FairValueInputsLevel1Memberus-gaap:CommonStockMember2023-06-300001284812us-gaap:FairValueMeasurementsRecurringMemberus-gaap:FairValueInputsLevel2Memberus-gaap:CommonStockMember2023-06-300001284812us-gaap:FairValueMeasuredAtNetAssetValuePerShareMemberus-gaap:FairValueMeasurementsRecurringMemberus-gaap:CommonStockMember2023-06-300001284812us-gaap:FairValueMeasurementsRecurringMemberus-gaap:CommonStockMember2023-06-300001284812us-gaap:FairValueMeasurementsRecurringMembersrt:PartnershipInterestMemberus-gaap:FairValueInputsLevel1Member2023-06-300001284812us-gaap:FairValueMeasurementsRecurringMembersrt:PartnershipInterestMemberus-gaap:FairValueInputsLevel2Member2023-06-300001284812us-gaap:FairValueInputsLevel3Memberus-gaap:FairValueMeasurementsRecurringMembersrt:PartnershipInterestMember2023-06-300001284812us-gaap:FairValueMeasuredAtNetAssetValuePerShareMemberus-gaap:FairValueMeasurementsRecurringMembersrt:PartnershipInterestMember2023-06-300001284812us-gaap:FairValueMeasurementsRecurringMembersrt:PartnershipInterestMember2023-06-300001284812us-gaap:LimitedPartnerMemberus-gaap:FairValueMeasurementsRecurringMemberus-gaap:FairValueInputsLevel1Member2023-06-300001284812us-gaap:LimitedPartnerMemberus-gaap:FairValueMeasurementsRecurringMember2023-06-300001284812us-gaap:FairValueMeasurementsRecurringMemberus-gaap:FairValueInputsLevel1Memberus-gaap:PreferredStockMember2023-06-300001284812us-gaap:FairValueMeasurementsRecurringMemberus-gaap:FairValueInputsLevel2Memberus-gaap:PreferredStockMember2023-06-300001284812us-gaap:FairValueMeasuredAtNetAssetValuePerShareMemberus-gaap:FairValueMeasurementsRecurringMemberus-gaap:PreferredStockMember2023-06-300001284812us-gaap:FairValueMeasurementsRecurringMemberus-gaap:PreferredStockMember2023-06-300001284812us-gaap:OtherInvestmentsMemberus-gaap:FairValueMeasurementsRecurringMemberus-gaap:FairValueInputsLevel1Member2023-06-300001284812us-gaap:OtherInvestmentsMemberus-gaap:FairValueMeasurementsRecurringMemberus-gaap:FairValueInputsLevel2Member2023-06-300001284812us-gaap:FairValueMeasuredAtNetAssetValuePerShareMemberus-gaap:OtherInvestmentsMemberus-gaap:FairValueMeasurementsRecurringMember2023-06-300001284812us-gaap:OtherInvestmentsMemberus-gaap:FairValueMeasurementsRecurringMember2023-06-300001284812us-gaap:FairValueMeasurementsRecurringMemberus-gaap:FairValueInputsLevel2Member2023-06-300001284812us-gaap:FairValueInputsLevel3Memberus-gaap:FairValueMeasurementsRecurringMember2023-06-300001284812us-gaap:FairValueMeasuredAtNetAssetValuePerShareMemberus-gaap:FairValueMeasurementsRecurringMember2023-06-300001284812us-gaap:FairValueMeasurementsRecurringMemberus-gaap:FairValueInputsLevel1Memberus-gaap:FixedIncomeSecuritiesMember2023-06-300001284812us-gaap:FairValueMeasurementsRecurringMemberus-gaap:FairValueInputsLevel2Memberus-gaap:FixedIncomeSecuritiesMember2023-06-300001284812us-gaap:FairValueMeasuredAtNetAssetValuePerShareMemberus-gaap:FairValueMeasurementsRecurringMemberus-gaap:FixedIncomeSecuritiesMember2023-06-300001284812us-gaap:FairValueMeasurementsRecurringMemberus-gaap:EquityMethodInvestmentsMemberus-gaap:FairValueInputsLevel2Member2023-06-300001284812us-gaap:FairValueMeasuredAtNetAssetValuePerShareMemberus-gaap:FairValueMeasurementsRecurringMemberus-gaap:EquityMethodInvestmentsMember2023-06-300001284812us-gaap:TotalReturnSwapMemberus-gaap:FairValueMeasurementsRecurringMemberus-gaap:FairValueInputsLevel1Member2023-06-300001284812us-gaap:TotalReturnSwapMemberus-gaap:FairValueMeasurementsRecurringMemberus-gaap:FairValueInputsLevel2Member2023-06-300001284812us-gaap:TotalReturnSwapMemberus-gaap:FairValueMeasurementsRecurringMember2023-06-300001284812us-gaap:FairValueMeasurementsRecurringMemberus-gaap:FairValueInputsLevel2Memberus-gaap:ForeignExchangeContractMember2023-06-300001284812us-gaap:FairValueMeasurementsRecurringMemberus-gaap:ForeignExchangeContractMember2023-06-300001284812us-gaap:FairValueMeasurementsRecurringMemberus-gaap:FairValueInputsLevel1Memberus-gaap:ForeignExchangeContractMember2023-06-300001284812us-gaap:FairValueMeasurementsRecurringMemberus-gaap:FairValueInputsLevel1Member2022-12-310001284812us-gaap:FairValueMeasurementsRecurringMember2022-12-310001284812us-gaap:FairValueMeasurementsRecurringMemberus-gaap:FairValueInputsLevel1Memberus-gaap:CommonStockMember2022-12-310001284812us-gaap:FairValueMeasurementsRecurringMemberus-gaap:FairValueInputsLevel2Memberus-gaap:CommonStockMember2022-12-310001284812us-gaap:FairValueMeasurementsRecurringMemberus-gaap:CommonStockMember2022-12-310001284812us-gaap:FairValueMeasurementsRecurringMembersrt:PartnershipInterestMemberus-gaap:FairValueInputsLevel1Member2022-12-310001284812us-gaap:FairValueInputsLevel3Memberus-gaap:FairValueMeasurementsRecurringMembersrt:PartnershipInterestMember2022-12-310001284812us-gaap:FairValueMeasuredAtNetAssetValuePerShareMemberus-gaap:FairValueMeasurementsRecurringMembersrt:PartnershipInterestMember2022-12-310001284812us-gaap:FairValueMeasurementsRecurringMembersrt:PartnershipInterestMember2022-12-310001284812us-gaap:LimitedPartnerMemberus-gaap:FairValueMeasurementsRecurringMemberus-gaap:FairValueInputsLevel1Member2022-12-310001284812us-gaap:LimitedPartnerMemberus-gaap:FairValueMeasurementsRecurringMember2022-12-310001284812us-gaap:FairValueMeasurementsRecurringMemberus-gaap:FairValueInputsLevel1Memberus-gaap:PreferredStockMember2022-12-310001284812us-gaap:FairValueMeasurementsRecurringMemberus-gaap:FairValueInputsLevel2Memberus-gaap:PreferredStockMember2022-12-310001284812us-gaap:FairValueMeasurementsRecurringMemberus-gaap:PreferredStockMember2022-12-310001284812us-gaap:OtherInvestmentsMemberus-gaap:FairValueMeasurementsRecurringMemberus-gaap:FairValueInputsLevel1Member2022-12-310001284812us-gaap:FairValueMeasuredAtNetAssetValuePerShareMemberus-gaap:OtherInvestmentsMemberus-gaap:FairValueMeasurementsRecurringMember2022-12-310001284812us-gaap:OtherInvestmentsMemberus-gaap:FairValueMeasurementsRecurringMember2022-12-310001284812us-gaap:FairValueMeasurementsRecurringMemberus-gaap:FairValueInputsLevel2Member2022-12-310001284812us-gaap:FairValueInputsLevel3Memberus-gaap:FairValueMeasurementsRecurringMember2022-12-310001284812us-gaap:FairValueMeasuredAtNetAssetValuePerShareMemberus-gaap:FairValueMeasurementsRecurringMember2022-12-310001284812us-gaap:FairValueMeasurementsRecurringMemberus-gaap:FairValueInputsLevel2Memberus-gaap:FixedIncomeSecuritiesMember2022-12-310001284812us-gaap:FairValueMeasuredAtNetAssetValuePerShareMemberus-gaap:FairValueMeasurementsRecurringMemberus-gaap:FixedIncomeSecuritiesMember2022-12-310001284812us-gaap:FairValueMeasurementsRecurringMemberus-gaap:FixedIncomeSecuritiesMember2022-12-310001284812us-gaap:FairValueMeasurementsRecurringMemberus-gaap:EquityMethodInvestmentsMemberus-gaap:FairValueInputsLevel2Member2022-12-310001284812us-gaap:FairValueMeasuredAtNetAssetValuePerShareMemberus-gaap:FairValueMeasurementsRecurringMemberus-gaap:EquityMethodInvestmentsMember2022-12-310001284812us-gaap:FairValueMeasurementsRecurringMemberus-gaap:EquityMethodInvestmentsMember2022-12-310001284812us-gaap:TotalReturnSwapMemberus-gaap:FairValueMeasurementsRecurringMemberus-gaap:FairValueInputsLevel2Member2022-12-310001284812us-gaap:TotalReturnSwapMemberus-gaap:FairValueMeasurementsRecurringMember2022-12-310001284812us-gaap:FairValueMeasurementsRecurringMemberus-gaap:FairValueInputsLevel2Memberus-gaap:ForeignExchangeContractMember2022-12-310001284812us-gaap:FairValueMeasurementsRecurringMemberus-gaap:ForeignExchangeContractMember2022-12-310001284812us-gaap:EquityMethodInvestmentsMembercns:CohenSteersGlobalRealtyPartnersIIITELPMember2023-06-30xbrli:pure0001284812us-gaap:EquityMethodInvestmentsMembercns:CohenSteersGlobalRealtyPartnersIIITELPMember2022-12-310001284812cns:CohenSteersGlobalListedInfrastructureFundLPMemberus-gaap:EquityMethodInvestmentsMember2023-06-300001284812cns:CohenSteersGlobalListedInfrastructureFundLPMemberus-gaap:EquityMethodInvestmentsMember2022-12-3100012848122023-03-3100012848122022-03-310001284812us-gaap:FairValueInputsLevel3Memberus-gaap:MeasurementInputDiscountRateMember2023-06-300001284812us-gaap:FairValueInputsLevel3Membercns:MeasurementInputTerminalCapitalizationRateMember2023-06-300001284812us-gaap:FairValueInputsLevel3Memberus-gaap:MeasurementInputDiscountRateMember2022-12-310001284812us-gaap:FairValueInputsLevel3Membercns:MeasurementInputTerminalCapitalizationRateMember2022-12-310001284812us-gaap:TotalReturnSwapMember2023-06-300001284812us-gaap:ForeignExchangeContractMember2023-06-300001284812us-gaap:CorporateNonSegmentMember2023-06-300001284812us-gaap:TotalReturnSwapMember2022-12-310001284812us-gaap:ForeignExchangeContractMember2022-12-310001284812us-gaap:CorporateNonSegmentMember2022-12-310001284812us-gaap:CashMemberus-gaap:AssetPledgedAsCollateralMember2023-06-300001284812us-gaap:CashMemberus-gaap:AssetPledgedAsCollateralMember2022-12-310001284812us-gaap:CashMember2023-06-300001284812us-gaap:TotalReturnSwapMember2023-04-012023-06-300001284812us-gaap:TotalReturnSwapMember2022-04-012022-06-300001284812us-gaap:TotalReturnSwapMember2023-01-012023-06-300001284812us-gaap:TotalReturnSwapMember2022-01-012022-06-300001284812us-gaap:ForeignExchangeContractMember2023-04-012023-06-300001284812us-gaap:ForeignExchangeContractMember2022-04-012022-06-300001284812us-gaap:ForeignExchangeContractMember2023-01-012023-06-300001284812us-gaap:ForeignExchangeContractMember2022-01-012022-06-300001284812us-gaap:CorporateNonSegmentMember2023-04-012023-06-300001284812us-gaap:CorporateNonSegmentMember2022-04-012022-06-300001284812us-gaap:CorporateNonSegmentMember2023-01-012023-06-300001284812us-gaap:CorporateNonSegmentMember2022-01-012022-06-300001284812us-gaap:TotalReturnSwapMembersrt:ConsolidationEliminationsMember2023-04-012023-06-300001284812us-gaap:TotalReturnSwapMembersrt:ConsolidationEliminationsMember2022-04-012022-06-300001284812us-gaap:TotalReturnSwapMembersrt:ConsolidationEliminationsMember2023-01-012023-06-300001284812us-gaap:TotalReturnSwapMembersrt:ConsolidationEliminationsMember2022-01-012022-06-300001284812srt:AffiliatedEntityMember2023-04-012023-06-300001284812srt:AffiliatedEntityMember2022-04-012022-06-300001284812srt:AffiliatedEntityMember2023-01-012023-06-300001284812srt:AffiliatedEntityMember2022-01-012022-06-300001284812srt:AffiliatedEntityMember2023-06-300001284812srt:AffiliatedEntityMember2022-12-310001284812cns:CohenSteersIncomeOpportunitiesREITMember2023-06-300001284812cns:CohenSteersIncomeOpportunitiesREITMember2022-12-310001284812cns:CohenSteersIncomeOpportunitiesREITMember2023-01-012023-06-300001284812us-gaap:RevolvingCreditFacilityMember2023-01-200001284812cns:CommitmenttoinvestMember2023-06-300001284812cns:CohenSteersIncomeOpportunitiesREITMembercns:CommitmenttoinvestMember2023-06-300001284812cns:CohenSteersRealEstateOpportunitiesFundLPMember2023-06-300001284812us-gaap:SubsequentEventMemberus-gaap:DividendDeclaredMember2023-08-032023-08-03
________________________________________________________
UNITED STATES
SECURITIES AND EXCHANGE COMMISSION
WASHINGTON, D.C. 20549
FORM 10-Q
(Mark One) | | | | | |
| ☒ | QUARTERLY REPORT PURSUANT TO SECTION 13 OR 15(d) OF THE SECURITIES EXCHANGE ACT OF 1934 |
For the quarterly period ended June 30, 2023
OR | | | | | |
| ☐ | TRANSITION REPORT PURSUANT TO SECTION 13 OR 15(d) OF THE SECURITIES EXCHANGE ACT OF 1934 FOR THE TRANSITION PERIOD FROM TO |
Commission File Number: 001-32236
________________
COHEN & STEERS, INC.
(Exact Name of Registrant as Specified in its Charter)
________________ | | | | | |
| Delaware | 14-1904657 |
(State or Other Jurisdiction of
Incorporation or Organization) | (I.R.S. Employer
Identification No.) |
280 Park Avenue, New York, NY 10017
(Address of Principal Executive Offices and Zip Code)
(212) 832-3232
(Registrant's Telephone Number, Including Area Code)
________________
Securities registered pursuant to Section 12(b) of the Act: | | | | | | | | | | | | | | | | | |
| Title of each class | | Trading Symbol(s) | | Name of each exchange on which registered |
| Common Stock, $0.01 par value | | CNS | | New York Stock Exchange |
Indicate by check mark whether the registrant: (1) has filed all reports required to be filed by Section 13 or 15(d) of the Securities Exchange Act of 1934 during the preceding 12 months (or for such shorter period that the registrant was required to file such reports), and (2) has been subject to such filing requirements for the past 90 days. Yes ☒ No o
Indicate by check mark whether the registrant has submitted electronically every Interactive Data File required to be submitted pursuant to Rule 405 of Regulation S-T (§ 232.405 of this chapter) during the preceding 12 months (or for such shorter period that the registrant was required to submit such files). Yes ☒ No o
Indicate by check mark whether the registrant is a large accelerated filer, an accelerated filer, a non-accelerated filer, a smaller reporting company, or an emerging growth company. See the definitions of "large accelerated filer," "accelerated filer," "smaller reporting company," and "emerging growth company" in Rule 12b-2 of the Exchange Act. | | | | | | | | | | | | | | | | | | | | |
| Large accelerated filer | | ☒ | | Accelerated filer | | ☐ |
| | | |
| Non-accelerated filer | | ☐ | | Smaller reporting company | | ☐ |
| | | | | | |
| Emerging growth company | | ☐ | | | | |
If an emerging growth company, indicate by check mark if the registrant has elected not to use the extended transition period for complying with any new or revised financial accounting standards provided pursuant to Section 13(a) of the Exchange Act. ☐
Indicate by check mark whether the registrant is a shell company (as defined in Rule 12b-2 of the Exchange Act). Yes ☐ No ☒
The number of shares of the registrant's common stock, par value $0.01 per share, outstanding as of July 31, 2023 was 49,129,843.
COHEN & STEERS, INC. AND SUBSIDIARIES
Form 10-Q
Index
| | | | | | | | |
| | | Page |
| Part I. | Financial Information | |
| | |
| Item 1. | | |
| | |
| | |
| | |
| | |
| | |
| | |
| | |
| | |
| | |
| | |
| | |
| | |
| | |
| Item 2. | | |
| | |
| Item 3. | | |
| | |
| Item 4. | | |
| | |
| Part II. | Other Information * | |
| | |
| Item 1. | | |
| | |
| Item 1A. | | |
| | |
| Item 2. | | |
| | |
| Item 5. | | |
| | |
| Item 6. | | |
| |
| |
* Items other than those listed above have been omitted because they are not applicable.
Forward-Looking Statements
This report and other documents filed by us contain forward-looking statements within the meaning of Section 27A of the Securities Act of 1933, as amended, and Section 21E of the Securities Exchange Act of 1934, as amended, which reflect management's current views with respect to, among other things, our operations and financial performance. You can identify these forward-looking statements by the use of words such as "outlook," "believes," "expects," "potential," "continues," "may," "will," "should," "seeks," "approximately," "predicts," "intends," "plans," "estimates," "anticipates" or the negative versions of these words or other comparable words. Such forward-looking statements are subject to various risks and uncertainties. Accordingly, there are or will be important factors that could cause actual outcomes or results to differ materially from those indicated in these forward-looking statements. We believe that these factors include, but are not limited to, the risks described in the Risk Factors section of our Annual Report on Form 10-K for the year ended December 31, 2022 (the Form 10-K), which is accessible on the Securities and Exchange Commission's website at www.sec.gov and on our website at www.cohenandsteers.com. These factors are not exhaustive and should be read in conjunction with the other cautionary statements that are included in this report, the Form 10-K and our other filings with the Securities and Exchange Commission. We undertake no obligation to publicly update or review any forward-looking statement, whether as a result of new information, future developments or otherwise.
PART I—Financial Information
Item 1. Financial Statements
COHEN & STEERS, INC. AND SUBSIDIARIES
CONDENSED CONSOLIDATED STATEMENTS OF FINANCIAL CONDITION (Unaudited)
(in thousands, except share data)
| | | | | | | | | | | |
| June 30,
2023 | | December 31,
2022 |
| Assets: | | | |
| Cash and cash equivalents | $ | 178,471 | | | $ | 247,418 | |
Investments ($139,197 and $134,929) (1) | 188,227 | | | 172,955 | |
| Accounts receivable | 63,217 | | | 66,676 | |
Due from brokers ($867 and $38) (1) | 2,570 | | | 2,080 | |
| Property and equipment—net | 36,328 | | | 8,757 | |
| Operating lease right-of-use assets—net | 107,759 | | | 136,430 | |
| Goodwill and intangible assets—net | 19,269 | | | 19,049 | |
| | | |
Other assets ($548 and $576) (1) | 29,146 | | | 20,014 | |
| Total assets | $ | 624,987 | | | $ | 673,379 | |
| | | |
| | | |
| Liabilities: | | | |
| Accrued compensation and benefits | $ | 31,487 | | | $ | 77,764 | |
| Distribution and service fees payable | 8,560 | | | 8,421 | |
| Operating lease liabilities | 115,565 | | | 138,809 | |
| Income tax payable | 216 | | | 7,750 | |
Due to brokers ($630 and $11) (1) | 1,257 | | | 835 | |
Other liabilities and accrued expenses ($626 and $664) (1) | 23,995 | | | 12,857 | |
| Total liabilities | 181,080 | | | 246,436 | |
| Commitments and contingencies (See Note 11) | | | |
| Redeemable noncontrolling interests | 85,518 | | | 85,335 | |
| Stockholders' equity: | | | |
Common stock, $0.01 par value; 500,000,000 shares authorized; 55,744,666 and 55,051,975 shares issued at June 30, 2023 and December 31, 2022, respectively | 558 | | | 551 | |
| Additional paid-in capital | 794,159 | | | 769,373 | |
| Accumulated deficit | (162,231) | | | (171,417) | |
| Accumulated other comprehensive loss | (8,537) | | | (10,784) | |
Treasury stock, at cost, 6,617,428 and 6,329,178 shares at June 30, 2023 and December 31, 2022, respectively | (270,797) | | | (250,169) | |
| Total stockholders’ equity attributable to Cohen & Steers, Inc. | 353,152 | | | 337,554 | |
| Nonredeemable noncontrolling interests | 5,237 | | | 4,054 | |
| Total stockholders’ equity | 358,389 | | | 341,608 | |
| Total liabilities, redeemable noncontrolling interests and stockholders’ equity | $ | 624,987 | | | $ | 673,379 | |
_________________________
(1) Amounts in parentheses represent the aggregate balances at June 30, 2023 and December 31, 2022 attributable to variable interest entities consolidated by the Company. Refer to Note 4, Investments for further discussion.
See notes to condensed consolidated financial statements
COHEN & STEERS, INC. AND SUBSIDIARIES
CONDENSED CONSOLIDATED STATEMENTS OF OPERATIONS (Unaudited)
(in thousands, except per share data)
| | | | | | | | | | | | | | | | | | | | | | | |
| | Three Months Ended
June 30, | | Six Months Ended
June 30, |
| | 2023 | | 2022 | | 2023 | | 2022 |
| Revenue: | | | | | | | |
| Investment advisory and administration fees | $ | 113,118 | | | $ | 137,655 | | | $ | 231,152 | | | $ | 281,324 | |
| Distribution and service fees | 6,977 | | | 9,005 | | | 14,539 | | | 18,874 | |
| Other | 535 | | | 771 | | | 1,021 | | | 1,422 | |
| Total revenue | 120,630 | | | 147,431 | | | 246,712 | | | 301,620 | |
| Expenses: | | | | | | | |
| Employee compensation and benefits | 48,893 | | | 53,857 | | | 97,750 | | | 108,600 | |
| Distribution and service fees | 13,329 | | | 18,236 | | | 27,545 | | | 52,187 | |
| General and administrative | 16,728 | | | 13,238 | | | 33,850 | | | 26,748 | |
| Depreciation and amortization | 839 | | | 1,106 | | | 1,827 | | | 2,100 | |
| Total expenses | 79,789 | | | 86,437 | | | 160,972 | | | 189,635 | |
| Operating income | 40,841 | | | 60,994 | | | 85,740 | | | 111,985 | |
| Non-operating income (loss): | | | | | | | |
| Interest and dividend income—net | 3,428 | | | 1,888 | | | 6,644 | | | 2,785 | |
| Gain (loss) from investments—net | 356 | | | (28,573) | | | 48 | | | (25,006) | |
| Foreign currency gain (loss)—net | (1,134) | | | 1,683 | | | (2,410) | | | 2,329 | |
| Total non-operating income (loss) | 2,650 | | | (25,002) | | | 4,282 | | | (19,892) | |
| Income before provision for income taxes | 43,491 | | | 35,992 | | | 90,022 | | | 92,093 | |
| Provision for income taxes | 10,986 | | | 9,843 | | | 21,219 | | | 19,103 | |
| Net income | 32,505 | | | 26,149 | | | 68,803 | | | 72,990 | |
| Net (income) loss attributable to noncontrolling interests | (727) | | | 25,807 | | | (1,711) | | | 20,984 | |
| Net income attributable to common stockholders | $ | 31,778 | | | $ | 51,956 | | | $ | 67,092 | | | $ | 93,974 | |
| | | | | | | |
| Earnings per share attributable to common stockholders: | | | | | | | |
| Basic | $ | 0.64 | | | $ | 1.06 | | | $ | 1.36 | | | $ | 1.93 | |
| Diluted | $ | 0.64 | | | $ | 1.06 | | | $ | 1.36 | | | $ | 1.91 | |
| | | | | | | |
| Weighted average shares outstanding: | | | | | | | |
| Basic | 49,315 | | | 48,805 | | | 49,257 | | | 48,739 | |
| Diluted | 49,463 | | | 49,208 | | | 49,433 | | | 49,272 | |
See notes to condensed consolidated financial statements
COHEN & STEERS, INC. AND SUBSIDIARIES
CONDENSED CONSOLIDATED STATEMENTS OF COMPREHENSIVE INCOME (Unaudited)
(in thousands)
| | | | | | | | | | | | | | | | | | | | | | | |
| Three Months Ended
June 30, | | Six Months Ended
June 30, |
| 2023 | | 2022 | | 2023 | | 2022 |
| Net income | $ | 32,505 | | | $ | 26,149 | | | $ | 68,803 | | | $ | 72,990 | |
| Net (income) loss attributable to noncontrolling interests | (727) | | | 25,807 | | | (1,711) | | | 20,984 | |
| Net income attributable to common stockholders | 31,778 | | | 51,956 | | | 67,092 | | | 93,974 | |
| Other comprehensive income (loss): | | | | | | | |
| Foreign currency translation gain (loss) | 676 | | | (3,614) | | | 2,247 | | | (5,165) | |
| Total comprehensive income attributable to common stockholders | $ | 32,454 | | | $ | 48,342 | | | $ | 69,339 | | | $ | 88,809 | |
See notes to condensed consolidated financial statements
COHEN & STEERS, INC. AND SUBSIDIARIES
CONDENSED CONSOLIDATED STATEMENTS OF CHANGES IN STOCKHOLDERS' EQUITY (Unaudited)
(in thousands, except per share data)
| | | | | | | | | | | | | | | | | | | | | | | | | | | | |
| Three Months Ended June 30, 2023 | | |
| Common
Stock | Additional
Paid-In
Capital | Accumulated Deficit | Accumulated Other
Comprehensive
Income (Loss) | Treasury
Stock | Nonredeemable
Noncontrolling
Interests | Total
Stockholders'
Equity | Redeemable
Noncontrolling
Interests | | |
| April 1, 2023 | $ | 558 | | $ | 781,300 | | $ | (165,053) | | $ | (9,213) | | $ | (270,610) | | $ | 5,363 | | $ | 342,345 | | $ | 87,249 | | | |
Dividends ($0.57 per share) | — | | — | | (28,956) | | — | | — | | — | | (28,956) | | — | | | |
| Issuance of common stock | — | | 342 | | — | | — | | — | | — | | 342 | | — | | | |
| Repurchase of common stock | — | | — | | — | | — | | (187) | | — | | (187) | | — | | | |
| Issuance of restricted stock units—net | — | | 1,308 | | — | | — | | — | | — | | 1,308 | | — | | | |
| Amortization of restricted stock units—net | — | | 11,209 | | — | | — | | — | | — | | 11,209 | | — | | | |
| Net income (loss) | — | | — | | 31,778 | | — | | — | | (193) | | 31,585 | | 920 | | | |
| Other comprehensive income (loss) | — | | — | | — | | 676 | | — | | — | | 676 | | — | | | |
| Net contributions (distributions) attributable to noncontrolling interests | — | | — | | — | | — | | — | | 67 | | 67 | | (2,651) | | | |
| | | | | | | | | | |
June 30, 2023 | $ | 558 | | $ | 794,159 | | $ | (162,231) | | $ | (8,537) | | $ | (270,797) | | $ | 5,237 | | $ | 358,389 | | $ | 85,518 | | | |
| | | | | | | | | | |
| Three Months Ended June 30, 2022 | | |
| Common
Stock | Additional
Paid-In
Capital | Accumulated Deficit | Accumulated Other
Comprehensive
Income (Loss) | Treasury
Stock | Nonredeemable
Noncontrolling
Interests | Total
Stockholders'
Equity | Redeemable
Noncontrolling
Interests | | |
| April 1, 2022 | $ | 550 | | $ | 728,644 | | $ | (217,453) | | $ | (7,437) | | $ | (248,939) | | $ | — | | $ | 255,365 | | $ | 184,656 | | | |
Dividends ($0.55 per share) | — | | — | | (27,649) | | — | | — | | — | | (27,649) | | — | | | |
| Issuance of common stock | — | | 358 | | — | | — | | — | | — | | 358 | | — | | | |
| Repurchase of common stock | — | | — | | — | | — | | (173) | | — | | (173) | | — | | | |
| Issuance of restricted stock units—net | — | | 1,391 | | — | | — | | — | | — | | 1,391 | | — | | | |
| Amortization of restricted stock units—net | — | | 11,751 | | — | | — | | — | | — | | 11,751 | | — | | | |
| Net income (loss) | — | | — | | 51,956 | | | — | | — | | 51,956 | | (25,807) | | | |
| Other comprehensive income (loss) | — | | — | | — | | (3,614) | | — | | — | | (3,614) | | — | | | |
| Net contributions (distributions) attributable to noncontrolling interests | — | | — | | — | | — | | — | | — | | — | | 27,149 | | | |
| | | | | | | | | | |
June 30, 2022 | $ | 550 | | $ | 742,144 | | $ | (193,146) | | $ | (11,051) | | $ | (249,112) | | $ | — | | $ | 289,385 | | $ | 185,998 | | | |
See notes to condensed consolidated financial statements
COHEN & STEERS, INC. AND SUBSIDIARIES
CONDENSED CONSOLIDATED STATEMENTS OF CHANGES IN STOCKHOLDERS' EQUITY (Unaudited)—(Continued)
(in thousands, except per share data)
| | | | | | | | | | | | | | | | | | | | | | | | | | | | |
| Six Months Ended June 30, 2023 | | |
| Common
Stock | Additional
Paid-In
Capital | Accumulated Deficit | Accumulated Other
Comprehensive
Income (Loss) | Treasury
Stock | Nonredeemable
Noncontrolling
Interests | Total
Stockholders'
Equity | Redeemable
Noncontrolling
Interests | | |
| January 1, 2023 | $ | 551 | | $ | 769,373 | | $ | (171,417) | | $ | (10,784) | | $ | (250,169) | | $ | 4,054 | | $ | 341,608 | | $ | 85,335 | | | |
Dividends ($1.14 per share) | — | | — | | (57,906) | | — | | — | | — | | (57,906) | | — | | | |
| Issuance of common stock | 7 | | 791 | | — | | — | | — | | — | | 798 | | — | | | |
| Repurchase of common stock | — | | — | | — | | — | | (20,628) | | — | | (20,628) | | — | | | |
| Issuance of restricted stock units—net | — | | 2,486 | | — | | — | | — | | — | | 2,486 | | — | | | |
| Amortization of restricted stock units—net | — | | 21,509 | | — | | — | | — | | — | | 21,509 | | — | | | |
| | | | | | | | | | |
| Net income (loss) | — | | — | | 67,092 | | — | | — | | (440) | | 66,652 | | 2,151 | | | |
| Other comprehensive income (loss) | — | | — | | — | | 2,247 | | — | | — | | 2,247 | | — | | | |
| Net contributions (distributions) attributable to noncontrolling interests | — | | — | | — | | — | | — | | 1,623 | | 1,623 | | (1,968) | | | |
| | | | | | | | | | |
June 30, 2023 | $ | 558 | | $ | 794,159 | | $ | (162,231) | | $ | (8,537) | | $ | (270,797) | | $ | 5,237 | | $ | 358,389 | | $ | 85,518 | | | |
| | | | | | | | | | |
| Six Months Ended June 30, 2022 | | |
| Common
Stock | Additional
Paid-In
Capital | Accumulated Deficit | Accumulated Other
Comprehensive
Income (Loss) | Treasury
Stock | Nonredeemable
Noncontrolling
Interests | Total
Stockholders'
Equity | Redeemable
Noncontrolling
Interests | | |
| January 1, 2022 | $ | 543 | | $ | 715,847 | | $ | (231,967) | | $ | (5,886) | | $ | (223,354) | | $ | — | | $ | 255,183 | | $ | 89,143 | | | |
Dividends ($1.10 per share) | — | | — | | (55,153) | | — | | — | | — | | (55,153) | | — | | | |
| Issuance of common stock | 7 | | 793 | | — | | — | | — | | — | | 800 | | — | | | |
| Repurchase of common stock | — | | — | | — | | — | | (25,758) | | — | | (25,758) | | — | | | |
| Issuance of restricted stock units—net | — | | 2,641 | | — | | — | | — | | — | | 2,641 | | — | | | |
| Amortization of restricted stock units—net | — | | 22,863 | | — | | — | | — | | — | | 22,863 | | — | | | |
| | | | | | | | | | |
| Net income (loss) | — | | — | | 93,974 | | — | | — | | — | | 93,974 | | (20,984) | | | |
| Other comprehensive income (loss) | — | | — | | — | | (5,165) | | — | | — | | (5,165) | | — | | | |
| Net contributions (distributions) attributable to noncontrolling interests | — | | — | | — | | — | | — | | — | | — | | 117,839 | | | |
| | | | | | | | | | |
June 30, 2022 | $ | 550 | | $ | 742,144 | | $ | (193,146) | | $ | (11,051) | | $ | (249,112) | | $ | — | | $ | 289,385 | | $ | 185,998 | | | |
| | | | | | | | | | |
See notes to condensed consolidated financial statements
COHEN & STEERS, INC. AND SUBSIDIARIES
CONDENSED CONSOLIDATED STATEMENTS OF CASH FLOWS (Unaudited)
(in thousands)
| | | | | | | | | | | |
| | Six Months Ended
June 30, |
| | 2023 | | 2022 |
| Cash flows from operating activities: | | | |
| Net income | $ | 68,803 | | | $ | 72,990 | |
| Adjustments to reconcile net income to net cash provided by (used in) operating activities: | | | |
| Stock-based compensation expense—net | 22,410 | | | 24,139 | |
| | | |
| Depreciation and amortization | 2,349 | | | 2,713 | |
| Amortization of right-of-use assets | 7,973 | | | 5,426 | |
| | | |
| (Gain) loss from investments—net | (48) | | | 25,006 | |
| Deferred income taxes | 480 | | | 1,834 | |
| Foreign currency (gain) loss | 573 | | | 2,462 | |
| Changes in operating assets and liabilities: | | | |
| Accounts receivable | 2,886 | | | 5,914 | |
| Due from brokers | (474) | | | (2,977) | |
| | | |
| Investments within consolidated investment vehicles | (2,882) | | | (142,774) | |
| Other assets | (7,082) | | | 6,799 | |
| Accrued compensation and benefits | (46,277) | | | (34,499) | |
| Distribution and service fees payable | 139 | | | 1,773 | |
| Operating lease liabilities | (2,546) | | | (6,033) | |
| Due to brokers | 1,210 | | | 4,754 | |
| Income tax payable | (9,896) | | | (17,068) | |
| Other liabilities and accrued expenses | 1,097 | | | 771 | |
| Net cash provided by (used in) operating activities | 38,715 | | | (48,770) | |
| Cash flows from investing activities: | | | |
| | | |
| Purchases of investments | (45,216) | | | (73,866) | |
| Proceeds from sales and maturities of investments | 34,125 | | | 31,827 | |
| Purchases of property and equipment | (20,131) | | | (1,562) | |
| | | |
| Net cash provided by (used in) investing activities | (31,222) | | | (43,601) | |
| Cash flows from financing activities: | | | |
| Issuance of common stock—net | 678 | | | 680 | |
| Repurchase of common stock | (20,628) | | | (25,758) | |
| Dividends to stockholders | (56,202) | | | (53,668) | |
| Debt issuance costs | (603) | | | — | |
| Net contributions (distributions) from noncontrolling interests | (345) | | | 117,839 | |
| Net cash provided by (used in) financing activities | (77,100) | | | 39,093 | |
| Net increase (decrease) in cash and cash equivalents | (69,607) | | | (53,278) | |
| Effect of foreign exchange rate changes on cash and cash equivalents | 2,044 | | | (4,526) | |
| Cash and cash equivalents, beginning of the period | 248,714 | | | 184,373 | |
| Cash and cash equivalents, end of the period | $ | 181,151 | | | $ | 126,569 | |
See notes to condensed consolidated financial statements
COHEN & STEERS, INC. AND SUBSIDIARIES
CONDENSED CONSOLIDATED STATEMENTS OF CASH FLOWS—(Continued)
(UNAUDITED)
Supplemental disclosures of cash flow information:
The following table provides a reconciliation of cash and cash equivalents reported within the condensed consolidated statements of financial condition to the cash and cash equivalents reported within the condensed consolidated statements of cash flows above:
| | | | | | | | | | | |
| Six Months Ended
June 30, |
| (in thousands) | 2023 | | 2022 |
Cash and cash equivalents | $ | 178,471 | | | $ | 126,569 | |
Cash included in investments (1) | 2,680 | | | — | |
Total cash and cash equivalents within condensed consolidated statements of cash flows | $ | 181,151 | | | $ | 126,569 | |
________________________
(1) Cash included in investments represents operating cash held in consolidated investment vehicles.
During the six months ended June 30, 2023 and 2022, the Company paid taxes, net of tax refunds, of $30.6 million and $34.3 million, respectively.
Supplemental disclosures of non-cash investing and financing activities:
In connection with its stock incentive plan, the Company issued dividend equivalents in the form of restricted stock units, net of forfeitures, in the amount of $1.7 million and $1.5 million for the six months ended June 30, 2023 and 2022, respectively. These amounts are included in the issuance of restricted stock units—net and in dividends in the condensed consolidated statements of changes in stockholders' equity.
Non-cash investing activities included $9.3 million related to purchases of property and equipment in connection with the Company's future headquarters that remain unpaid at June 30, 2023.
COHEN & STEERS, INC. AND SUBSIDIARIES
NOTES TO CONDENSED CONSOLIDATED FINANCIAL STATEMENTS
(UNAUDITED)
1. Organization and Description of Business
Cohen & Steers, Inc. (CNS) was organized as a Delaware corporation on March 17, 2004. CNS is the holding company for its direct and indirect subsidiaries, including Cohen & Steers Capital Management, Inc. (CSCM), Cohen & Steers Securities, LLC (CSS), Cohen & Steers UK Limited (CSUK), Cohen & Steers Ireland Limited (CSIL), Cohen & Steers Asia Limited (CSAL), Cohen & Steers Japan Limited (CSJL) and Cohen & Steers Singapore Private Limited (CSSG) (collectively, the Company).
The Company is a global investment manager specializing in real assets and alternative income, including real estate, preferred securities, infrastructure, resource equities, commodities, as well as multi-strategy solutions. Founded in 1986, the Company is headquartered in New York City, with offices in London, Dublin, Hong Kong, Tokyo and Singapore.
2. Basis of Presentation and Significant Accounting Policies
The condensed consolidated financial statements have been prepared in accordance with accounting principles generally accepted in the United States of America (GAAP). The condensed consolidated financial statements set forth herein include the accounts of CNS and its direct and indirect subsidiaries. Intercompany balances and transactions have been eliminated in consolidation.
The condensed consolidated financial statements of the Company included herein are unaudited and have been prepared in accordance with the instructions to Form 10-Q pursuant to the rules and regulations of the Securities and Exchange Commission (SEC). In the opinion of management, all adjustments, consisting of normal recurring adjustments, necessary for a fair presentation of the interim results have been made. The Company's condensed consolidated financial statements and the related notes should be read together with the consolidated financial statements and the related notes included in the Company's Annual Report on Form 10-K for the year ended December 31, 2022.
Accounting Estimates—The preparation of the condensed consolidated financial statements in conformity with GAAP requires management to make certain estimates and assumptions that affect the reported amounts of assets and liabilities and the disclosures of contingent assets and liabilities at the dates of the condensed consolidated financial statements and the reported amounts of revenue and expenses during the reporting periods. Management believes the estimates used in preparing the condensed consolidated financial statements are reasonable and prudent. Actual results could differ from those estimates.
Consolidation of Investment Vehicles—The Company's financial interests in investment vehicles, including the management fees that are received, are evaluated at inception and thereafter, if there is a reconsideration event, in order to determine whether to apply the Variable Interest Entity (VIE) model or the Voting Interest Entity (VOE) model.
A VIE is an entity in which either the equity investment at risk is not sufficient to permit the entity to finance its own activities without additional financial support or the group of holders of the equity investment at risk lack certain characteristics of a controlling financial interest. The primary beneficiary is the entity that has the power to direct the activities of the VIE that most significantly affect its performance, and the obligation to absorb losses of the entity or the right to receive benefits from the entity that could potentially be significant to the VIE. Subscriptions and redemptions or amendments to the governing documents of the respective entities could affect an entity's status as a VIE or the determination of the primary beneficiary. Limited partnerships and similar entities are determined to be a VIE when the Company is the general partner and the limited partners do not hold substantive kick-out or participation rights. The Company assesses whether it is the primary beneficiary of any VIEs identified by evaluating its economic interests in the entity held either directly by the Company and its affiliates or indirectly through employees. VIEs for which the Company is deemed to be the primary beneficiary are consolidated.
Investments that are determined to be VOEs are consolidated when the Company’s ownership interest is greater than 50% of the outstanding voting interests of the vehicle.
The Company records noncontrolling interests in consolidated investment vehicles for which the Company’s ownership is less than 100%.
COHEN & STEERS, INC. AND SUBSIDIARIES
NOTES TO CONDENSED CONSOLIDATED FINANCIAL STATEMENTS—(Continued)
(UNAUDITED)
Cash and Cash Equivalents—Cash and cash equivalents include short-term, highly liquid investments, which are readily convertible into cash and have original maturities of three months or less.
Due from/to Brokers—The Company, including the consolidated investment vehicles, may transact with brokers for certain investment activities. The clearing and custody operations for these investment activities are performed pursuant to contractual agreements. The due from/to brokers balances represent cash and/or cash collateral balances at brokers/custodians and/or receivables and payables for unsettled securities transactions with brokers/custodians.
Investments—Management of the Company determines the appropriate classification of its investments at the time of purchase and re-evaluates such determination no less than on a quarterly basis. The Company's investments are categorized as follows:
•Equity investments at fair value generally represent common stocks, limited partnership interests, master limited partnership interests, preferred securities and other seed investments in Company-sponsored vehicles.
•Trading investments generally represent U.S. Treasury securities and investment-grade corporate debt securities.
Realized and unrealized gains and losses on our investments are recorded in gain (loss) from investments—net in the Company's condensed consolidated statements of operations.
From time to time, the Company, including the consolidated investment vehicles, may enter into derivative contracts, including options, futures and swaps contracts, to gain exposure to the underlying commodities markets or to economically hedge market risk of the underlying portfolios. Gains and losses on derivative contracts are recorded in gain (loss) from investments—net in the Company's condensed consolidated statements of operations. The fair values of these instruments are recorded in other assets or other liabilities and accrued expenses on the Company's condensed consolidated statements of financial condition.
Additionally, from time to time, the Company, including the consolidated investment vehicles, may enter into forward foreign exchange contracts to economically hedge currency exposure. These instruments are measured at fair value based on the prevailing forward exchange rate with gains and losses recorded in foreign currency gain (loss)—net in the Company’s condensed consolidated statements of operations. The fair values of these contracts are recorded in other assets or other liabilities and accrued expenses on the Company’s condensed consolidated statements of financial condition.
Leases—The Company determines if an arrangement is a lease at inception. The Company has operating leases for corporate offices and certain information technology equipment which are included in operating lease right-of-use (ROU) assets and operating lease liabilities on the Company’s condensed consolidated statements of financial condition.
ROU assets represent the right to use an underlying asset for the lease term and lease liabilities represent obligations to make lease payments arising from the lease. Operating lease ROU assets and lease liabilities are recognized at commencement date based on the net present value of lease payments over the life of the lease and thereafter, are remeasured if there is a change in lease terms. The majority of the Company’s lease agreements do not provide an implicit rate. As a result, the Company used its estimated incremental borrowing rate based on the information available as of lease commencement dates in determining the present value of lease payments. The operating lease ROU assets reflect any upfront lease payments made as well as lease incentives received. During the second quarter of 2023, the Company incurred costs related to the build-out of its future headquarters which qualified for reimbursement from the landlord. As a result, the Company remeasured its ROU asset and lease liability resulting in a $22.2 million reduction.
The lease terms may include options to extend or terminate the lease and these are factored into the determination of the ROU asset and lease liability at lease inception when and if it is reasonably certain that the Company will exercise that option. Lease expense for fixed lease payments is recognized on a straight-line basis over the lease term.
The Company has certain lease agreements with non-lease components such as maintenance and executory costs, which are accounted for separately and not included in ROU assets.
ROU assets are tested for impairment whenever changes in facts or circumstances indicate that the carrying amount of an asset may not be recoverable. Modification of a lease term would result in remeasurement of the lease liability and a corresponding adjustment to the ROU asset.
COHEN & STEERS, INC. AND SUBSIDIARIES
NOTES TO CONDENSED CONSOLIDATED FINANCIAL STATEMENTS—(Continued)
(UNAUDITED)
Noncontrolling Interests—Noncontrolling interests consist of nonredeemable and redeemable third-party interests in the Company's consolidated investment vehicles. Noncontrolling interests that are not redeemable at the option of the investors are classified as nonredeemable noncontrolling interests and are included in stockholders’ equity. Noncontrolling interests that are redeemable at the option of the investors are classified as redeemable noncontrolling interests and are not treated as permanent equity. Noncontrolling interests are recorded at fair value which approximates the net asset value at each reporting period.
Investment Advisory and Administration Fees—The Company earns revenue by providing asset management services to institutional accounts, open-end and closed-end funds as well as model-based portfolios. Investment advisory fees are earned pursuant to the terms of investment management agreements and are generally based on a contractual fee rate applied to the average assets under management. The Company also earns administration fees from certain open-end and closed-end funds pursuant to the terms of underlying administration contracts. Administration fees are based on the average daily assets under management of such funds. Investment advisory and administration fee revenue is recognized when earned and is recorded net of any fund reimbursements. The investment advisory and administration contracts each include a single performance obligation as the services provided are not separately identifiable and are accounted for as a series satisfied over time using a time-based method (days elapsed). Additionally, investment advisory and administration fees represent variable consideration, as fees are based on average assets under management which fluctuate daily.
In certain instances, the Company may earn performance fees when specified performance hurdles are met during the performance period. Performance fees are forms of variable consideration and are not recognized until it becomes probable that there will not be a significant reversal of the cumulative revenue recognized.
Distribution and Service Fee Revenue—Distribution and service fee revenue is based on the average daily net assets of certain share classes of open-end funds distributed by CSS. Distribution and service fee revenue is earned daily and is recorded gross of any third-party distribution and service fee expense for applicable share classes.
Distribution fee agreements include a single performance obligation that is satisfied at a point in time when an investor purchases shares in an open-end fund. For all periods presented, a portion of the distribution fee revenue recognized in the period may relate to performance obligations satisfied (or partially satisfied) in prior periods. Service fee agreements include a single performance obligation as the services provided are not separately identifiable and are accounted for as a series satisfied over time using a time-based method (days elapsed). Additionally, distribution and service fees represent variable consideration, as fees are based on average assets under management which fluctuate daily.
Distribution and Service Fee Expense—Distribution and service fee expense includes distribution fees, shareholder servicing fees and intermediary assistance payments.
Distribution fees represent payments made to qualified intermediaries for assistance in connection with the distribution of certain open-end funds' shares and for other expenses such as advertising, printing and distribution of prospectuses to investors. Such amounts may also be used to pay financial intermediaries for services as specified in the terms of written agreements complying with Rule 12b-1 of the Investment Company Act of 1940. Distribution fees are based on average daily net assets under management of certain share classes of certain of the funds.
Shareholder servicing fees represent payments made to qualified intermediaries for shareholder account service and maintenance. These services are provided pursuant to written agreements with such qualified institutions. Shareholder servicing fees are generally based on average daily net assets under management.
Intermediary assistance payments represent payments to qualified intermediaries for activities related to distribution, shareholder servicing as well as marketing and support of certain open-end funds and are incremental to those described above. Intermediary assistance payments are generally based on average daily net assets under management.
Stock-based Compensation—The Company recognizes compensation expense for the grant-date fair value of restricted stock unit awards to certain employees. This expense is recognized over the period during which employees are required to provide service. Forfeitures are recorded as incurred. Any change to the key terms of an employee’s award subsequent to the grant date is evaluated and, if necessary, accounted for as a modification. If the modification results in the remeasurement of the fair value of the award, the remeasured compensation cost is recognized over the remaining service period.
COHEN & STEERS, INC. AND SUBSIDIARIES
NOTES TO CONDENSED CONSOLIDATED FINANCIAL STATEMENTS—(Continued)
(UNAUDITED)
Income Taxes—The Company records the current and deferred tax consequences of all transactions that have been recognized in the condensed consolidated financial statements in accordance with the provisions of the enacted tax laws. Deferred tax assets are recognized for temporary differences that will result in deductible amounts in future years at tax rates that are expected to apply in those years. Deferred tax liabilities are recognized for temporary differences that will result in taxable income in future years at tax rates that are expected to apply in those years. The Company records a valuation allowance, when necessary, to reduce deferred tax assets to an amount that more likely than not will be realized. The effective tax rate for interim periods is based on the Company's best estimate of the effective tax rate expected to be applied to the full fiscal year adjusted for discrete tax items during the period.
The calculation of tax liabilities involves uncertainties in the application of complex tax laws and regulations across the Company's global operations. A tax benefit from an uncertain tax position is recognized when it is more likely than not that the position will be sustained upon examination, including resolution of any related appeals or litigation processes, on the basis of the technical merits. The Company records potential interest and penalties related to uncertain tax positions in the provision for income taxes in the condensed consolidated statements of operations.
Comprehensive Income—The Company reports all changes in comprehensive income in the condensed consolidated statements of comprehensive income. Comprehensive income generally includes net income or loss attributable to common stockholders and amounts attributable to foreign currency translation gain (loss).
Currency Translation and Transactions—Assets and liabilities of subsidiaries having non-U.S. dollar functional currencies are translated at exchange rates at the applicable condensed consolidated statement of financial condition date. Revenue and expenses of such subsidiaries are translated at average exchange rates during the period. The gains or losses resulting from translating non-U.S. dollar functional currency into U.S. dollars are included in the Company's condensed consolidated statements of comprehensive income. The cumulative translation adjustment was $(8.5) million and $(10.8) million at June 30, 2023 and December 31, 2022, respectively, and was reported within accumulated other comprehensive income (loss) on the condensed consolidated statements of financial condition. Gains or losses resulting from transactions denominated in currencies other than the U.S. dollar within certain foreign subsidiaries and gains and losses arising on revaluation of U.S. dollar-denominated assets and liabilities held by certain foreign subsidiaries are included in foreign currency gain (loss)—net in the Company’s condensed consolidated statements of operations.
Recently Issued Accounting Pronouncements—In June 2022, the Financial Accounting Standards Board issued Accounting Standards Update 2022-03 (ASU), Fair Value Measurement (Topic 820): Fair Value Measurement of Equity Securities Subject to Contractual Sale Restrictions. The standard clarifies that contractual sale restrictions are not considered in measuring the fair value of equity securities, which would be a change in practice for certain entities. The ASU also indicates that a contractual sale restriction is not a separate unit of account, and requires new disclosures for all entities with equity securities subject to a contractual sale restriction. This new guidance will be effective on January 1, 2024. The Company does not expect that the adoption of this new standard will have a material effect on the Company's condensed consolidated financial statements and related disclosures.
COHEN & STEERS, INC. AND SUBSIDIARIES
NOTES TO CONDENSED CONSOLIDATED FINANCIAL STATEMENTS—(Continued)
(UNAUDITED)
3. Revenue
The following tables summarize revenue recognized from contracts with customers by client domicile and by investment vehicle:
| | | | | | | | | | | | | | | | | | | | | | | |
| Three Months Ended
June 30, | | Six Months Ended
June 30, |
| (in thousands) | 2023 | | 2022 | | 2023 | | 2022 |
| Client domicile: | | | | | | | |
| North America | $ | 104,686 | | | $ | 129,428 | | | $ | 214,456 | | | $ | 264,628 | |
| Japan | 8,014 | | | 9,263 | | | 16,133 | | | 18,786 | |
| Europe, Middle East and Africa | 4,654 | | | 5,405 | | | 9,541 | | | 11,358 | |
| Asia Pacific excluding Japan | 3,276 | | | 3,335 | | | 6,582 | | | 6,848 | |
| Total | $ | 120,630 | | | $ | 147,431 | | | $ | 246,712 | | | $ | 301,620 | |
| | | | | | | |
| | | | | | | |
| | | | | | | |
| | | | | | | |
| | | | | | | |
| | | | | | | |
| | | | | | | |
| | | | | | | |
| | | | | | | |
| | | | | | | |
| | | | | | | |
| | | | | | | |
| | | | | | | | | | | | | | | | | | | | | | | |
| Three Months Ended
June 30, | | Six Months Ended
June 30, |
| (in thousands) | 2023 | | 2022 | | 2023 | | 2022 |
| Investment vehicle: | | | | | | | |
| Open-end funds | $ | 66,574 | | | $ | 85,561 | | | $ | 137,142 | | | $ | 175,746 | |
| Institutional accounts | 30,166 | | | 34,429 | | | 60,795 | | | 71,112 | |
| Closed-end funds | 23,890 | | | 27,441 | | | 48,775 | | | 54,762 | |
| | | | | | | |
| Total | $ | 120,630 | | | $ | 147,431 | | | $ | 246,712 | | | $ | 301,620 | |
4. Investments
The following table summarizes the Company's investments:
| | | | | | | | | | | |
| (in thousands) | June 30,
2023 | | December 31, 2022 |
| Equity investments at fair value | $ | 161,051 | | | $ | 157,646 | |
| Trading | 27,155 | | | 15,289 | |
| Equity method | 21 | | | 20 | |
| Total investments | $ | 188,227 | | | $ | 172,955 | |
The following table summarizes gain (loss) from investments—net, including derivative financial instruments, the majority of which are used to economically hedge certain exposures (see Note 6, Derivatives):
| | | | | | | | | | | | | | | | | | | | | | | |
| | Three Months Ended
June 30, | | Six Months Ended
June 30, |
| (in thousands) | 2023 | | 2022 | | 2023 | | 2022 |
Net realized gains (losses) during the period | $ | (761) | | | $ | 2,664 | | | $ | (3,091) | | | $ | 10,845 | |
Net unrealized gains (losses) during the period on investments still held at the end of the period | 1,117 | | | (31,237) | | | 3,139 | | | (35,851) | |
Gain (loss) from investments—net (1) | $ | 356 | | | $ | (28,573) | | | $ | 48 | | | $ | (25,006) | |
________________________(1)Included gain (loss) attributable to noncontrolling interests.
COHEN & STEERS, INC. AND SUBSIDIARIES
NOTES TO CONDENSED CONSOLIDATED FINANCIAL STATEMENTS—(Continued)
(UNAUDITED)
At June 30, 2023 and December 31, 2022, the Company's consolidated VIEs included the Cohen & Steers SICAV Global Listed Infrastructure Fund (SICAV GLI), the Cohen & Steers SICAV Global Real Estate Fund (SICAV GRE), the Cohen & Steers Co-Investment Partnership, L.P. (GRP-CIP) and the Cohen & Steers Real Estate Opportunities Fund, L.P. (REOF).
The following tables summarize the statements of financial condition attributable to the Company's consolidated VIEs:
| | | | | | | | | | | | | | | | | | | | | | | | | | | | | | | |
| June 30, 2023 |
| (in thousands) | SICAV GLI | | SICAV GRE | | | | GRP-CIP | | REOF | | Total |
Assets (1) | | | | | | | | | | | |
Investments | $ | 37,011 | | | $ | 79,033 | | | | | $ | 151 | | | $ | 23,002 | | | $ | 139,197 | |
Due from brokers | 233 | | | 609 | | | | | 25 | | | — | | | 867 | |
Other assets | 190 | | | 357 | | | | | — | | | 1 | | | 548 | |
| Total assets | 37,434 | | | 79,999 | | | | | 176 | | | 23,003 | | | 140,612 | |
| | | | | | | | | | | |
Liabilities (1) | | | | | | | | | | | |
Due to brokers | $ | 272 | | | $ | 358 | | | | | $ | — | | | $ | — | | | $ | 630 | |
| Other liabilities and accrued expenses | 70 | | | 140 | | | | | 5 | | | 411 | | | 626 | |
| Total liabilities | 342 | | | 498 | | | | | 5 | | | 411 | | | 1,256 | |
| | | | | | | | | | | |
| Net assets | $ | 37,092 | | | $ | 79,501 | | | | | $ | 171 | | | $ | 22,592 | | | $ | 139,356 | |
| | | | | | | | | | | |
| Attributable to the Company | $ | 19,232 | | | $ | 11,843 | | | | | $ | 171 | | | $ | 17,355 | | | $ | 48,601 | |
| Attributable to noncontrolling interests | 17,860 | | | 67,658 | | | | | — | | | 5,237 | | | 90,755 | |
| Net assets | $ | 37,092 | | | $ | 79,501 | | | | | $ | 171 | | | $ | 22,592 | | | $ | 139,356 | |
_________________________
(1) The assets may only be used to settle obligations of each VIE and the liabilities are the sole obligation of each VIE, for which creditors do not have recourse to the general credit of the Company.
| | | | | | | | | | | | | | | | | | | | | | | | | | | | | | | |
| December 31, 2022 |
| (in thousands) | SICAV GLI | | SICAV GRE | | | | GRP-CIP | | REOF | | Total |
Assets (1) | | | | | | | | | | | |
Investments | $ | 36,296 | | | $ | 79,434 | | | | | $ | 147 | | | $ | 19,052 | | | $ | 134,929 | |
Due from brokers | 11 | | | — | | | | | 27 | | | — | | | 38 | |
Other assets | 151 | | | 370 | | | | | — | | | 55 | | | 576 | |
| Total assets | 36,458 | | | 79,804 | | | | | 174 | | | 19,107 | | | 135,543 | |
| | | | | | | | | | | |
Liabilities (1) | | | | | | | | | | | |
Due to brokers | $ | 11 | | | $ | — | | | | | $ | — | | | $ | — | | | $ | 11 | |
| Other liabilities and accrued expenses | 91 | | | 214 | | | | | 5 | | | 354 | | | 664 | |
| Total liabilities | 102 | | | 214 | | | | | 5 | | | 354 | | | 675 | |
| | | | | | | | | | | |
| Net assets | $ | 36,356 | | | $ | 79,590 | | | | | $ | 169 | | | $ | 18,753 | | | $ | 134,868 | |
| | | | | | | | | | | |
| Attributable to the Company | $ | 19,116 | | | $ | 11,495 | | | | | $ | 169 | | | $ | 14,699 | | | $ | 45,479 | |
| Attributable to noncontrolling interests | 17,240 | | | 68,095 | | | | | — | | | 4,054 | | | 89,389 | |
| Net assets | $ | 36,356 | | | $ | 79,590 | | | | | $ | 169 | | | $ | 18,753 | | | $ | 134,868 | |
_________________________
(1) The assets may only be used to settle obligations of each VIE and the liabilities are the sole obligation of each VIE, for which creditors do not have recourse to the general credit of the Company.
COHEN & STEERS, INC. AND SUBSIDIARIES
NOTES TO CONDENSED CONSOLIDATED FINANCIAL STATEMENTS—(Continued)
(UNAUDITED)
5. Fair Value
Accounting Standards Codification Topic 820, Fair Value Measurement (ASC 820) specifies a hierarchy of valuation classifications based on whether the inputs to the valuation techniques used in each valuation classification are observable or unobservable. These classifications are summarized in the three broad levels listed below:
•Level 1—Unadjusted quoted prices for identical instruments in active markets.
•Level 2—Quoted prices for similar instruments in active markets; quoted prices for identical or similar instruments in markets that are not active; and model-derived valuations in which all significant inputs and significant value drivers are observable.
•Level 3—Valuations derived from valuation techniques in which significant inputs or significant value drivers are unobservable.
Inputs used to measure fair value might fall in different levels of the fair value hierarchy, in which case the Company defaults to the lowest level input that is significant to the fair value measurement in its entirety. These levels are not necessarily an indication of the risk or liquidity associated with the investments.
The following tables present fair value measurements:
| | | | | | | | | | | | | | | | | | | | | | | | | | | | | | | |
| June 30, 2023 |
| (in thousands) | Level 1 | | Level 2 | | Level 3 | | Investments Measured at NAV (1) | | | | Total |
| Cash equivalents | $ | 133,860 | | | $ | — | | | $ | — | | | $ | — | | | | | $ | 133,860 | |
| Equity investments at fair value: | | | | | | | | | | | |
| Common stocks | $ | 143,489 | | | $ | — | | | $ | — | | | $ | — | | | | | $ | 143,489 | |
| Limited partnership interests | — | | | — | | | 13,986 | | | 1,397 | | | | | 15,383 | |
| Master limited partnership interests | 321 | | | — | | | — | | | — | | | | | 321 | |
| Preferred securities | 1,415 | | | 108 | | | — | | | — | | | | | 1,523 | |
| Other | 215 | | | — | | | — | | | 120 | | | | | 335 | |
| Total | $ | 145,440 | | | $ | 108 | | | $ | 13,986 | | | $ | 1,517 | | | | | $ | 161,051 | |
| Trading investments: | | | | | | | | | | | |
| Fixed income | $ | — | | | $ | 27,155 | | | $ | — | | | $ | — | | | | | $ | 27,155 | |
| | | | | | | | | | | |
| Equity method investments | $ | — | | | $ | — | | | $ | — | | | $ | 21 | | | | | $ | 21 | |
| | | | | | | | | | | |
| Total investments | $ | 145,440 | | | $ | 27,263 | | | $ | 13,986 | | | $ | 1,538 | | | | | $ | 188,227 | |
| | | | | | | | | | | |
| Derivatives - assets: | | | | | | | | | | | |
| Total return swaps | $ | — | | | $ | 374 | | | $ | — | | | $ | — | | | | | $ | 374 | |
| Forward contracts - foreign exchange | — | | | 476 | | | — | | | — | | | | | 476 | |
| Total | $ | — | | | $ | 850 | | | $ | — | | | $ | — | | | | | $ | 850 | |
| Derivatives - liabilities: | | | | | | | | | | | |
| Total return swaps | $ | — | | | $ | 249 | | | $ | — | | | $ | — | | | | | $ | 249 | |
| | | | | | | | | | | |
| Forward contracts - foreign exchange | — | | | 18 | | | — | | | — | | | | | 18 | |
| Total | $ | — | | | $ | 267 | | | $ | — | | | $ | — | | | | | $ | 267 | |
________________________
(1) Comprised of certain investments measured at fair value using net asset value (NAV) as a practical expedient.
COHEN & STEERS, INC. AND SUBSIDIARIES
NOTES TO CONDENSED CONSOLIDATED FINANCIAL STATEMENTS—(Continued)
(UNAUDITED)
| | | | | | | | | | | | | | | | | | | | | | | | | | | | | |
| December 31, 2022 |
| (in thousands) | Level 1 | | Level 2 | | Level 3 | | Investments Measured at NAV (1) | | Total |
| Cash equivalents | $ | 208,557 | | | $ | — | | | $ | — | | | $ | — | | | $ | 208,557 | |
| Equity investments at fair value: | | | | | | | | | |
| Common stocks | $ | 142,268 | | | $ | 987 | | | $ | — | | | $ | — | | | $ | 143,255 | |
| Limited partnership interests | — | | | — | | | 10,759 | | | 1,544 | | | 12,303 | |
| Master limited partnership interests | 316 | | | — | | | — | | | — | | | 316 | |
| Preferred securities | 1,391 | | | 49 | | | — | | | — | | | 1,440 | |
| Other | 200 | | | — | | | — | | | 132 | | | 332 | |
| Total | $ | 144,175 | | | $ | 1,036 | | | $ | 10,759 | | | $ | 1,676 | | | $ | 157,646 | |
| Trading investments: | | | | | | | | | |
| Fixed income | $ | — | | | $ | 15,289 | | | $ | — | | | $ | — | | | $ | 15,289 | |
| Equity method investments | $ | — | | | $ | — | | | $ | — | | | $ | 20 | | | $ | 20 | |
| | | | | | | | | |
| Total investments | $ | 144,175 | | | $ | 16,325 | | | $ | 10,759 | | | $ | 1,696 | | | $ | 172,955 | |
| | | | | | | | | |
| Derivatives - assets: | | | | | | | | | |
| Total return swaps | $ | — | | | $ | 276 | | | $ | — | | | $ | — | | | $ | 276 | |
| | | | | | | | | |
| Total | $ | — | | | $ | 276 | | | $ | — | | | $ | — | | | $ | 276 | |
| Derivatives - liabilities: | | | | | | | | | |
| Total return swaps | $ | — | | | $ | 717 | | | $ | — | | | $ | — | | | $ | 717 | |
| | | | | | | | | |
| Forward contracts - foreign exchange | — | | | 742 | | | — | | | — | | | 742 | |
| Total | $ | — | | | $ | 1,459 | | | $ | — | | | $ | — | | | $ | 1,459 | |
________________________
(1) Comprised of certain investments measured at fair value using NAV as a practical expedient.
Equity investments at fair value classified as Level 2 were comprised of common stocks for which quoted prices in active markets are not available. Fair values for the common stocks classified as Level 2 were generally based on quoted prices for similar instruments in active markets.
Equity investments at fair value classified as Level 3 were comprised of limited partnership interests in joint ventures that hold investments in private real estate.
Trading investments classified as Level 2 were comprised of U.S. Treasury securities and corporate debt securities. Fair values were generally determined using third-party pricing services. The pricing services may utilize evaluated pricing models that vary by asset class and incorporate available trade, bid and other market information.
Investments measured at NAV were comprised of certain investments measured at fair value using NAV (or its equivalent) as a practical expedient as follows:
•Equity investments at fair value included:
◦limited partnership interests in private real estate funds; and
◦the Company's co-investment in a Cayman trust invested in global listed infrastructure securities (which is included in "Other" in the leveling table).
•Equity method investments included the Company's partnership interests in Cohen & Steers Global Realty Partners III-TE, L.P. (GRP-TE) and Cohen & Steers Global Listed Infrastructure Fund L.P. (LPGI). GRP-TE invests in non-registered real estate funds and LPGI invests in global infrastructure securities. The Company's ownership interest in GRP-TE was approximately 0.2% at June 30, 2023 and December 31, 2022. The Company's ownership interest in LPGI was approximately 0.01% at June 30, 2023 and December 31, 2022.
COHEN & STEERS, INC. AND SUBSIDIARIES
NOTES TO CONDENSED CONSOLIDATED FINANCIAL STATEMENTS—(Continued)
(UNAUDITED)
At June 30, 2023 and December 31, 2022, the Company did not have the ability to redeem its limited partnership interests in private real estate funds or its interest in GRP-TE. There were no contractual restrictions on the Company's ability to redeem its interest in the Cayman trust or LPGI.
Investments measured at NAV as a practical expedient have not been classified in the fair value hierarchy. The amounts presented in the above tables are intended to permit reconciliation of the fair value hierarchy to the amounts presented on the condensed consolidated statements of financial condition.
Total return swap contracts classified as Level 2 were valued based on the underlying futures contracts or equity indices.
Foreign currency exchange contracts classified as Level 2 were valued based on the prevailing forward exchange rate, which is an input that is observable in active markets.
The following table summarizes the changes in Level 3 investments measured at fair value on a recurring basis:
| | | | | | | | | | | | | | | | | | | | | | | |
| Three Months Ended
June 30, | | Six Months Ended
June 30, |
| (in thousands) | 2023 | | 2022 | | 2023 | | 2022 |
| Balance at beginning of period | $ | 13,633 | | | $ | 17,753 | | | $ | 10,759 | | | $ | — | |
| Purchases/contributions | 4,625 | | | — | | | 7,517 | | | 19,380 | |
| Sales/distributions | (2,975) | | | — | | | (2,975) | | | — | |
| | | | | | | |
| Unrealized gains (losses) | (1,297) | | | 839 | | | (1,315) | | | (788) | |
| | | | | | | |
| Balance at end of period | $ | 13,986 | | | $ | 18,592 | | | $ | 13,986 | | | $ | 18,592 | |
Unrealized gains (losses) and realized gains (losses), if any, in the above table were recorded in gain (loss) from investments—net in the Company's condensed consolidated statements of operations.
Valuation Techniques
In certain instances, debt and equity securities are valued on the basis of prices from an orderly transaction between market participants provided by reputable broker-dealers or independent pricing services. In determining the value of a particular investment, independent pricing services may use information with respect to transactions in such investments, broker quotes, pricing matrices, market transactions in comparable investments and various relationships between investments. As part of its independent price verification process, the Company generally performs reviews of valuations provided by broker-dealers or independent pricing services. Investments in funds are valued at their closing price or NAV (or its equivalent) as a practical expedient.
In the absence of observable market prices, the Company values its investments using valuation methodologies applied on a consistent basis. For some investments, little market activity may exist; management's determination of fair value is then based on the best information available in the circumstances, and may incorporate management's own assumptions and involve a significant degree of judgment, taking into consideration a combination of internal and external factors. Such investments are valued no less than on a quarterly basis, taking into consideration any changes in key inputs and changes in economic and other relevant conditions, and valuation models are updated accordingly. The Company has established a valuation committee, comprised of senior members from various departments within the Company, to administer, implement and oversee the valuation policies and procedures. Additionally, the Company has retained an independent valuation services firm to assist in the determination of the fair value of certain private real estate investments.
COHEN & STEERS, INC. AND SUBSIDIARIES
NOTES TO CONDENSED CONSOLIDATED FINANCIAL STATEMENTS—(Continued)
(UNAUDITED)
The following table summarizes the valuation techniques and significant unobservable inputs approved by the Valuation Committee for Level 3 investments measured at fair value on a recurring basis:
| | | | | | | | | | | | | | | | | | | | | | | | | | |
| | Fair Value as of June 30, 2023 (in thousands) | | Valuation Technique | | Unobservable Inputs | | Value |
Limited partnership interest | | $ | 13,986 | | | Discounted cash flow | | Discount rate
Terminal capitalization rate | | 8.75% 7.25% |
| | | | Transaction price | | n/a | | |
| | | | | | | | | | | | | | | | | | | | | | | | | | |
| | Fair Value as of December 31, 2022 (in thousands) | | Valuation Technique | | Unobservable Inputs | | Value |
Limited partnership interest | | $ | 10,759 | | | Discounted cash flow | | Discount rate
Terminal capitalization rate | | 8.75% 7.25% |
Changes in the significant unobservable inputs in the above tables may result in a materially higher or lower fair value measurement.
6. Derivatives
The following tables summarize the notional amount and fair value of the outstanding derivative financial instruments, none of which were designated in a formal hedging relationship:
| | | | | | | | | | | | | | | | | | | | | | | |
| As of June 30, 2023 |
| Notional Amount | | Fair Value (1) |
| (in thousands) | Long | | Short | | Assets | | Liabilities |
| Corporate derivatives: | | | | | | | |
| Total return swaps | $ | 2,330 | | | $ | 40,996 | | | $ | 374 | | | $ | 249 | |
| Forward contracts - foreign exchange | — | | | 10,039 | | | 476 | | | 18 | |
| Total corporate derivatives | $ | 2,330 | | | $ | 51,035 | | | $ | 850 | | | $ | 267 | |
| | | | | | | |
| | | | | | | |
| | | | | | | |
| | | | | | | |
| | | | | | | |
| | | | | | | | | | | | | | | | | | | | | | | |
| As of December 31, 2022 |
| Notional Amount | | Fair Value (1) |
| (in thousands) | Long | | Short | | Assets | | Liabilities |
| Corporate derivatives: | | | | | | | |
| Total return swaps | $ | 2,340 | | | $ | 33,637 | | | $ | 276 | | | $ | 717 | |
| | | | | | | |
| Forward contracts - foreign exchange | — | | | 9,810 | | | — | | | 742 | |
| Total corporate derivatives | $ | 2,340 | | | $ | 43,447 | | | $ | 276 | | | $ | 1,459 | |
________________________
(1) The fair value of derivative financial instruments is recorded in other assets and other liabilities and accrued expenses on the Company's condensed consolidated statements of financial condition.
The Company's corporate derivatives included:
•Total return swaps which are utilized to economically hedge a portion of the market risk of certain seed investments and to gain exposure for the purpose of establishing a performance track record; and
•Forward foreign exchange contracts which are utilized to economically hedge currency exposure arising from certain non-U.S. dollar investment advisory fees.
Cash and U.S. Treasury securities pledged as collateral for forward and swap contracts totaled $1.7 million and $2.2 million at June 30, 2023 and December 31, 2022, respectively. Cash collateral received for swap contracts was $0.6 million at June 30, 2023.
COHEN & STEERS, INC. AND SUBSIDIARIES
NOTES TO CONDENSED CONSOLIDATED FINANCIAL STATEMENTS—(Continued)
(UNAUDITED)
The following table summarizes net gains (losses) from derivative financial instruments:
| | | | | | | | | | | | | | | | | | | | | | | |
| | Three Months Ended
June 30, | | Six Months Ended
June 30, |
| (in thousands) | 2023 | | 2022 | | 2023 | | 2022 |
| Corporate derivatives: | | | | | | | |
| | | | | | | |
| Total return swaps | $ | (25) | | | $ | 3,269 | | | $ | (677) | | | $ | 3,188 | |
| | | | | | | |
| Forward contracts - foreign exchange | 769 | | | (420) | | | 1,200 | | | 390 | |
| Total corporate derivatives | $ | 744 | | | $ | 2,849 | | | $ | 523 | | | $ | 3,578 | |
Derivatives held by consolidated investment vehicles: | | | | | | | |
| Total return swaps | — | | | (1,152) | | | — | | | 3,160 | |
| | | | | | | |
Total (1) | $ | 744 | | | $ | 1,697 | | | $ | 523 | | | $ | 6,738 | |
________________________
(1)Gains and losses on total return swaps are included in gain (loss) from investments—net in the Company's condensed consolidated statements of operations. Gains and losses on forward foreign exchange contracts are included in foreign currency gain (loss)—net in the Company's condensed consolidated statements of operations.
7. Earnings Per Share
Basic earnings per share is calculated by dividing net income attributable to common stockholders by the weighted average shares outstanding. Diluted earnings per share is calculated by dividing net income attributable to common stockholders by the total weighted average shares of common stock outstanding and common stock equivalents determined using the treasury stock method. Common stock equivalents are comprised of dilutive potential shares from restricted stock unit awards and are excluded from the computation if their effect is anti-dilutive.
The following table reconciles income and share data used in the basic and diluted earnings per share computations:
| | | | | | | | | | | | | | | | | | | | | | | |
| | Three Months Ended
June 30, | | Six Months Ended
June 30, |
| (in thousands, except per share data) | 2023 | | 2022 | | 2023 | | 2022 |
| Net income | $ | 32,505 | | | $ | 26,149 | | | $ | 68,803 | | | $ | 72,990 | |
| Net (income) loss attributable to noncontrolling interests | (727) | | | 25,807 | | | (1,711) | | | 20,984 | |
| Net income attributable to common stockholders | $ | 31,778 | | | $ | 51,956 | | | $ | 67,092 | | | $ | 93,974 | |
| Basic weighted average shares outstanding | 49,315 | | | 48,805 | | | 49,257 | | | 48,739 | |
| Dilutive potential shares from restricted stock units | 148 | | | 403 | | | 176 | | | 533 | |
| Diluted weighted average shares outstanding | 49,463 | | | 49,208 | | | 49,433 | | | 49,272 | |
| | | | | | | |
| Basic earnings per share attributable to common stockholders | $ | 0.64 | | | $ | 1.06 | | | $ | 1.36 | | | $ | 1.93 | |
| Diluted earnings per share attributable to common stockholders | $ | 0.64 | | | $ | 1.06 | | | $ | 1.36 | | | $ | 1.91 | |
| | | | | | | |
Anti-dilutive common stock equivalents excluded from the calculation | 214 | | | 2 | | | 141 | | | 2 | |
COHEN & STEERS, INC. AND SUBSIDIARIES
NOTES TO CONDENSED CONSOLIDATED FINANCIAL STATEMENTS—(Continued)
(UNAUDITED)
8. Income Taxes
The provision for income taxes included U.S. federal, state, local and foreign taxes. A reconciliation of the Company’s statutory federal income tax rate and the effective income tax rate is summarized in the following table:
| | | | | | | | | | | | | | | | | | | | | | | |
| Three Months Ended
June 30, | | Six Months Ended
June 30, |
| 2023 | | 2022 | | 2023 | | 2022 |
| U.S. statutory tax rate | 21.0 | % | | 21.0 | % | | 21.0 | % | | 21.0 | % |
| State and local income taxes, net of federal benefit | 3.1 | | | 3.1 | | | 3.1 | | | 3.1 | |
| Non-deductible executive compensation | 1.4 | | | 1.6 | | | 2.2 | | | 3.3 | |
| Excess tax benefits related to the vesting and delivery of restricted stock units | — | | | 0.2 | | | (2.4) | | | (5.1) | |
| Unrecognized tax benefit adjustments | — | | | (10.1) | | | 0.1 | | | (5.5) | |
| Other | 0.2 | | | 0.1 | | | — | | | 0.1 | |
| Effective income tax rate | 25.7 | % | | 15.9 | % | | 24.0 | % | | 16.9 | % |
9. Related Party Transactions
The Company is an investment adviser to, and has administration agreements with, Company-sponsored funds and investment products for which certain employees are officers and/or directors.
The following table summarizes the amount of revenue the Company earned from these affiliated funds:
| | | | | | | | | | | | | | | | | | | | | | | |
| | Three Months Ended
June 30, | | Six Months Ended
June 30, |
| (in thousands) | 2023 | | 2022 | | 2023 | | 2022 |
Investment advisory and administration fees (1) | $ | 81,113 | | | $ | 100,803 | | | $ | 166,612 | | | $ | 205,040 | |
| Distribution and service fees | 6,977 | | | 9,005 | | | 14,539 | | | 18,874 | |
| Total | $ | 88,090 | | | $ | 109,808 | | | $ | 181,151 | | | $ | 223,914 | |
_________________________
(1) Investment advisory and administration fees are reflected net of fund reimbursements of $4.3 million for both the three months ended June 30, 2023 and 2022, and $8.9 million and $8.6 million for the six months ended June 30, 2023 and 2022, respectively.
Included in accounts receivable at June 30, 2023 and December 31, 2022 are receivables due from Company-sponsored funds, which are generally collectible the next business day, of $30.7 million and $32.9 million, respectively. Included in accounts payable at June 30, 2023 and December 31, 2022 are payables due to Company-sponsored funds of $0.8 million and $1.0 million, respectively.
Included in other assets at June 30, 2023 and December 31, 2022 is an advance to Cohen & Steers Income
Opportunities REIT, Inc. (CNSREIT) of $6.4 million and $3.5 million, respectively. CNSREIT will reimburse the Company ratably over a 60-month period commencing at the earlier of December 31, 2025, or the month that CNREIT's NAV is at least $1.0 billion. At June 30, 2023 and December 31, 2022, the Company determined the advance to be collectible. At June 30, 2023, the Company reclassified the advance from accounts receivable to other assets on its condensed consolidated statement of financial condition as of December 31, 2022.
See discussion of commitments to Company-sponsored vehicles in Note 11.
COHEN & STEERS, INC. AND SUBSIDIARIES
NOTES TO CONDENSED CONSOLIDATED FINANCIAL STATEMENTS—(Continued)
(UNAUDITED)
10. Credit Agreement
On January 20, 2023, the Company entered into a Credit Agreement with Bank of America, N.A. (Credit Agreement) providing for a $100.0 million senior unsecured revolving credit facility maturing on January 20, 2026. Borrowings under the Credit Agreement bear interest at a variable annual rate equal to, at the Company’s option, either, (i) in respect of Term Secured Overnight Financing Rate (SOFR) Loans (as defined in the Credit Agreement), a rate equal to Term SOFR (as defined in the Credit Agreement) in effect for such period plus an applicable rate as determined according to a performance pricing grid and, (ii) in respect of Base Rate Loans (as defined in the Credit Agreement), a rate equal to a Base Rate (as defined in the Credit Agreement) plus an applicable rate as determined according to a performance pricing grid. The Company is also required to pay a commitment fee determined according to a performance pricing grid and based on the actual daily unused amount of the Credit Agreement payable quarterly.
Borrowings under the Credit Agreement may be used for working capital and other general corporate purposes. The Credit Agreement contains affirmative, negative and financial covenants, which are customary for facilities of this type, including with respect to leverage and interest coverage, limitations on priority indebtedness, asset dispositions and fundamental corporate changes. As of June 30, 2023, the Company was in compliance with these covenants.
As of June 30, 2023, the Company had not drawn upon the credit agreement.
11. Commitments and Contingencies
From time to time, the Company is involved in legal matters relating to claims arising in the ordinary course of business. There are currently no such matters pending that the Company believes could have a material adverse effect on its consolidated results of operations, cash flows or financial position.
The Company has committed to invest up to $50.0 million in REOF. As of June 30, 2023, the Company had funded $21.2 million of this commitment. In addition, the Company has committed to invest up to $125.0 million in CNSREIT. As of June 30, 2023, the Company had funded $0.2 million of this commitment to enable CNSREIT to capitalize a share class in preparation for an offering. The timing for funding the remaining portion of the Company's commitments is determined by the investment vehicles.
12. Concentration of Credit Risk
The Company's cash and cash equivalents are principally on deposit with highly rated national financial institutions and are subject to credit risk should these financial institutions be unable to fulfill their obligations. The Company limits its exposure to such credit risks by diversifying its cash and cash equivalents among several highly rated national financial institutions.
13. Subsequent Events
The Company has evaluated the need for disclosures and/or adjustments resulting from subsequent events through the date the condensed consolidated financial statements were issued. Other than the items described below, the Company determined that there were no additional subsequent events that require disclosure and/or adjustment.
On August 3, 2023, the Company declared a quarterly dividend on its common stock in the amount of $0.57 per share. This dividend will be payable on August 24, 2023 to stockholders of record at the close of business on August 14, 2023.
Item 2. Management's Discussion and Analysis of Financial Condition and Results of Operations
Set forth on the following pages is management's discussion and analysis of our financial condition and results of operations for the three and six months ended June 30, 2023 and 2022. Such information should be read in conjunction with our condensed consolidated financial statements and the related notes included herein. The condensed consolidated financial statements of the Company are unaudited. When we use the terms "Cohen & Steers," the "Company," "we," "us," and "our," we mean Cohen & Steers, Inc., a Delaware corporation, and its consolidated subsidiaries.
Executive Overview
General
We are a global investment manager specializing in real assets and alternative income, including real estate, preferred securities, infrastructure, resource equities, commodities, as well as multi-strategy solutions. Founded in 1986, we are headquartered in New York City, with offices in London, Dublin, Hong Kong, Tokyo and Singapore.
Our primary investment strategies include U.S. real estate, preferred securities and low duration preferred securities, global/international real estate, global listed infrastructure, real assets multi-strategy, as well as global natural resource equities. Our strategies seek to achieve a variety of investment objectives for different risk profiles and are actively managed by specialist teams of investment professionals who employ fundamental-driven research and portfolio management processes. We offer our strategies through a variety of investment vehicles, including U.S. and non-U.S. registered funds and other commingled vehicles, separate accounts and subadvised portfolios.
Our distribution network encompasses two major channels, wealth and institutional. Our wealth channel includes registered investment advisers, wirehouses, independent and regional broker dealers and bank trusts. Our institutional channel includes sovereign wealth funds, corporate plans, insurance companies and public funds, including defined benefit and defined contribution plans, as well as other financial institutions that access our investment management services directly or through consultants and other intermediaries.
Our revenue from the wealth channel is primarily derived from investment advisory, administration, distribution and service fees from open-end and closed-end funds as well as other commingled vehicles. Our revenue from the institutional channel is derived from fees received from our clients for managing advised and subadvised accounts. Our fees are based on contractually specified rates applied to the value of the assets we manage and, in certain cases, may include a performance-based fee. Our revenue fluctuates with changes in the total value of our assets under management, which may occur as a result of market appreciation and depreciation, contributions or withdrawals from investor accounts and distributions. This revenue is recognized over the period that the assets are managed.
Assets Under Management
By Investment Vehicle
(in millions) | | | | | | | | | | | | | | | | | | | | | | | |
| Three Months Ended
June 30, | | Six Months Ended
June 30, |
| 2023 | | 2022 | | 2023 | | 2022 |
| Open-end Funds | | | | | | | |
| Assets under management, beginning of period | $ | 36,427 | | | $ | 48,105 | | | $ | 36,903 | | | $ | 50,911 | |
| Inflows | 2,782 | | | 4,859 | | | 6,256 | | | 9,745 | |
| Outflows | (3,290) | | | (5,103) | | | (7,069) | | | (9,781) | |
| Net inflows (outflows) | (508) | | | (244) | | | (813) | | | (36) | |
| Market appreciation (depreciation) | 794 | | | (5,654) | | | 904 | | | (8,389) | |
| Distributions | (344) | | | (624) | | | (625) | | | (903) | |
| Transfers | (160) | | | — | | | (160) | | | — | |
| Total increase (decrease) | (218) | | | (6,522) | | | (694) | | | (9,328) | |
| Assets under management, end of period | $ | 36,209 | | | $ | 41,583 | | | $ | 36,209 | | | $ | 41,583 | |
| Percentage of total assets under management | 45.0 | % | | 47.3 | % | | 45.0 | % | | 47.3 | % |
| Average assets under management | $ | 35,911 | | | $ | 45,188 | | | $ | 37,178 | | | $ | 46,602 | |
| | | | | | | |
| Institutional Accounts | | | | | | | |
| Assets under management, beginning of period | $ | 32,604 | | | $ | 40,956 | | | $ | 32,373 | | | $ | 42,727 | |
| Inflows | 670 | | | 1,259 | | | 1,385 | | | 3,319 | |
| Outflows | (676) | | | (1,734) | | | (1,509) | | | (3,800) | |
| Net inflows (outflows) | (6) | | | (475) | | | (124) | | | (481) | |
| Market appreciation (depreciation) | 776 | | | (5,733) | | | 1,384 | | | (7,227) | |
| Distributions | (259) | | | (242) | | | (518) | | | (513) | |
| Transfers | 160 | | | — | | | 160 | | | — | |
| Total increase (decrease) | 671 | | | (6,450) | | | 902 | | | (8,221) | |
| Assets under management, end of period | $ | 33,275 | | | $ | 34,506 | | | $ | 33,275 | | | $ | 34,506 | |
| Percentage of total assets under management | 41.4 | % | | 39.3 | % | | 41.4 | % | | 39.3 | % |
| Average assets under management | $ | 32,682 | | | $ | 37,506 | | | $ | 33,047 | | | $ | 39,048 | |
| | | | | | | |
| Closed-end Funds | | | | | | | |
| Assets under management, beginning of period | $ | 10,874 | | | $ | 13,061 | | | $ | 11,149 | | | $ | 12,991 | |
| Inflows | 2 | | | 2 | | | 13 | | | 556 | |
| Outflows | — | | | — | | | (85) | | | — | |
| Net inflows (outflows) | 2 | | | 2 | | | (72) | | | 556 | |
| Market appreciation (depreciation) | 207 | | | (1,137) | | | 160 | | | (1,474) | |
| Distributions | (154) | | | (153) | | | (308) | | | (300) | |
| Total increase (decrease) | 55 | | | (1,288) | | | (220) | | | (1,218) | |
Assets under management, end of period | $ | 10,929 | | | $ | 11,773 | | | $ | 10,929 | | | $ | 11,773 | |
| Percentage of total assets under management | 13.6 | % | | 13.4 | % | | 13.6 | % | | 13.4 | % |
| Average assets under management | $ | 10,813 | | | $ | 12,428 | | | $ | 11,081 | | | $ | 12,489 | |
| | | | | | | |
| Total | | | | | | | |
| Assets under management, beginning of period | $ | 79,905 | | | $ | 102,122 | | | $ | 80,425 | | | $ | 106,629 | |
| Inflows | 3,454 | | | 6,120 | | | 7,654 | | | 13,620 | |
| Outflows | (3,966) | | | (6,837) | | | (8,663) | | | (13,581) | |
| Net inflows (outflows) | (512) | | | (717) | | | (1,009) | | | 39 | |
| Market appreciation (depreciation) | 1,777 | | | (12,524) | | | 2,448 | | | (17,090) | |
| Distributions | (757) | | | (1,019) | | | (1,451) | | | (1,716) | |
| Total increase (decrease) | 508 | | | (14,260) | | | (12) | | | (18,767) | |
| Assets under management, end of period | $ | 80,413 | | | $ | 87,862 | | | $ | 80,413 | | | $ | 87,862 | |
| Average assets under management | $ | 79,406 | | | $ | 95,122 | | | $ | 81,306 | | | $ | 98,139 | |
Assets Under Management - Institutional Accounts
By Account Type
(in millions) | | | | | | | | | | | | | | | | | | | | | | | |
| Three Months Ended
June 30, | | Six Months Ended
June 30, |
| 2023 | | 2022 | | 2023 | | 2022 |
| Advisory | | | | | | | |
| Assets under management, beginning of period | $ | 18,490 | | | $ | 23,726 | | | $ | 18,631 | | | $ | 24,599 | |
| Inflows | 282 | | | 769 | | | 504 | | | 2,342 | |
| Outflows | (496) | | | (1,177) | | | (1,117) | | | (2,792) | |
| Net inflows (outflows) | (214) | | | (408) | | | (613) | | | (450) | |
| Market appreciation (depreciation) | 388 | | | (3,183) | | | 646 | | | (4,014) | |
| Transfers | 160 | | | — | | | 160 | | | — | |
| Total increase (decrease) | 334 | | | (3,591) | | | 193 | | | (4,464) | |
| Assets under management, end of period | $ | 18,824 | | | $ | 20,135 | | | $ | 18,824 | | | $ | 20,135 | |
| Percentage of institutional assets under management | 56.6 | % | | 58.4 | % | | 56.6 | % | | 58.4 | % |
| Average assets under management | $ | 18,602 | | | $ | 21,869 | | | $ | 18,861 | | | $ | 22,860 | |
| | | | | | | |
| Japan Subadvisory | | | | | | | |
| Assets under management, beginning of period | $ | 8,713 | | | $ | 10,692 | | | $ | 8,376 | | | $ | 11,329 | |
| Inflows | 283 | | | 249 | | | 668 | | | 468 | |
| Outflows | (89) | | | (226) | | | (148) | | | (329) | |
| Net inflows (outflows) | 194 | | | 23 | | | 520 | | | 139 | |
| Market appreciation (depreciation) | 312 | | | (1,534) | | | 582 | | | (2,016) | |
| Distributions | (259) | | | (242) | | | (518) | | | (513) | |
| | | | | | | |
| Total increase (decrease) | 247 | | | (1,753) | | | 584 | | | (2,390) | |
| Assets under management, end of period | $ | 8,960 | | | $ | 8,939 | | | $ | 8,960 | | | $ | 8,939 | |
| Percentage of institutional assets under management | 26.9 | % | | 25.9 | % | | 26.9 | % | | 25.9 | % |
| Average assets under management | $ | 8,653 | | | $ | 9,604 | | | $ | 8,696 | | | $ | 9,975 | |
| | | | | | | |
| Subadvisory Excluding Japan | | | | | | | |
| Assets under management, beginning of period | $ | 5,401 | | | $ | 6,538 | | | $ | 5,366 | | | $ | 6,799 | |
| Inflows | 105 | | | 241 | | | 213 | | | 509 | |
| Outflows | (91) | | | (331) | | | (244) | | | (679) | |
| Net inflows (outflows) | 14 | | | (90) | | | (31) | | | (170) | |
| Market appreciation (depreciation) | 76 | | | (1,016) | | | 156 | | | (1,197) | |
| | | | | | | |
| Total increase (decrease) | 90 | | | (1,106) | | | 125 | | | (1,367) | |
| Assets under management, end of period | $ | 5,491 | | | $ | 5,432 | | | $ | 5,491 | | | $ | 5,432 | |
| Percentage of institutional assets under management | 16.5 | % | | 15.7 | % | | 16.5 | % | | 15.7 | % |
| Average assets under management | $ | 5,427 | | | $ | 6,033 | | | $ | 5,490 | | | $ | 6,213 | |
| | | | | | | |
| Total Institutional Accounts | | | | | | | |
| Assets under management, beginning of period | $ | 32,604 | | | $ | 40,956 | | | $ | 32,373 | | | $ | 42,727 | |
| Inflows | 670 | | | 1,259 | | | 1,385 | | | 3,319 | |
| Outflows | (676) | | | (1,734) | | | (1,509) | | | (3,800) | |
| Net inflows (outflows) | (6) | | | (475) | | | (124) | | | (481) | |
| Market appreciation (depreciation) | 776 | | | (5,733) | | | 1,384 | | | (7,227) | |
| Distributions | (259) | | | (242) | | | (518) | | | (513) | |
| | | | | | | |
| Transfers | 160 | | | — | | | 160 | | | — | |
| Total increase (decrease) | 671 | | | (6,450) | | | 902 | | | (8,221) | |
| Assets under management, end of period | $ | 33,275 | | | $ | 34,506 | | | $ | 33,275 | | | $ | 34,506 | |
| Average assets under management | $ | 32,682 | | | $ | 37,506 | | | $ | 33,047 | | | $ | 39,048 | |
Assets Under Management
By Investment Strategy
(in millions) | | | | | | | | | | | | | | | | | | | | | | | |
| Three Months Ended
June 30, | | Six Months Ended
June 30, |
| 2023 | | 2022 | | 2023 | | 2022 |
| U.S. Real Estate | | | | | | | |
| Assets under management, beginning of period | $ | 36,080 | | | $ | 47,268 | | | $ | 35,108 | | | $ | 49,915 | |
| Inflows | 1,614 | | | 2,582 | | | 3,647 | | | 5,875 | |
| Outflows | (1,500) | | | (2,433) | | | (3,099) | | | (5,169) | |
| Net inflows (outflows) | 114 | | | 149 | | | 548 | | | 706 | |
| Market appreciation (depreciation) | 1,210 | | | (6,542) | | | 2,117 | | | (9,334) | |
| Distributions | (456) | | | (697) | | | (893) | | | (1,109) | |
| Transfers | — | | | — | | | 68 | | | — | |
| Total increase (decrease) | 868 | | | (7,090) | | | 1,840 | | | (9,737) | |
| Assets under management, end of period | $ | 36,948 | | | $ | 40,178 | | | $ | 36,948 | | | $ | 40,178 | |
| Percentage of total assets under management | 45.9 | % | | 45.7 | % | | 45.9 | % | | 45.7 | % |
| Average assets under management | $ | 35,800 | | | $ | 43,917 | | | $ | 36,283 | | | $ | 45,174 | |
| | | | | | | |
| Preferred Securities | | | | | | | |
| Assets under management, beginning of period | $ | 18,210 | | | $ | 24,466 | | | $ | 19,767 | | | $ | 26,987 | |
| Inflows | 1,241 | | | 1,711 | | | 2,695 | | | 3,675 | |
| Outflows | (1,606) | | | (2,757) | | | (3,932) | | | (5,629) | |
| Net inflows (outflows) | (365) | | | (1,046) | | | (1,237) | | | (1,954) | |
| Market appreciation (depreciation) | 348 | | | (1,769) | | | (144) | | | (3,169) | |
| Distributions | (184) | | | (202) | | | (379) | | | (415) | |
| Transfers | — | | | — | | | 2 | | | — | |
| Total increase (decrease) | (201) | | | (3,017) | | | (1,758) | | | (5,538) | |
| Assets under management, end of period | $ | 18,009 | | | $ | 21,449 | | | $ | 18,009 | | | $ | 21,449 | |
| Percentage of total assets under management | 22.4 | % | | 24.4 | % | | 22.4 | % | | 24.4 | % |
| Average assets under management | $ | 18,013 | | | $ | 22,915 | | | $ | 19,124 | | | $ | 24,272 | |
| | | | | | | |
| Global/International Real Estate | | | | | | | |
| Assets under management, beginning of period | $ | 14,762 | | | $ | 19,362 | | | $ | 14,782 | | | $ | 19,380 | |
| Inflows | 368 | | | 861 | | | 641 | | | 2,417 | |
| Outflows | (458) | | | (1,164) | | | (875) | | | (1,944) | |
| Net inflows (outflows) | (90) | | | (303) | | | (234) | | | 473 | |
| Market appreciation (depreciation) | 206 | | | (3,303) | | | 408 | | | (4,078) | |
| Distributions | (40) | | | (47) | | | (48) | | | (66) | |
| Transfers | — | | | — | | | (70) | | | — | |
| Total increase (decrease) | 76 | | | (3,653) | | | 56 | | | (3,671) | |
| Assets under management, end of period | $ | 14,838 | | | $ | 15,709 | | | $ | 14,838 | | | $ | 15,709 | |
| Percentage of total assets under management | 18.5 | % | | 17.9 | % | | 18.5 | % | | 17.9 | % |
| Average assets under management | $ | 14,859 | | | $ | 17,524 | | | $ | 15,093 | | | $ | 18,183 | |
Assets Under Management
By Investment Strategy - continued
(in millions) | | | | | | | | | | | | | | | | | | | | | | | |
| Three Months Ended
June 30, | | Six Months Ended
June 30, |
| 2023 | | 2022 | | 2023 | | 2022 |
| Global Listed Infrastructure | | | | | | | |
| Assets under management, beginning of period | $ | 8,596 | | | $ | 9,197 | | | $ | 8,596 | | | $ | 8,763 | |
| Inflows | 79 | | | 461 | | | 214 | | | 925 | |
| Outflows | (250) | | | (353) | | | (374) | | | (652) | |
| Net inflows (outflows) | (171) | | | 108 | | | (160) | | | 273 | |
| Market appreciation (depreciation) | 12 | | | (673) | | | 47 | | | (359) | |
| Distributions | (58) | | | (58) | | | (104) | | | (103) | |
| Total increase (decrease) | (217) | | | (623) | | | (217) | | | (189) | |
| Assets under management, end of period | $ | 8,379 | | | $ | 8,574 | | | $ | 8,379 | | | $ | 8,574 | |
| Percentage of total assets under management | 10.4 | % | | 9.8 | % | | 10.4 | % | | 9.8 | % |
| Average assets under management | $ | 8,486 | | | $ | 8,853 | | | $ | 8,582 | | | $ | 8,729 | |
| | | | | | | |
| Other | | | | | | | |
| Assets under management, beginning of period | $ | 2,257 | | | $ | 1,829 | | | $ | 2,172 | | | $ | 1,584 | |
| Inflows | 152 | | | 505 | | | 457 | | | 728 | |
| Outflows | (152) | | | (130) | | | (383) | | | (187) | |
| Net inflows (outflows) | — | | | 375 | | | 74 | | | 541 | |
| Market appreciation (depreciation) | 1 | | | (237) | | | 20 | | | (150) | |
| Distributions | (19) | | | (15) | | | (27) | | | (23) | |
| | | | | | | |
| Total increase (decrease) | (18) | | | 123 | | | 67 | | | 368 | |
| Assets under management, end of period | $ | 2,239 | | | $ | 1,952 | | | $ | 2,239 | | | $ | 1,952 | |
| Percentage of total assets under management | 2.8 | % | | 2.2 | % | | 2.8 | % | | 2.2 | % |
| Average assets under management | $ | 2,248 | | | $ | 1,913 | | | $ | 2,224 | | | $ | 1,781 | |
| | | | | | | |
| Total | | | | | | | |
| Assets under management, beginning of period | $ | 79,905 | | | $ | 102,122 | | | $ | 80,425 | | | $ | 106,629 | |
| Inflows | 3,454 | | | 6,120 | | | 7,654 | | | 13,620 | |
| Outflows | (3,966) | | | (6,837) | | | (8,663) | | | (13,581) | |
| Net inflows (outflows) | (512) | | | (717) | | | (1,009) | | | 39 | |
| Market appreciation (depreciation) | 1,777 | | | (12,524) | | | 2,448 | | | (17,090) | |
| Distributions | (757) | | | (1,019) | | | (1,451) | | | (1,716) | |
| Total increase (decrease) | 508 | | | (14,260) | | | (12) | | | (18,767) | |
| Assets under management, end of period | $ | 80,413 | | | $ | 87,862 | | | $ | 80,413 | | | $ | 87,862 | |
| Average assets under management | $ | 79,406 | | | $ | 95,122 | | | $ | 81,306 | | | $ | 98,139 | |
Investment Performance at June 30, 2023
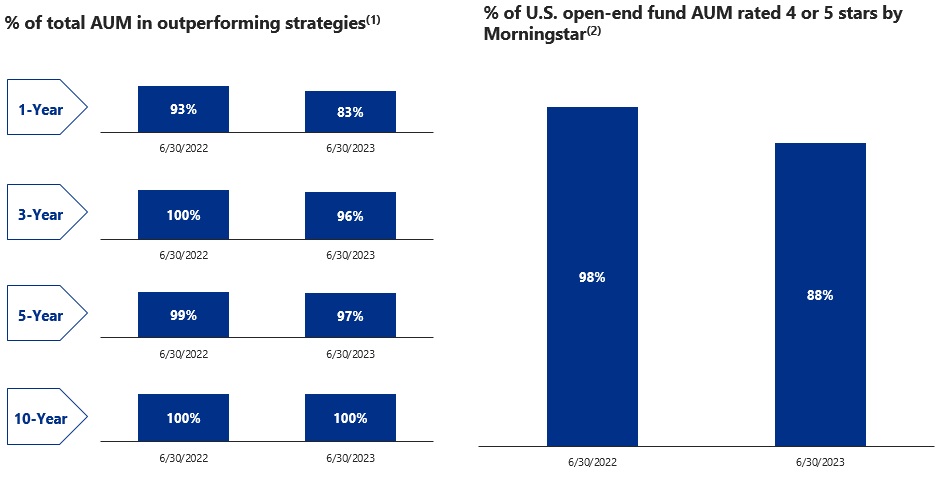 _________________________
(1) Past performance is no guarantee of future results. Outperformance is determined by comparing the annualized investment performance of each investment strategy to the performance of specified reference benchmarks. Investment performance in excess of the performance of the benchmark is considered outperformance. The investment performance calculation of each investment strategy is based on all active accounts and investment models pursuing similar investment objectives. For accounts, actual investment performance is measured gross of fees and net of withholding taxes. For investment models, for which actual investment performance does not exist, the investment performance of a composite of accounts pursuing comparable investment objectives is used as a proxy for actual investment performance. The performance of the specified reference benchmark for each account and investment model is measured net of withholding taxes, where applicable. This is not investment advice and may not be construed as sales or marketing material for any financial product or service sponsored or provided by Cohen & Steers.
(2) © 2023 Morningstar, Inc. All Rights Reserved. The information contained herein: (1) is proprietary to Morningstar and/or its content providers; (2) may not be copied or distributed; and (3) is not warranted to be accurate, complete, or timely. Neither Morningstar nor its content providers are responsible for any damages or losses arising from any use of this information. Morningstar calculates its ratings based on a risk-adjusted return measure that accounts for variation in a fund's monthly performance (including the effects of sales charges, loads, and redemption fees), placing more emphasis on downward variations and rewarding consistent performance. The top 10% of funds in each category receive five stars, the next 22.5% receive four stars, the next 35% receive three stars, the next 22.5% receive two stars and the bottom 10% receive one star. Past performance is no guarantee of future results. Based on independent rating by Morningstar, Inc. of investment performance of each Cohen & Steers-sponsored open-end U.S.-registered mutual fund for all share classes for the overall period at June 30, 2023. Overall Morningstar rating is a weighted average based on the 3-year, 5-year and 10-year Morningstar rating. Each share class is counted as a fraction of one fund within this scale and rated separately, which may cause slight variations in the distribution percentages. This is not investment advice and may not be construed as sales or marketing material for any financial product or service sponsored or provided by Cohen & Steers.
Overview
Assets under management at June 30, 2023 decreased 8.5% to $80.4 billion from $87.9 billion at June 30, 2022. The decrease was due to net outflows of $2.7 billion, market depreciation of $1.4 billion and distributions of $3.4 billion. Net outflows included $2.4 billion from preferred securities. Market depreciation included $647 million from U.S. real estate and $552 million from global/international real estate. Distributions included $2.2 billion from U.S. real estate, $798 million from preferred securities and $218 million from global listed infrastructure. Our organic decay rate for the twelve months ended June 30, 2023 was (3.1%). The organic growth/decay rate represents the ratio of net flows for the period to the beginning assets under management.
Open-end funds
Assets under management in open-end funds at June 30, 2023, which represented 45.0% of total assets under management, decreased 12.9% to $36.2 billion from $41.6 billion at June 30, 2022. The decrease was due to net outflows of
$2.5 billion, market depreciation of $989 million and distributions of $1.7 billion. Net outflows included $2.0 billion from preferred securities and $823 million from U.S. real estate, partially offset by net inflows of $324 million into real assets multi-strategy (included in "Other" in the Assets under Management - By Investment Strategy table). Market depreciation included $627 million from U.S. real estate and $224 million from preferred securities. Distributions included $960 million from U.S. real estate and $572 million from preferred securities. Of these distributions, $1.3 billion was reinvested and included in net flows. Our organic decay rate for open-end funds for the twelve months ended June 30, 2023 was (6.0%).
Institutional accounts
Assets under management in institutional accounts at June 30, 2023, which represented 41.4% of total assets under management, decreased 3.6% to $33.3 billion from $34.5 billion at June 30, 2022. The decrease was due to net outflows of $86 million, market depreciation of $314 million and distributions of $991 million. Net outflows included $374 million from preferred securities and $89 million from global/international real estate, partially offset by net inflows of $363 million into U.S. real estate. Market depreciation included $425 million from global/international real estate, partially offset by market appreciation of $45 million from U.S. real estate. Distributions included $958 million from U.S. real estate. Our organic decay rate for institutional accounts for the twelve months ended June 30, 2023 was (0.2%).
Assets under management in advisory accounts at June 30, 2023, which represented 56.6% of institutional assets under management, decreased 6.5% to $18.8 billion from $20.1 billion at June 30, 2022. The decrease was due to net outflows of $1.2 billion and market depreciation of $244 million. Net outflows included $774 million from U.S. real estate and $357 million from preferred securities. Market depreciation included $258 million from global/international real estate. Our organic decay rate for advisory accounts for the twelve months ended June 30, 2023 was (6.0%).
Assets under management in Japan subadvisory accounts at June 30, 2023, which represented 26.9% of institutional assets under management, increased 0.2% to $9.0 billion from $8.9 billion at June 30, 2022. The increase was primarily due to net inflows of $933 million and market appreciation of $79 million, partially offset by distributions of $991 million. Net inflows included $980 million into U.S. real estate. Market appreciation included $127 million from U.S. real estate, partially offset by market depreciation of $54 million from global/international real estate. Distributions included $958 million from U.S. real estate. Our organic growth rate for Japan subadvisory accounts for the twelve months ended June 30, 2023 was 10.6%.
Assets under management in subadvisory accounts excluding Japan at June 30, 2023, which represented 16.5% of institutional assets under management, increased 1.1% to $5.5 billion from $5.4 billion at June 30, 2022. The increase was primarily due to net inflows of $206 million, partially offset by market depreciation of $148 million. Net inflows included $157 million into U.S. real estate. Market depreciation included $114 million from global/international real estate. Our organic growth rate for subadvisory accounts excluding Japan for the twelve months ended June 30, 2023 was 3.6%.
Closed-end funds
Assets under management in closed-end funds at June 30, 2023, which represented 13.6% of total assets under management, decreased 7.2% to $10.9 billion from $11.8 billion at June 30, 2022. The decrease was due to net outflows of $53 million, market depreciation of $88 million and distributions of $704 million. Our organic decay rate for closed-end funds for the twelve months ended June 30, 2023 was (0.4%).
Summary of Operating Results | | | | | | | | | | | | | | | | | | | | | | | |
| (in thousands, except percentages and per share data) | Three Months Ended
June 30, | | Six Months Ended
June 30, |
| 2023 | | 2022 | | 2023 | | 2022 |
| U.S. GAAP | | | | | | | |
| Revenue | $ | 120,630 | | | $ | 147,431 | | | $ | 246,712 | | | $ | 301,620 | |
| Expenses | $ | 79,789 | | | $ | 86,437 | | | $ | 160,972 | | | $ | 189,635 | |
| Operating income | $ | 40,841 | | | $ | 60,994 | | | $ | 85,740 | | | $ | 111,985 | |
Non-operating income (loss) (1) | $ | 2,650 | | | $ | (25,002) | | | $ | 4,282 | | | $ | (19,892) | |
| Net income attributable to common stockholders | $ | 31,778 | | | $ | 51,956 | | | $ | 67,092 | | | $ | 93,974 | |
| Diluted earnings per share | $ | 0.64 | | | $ | 1.06 | | | $ | 1.36 | | | $ | 1.91 | |
| Operating margin | 33.9 | % | | 41.4 | % | | 34.8 | % | | 37.1 | % |
| | | | | | | |
As Adjusted (2) | | | | | | | |
| Net income attributable to common stockholders | $ | 34,742 | | | $ | 47,202 | | | $ | 72,336 | | | $ | 98,354 | |
| Diluted earnings per share | $ | 0.70 | | | $ | 0.96 | | | $ | 1.46 | | | $ | 2.00 | |
| Operating margin | 36.4 | % | | 43.3 | % | | 37.3 | % | | 44.0 | % |
_________________________
(1)Included amounts attributable to third-party interests in consolidated investment vehicles. Refer to non-operating income (loss) tables on pages 29-32 for additional detail.
(2)Refer to pages 33-35 for reconciliations of U.S. GAAP to as adjusted results.
Three Months Ended June 30, 2023 Compared with Three Months Ended June 30, 2022
Revenue | | | | | | | | | | | | | | | | | | | | | | | |
| (in thousands) | Three Months Ended
June 30, | | | | |
| 2023 | | 2022 | | $ Change | | % Change |
| Investment advisory and administration fees | | | | | | | |
Open-end funds | $ | 59,062 | | | $ | 75,785 | | | $ | (16,723) | | | (22.1 | %) |
Institutional accounts | 30,166 | | | 34,429 | | | $ | (4,263) | | | (12.4 | %) |
Closed-end funds | 23,890 | | | 27,441 | | | $ | (3,551) | | | (12.9 | %) |
| Total | 113,118 | | | 137,655 | | | $ | (24,537) | | | (17.8 | %) |
| Distribution and service fees | 6,977 | | | 9,005 | | | $ | (2,028) | | | (22.5 | %) |
| Other | 535 | | | 771 | | | $ | (236) | | | (30.6 | %) |
| Total revenue | $ | 120,630 | | | $ | 147,431 | | | $ | (26,801) | | | (18.2 | %) |
Investment advisory and administration fees decreased from the three months ended June 30, 2022, primarily due to lower average assets under management across all three types of investment vehicles.
•Total investment advisory and administration revenue from open-end funds compared with average assets under management implied an annualized effective fee rate of 66.0 bps and 67.3 bps for the three months ended June 30, 2023 and 2022, respectively. The decrease in the implied annualized effective fee rate was primarily due to a shift in the composition of assets under management.
•Total investment advisory revenue from institutional accounts compared with average assets under management implied an annualized effective fee rate of 37.0 bps and 36.8 bps for the three months ended June 30, 2023 and 2022, respectively.
•Total investment advisory and administration revenue from closed-end funds compared with average assets under management implied an annualized effective fee rate of 88.6 bps for both the three months ended June 30, 2023 and 2022.
Distribution and service fees decreased from the three months ended June 30, 2022, primarily due to lower average assets under management in U.S. open-end funds.
Expenses | | | | | | | | | | | | | | | | | | | | | | | |
| (in thousands) | Three Months Ended
June 30, | | | | |
| 2023 | | 2022 | | $ Change | | % Change |
| Employee compensation and benefits | $ | 48,893 | | | $ | 53,857 | | | $ | (4,964) | | | (9.2 | %) |
| Distribution and service fees | 13,329 | | | 18,236 | | | $ | (4,907) | | | (26.9 | %) |
| General and administrative | 16,728 | | | 13,238 | | | $ | 3,490 | | | 26.4 | % |
| Depreciation and amortization | 839 | | | 1,106 | | | $ | (267) | | | (24.1 | %) |
| Total expenses | $ | 79,789 | | | $ | 86,437 | | | $ | (6,648) | | | (7.7 | %) |
Employee compensation and benefits decreased from the three months ended June 30, 2022, primarily due to lower incentive compensation of $6.0 million and a decrease in amortization of restricted stock units of $1.3 million, partially offset by higher salaries of $1.8 million and an increase in severance expense of $603,000.
Distribution and service fees decreased from the three months ended June 30, 2022, primarily due to lower average assets under management in U.S. open-end funds.
General and administrative expenses increased from the three months ended June 30, 2022, primarily due to incremental lease costs of $2.8 million related to the Company's future headquarters at 1166 Avenue of the Americas.
Operating Margin
Operating margin for the three months ended June 30, 2023 decreased to 33.9% from 41.4% for the three months ended June 30, 2022. Operating margin represents the ratio of operating income to revenue.
Non-operating Income (Loss)
| | | | | | | | | | | | | | | | | | | | | | | |
| (in thousands) | Three Months Ended |
| June 30, 2023 |
| Consolidated
Investment Vehicles | | Corporate
Seed Investments | | Corporate Other | | Total |
| Interest and dividend income—net | $ | 1,050 | | | $ | 939 | | | $ | 1,439 | | | $ | 3,428 | |
Gain (loss) from investments—net | 13 | | | 25 | | | 318 | | (1) | 356 | |
| Foreign currency gain (loss)—net | (88) | | | 1 | | | (1,047) | | (2) | (1,134) | |
| Total non-operating income (loss) | 975 | | | 965 | | | 710 | | | 2,650 | |
| Net (income) loss attributable to noncontrolling interests | (727) | | | — | | | — | | | (727) | |
| Non-operating income (loss) attributable to the Company | $ | 248 | | | $ | 965 | | | $ | 710 | | | $ | 1,923 | |
_________________________
(1)Comprised primarily of gain (loss) on derivative contracts, which are utilized to economically hedge a portion of the market risk of the Company's seed investments included in both Consolidated Investment Vehicles and Corporate Seed Investments.
(2)Comprised primarily of net foreign currency exchange gain (loss) associated with U.S. dollar-denominated assets held by certain foreign subsidiaries.
| | | | | | | | | | | | | | | | | | | | | | | |
| (in thousands) | Three Months Ended |
| June 30, 2022 |
| Consolidated
Investment Vehicles | | Corporate
Seed Investments | | Corporate Other | | Total |
| Interest and dividend income—net | $ | 1,499 | | | $ | 292 | | | $ | 97 | | | $ | 1,888 | |
Gain (loss) from investments—net | (29,558) | | | (2,461) | | | 3,446 | | (1) | (28,573) | |
| Foreign currency gain (loss)—net | (623) | | | (5) | | | 2,311 | | (2) | 1,683 | |
| Total non-operating income (loss) | (28,682) | | | (2,174) | | | 5,854 | | | (25,002) | |
| Net (income) loss attributable to noncontrolling interests | 25,807 | | | — | | | — | | | 25,807 | |
| Non-operating income (loss) attributable to the Company | $ | (2,875) | | | $ | (2,174) | | | $ | 5,854 | | | $ | 805 | |
_________________________
(1)Comprised primarily of gain (loss) on derivative contracts, which are utilized to economically hedge a portion of the market risk of the Company's seed investments included in both Consolidated Investment Vehicles and Corporate Seed Investments.
(2)Comprised primarily of net foreign currency exchange gain (loss) associated with U.S. dollar-denominated assets held by certain foreign subsidiaries.
Income Taxes
A reconciliation of the Company’s statutory federal income tax rate and the effective income tax rate is summarized in the following table:
| | | | | | | | | | | |
| Three Months Ended
June 30, |
| 2023 | | 2022 |
| U.S. statutory tax rate | 21.0 | % | | 21.0 | % |
| State and local income taxes, net of federal benefit | 3.1 | | | 3.1 | |
| Non-deductible executive compensation | 1.4 | | | 1.6 | |
| Excess tax benefits related to the vesting and delivery of restricted stock units | — | | | 0.2 | |
| Unrecognized tax benefit adjustments | — | | | (10.1) | |
| Other | 0.2 | | | 0.1 | |
| Effective income tax rate | 25.7 | % | | 15.9 | % |
Six Months Ended June 30, 2023 Compared with Six Months Ended June 30, 2022
Revenue | | | | | | | | | | | | | | | | | | | | | | | |
| (in thousands) | Six Months Ended
June 30, | | | | |
| 2023 | | 2022 | | $ Change | | % Change |
| Investment advisory and administration fees | | | | | | | |
Open-end funds | $ | 121,582 | | | $ | 155,450 | | | $ | (33,868) | | | (21.8) | % |
Institutional accounts | 60,795 | | | 71,112 | | | $ | (10,317) | | | (14.5) | % |
Closed-end funds | 48,775 | | | 54,762 | | | $ | (5,987) | | | (10.9) | % |
| Total | 231,152 | | | 281,324 | | | $ | (50,172) | | | (17.8) | % |
| Distribution and service fees | 14,539 | | | 18,874 | | | $ | (4,335) | | | (23.0) | % |
| Other | 1,021 | | | 1,422 | | | $ | (401) | | | (28.2) | % |
| Total revenue | $ | 246,712 | | | $ | 301,620 | | | $ | (54,908) | | | (18.2) | % |
Investment advisory and administration fees decreased from the six months ended June 30, 2022, primarily due to lower average assets under management across all three types of investment vehicles.
•Total investment advisory and administration revenue from open-end funds compared with average assets under management implied an annualized effective fee rate of 65.9 bps and 67.3 bps for the six months ended June 30, 2023 and 2022, respectively. The decrease in the implied annualized effective fee rate was primarily due to a shift in the composition of assets under management.
•Total investment advisory revenue from institutional accounts compared with average assets under management implied an annualized effective fee rate of 37.1 bps and 36.7 bps for the six months ended June 30, 2023 and 2022, respectively.
•Total investment advisory and administration revenue from closed-end funds compared with average assets under management implied an annualized effective fee rate of 88.8 bps and 88.4 bps for the six months ended June 30, 2023 and 2022, respectively.
Distribution and service fees decreased from the six months ended June 30, 2022, primarily due to lower average assets under management in U.S. open-end funds.
Expenses | | | | | | | | | | | | | | | | | | | | | | | |
| (in thousands) | Six Months Ended
June 30, | | | | |
| 2023 | | 2022 | | $ Change | | % Change |
| Employee compensation and benefits | $ | 97,750 | | | $ | 108,600 | | | $ | (10,850) | | | (10.0) | % |
| Distribution and service fees | 27,545 | | | 52,187 | | | $ | (24,642) | | | (47.2) | % |
| General and administrative | 33,850 | | | 26,748 | | | $ | 7,102 | | | 26.6 | % |
| Depreciation and amortization | 1,827 | | | 2,100 | | | $ | (273) | | | (13.0) | % |
| Total expenses | $ | 160,972 | | | $ | 189,635 | | | $ | (28,663) | | | (15.1) | % |
Employee compensation and benefits decreased from the six months ended June 30, 2022, primarily due to lower incentive compensation of $13.3 million and a decrease in amortization of restricted stock units of $2.4 million, partially offset by higher salaries of $3.9 million and an increase in benefits of $1.4 million.
Distribution and service fees decreased from the six months ended June 30, 2022, primarily due to lower average assets under management in U.S. open-end funds and costs of $14.2 million associated with the initial public offering of the Cohen & Steers Real Estate Opportunities and Income Fund (RLTY) included in the six months ended June 30, 2022.
General and administrative expenses increased from the six months ended June 30, 2022, primarily due to incremental lease costs of $6.0 million related to the Company's future headquarters at 1166 Avenue of the Americas.
Operating Margin
Operating margin for the six months ended June 30, 2023 decreased to 34.8% from 37.1% for the six months ended June 30, 2022.
Non-operating Income (Loss)
| | | | | | | | | | | | | | | | | | | | | | | |
| (in thousands) | Six Months Ended |
| June 30, 2023 |
| Consolidated
Investment Vehicles | | Corporate
Seed Investments | | Corporate Other | | Total |
| Interest and dividend income—net | $ | 1,934 | | | $ | 1,782 | | | $ | 2,928 | | | $ | 6,644 | |
Gain (loss) from investments—net | 6 | | | 70 | | | (28) | | (1) | 48 | |
| Foreign currency gain (loss)—net | (47) | | | 25 | | | (2,388) | | (2) | (2,410) | |
| Total non-operating income (loss) | 1,893 | | | 1,877 | | | 512 | | | 4,282 | |
| Net (income) loss attributable to noncontrolling interests | (1,711) | | | — | | | — | | | (1,711) | |
| Non-operating income (loss) attributable to the Company | $ | 182 | | | $ | 1,877 | | | $ | 512 | | | $ | 2,571 | |
_________________________
(1)Comprised primarily of gain (loss) on derivative contracts, which are utilized to economically hedge a portion of the market risk of the Company's seed investments included in both Consolidated Investment Vehicles and Corporate Seed Investments.
(2)Comprised primarily of net foreign currency exchange gain (loss) associated with U.S. dollar-denominated assets held by certain foreign subsidiaries.
| | | | | | | | | | | | | | | | | | | | | | | |
| (in thousands) | Six Months Ended |
| June 30, 2022 |
| Consolidated
Investment Vehicles | | Corporate
Seed Investments | | Corporate Other | | Total |
| Interest and dividend income—net | $ | 2,233 | | | $ | 459 | | | $ | 93 | | | $ | 2,785 | |
Gain (loss) from investments—net | (26,045) | | | (1,709) | | | 2,748 | | (1) | (25,006) | |
| Foreign currency gain (loss)—net | (917) | | | (6) | | | 3,252 | | (2) | 2,329 | |
| Total non-operating income (loss) | (24,729) | | | (1,256) | | | 6,093 | | | (19,892) | |
| Net (income) loss attributable to noncontrolling interests | 20,984 | | | — | | | — | | | 20,984 | |
| Non-operating income (loss) attributable to the Company | $ | (3,745) | | | $ | (1,256) | | | $ | 6,093 | | | $ | 1,092 | |
_________________________
(1)Comprised primarily of gain (loss) on derivative contracts, which are utilized to economically hedge a portion of the market risk of the Company's seed investments included in both Consolidated Investment Vehicles and Corporate Seed Investments.
(2)Comprised primarily of net foreign currency exchange gain (loss) associated with U.S. dollar-denominated assets held by certain foreign subsidiaries.
Income Taxes
A reconciliation of the Company’s statutory federal income tax rate and the effective income tax rate is summarized in the following table:
| | | | | | | | | | | |
| Six Months Ended
June 30, |
| 2023 | | 2022 |
| U.S. statutory tax rate | 21.0 | % | | 21.0 | % |
| State and local income taxes, net of federal benefit | 3.1 | | | 3.1 | |
| Non-deductible executive compensation | 2.2 | | | 3.3 | |
| Excess tax benefits related to the vesting and delivery of restricted stock units | (2.4) | | | (5.1) | |
| Unrecognized tax benefit adjustments | 0.1 | | | (5.5) | |
| Other | — | | | 0.1 | |
| Effective income tax rate | 24.0 | % | | 16.9 | % |
Reconciliations of U.S. GAAP to As Adjusted Financial Results
Management believes that use of the following as adjusted (non-GAAP) financial results provides greater transparency into the Company’s operating performance. In addition, these as adjusted financial results are used to prepare the Company's internal management reports which are used in evaluating its business.
While management believes that these as adjusted financial results are useful in evaluating operating performance, this information should be considered as supplemental in nature and not as a substitute for the related financial information prepared in accordance with U.S. GAAP.
Effective January 1, 2023, the Company revised its methodology for as adjusted results to include interest and dividends from seed investments. Prior period amounts have not been recast to conform with the current period results as the impact was not significant.
Reconciliation of U.S. GAAP to As Adjusted Financial Results
Net Income Attributable to Common Stockholders and Diluted Earnings per Share | | | | | | | | | | | | | | | | | | | | | | | |
| Three Months Ended
June 30, | | Six Months Ended
June 30, |
| (in thousands, except per share data) | 2023 | | 2022 | | 2023 | | 2022 |
| Net income attributable to common stockholders, U.S. GAAP | $ | 31,778 | | | $ | 51,956 | | | $ | 67,092 | | | $ | 93,974 | |
Seed investments—net (1) | 35 | | | 2,170 | | | 1,003 | | | 3,221 | |
Accelerated vesting of restricted stock units | 108 | | | 2,490 | | | 353 | | | 4,795 | |
Lease transition and other costs - 280 Park Avenue (2) | 2,498 | | | — | | | 4,941 | | | — | |
Initial public offering costs (3) | — | | | — | | | — | | | 15,239 | |
| | | | | | | |
Foreign currency exchange (gains) losses—net (4) | 1,073 | | | (3,542) | | | 2,163 | | | (4,754) | |
Tax adjustments—net (5) | (750) | | | (5,872) | | | (3,216) | | | (14,121) | |
| Net income attributable to common stockholders, as adjusted | $ | 34,742 | | | $ | 47,202 | | | $ | 72,336 | | | $ | 98,354 | |
| | | | | | | |
| Diluted weighted average shares outstanding | 49,463 | | | 49,208 | | | 49,433 | | | 49,272 | |
| Diluted earnings per share, U.S. GAAP | $ | 0.64 | | | $ | 1.06 | | | $ | 1.36 | | | $ | 1.91 | |
Seed investments—net | — | | * | 0.04 | | | 0.02 | | | 0.07 | |
Accelerated vesting of restricted stock units | — | | * | 0.05 | | | 0.01 | | | 0.10 | |
| Lease transition and other costs - 280 Park Avenue | 0.05 | | | — | | | 0.10 | | | — | |
| Initial public offering costs | — | | | — | | | — | | | 0.31 | |
| | | | | | | |
| Foreign currency exchange (gains) losses—net | 0.02 | | | (0.07) | | | 0.04 | | | (0.10) | |
Tax adjustments—net | (0.01) | | | (0.12) | | | (0.07) | | | (0.29) | |
| Diluted earnings per share, as adjusted | $ | 0.70 | | | $ | 0.96 | | | $ | 1.46 | | | $ | 2.00 | |
_________________________
* Amounts round to less than $0.01 per share.
(1)Represents adjustment to remove the impact of consolidated investment vehicles and other seed investments from the Company's financial results. In accordance with the Company’s revised methodology, interest and dividends from seed investments were not included in the adjustment for the three and six months ended June 30, 2023.
(2)Represents lease and other expenses related to the Company's current headquarters at 280 Park Avenue, which it expects to vacate in the fourth quarter of 2023. In connection with the transition to its future headquarters, the Company will recognize additional GAAP expense as a result of the overlapping terms for both its current and future headquarters until its current headquarters lease expires in January 2024.
(3)Represents costs associated with the initial public offering of RLTY. Costs are summarized in the following table:
| | | | | | | | | | | | | | | | | | | | | | | |
| Three Months Ended
June 30, | | Six Months Ended
June 30, |
| (in thousands) | 2023 | | 2022 | | 2023 | | 2022 |
Employee compensation and benefits | $ | — | | | $ | — | | | $ | — | | | $ | 357 | |
Distribution and service fees | — | | | — | | | — | | | 14,224 | |
General and administrative | — | | | — | | | — | | | 658 | |
Initial public offering costs | $ | — | | | $ | — | | | $ | — | | | $ | 15,239 | |
(4)Represents net foreign currency exchange (gains) losses associated with U.S. dollar-denominated assets held by certain foreign subsidiaries.
(5)Tax adjustments are summarized in the following table: | | | | | | | | | | | | | | | | | | | | | | | |
| Three Months Ended
June 30, | | Six Months Ended
June 30, |
| (in thousands) | 2023 | | 2022 | | 2023 | | 2022 |
Exclusion of tax effects associated with items noted above | $ | (747) | | | $ | 15 | | | $ | (2,032) | | | $ | (4,266) | |
Exclusion of discrete tax items | (3) | | | (5,887) | | | (1,184) | | | (9,855) | |
Total tax adjustments | $ | (750) | | | $ | (5,872) | | | $ | (3,216) | | | $ | (14,121) | |
Reconciliation of U.S. GAAP to As Adjusted Financial Results
Revenue, Expenses, Operating Income and Operating Margin | | | | | | | | | | | | | | | | | | | | | | | |
| Three Months Ended
June 30, | | Six Months Ended
June 30, |
| (in thousands, except percentages) | 2023 | | 2022 | | 2023 | | 2022 |
| Revenue, U.S. GAAP | $ | 120,630 | | | $ | 147,431 | | $ | 246,712 | | $ | 301,620 |
Seed investments (1) | (321) | | | 292 | | (138) | | 415 |
| Revenue, as adjusted | $ | 120,309 | | | $ | 147,723 | | $ | 246,574 | | $ | 302,035 |
| | | | | | | |
| Expenses, U.S. GAAP | $ | 79,789 | | | $ | 86,437 | | $ | 160,972 | | $ | 189,635 |
Seed investments (1) | (694) | | | (218) | | (961) | | (494) |
Accelerated vesting of restricted stock units | (108) | | | (2,490) | | (353) | | (4,795) |
Lease transition and other costs - 280 Park Avenue (2) | (2,498) | | | — | | (4,941) | | — |
Initial public offering costs (3) | — | | | — | | — | | (15,239) |
| | | | | | | |
| Expenses, as adjusted | $ | 76,489 | | | $ | 83,729 | | $ | 154,717 | | $ | 169,107 |
| | | | | | | |
| Operating income, U.S. GAAP | $ | 40,841 | | | $ | 60,994 | | $ | 85,740 | | $ | 111,985 |
Seed investments (1) | 373 | | | 510 | | 823 | | 909 |
Accelerated vesting of restricted stock units | 108 | | | 2,490 | | 353 | | 4,795 |
Lease transition and other costs - 280 Park Avenue (2) | 2,498 | | | — | | 4,941 | | — |
Initial public offering costs (3) | — | | | — | | — | | 15,239 |
| Operating income, as adjusted | $ | 43,820 | | | $ | 63,994 | | $ | 91,857 | | $ | 132,928 |
| | | | | | | |
| Operating margin, U.S. GAAP | 33.9 | % | | 41.4 | % | | 34.8 | % | | 37.1 | % |
| Operating margin, as adjusted | 36.4 | % | | 43.3 | % | | 37.3 | % | | 44.0 | % |
_________________________
(1)Represents adjustment to remove the impact of consolidated investment vehicles from the company's financial results.
(2)Represents lease and other expenses related to the Company's current headquarters at 280 Park Avenue, which it expects to vacate in the fourth quarter of 2023. In connection with the transition to its future headquarters, the Company will recognize additional GAAP expense as a result of the overlapping terms for both its current and future headquarters until its current headquarters lease expires in January 2024.
(3)Represents costs associated with the initial public offering of RLTY. Costs are summarized in the following table: | | | | | | | | | | | | | | | | | | | | | | | |
| Three Months Ended
June 30, | | Six Months Ended
June 30, |
| (in thousands) | 2023 | | 2022 | | 2023 | | 2022 |
Employee compensation and benefits | $ | — | | | $ | — | | | $ | — | | | $ | 357 | |
Distribution and service fees | — | | | — | | | — | | | 14,224 | |
General and administrative | — | | | — | | | — | | | 658 | |
Initial public offering costs | $ | — | | | $ | — | | | $ | — | | | $ | 15,239 | |
Reconciliation of U.S. GAAP to As Adjusted Financial Results
Non-operating Income (Loss) | | | | | | | | | | | | | | | | | | | | | | | |
| Three Months Ended
June 30, | | Six Months Ended
June 30, |
| (in thousands) | 2023 | | 2022 | | 2023 | | 2022 |
| Non-operating income (loss), U.S. GAAP | $ | 2,650 | | | $ | (25,002) | | | $ | 4,282 | | | $ | (19,892) | |
Seed investments—net (1) | (1,065) | | | 27,467 | | | (1,531) | | | 23,296 | |
Foreign currency exchange (gains) losses—net (2) | 1,073 | | | (3,542) | | | 2,163 | | | (4,754) | |
| Non-operating income (loss), as adjusted | $ | 2,658 | | | $ | (1,077) | | | $ | 4,914 | | | $ | (1,350) | |
_________________________
(1) Represents adjustment to remove the impact of consolidated investment vehicles and other seed investments from the Company's financial results. In accordance with the Company’s revised methodology, interest and dividends from seed investments were not included in the adjustment for the three and six months ended June 30, 2023.
(2) Represents net foreign currency exchange (gains) losses associated with U.S. dollar-denominated assets held by certain foreign subsidiaries.
Changes in Financial Condition, Liquidity and Capital Resources
We seek to maintain a balance sheet that supports our business strategies and provides the appropriate amount of liquidity at all times.
Net Liquid Assets
Our current financial condition is highly liquid and is primarily comprised of cash and cash equivalents, liquid seed investments and other current assets. Liquid assets are reduced by current liabilities (together, net liquid assets).
The table below summarizes net liquid assets: | | | | | | | | | | | |
| (in thousands) | June 30,
2023 | | December 31,
2022 |
| Cash and cash equivalents | $ | 178,471 | | | $ | 247,418 | |
| U.S. Treasury securities | 9,927 | | | — | |
| Liquid seed investments—net | 70,083 | | | 67,987 | |
| Other current assets | 93,801 | | | 70,716 | |
| Current liabilities | (72,849) | | | (114,522) | |
| Net liquid assets | $ | 279,433 | | | $ | 271,599 | |
Cash and cash equivalents
Cash and cash equivalents are on deposit with several major national financial institutions and include short-term, highly liquid investments, which are readily convertible into cash and have original maturities of three months or less.
U.S. Treasury securities
U.S. Treasury securities are directly issued by the U.S. government and were classified as trading investments.
Liquid seed investments—net
Liquid seed investments are generally traded in active markets on major exchanges and can typically be liquidated within a normal settlement cycle. Liquid seed investments include corporate securities held directly for the purpose of establishing performance track records and the Company's economic interest in consolidated investment vehicles which are presented net of noncontrolling interests.
Other current assets
Other current assets primarily represent investment advisory and administration fees receivable. At June 30, 2023, receivables from institutional accounts comprised 32.9% of other current assets, while receivables from open-end and closed-end funds, together, comprised 33.9% of other current assets. In addition, other currents assets included a receivable from the landlord related to the build-out of our future headquarters which was netted against the operating lease liabilities on the condensed consolidated statements of financial condition. We perform a review of our receivables on an ongoing basis in order to assess collectability and, based on our analysis at June 30, 2023, there was no allowance for uncollectible accounts required.
Current liabilities
Current liabilities included accrued compensation and benefits, distribution and service fees payable, operating lease obligations due within 12 months, certain income taxes payable and other liabilities and accrued expenses.
Future liquidity needs
Our business has become more capital intensive. Potential uses of capital range from funding the upfront costs associated with closed-end fund launches and rights offerings, seeding new strategies and vehicles, co-investing in private real estate vehicles, and making various one-time investments to grow our firm infrastructure as our business scales. In order to provide us with the financial flexibility to pursue these opportunities, on January 20, 2023, we entered into a Credit Agreement providing for a $100.0 million senior unsecured revolving credit facility maturing on January 20, 2026. Borrowings under the Credit Agreement will be used for working capital and other general corporate purposes. To date, we have not drawn on the Credit Agreement.
In connection with the build-out of our future headquarters located at 1166 Avenue of the Americas, we expect to incur costs of approximately $35 million to $45 million, net of lease incentives, by the end of fiscal year 2023. During the first half of 2023, all of the costs incurred in connection with the build-out qualified for reimbursement from the landlord. The lease for our current headquarters, also in New York City, is scheduled to expire in January 2024.
We have committed to invest up to $50.0 million in Cohen & Steers Real Estate Opportunities Fund, L.P. (REOF) of which $28.8 million remains unfunded. In addition, we have committed to invest up to $125.0 million in Cohen & Steers Income Opportunities REIT, Inc. (CNSREIT) of which $124.8 million remains unfunded. The timing for funding the remaining portion of our commitments is determined by the investment vehicles.
Cash flows
Our cash flows generally result from the operating activities of our business, with investment advisory and administration fees being the most significant contributor.
The table below summarizes our cash flows: | | | | | | | | | | | |
| Six Months Ended
June 30, |
| (in thousands) | 2023 | | 2022 |
| Cash Flow Data: | | | |
| Net cash provided by (used in) operating activities | $ | 38,715 | | | $ | (48,770) | |
| Net cash provided by (used in) investing activities | (31,222) | | | (43,601) | |
| Net cash provided by (used in) financing activities | (77,100) | | | 39,093 | |
| Net increase (decrease) in cash and cash equivalents | (69,607) | | | (53,278) | |
| Effect of foreign exchange rate changes on cash and cash equivalents | 2,044 | | | (4,526) | |
| Cash and cash equivalents, beginning of the period | 248,714 | | | 184,373 | |
| Cash and cash equivalents, end of the period | $ | 181,151 | | | $ | 126,569 | |
Cash and cash equivalents decreased by $69.6 million, excluding the effect of foreign exchange rate changes, for the six months ended June 30, 2023. Cash flows from operating activities primarily consisted of net income adjusted for certain non-cash items and changes in assets and liabilities. Net cash provided by operating activities was $38.7 million for the six months ended June 30, 2023. Net cash used in investing activities was $31.2 million, which included purchases of property and equipment of $20.1 million, primarily related to the build-out of our future headquarters and net purchases of U.S. Treasury securities held for corporate purposes of $11.5 million. Net cash used in financing activities was $77.1 million, including dividends paid to stockholders of $56.2 million and repurchases of common stock to satisfy employee withholding tax obligations on the vesting and delivery of restricted stock units of $20.6 million.
Cash and cash equivalents decreased by $53.3 million, excluding the effect of foreign exchange rate changes, for the six months ended June 30, 2022. Cash flows from operating activities primarily consisted of net income adjusted for certain non-cash items and changes in assets and liabilities. Net cash used in operating activities was $48.8 million for the six months ended June 30, 2022, which included net investment purchases of $142.8 million resulting from the consolidation of certain investment vehicles. Net cash used in investing activities was $43.6 million, which included net purchases of U.S. Treasury securities held for corporate purposes and securities held directly for the purpose of establishing performance track records of $42.5 million. Net cash provided by financing activities was $39.1 million, including net contributions from noncontrolling interests of $117.8 million, partially offset by dividends paid to stockholders of $53.7 million and repurchases of common stock to satisfy employee withholding tax obligations on the vesting and delivery of restricted stock units of $25.8 million.
Contractual Obligations, Commitments and Contingencies
The following table summarizes our contractual obligations at June 30, 2023: | | | | | | | | | | | | | | | | | | | | | | | | | | | | | | | | | | | | | | | | | |
| (in thousands) | Remainder of 2023 | | 2024 | | 2025 | | 2026 | | 2027 | | Thereafter | | Total |
| Operating leases | $ | 5,903 | | | $ | 11,499 | | | $ | 13,379 | | | $ | 13,038 | | | $ | 13,038 | | | $ | 161,161 | | | $ | 218,018 | |
Purchase obligations (1) | 3,642 | | | 5,923 | | | 4,421 | | | 2,597 | | | 316 | | | — | | | 16,899 | |
Other liability (2) | — | | | 1,662 | | | 2,077 | | | — | | | — | | | — | | | 3,739 | |
| Total | $ | 9,545 | | | $ | 19,084 | | | $ | 19,877 | | | $ | 15,635 | | | $ | 13,354 | | | $ | 161,161 | | | $ | 238,656 | |
_________________________
(1)Represents contracts that are either noncancellable or cancellable with a penalty. Our obligations primarily reflect information technology equipment, software licenses and standard service contracts for market data.
(2)Consists of the transition tax liability based on the cumulative undistributed earnings and profits of our foreign subsidiaries in connection with the enactment of the Tax Cuts and Jobs Act in 2017.
Dividends
Subject to the approval of our Board of Directors, we anticipate paying dividends. When determining whether to pay a dividend, we take into account general economic and business conditions, our strategic plans, our results of operations and financial condition, contractual, legal and regulatory restrictions on the payment of dividends, if any, by us and our subsidiaries and such other factors deemed relevant.
On August 3, 2023, we declared a quarterly dividend on our common stock in the amount of $0.57 per share. This dividend will be payable on August 24, 2023 to stockholders of record at the close of business on August 14, 2023.
Critical Accounting Estimates
A complete discussion of our critical accounting estimates is included in Management's Discussion and Analysis of Financial Condition and Results of Operations in our Annual Report on Form 10-K for the year ended December 31, 2022. There were no changes to the Company’s accounting estimates for the three months ended June 30, 2023.
Recently Issued Accounting Pronouncements
See discussion of Recently Issued Accounting Pronouncements in Note 2 of the condensed consolidated financial statements.
Item 3. Quantitative and Qualitative Disclosures About Market Risk
In the normal course of our business, we are exposed to risk as a result of changes in interest and currency rates,
securities markets and other general economic conditions which may have an adverse impact on the value of our assets under management and our seed investments. The majority of our revenue is derived from investment advisory and administration fees which are based on average assets under management. Accordingly, where there are changes in the value of the assets we manage as a result of market fluctuations, our revenue and the value of our seed investments may change.
The economic environment may also preclude us from increasing the assets we manage in closed-end funds. The
market conditions for these offerings may not be as favorable in the future, which could adversely impact our ability to grow
the assets we manage. Depending on market conditions, the closed-end funds we manage may increase or decrease their leverage in order to maintain the funds’ target leverage ratios, thereby increasing or decreasing the assets we manage.
Corporate Seed investments—net
Our seed investments are comprised of both liquid and illiquid holdings. Liquid seed investments are generally traded in active markets on major exchanges and can typically be liquidated within a normal settlement cycle. Illiquid seed investments are generally comprised of limited partnership interests in private real estate vehicles for which there may be contractual restrictions on redemption.
Our seed investments are subject to market risk. We may mitigate this risk by entering into derivative contracts designed to hedge certain portions of our risk. The following table summarizes the effect of a ten percent increase or decrease on the carrying value of our seed investments, which are presented net of noncontrolling interests, if any, as of June 30, 2023 (in thousands):
| | | | | | | | | | | | | | | | | | | | | | | | | | | | | | | | |
| | Carrying Value | | Notional Value - Hedges | | Net Carrying Value | | Net Carrying Value Assuming a 10% increase | | Net Carrying Value Assuming a 10% decrease |
| Liquid seed investments—net | | $ | 70,083 | | | $ | (40,996) | | | $ | 29,087 | | | $ | 31,996 | | | $ | 26,178 | |
| Illiquid seed investments—net | | $ | 17,739 | | | $ | — | | | $ | 17,739 | | | $ | 19,513 | | | $ | 15,965 | |
Item 4. Controls and Procedures
Internal Control over Financial Reporting
There has been no change in our internal control over financial reporting that occurred during the three months ended June 30, 2023 that has materially affected, or is reasonably likely to materially affect, our internal control over financial reporting.
Disclosure Controls and Procedures
Under the direction of our Chief Executive Officer and Chief Financial Officer, we have evaluated the effectiveness of our disclosure controls and procedures (as such term is defined in Rules 13a-15(e) and 15d-15(e) under the Securities Exchange Act of 1934, as amended (the Exchange Act)) as of the end of the period covered by this quarterly report on Form 10-Q. Based on this evaluation, our Chief Executive Officer and Chief Financial Officer have concluded that our disclosure controls and procedures were effective.
PART II—Other Information
Item 1. Legal Proceedings
For information regarding our legal proceedings, see Note 11, Commitments and Contingencies, in the Notes to Condensed Consolidated Financial Statements contained in Part I, Item 1 of this report.
Item 1A. Risk Factors
For a discussion of the potential risks and uncertainties associated with our business, please see Part I, Item 1A of our Annual Report on Form 10-K for the year ended December 31, 2022 (the Form 10-K). There have been no material changes to the risk factors disclosed in Part 1, Item 1A of the Form 10-K.
Item 2. Unregistered Sales of Equity Securities, Use of Proceeds and Issuer Purchases of Equity Securities
During the three months ended June 30, 2023, we made the following purchases of our equity securities that are registered pursuant to Section 12(b) of the Securities Exchange Act of 1934.
| | | | | | | | | | | | | | | | | |
| Period | Total Number of Shares Purchased (1) | | Average Price
Paid Per Share | Total Number of
Shares Purchased
as Part of Publicly
Announced Plans
or Programs | Maximum Number
of Shares that May
Yet Be Purchased
Under the Plans or
Programs |
| April 1 through April 30, 2023 | 229 | | | $ | 61.51 | | — | | — | |
| May 1 through May 31, 2023 | 1,699 | | | $ | 54.32 | | — | | — | |
| June 1 through June 30, 2023 | 1,390 | | | $ | 58.32 | | — | | — | |
| Total | 3,318 | | | $ | 56.49 | | — | | — | |
_________________________
(1)Purchases made to satisfy the income tax withholding obligations of certain employees upon the vesting and delivery of restricted stock units issued under the Company's Amended and Restated Stock Incentive Plan.
Item 5. Other Information
During the three months ended June 30, 2023, none of our directors or officers (as defined in Rule 16a-1(f) of the Securities Exchange Act of 1934, as amended) adopted, terminated, or modified a Rule 10b5-1 trading arrangement or non-Rule 10b5-1 trading arrangement (as such terms are defined in Item 408 of Regulation S-K of the Securities Act of 1933, as amended).
Item 6. Exhibits
Any agreements or other documents filed as exhibits to this report are not intended to provide factual information or other disclosure other than with respect to the terms of the agreements or other documents themselves, and should not be relied upon for that purpose. In particular, any representations and warranties made by the Company in these agreements or other documents were made solely within the specific context of the relevant agreement or document and may not describe the actual state of affairs at the date they were made or at any other time.
| | | | | | | | |
| Exhibit No. | | Description |
| | |
| 3.1 | | — | |
| | |
| 3.2 | | — | |
| | |
| 4.1 | | — | |
| | |
| 4.2 | | — | |
| | |
| 31.1 | | — | Certification of the Chief Executive Officer pursuant to Section 302 of the Sarbanes-Oxley Act of 2002 (filed herewith) |
| | |
| 31.2 | | — | Certification of the Chief Financial Officer pursuant to Section 302 of the Sarbanes-Oxley Act of 2002 (filed herewith) |
| | |
| 32.1 | | — | Certification of the Chief Executive Officer pursuant to Section 906 of the Sarbanes-Oxley Act of 2002 (furnished herewith) |
| | |
| 32.2 | | — | Certification of the Chief Financial Officer pursuant to Section 906 of the Sarbanes-Oxley Act of 2002 (furnished herewith) |
| | |
| 101 | | — | The following financial statements from the Company's Quarterly Report on Form 10-Q for the quarter ended June 30, 2023 formatted in inline XBRL (eXtensible Business Reporting Language): (i) the Condensed Consolidated Statements of Financial Condition (unaudited), (ii) the Condensed Consolidated Statements of Operations (unaudited), (iii) the Condensed Consolidated Statements of Comprehensive Income (unaudited), (iv) the Condensed Consolidated Statements of Changes in Stockholders' Equity (unaudited), (v) the Condensed Consolidated Statements of Cash Flows (unaudited), and (vi) the Notes to the Condensed Consolidated Financial Statements (unaudited). |
| | |
| 104 | | — | Cover Page Interactive Data File (formatted as inline XBRL and contained in Exhibit 101). |
_________________________
(1)Incorporated by reference to the Company's Registration Statement on Form S-1, as amended, originally filed with the Securities and Exchange Commission on March 30, 2004.
(2)Incorporated by reference to the Company’s Quarterly Report on Form 10-Q for the quarter ended September 30, 2022.
(3)Incorporated by reference to the Company's Quarterly Report on Form 10-Q for the quarter ended June 30, 2015.
SIGNATURES
Pursuant to the requirements of the Securities Exchange Act of 1934, the Company has duly caused this report to be signed on its behalf by the undersigned thereunto duly authorized.
| | | | | | | | | | | | | | |
| Date: | August 4, 2023 | | | Cohen & Steers, Inc. |
| | | | |
| | | | /s/ Matthew S. Stadler |
| | | | Name: Matthew S. Stadler |
| | | | Title: Executive Vice President & Chief Financial Officer |
| | | | | | | | | | | | | | |
| Date: | August 4, 2023 | | | Cohen & Steers, Inc. |
| | | | |
| | | | /s/ Elena Dulik |
| | | | Name: Elena Dulik |
| | | | Title: Senior Vice President & Chief Accounting Officer |
Exhibit 31.1
Chief Executive Officer Certification
As Adopted Pursuant to Section 302 of the Sarbanes-Oxley Act of 2002
I, Joseph M. Harvey, certify that:
1.I have reviewed this Quarterly Report on Form 10-Q for the period ended June 30, 2023 of Cohen & Steers, Inc. (the Registrant);
2.Based on my knowledge, this report does not contain any untrue statement of a material fact or omit to state a material fact necessary to make the statements made, in light of the circumstances under which such statements were made, not misleading with respect to the period covered by this report;
3.Based on my knowledge, the financial statements, and other financial information included in this report, fairly present in all material respects the financial condition, results of operations and cash flows of the Registrant as of, and for, the periods presented in this report;
4.The Registrant's other certifying officer and I are responsible for establishing and maintaining disclosure controls and procedures (as defined in Exchange Act Rules 13a-15(e) and 15d-15(e)) and internal control over financial reporting (as defined in Exchange Act Rules 13a-15(f) and 15d-15(f)) for the Registrant and have:
a)Designed such disclosure controls and procedures, or caused such disclosure controls and procedures to be designed under our supervision, to ensure that material information relating to the Registrant, including its consolidated subsidiaries, is made known to us by others within those entities, particularly during the period in which this report is being prepared;
b)Designed such internal control over financial reporting, or caused such internal control over financial reporting to be designed under our supervision, to provide reasonable assurance regarding the reliability of financial reporting and the preparation of financial statements for external purposes in accordance with generally accepted accounting principles;
c)Evaluated the effectiveness of the Registrant's disclosure controls and procedures and presented in this report our conclusions about the effectiveness of the disclosure controls and procedures, as of the end of the period covered by this report based on such evaluation; and
d)Disclosed in this report any change in the Registrant's internal control over financial reporting that occurred during the Registrant's most recent fiscal quarter (the Registrant's fourth fiscal quarter in the case of an annual report) that has materially affected, or is reasonably likely to materially affect, the Registrant's internal control over financial reporting; and
5.The Registrant's other certifying officer and I have disclosed, based on our most recent evaluation of internal control over financial reporting, to the Registrant's auditors and the audit committee of the Registrant's board of directors (or persons performing the equivalent functions):
a)All significant deficiencies and material weaknesses in the design or operation of internal control over financial reporting which are reasonably likely to adversely affect the Registrant's ability to record, process, summarize and report financial information; and
b)Any fraud, whether or not material, that involves management or other employees who have a significant role in the Registrant's internal control over financial reporting.
| | | | | | | | | | | |
| Dated: | August 4, 2023 | | /s/ Joseph M. Harvey |
| | | Joseph M. Harvey |
| | | Chief Executive Officer and President |
Exhibit 31.2
Chief Financial Officer Certification
As Adopted Pursuant to Section 302 of the Sarbanes-Oxley Act of 2002
I, Matthew S. Stadler, certify that:
1.I have reviewed this Quarterly Report on Form 10-Q for the period ended June 30, 2023 of Cohen & Steers, Inc. (the Registrant);
2.Based on my knowledge, this report does not contain any untrue statement of a material fact or omit to state a material fact necessary to make the statements made, in light of the circumstances under which such statements were made, not misleading with respect to the period covered by this report;
3.Based on my knowledge, the financial statements, and other financial information included in this report, fairly present in all material respects the financial condition, results of operations and cash flows of the Registrant as of, and for, the periods presented in this report;
4.The Registrant's other certifying officer and I are responsible for establishing and maintaining disclosure controls and procedures (as defined in Exchange Act Rules 13a-15(e) and 15d-15(e)) and internal control over financial reporting (as defined in Exchange Act Rules 13a-15(f) and 15d-15(f)) for the Registrant and have:
a)Designed such disclosure controls and procedures, or caused such disclosure controls and procedures to be designed under our supervision, to ensure that material information relating to the Registrant, including its consolidated subsidiaries, is made known to us by others within those entities, particularly during the period in which this report is being prepared;
b)Designed such internal control over financial reporting, or caused such internal control over financial reporting to be designed under our supervision, to provide reasonable assurance regarding the reliability of financial reporting and the preparation of financial statements for external purposes in accordance with generally accepted accounting principles;
c)Evaluated the effectiveness of the Registrant's disclosure controls and procedures and presented in this report our conclusions about the effectiveness of the disclosure controls and procedures, as of the end of the period covered by this report based on such evaluation; and
d)Disclosed in this report any change in the Registrant's internal control over financial reporting that occurred during the Registrant's most recent fiscal quarter (the Registrant's fourth fiscal quarter in the case of an annual report) that has materially affected, or is reasonably likely to materially affect, the Registrant's internal control over financial reporting; and
5.The Registrant's other certifying officer and I have disclosed, based on our most recent evaluation of internal control over financial reporting, to the Registrant's auditors and the audit committee of the Registrant's board of directors (or persons performing the equivalent functions):
a)All significant deficiencies and material weaknesses in the design or operation of internal control over financial reporting which are reasonably likely to adversely affect the Registrant's ability to record, process, summarize and report financial information; and
b)Any fraud, whether or not material, that involves management or other employees who have a significant role in the Registrant's internal control over financial reporting.
| | | | | | | | | | | |
| Dated: | August 4, 2023 | | /s/ Matthew S. Stadler |
| | | Matthew S. Stadler |
| | | Executive Vice President & Chief Financial Officer |
Exhibit 32.1
Certification of the Chief Executive Officer
Pursuant to 18 U.S.C. Section 1350,
As Adopted Pursuant to Section 906 of the Sarbanes-Oxley Act of 2002
In connection with the Quarterly Report on Form 10-Q for the period ended June 30, 2023 (the Report) of Cohen & Steers, Inc. (the Company) as filed with the Securities and Exchange Commission on the date hereof, I, Joseph M. Harvey, Chief Executive Officer of the Company, hereby certify, pursuant to 18 U.S.C. § 1350, as adopted pursuant to Section 906 of the Sarbanes-Oxley Act of 2002, that:
(1)The Report fully complies with the requirements of Section 13(a) or 15(d) of the Securities Exchange Act of 1934, as amended (the Exchange Act); and
(2)The information contained in the Report fairly presents, in all material respects, the financial condition and results of operations of the Company.
| | | | | | | | | | | |
| Dated: | August 4, 2023 | | /s/ Joseph M. Harvey |
| | | Joseph M. Harvey |
| | | Chief Executive Officer and President |
This certification accompanies the Report pursuant to Section 906 of the Sarbanes-Oxley Act of 2002 and shall not, except to the extent required by such Act, be deemed filed by the Company for purposes of Section 18 of the Exchange Act. Such certification will not be deemed to be incorporated by reference into any filing under the Securities Act of 1933, as amended, or the Exchange Act, except to the extent that the Company specifically incorporates it by reference.
Exhibit 32.2
Certification of the Chief Financial Officer
Pursuant to 18 U.S.C. Section 1350,
As Adopted Pursuant to Section 906 of the Sarbanes-Oxley Act of 2002
In connection with the Quarterly Report on Form 10-Q for the period ended June 30, 2023 (the Report) of Cohen & Steers, Inc. (the Company) as filed with the Securities and Exchange Commission on the date hereof, I, Matthew S. Stadler, Chief Financial Officer of the Company, hereby certify, pursuant to 18 U.S.C. § 1350, as adopted pursuant to Section 906 of the Sarbanes-Oxley Act of 2002, that:
(1)The Report fully complies with the requirements of Section 13(a) or 15(d) of the Securities Exchange Act of 1934, as amended (the Exchange Act); and
(2)The information contained in the Report fairly presents, in all material respects, the financial condition and results of operations of the Company.
| | | | | | | | | | | |
| Dated: | August 4, 2023 | | /s/ Matthew S. Stadler |
| | | Matthew S. Stadler |
| | | Executive Vice President & Chief Financial Officer |
This certification accompanies the Report pursuant to Section 906 of the Sarbanes-Oxley Act of 2002 and shall not, except to the extent required by such Act, be deemed filed by the Company for purposes of Section 18 of the Exchange Act. Such certification will not be deemed to be incorporated by reference into any filing under the Securities Act of 1933, as amended, or the Exchange Act, except to the extent that the Company specifically incorporates it by reference.
v3.23.2
Cover Page - shares
|
6 Months Ended |
|
Jun. 30, 2023 |
Jul. 31, 2023 |
| Cover [Abstract] |
|
|
| Document Type |
10-Q
|
|
| Document Quarterly Report |
true
|
|
| Document Period End Date |
Jun. 30, 2023
|
|
| Document Transition Report |
false
|
|
| Entity File Number |
001-32236
|
|
| Entity Registrant Name |
COHEN & STEERS, INC.
|
|
| Entity Incorporation, State or Country Code |
DE
|
|
| Entity Tax Identification Number |
14-1904657
|
|
| Entity Address, Address Line One |
280 Park Avenue,
|
|
| Entity Address, City or Town |
New York
|
|
| Entity Address, State or Province |
NY
|
|
| Entity Address, Postal Zip Code |
10017
|
|
| City Area Code |
212
|
|
| Local Phone Number |
832-3232
|
|
| Title of 12(b) Security |
Common Stock, $0.01 par value
|
|
| Trading Symbol |
CNS
|
|
| Security Exchange Name |
NYSE
|
|
| Entity Current Reporting Status |
Yes
|
|
| Entity Interactive Data Current |
Yes
|
|
| Entity Filer Category |
Large Accelerated Filer
|
|
| Entity Small Business |
false
|
|
| Entity Emerging Growth Company |
false
|
|
| Entity Shell Company |
false
|
|
| Entity Common Stock, Shares Outstanding |
|
49,129,843
|
| Entity Central Index Key |
0001284812
|
|
| Current Fiscal Year End Date |
--12-31
|
|
| Document Fiscal Year Focus |
2023
|
|
| Document Fiscal Period Focus |
Q2
|
|
| Amendment Flag |
false
|
|
| X |
- DefinitionBoolean flag that is true when the XBRL content amends previously-filed or accepted submission.
| Name: |
dei_AmendmentFlag |
| Namespace Prefix: |
dei_ |
| Data Type: |
xbrli:booleanItemType |
| Balance Type: |
na |
| Period Type: |
duration |
|
| X |
- DefinitionEnd date of current fiscal year in the format --MM-DD.
| Name: |
dei_CurrentFiscalYearEndDate |
| Namespace Prefix: |
dei_ |
| Data Type: |
xbrli:gMonthDayItemType |
| Balance Type: |
na |
| Period Type: |
duration |
|
| X |
- DefinitionFiscal period values are FY, Q1, Q2, and Q3. 1st, 2nd and 3rd quarter 10-Q or 10-QT statements have value Q1, Q2, and Q3 respectively, with 10-K, 10-KT or other fiscal year statements having FY.
| Name: |
dei_DocumentFiscalPeriodFocus |
| Namespace Prefix: |
dei_ |
| Data Type: |
dei:fiscalPeriodItemType |
| Balance Type: |
na |
| Period Type: |
duration |
|
| X |
- DefinitionThis is focus fiscal year of the document report in YYYY format. For a 2006 annual report, which may also provide financial information from prior periods, fiscal 2006 should be given as the fiscal year focus. Example: 2006.
| Name: |
dei_DocumentFiscalYearFocus |
| Namespace Prefix: |
dei_ |
| Data Type: |
xbrli:gYearItemType |
| Balance Type: |
na |
| Period Type: |
duration |
|
| X |
- DefinitionFor the EDGAR submission types of Form 8-K: the date of the report, the date of the earliest event reported; for the EDGAR submission types of Form N-1A: the filing date; for all other submission types: the end of the reporting or transition period. The format of the date is YYYY-MM-DD.
| Name: |
dei_DocumentPeriodEndDate |
| Namespace Prefix: |
dei_ |
| Data Type: |
xbrli:dateItemType |
| Balance Type: |
na |
| Period Type: |
duration |
|
| X |
- DefinitionBoolean flag that is true only for a form used as an quarterly report. Reference 1: http://www.xbrl.org/2003/role/presentationRef
-Publisher SEC
-Name Form 10-Q
-Number 240
-Section 308
-Subsection a
| Name: |
dei_DocumentQuarterlyReport |
| Namespace Prefix: |
dei_ |
| Data Type: |
xbrli:booleanItemType |
| Balance Type: |
na |
| Period Type: |
duration |
|
| X |
- DefinitionBoolean flag that is true only for a form used as a transition report. Reference 1: http://www.xbrl.org/2003/role/presentationRef
-Publisher SEC
-Name Forms 10-K, 10-Q, 20-F
-Number 240
-Section 13
-Subsection a-1
| Name: |
dei_DocumentTransitionReport |
| Namespace Prefix: |
dei_ |
| Data Type: |
xbrli:booleanItemType |
| Balance Type: |
na |
| Period Type: |
duration |
|
| X |
- DefinitionThe type of document being provided (such as 10-K, 10-Q, 485BPOS, etc). The document type is limited to the same value as the supporting SEC submission type, or the word 'Other'.
| Name: |
dei_DocumentType |
| Namespace Prefix: |
dei_ |
| Data Type: |
dei:submissionTypeItemType |
| Balance Type: |
na |
| Period Type: |
duration |
|
| X |
- DefinitionAddress Line 1 such as Attn, Building Name, Street Name
| Name: |
dei_EntityAddressAddressLine1 |
| Namespace Prefix: |
dei_ |
| Data Type: |
xbrli:normalizedStringItemType |
| Balance Type: |
na |
| Period Type: |
duration |
|
| X |
- Definition
+ References
+ Details
| Name: |
dei_EntityAddressCityOrTown |
| Namespace Prefix: |
dei_ |
| Data Type: |
xbrli:normalizedStringItemType |
| Balance Type: |
na |
| Period Type: |
duration |
|
| X |
- DefinitionCode for the postal or zip code
| Name: |
dei_EntityAddressPostalZipCode |
| Namespace Prefix: |
dei_ |
| Data Type: |
xbrli:normalizedStringItemType |
| Balance Type: |
na |
| Period Type: |
duration |
|
| X |
- DefinitionName of the state or province.
| Name: |
dei_EntityAddressStateOrProvince |
| Namespace Prefix: |
dei_ |
| Data Type: |
dei:stateOrProvinceItemType |
| Balance Type: |
na |
| Period Type: |
duration |
|
| X |
- DefinitionA unique 10-digit SEC-issued value to identify entities that have filed disclosures with the SEC. It is commonly abbreviated as CIK. Reference 1: http://www.xbrl.org/2003/role/presentationRef
-Publisher SEC
-Name Exchange Act
-Number 240
-Section 12
-Subsection b-2
| Name: |
dei_EntityCentralIndexKey |
| Namespace Prefix: |
dei_ |
| Data Type: |
dei:centralIndexKeyItemType |
| Balance Type: |
na |
| Period Type: |
duration |
|
| X |
- DefinitionIndicate number of shares or other units outstanding of each of registrant's classes of capital or common stock or other ownership interests, if and as stated on cover of related periodic report. Where multiple classes or units exist define each class/interest by adding class of stock items such as Common Class A [Member], Common Class B [Member] or Partnership Interest [Member] onto the Instrument [Domain] of the Entity Listings, Instrument.
| Name: |
dei_EntityCommonStockSharesOutstanding |
| Namespace Prefix: |
dei_ |
| Data Type: |
xbrli:sharesItemType |
| Balance Type: |
na |
| Period Type: |
instant |
|
| X |
- DefinitionIndicate 'Yes' or 'No' whether registrants (1) have filed all reports required to be filed by Section 13 or 15(d) of the Securities Exchange Act of 1934 during the preceding 12 months (or for such shorter period that registrants were required to file such reports), and (2) have been subject to such filing requirements for the past 90 days. This information should be based on the registrant's current or most recent filing containing the related disclosure.
| Name: |
dei_EntityCurrentReportingStatus |
| Namespace Prefix: |
dei_ |
| Data Type: |
dei:yesNoItemType |
| Balance Type: |
na |
| Period Type: |
duration |
|
| X |
- DefinitionIndicate if registrant meets the emerging growth company criteria. Reference 1: http://www.xbrl.org/2003/role/presentationRef
-Publisher SEC
-Name Exchange Act
-Number 240
-Section 12
-Subsection b-2
| Name: |
dei_EntityEmergingGrowthCompany |
| Namespace Prefix: |
dei_ |
| Data Type: |
xbrli:booleanItemType |
| Balance Type: |
na |
| Period Type: |
duration |
|
| X |
- DefinitionCommission file number. The field allows up to 17 characters. The prefix may contain 1-3 digits, the sequence number may contain 1-8 digits, the optional suffix may contain 1-4 characters, and the fields are separated with a hyphen.
| Name: |
dei_EntityFileNumber |
| Namespace Prefix: |
dei_ |
| Data Type: |
dei:fileNumberItemType |
| Balance Type: |
na |
| Period Type: |
duration |
|
| X |
- DefinitionIndicate whether the registrant is one of the following: Large Accelerated Filer, Accelerated Filer, Non-accelerated Filer. Definitions of these categories are stated in Rule 12b-2 of the Exchange Act. This information should be based on the registrant's current or most recent filing containing the related disclosure. Reference 1: http://www.xbrl.org/2003/role/presentationRef
-Publisher SEC
-Name Exchange Act
-Number 240
-Section 12
-Subsection b-2
| Name: |
dei_EntityFilerCategory |
| Namespace Prefix: |
dei_ |
| Data Type: |
dei:filerCategoryItemType |
| Balance Type: |
na |
| Period Type: |
duration |
|
| X |
- DefinitionTwo-character EDGAR code representing the state or country of incorporation.
| Name: |
dei_EntityIncorporationStateCountryCode |
| Namespace Prefix: |
dei_ |
| Data Type: |
dei:edgarStateCountryItemType |
| Balance Type: |
na |
| Period Type: |
duration |
|
| X |
- DefinitionBoolean flag that is true when the registrant has submitted electronically every Interactive Data File required to be submitted pursuant to Rule 405 of Regulation S-T during the preceding 12 months (or for such shorter period that the registrant was required to submit such files). Reference 1: http://www.xbrl.org/2003/role/presentationRef
-Publisher SEC
-Name Regulation S-T
-Number 232
-Section 405
| Name: |
dei_EntityInteractiveDataCurrent |
| Namespace Prefix: |
dei_ |
| Data Type: |
dei:yesNoItemType |
| Balance Type: |
na |
| Period Type: |
duration |
|
| X |
- DefinitionThe exact name of the entity filing the report as specified in its charter, which is required by forms filed with the SEC. Reference 1: http://www.xbrl.org/2003/role/presentationRef
-Publisher SEC
-Name Exchange Act
-Number 240
-Section 12
-Subsection b-2
| Name: |
dei_EntityRegistrantName |
| Namespace Prefix: |
dei_ |
| Data Type: |
xbrli:normalizedStringItemType |
| Balance Type: |
na |
| Period Type: |
duration |
|
| X |
- DefinitionBoolean flag that is true when the registrant is a shell company as defined in Rule 12b-2 of the Exchange Act. Reference 1: http://www.xbrl.org/2003/role/presentationRef
-Publisher SEC
-Name Exchange Act
-Number 240
-Section 12
-Subsection b-2
| Name: |
dei_EntityShellCompany |
| Namespace Prefix: |
dei_ |
| Data Type: |
xbrli:booleanItemType |
| Balance Type: |
na |
| Period Type: |
duration |
|
| X |
- DefinitionIndicates that the company is a Smaller Reporting Company (SRC). Reference 1: http://www.xbrl.org/2003/role/presentationRef
-Publisher SEC
-Name Exchange Act
-Number 240
-Section 12
-Subsection b-2
| Name: |
dei_EntitySmallBusiness |
| Namespace Prefix: |
dei_ |
| Data Type: |
xbrli:booleanItemType |
| Balance Type: |
na |
| Period Type: |
duration |
|
| X |
- DefinitionThe Tax Identification Number (TIN), also known as an Employer Identification Number (EIN), is a unique 9-digit value assigned by the IRS. Reference 1: http://www.xbrl.org/2003/role/presentationRef
-Publisher SEC
-Name Exchange Act
-Number 240
-Section 12
-Subsection b-2
| Name: |
dei_EntityTaxIdentificationNumber |
| Namespace Prefix: |
dei_ |
| Data Type: |
dei:employerIdItemType |
| Balance Type: |
na |
| Period Type: |
duration |
|
| X |
- DefinitionLocal phone number for entity.
| Name: |
dei_LocalPhoneNumber |
| Namespace Prefix: |
dei_ |
| Data Type: |
xbrli:normalizedStringItemType |
| Balance Type: |
na |
| Period Type: |
duration |
|
| X |
- DefinitionTitle of a 12(b) registered security. Reference 1: http://www.xbrl.org/2003/role/presentationRef
-Publisher SEC
-Name Exchange Act
-Number 240
-Section 12
-Subsection b
| Name: |
dei_Security12bTitle |
| Namespace Prefix: |
dei_ |
| Data Type: |
dei:securityTitleItemType |
| Balance Type: |
na |
| Period Type: |
duration |
|
| X |
- DefinitionName of the Exchange on which a security is registered. Reference 1: http://www.xbrl.org/2003/role/presentationRef
-Publisher SEC
-Name Exchange Act
-Number 240
-Section 12
-Subsection d1-1
| Name: |
dei_SecurityExchangeName |
| Namespace Prefix: |
dei_ |
| Data Type: |
dei:edgarExchangeCodeItemType |
| Balance Type: |
na |
| Period Type: |
duration |
|
| X |
- DefinitionTrading symbol of an instrument as listed on an exchange.
| Name: |
dei_TradingSymbol |
| Namespace Prefix: |
dei_ |
| Data Type: |
dei:tradingSymbolItemType |
| Balance Type: |
na |
| Period Type: |
duration |
|
v3.23.2
Condensed Consolidated Statements of Financial Condition (Unaudited) - USD ($)
$ in Thousands |
Jun. 30, 2023 |
Dec. 31, 2022 |
| Assets: |
|
|
|
| Cash and cash equivalents |
|
$ 178,471
|
$ 247,418
|
| Investments ($139,197 and $134,925) |
[1] |
188,227
|
172,955
|
| Accounts receivable |
|
63,217
|
66,676
|
| Due from brokers ($867 and $38) |
[1] |
2,570
|
2,080
|
| Property and equipment—net |
|
36,328
|
8,757
|
| Operating lease right-of-use assets—net |
|
107,759
|
136,430
|
| Goodwill and intangible assets—net |
|
19,269
|
19,049
|
| Other assets ($548 and $576) |
[1] |
29,146
|
20,014
|
| Total assets |
|
624,987
|
673,379
|
| Liabilities: |
|
|
|
| Accrued compensation and benefits |
|
31,487
|
77,764
|
| Distribution and service fees payable |
|
8,560
|
8,421
|
| Operating lease liabilities |
|
115,565
|
138,809
|
| Income tax payable |
|
216
|
7,750
|
| Due to brokers ($630 and $11) |
[1] |
1,257
|
835
|
| Other liabilities and accrued expenses ($626 and $664) |
[1] |
23,995
|
12,857
|
| Total liabilities |
|
181,080
|
246,436
|
| Commitments and contingencies |
|
|
|
| Redeemable noncontrolling interests |
|
85,518
|
85,335
|
| Stockholders' equity: |
|
|
|
| Common stock, $0.01 par value; 500,000,000 shares authorized; 55,744,666 and 55,051,975 shares issued at June 30, 2023 and December 31, 2022 respectively |
|
558
|
551
|
| Additional paid-in capital |
|
794,159
|
769,373
|
| Accumulated deficit |
|
(162,231)
|
(171,417)
|
| Accumulated other comprehensive loss |
|
(8,537)
|
(10,784)
|
| Treasury stock, at cost, 6,617,428 and 6,329,178 shares at June 30, 2023 and December 31, 2022, respectively |
|
(270,797)
|
(250,169)
|
| Total stockholders’ equity attributable to Cohen & Steers, Inc. |
|
353,152
|
337,554
|
| Nonredeemable noncontrolling interests |
|
5,237
|
4,054
|
| Total stockholders' equity |
|
358,389
|
341,608
|
| Total liabilities, redeemable noncontrolling interests and stockholders’ equity |
|
$ 624,987
|
$ 673,379
|
|
|
| X |
- DefinitionDistribution and Service Fees Payable
| Name: |
cns_DistributionAndServiceFeesPayable |
| Namespace Prefix: |
cns_ |
| Data Type: |
xbrli:monetaryItemType |
| Balance Type: |
credit |
| Period Type: |
instant |
|
| X |
- DefinitionAmount payable to other broker-dealer and clearing organization, including, but not limited to, security failed-to-receive, deposit received for security loaned, open transaction, and floor-brokerage payable. Reference 1: http://www.xbrl.org/2009/role/commonPracticeRef
-Name Rule 15c3-1
-Number 240
-Section 15c3-1
-Publisher SEC
| Name: |
srt_PayablesToBrokerDealersAndClearingOrganizations |
| Namespace Prefix: |
srt_ |
| Data Type: |
xbrli:monetaryItemType |
| Balance Type: |
credit |
| Period Type: |
instant |
|
| X |
- DefinitionAmount, before allowance for credit loss, of right to consideration from customer for product sold and service rendered in normal course of business. Reference 1: http://www.xbrl.org/2009/role/commonPracticeRef
-Topic 944
-SubTopic 210
-Name Accounting Standards Codification
-Section S99
-Paragraph 1
-Subparagraph (SX 210.7-03(a)(5))
-Publisher FASB
-URI https://asc.fasb.org//1943274/2147479440/944-210-S99-1
Reference 2: http://www.xbrl.org/2003/role/disclosureRef
-Topic 210
-SubTopic 10
-Name Accounting Standards Codification
-Section S99
-Paragraph 1
-Subparagraph (SX 210.5-02(3)(a)(1))
-Publisher FASB
-URI https://asc.fasb.org//1943274/2147480566/210-10-S99-1
Reference 3: http://www.xbrl.org/2003/role/disclosureRef
-Topic 310
-SubTopic 10
-Name Accounting Standards Codification
-Section 45
-Paragraph 2
-Publisher FASB
-URI https://asc.fasb.org//1943274/2147481990/310-10-45-2
| Name: |
us-gaap_AccountsReceivableGross |
| Namespace Prefix: |
us-gaap_ |
| Data Type: |
xbrli:monetaryItemType |
| Balance Type: |
debit |
| Period Type: |
instant |
|
| X |
- DefinitionAmount, after tax, of accumulated increase (decrease) in equity from transaction and other event and circumstance from nonowner source. Reference 1: http://fasb.org/us-gaap/role/ref/legacyRef
-Name Accounting Standards Codification
-Topic 220
-SubTopic 10
-Section 45
-Paragraph 14A
-Publisher FASB
-URI https://asc.fasb.org//1943274/2147482790/220-10-45-14A
Reference 2: http://fasb.org/us-gaap/role/ref/legacyRef
-Topic 220
-SubTopic 10
-Name Accounting Standards Codification
-Section 45
-Paragraph 11
-Publisher FASB
-URI https://asc.fasb.org//1943274/2147482790/220-10-45-11
Reference 3: http://www.xbrl.org/2003/role/disclosureRef
-Topic 944
-SubTopic 40
-Name Accounting Standards Codification
-Section 65
-Paragraph 2
-Subparagraph (g)(2)(ii)
-Publisher FASB
-URI https://asc.fasb.org//1943274/2147480016/944-40-65-2
Reference 4: http://www.xbrl.org/2003/role/disclosureRef
-Topic 944
-SubTopic 40
-Name Accounting Standards Codification
-Section 65
-Paragraph 2
-Subparagraph (h)(2)
-Publisher FASB
-URI https://asc.fasb.org//1943274/2147480016/944-40-65-2
Reference 5: http://www.xbrl.org/2003/role/disclosureRef
-Topic 210
-SubTopic 10
-Name Accounting Standards Codification
-Section S99
-Paragraph 1
-Subparagraph (SX 210.5-02(30)(a)(4))
-Publisher FASB
-URI https://asc.fasb.org//1943274/2147480566/210-10-S99-1
Reference 6: http://www.xbrl.org/2003/role/disclosureRef
-Topic 944
-SubTopic 210
-Name Accounting Standards Codification
-Section S99
-Paragraph 1
-Subparagraph (SX 210.7-03(a)(23)(a)(3))
-Publisher FASB
-URI https://asc.fasb.org//1943274/2147479440/944-210-S99-1
Reference 7: http://fasb.org/us-gaap/role/ref/legacyRef
-Name Accounting Standards Codification
-Topic 220
-SubTopic 10
-Section 45
-Paragraph 14
-Publisher FASB
-URI https://asc.fasb.org//1943274/2147482790/220-10-45-14
| Name: |
us-gaap_AccumulatedOtherComprehensiveIncomeLossNetOfTax |
| Namespace Prefix: |
us-gaap_ |
| Data Type: |
xbrli:monetaryItemType |
| Balance Type: |
credit |
| Period Type: |
instant |
|
| X |
- DefinitionAmount of excess of issue price over par or stated value of stock and from other transaction involving stock or stockholder. Includes, but is not limited to, additional paid-in capital (APIC) for common and preferred stock. Reference 1: http://www.xbrl.org/2003/role/exampleRef
-Topic 852
-SubTopic 10
-Name Accounting Standards Codification
-Section 55
-Paragraph 10
-Publisher FASB
-URI https://asc.fasb.org//1943274/2147481372/852-10-55-10
Reference 2: http://www.xbrl.org/2009/role/commonPracticeRef
-Topic 946
-SubTopic 210
-Name Accounting Standards Codification
-Section S99
-Paragraph 1
-Subparagraph (SX 210.6-04(18))
-Publisher FASB
-URI https://asc.fasb.org//1943274/2147479617/946-210-S99-1
Reference 3: http://fasb.org/us-gaap/role/ref/legacyRef
-Topic 210
-SubTopic 10
-Name Accounting Standards Codification
-Section S99
-Paragraph 1
-Subparagraph (SX 210.5-02(30)(a)(1))
-Publisher FASB
-URI https://asc.fasb.org//1943274/2147480566/210-10-S99-1
| Name: |
us-gaap_AdditionalPaidInCapital |
| Namespace Prefix: |
us-gaap_ |
| Data Type: |
xbrli:monetaryItemType |
| Balance Type: |
credit |
| Period Type: |
instant |
|
| X |
- DefinitionSum of the carrying amounts as of the balance sheet date of all assets that are recognized. Assets are probable future economic benefits obtained or controlled by an entity as a result of past transactions or events. Reference 1: http://www.xbrl.org/2003/role/disclosureRef
-Topic 810
-SubTopic 10
-Name Accounting Standards Codification
-Section 50
-Paragraph 3
-Subparagraph (bb)
-Publisher FASB
-URI https://asc.fasb.org//1943274/2147481203/810-10-50-3
Reference 2: http://www.xbrl.org/2003/role/disclosureRef
-Topic 810
-SubTopic 10
-Name Accounting Standards Codification
-Section 45
-Paragraph 25
-Subparagraph (a)
-Publisher FASB
-URI https://asc.fasb.org//1943274/2147481231/810-10-45-25
Reference 3: http://www.xbrl.org/2003/role/disclosureRef
-Topic 235
-SubTopic 10
-Name Accounting Standards Codification
-Section S99
-Paragraph 1
-Subparagraph (SX 210.4-08(g)(1)(ii))
-Publisher FASB
-URI https://asc.fasb.org//1943274/2147480678/235-10-S99-1
Reference 4: http://www.xbrl.org/2003/role/disclosureRef
-Topic 323
-SubTopic 10
-Name Accounting Standards Codification
-Section 50
-Paragraph 3
-Subparagraph (c)
-Publisher FASB
-URI https://asc.fasb.org//1943274/2147481687/323-10-50-3
Reference 5: http://www.xbrl.org/2003/role/disclosureRef
-Topic 825
-SubTopic 10
-Name Accounting Standards Codification
-Section 50
-Paragraph 28
-Subparagraph (f)
-Publisher FASB
-URI https://asc.fasb.org//1943274/2147482907/825-10-50-28
Reference 6: http://www.xbrl.org/2003/role/exampleRef
-Topic 852
-SubTopic 10
-Name Accounting Standards Codification
-Section 55
-Paragraph 10
-Publisher FASB
-URI https://asc.fasb.org//1943274/2147481372/852-10-55-10
Reference 7: http://www.xbrl.org/2003/role/exampleRef
-Topic 946
-SubTopic 830
-Name Accounting Standards Codification
-Section 55
-Paragraph 12
-Publisher FASB
-URI https://asc.fasb.org//1943274/2147480167/946-830-55-12
Reference 8: http://www.xbrl.org/2003/role/disclosureRef
-Topic 944
-SubTopic 210
-Name Accounting Standards Codification
-Section S99
-Paragraph 1
-Subparagraph (SX 210.7-03(a)(12))
-Publisher FASB
-URI https://asc.fasb.org//1943274/2147479440/944-210-S99-1
Reference 9: http://www.xbrl.org/2003/role/disclosureRef
-Topic 280
-SubTopic 10
-Name Accounting Standards Codification
-Section 50
-Paragraph 22
-Publisher FASB
-URI https://asc.fasb.org//1943274/2147482810/280-10-50-22
Reference 10: http://www.xbrl.org/2003/role/disclosureRef
-Topic 946
-SubTopic 210
-Name Accounting Standards Codification
-Section S99
-Paragraph 1
-Subparagraph (SX 210.6-04(8))
-Publisher FASB
-URI https://asc.fasb.org//1943274/2147479617/946-210-S99-1
Reference 11: http://www.xbrl.org/2003/role/disclosureRef
-Topic 210
-SubTopic 10
-Name Accounting Standards Codification
-Section S99
-Paragraph 1
-Subparagraph (SX 210.5-02(18))
-Publisher FASB
-URI https://asc.fasb.org//1943274/2147480566/210-10-S99-1
Reference 12: http://www.xbrl.org/2003/role/disclosureRef
-Topic 470
-SubTopic 10
-Name Accounting Standards Codification
-Section S99
-Paragraph 1A
-Subparagraph (SX 210.13-01(a)(4)(i))
-Publisher FASB
-URI https://asc.fasb.org//1943274/2147480097/470-10-S99-1A
Reference 13: http://www.xbrl.org/2009/role/commonPracticeRef
-Topic 470
-SubTopic 10
-Name Accounting Standards Codification
-Section S99
-Paragraph 1A
-Subparagraph (SX 210.13-01(a)(4)(ii))
-Publisher FASB
-URI https://asc.fasb.org//1943274/2147480097/470-10-S99-1A
Reference 14: http://www.xbrl.org/2009/role/commonPracticeRef
-Topic 470
-SubTopic 10
-Name Accounting Standards Codification
-Section S99
-Paragraph 1A
-Subparagraph (SX 210.13-01(a)(4)(iii))
-Publisher FASB
-URI https://asc.fasb.org//1943274/2147480097/470-10-S99-1A
Reference 15: http://www.xbrl.org/2003/role/disclosureRef
-Topic 470
-SubTopic 10
-Name Accounting Standards Codification
-Section S99
-Paragraph 1A
-Subparagraph (SX 210.13-01(a)(4)(iii)(A))
-Publisher FASB
-URI https://asc.fasb.org//1943274/2147480097/470-10-S99-1A
Reference 16: http://www.xbrl.org/2003/role/disclosureRef
-Topic 470
-SubTopic 10
-Name Accounting Standards Codification
-Section S99
-Paragraph 1A
-Subparagraph (SX 210.13-01(a)(4)(iv))
-Publisher FASB
-URI https://asc.fasb.org//1943274/2147480097/470-10-S99-1A
Reference 17: http://www.xbrl.org/2003/role/disclosureRef
-Topic 470
-SubTopic 10
-Name Accounting Standards Codification
-Section S99
-Paragraph 1A
-Subparagraph (SX 210.13-01(a)(5))
-Publisher FASB
-URI https://asc.fasb.org//1943274/2147480097/470-10-S99-1A
Reference 18: http://www.xbrl.org/2003/role/disclosureRef
-Topic 470
-SubTopic 10
-Name Accounting Standards Codification
-Section S99
-Paragraph 1B
-Subparagraph (SX 210.13-02(a)(4)(i))
-Publisher FASB
-URI https://asc.fasb.org//1943274/2147480097/470-10-S99-1B
Reference 19: http://www.xbrl.org/2003/role/disclosureRef
-Topic 470
-SubTopic 10
-Name Accounting Standards Codification
-Section S99
-Paragraph 1B
-Subparagraph (SX 210.13-02(a)(4)(iii)(A))
-Publisher FASB
-URI https://asc.fasb.org//1943274/2147480097/470-10-S99-1B
Reference 20: http://www.xbrl.org/2003/role/disclosureRef
-Topic 470
-SubTopic 10
-Name Accounting Standards Codification
-Section S99
-Paragraph 1B
-Subparagraph (SX 210.13-02(a)(4)(iii)(B))
-Publisher FASB
-URI https://asc.fasb.org//1943274/2147480097/470-10-S99-1B
Reference 21: http://www.xbrl.org/2003/role/disclosureRef
-Topic 470
-SubTopic 10
-Name Accounting Standards Codification
-Section S99
-Paragraph 1B
-Subparagraph (SX 210.13-02(a)(4)(iv))
-Publisher FASB
-URI https://asc.fasb.org//1943274/2147480097/470-10-S99-1B
Reference 22: http://www.xbrl.org/2003/role/disclosureRef
-Topic 470
-SubTopic 10
-Name Accounting Standards Codification
-Section S99
-Paragraph 1B
-Subparagraph (SX 210.13-02(a)(5))
-Publisher FASB
-URI https://asc.fasb.org//1943274/2147480097/470-10-S99-1B
Reference 23: http://www.xbrl.org/2009/role/commonPracticeRef
-Topic 852
-SubTopic 10
-Name Accounting Standards Codification
-Section 50
-Paragraph 7
-Subparagraph (a)
-Publisher FASB
-URI https://asc.fasb.org//1943274/2147481404/852-10-50-7
Reference 24: http://www.xbrl.org/2003/role/disclosureRef
-Topic 280
-SubTopic 10
-Name Accounting Standards Codification
-Section 50
-Paragraph 30
-Subparagraph (c)
-Publisher FASB
-URI https://asc.fasb.org//1943274/2147482810/280-10-50-30
Reference 25: http://www.xbrl.org/2003/role/disclosureRef
-Topic 280
-SubTopic 10
-Name Accounting Standards Codification
-Section 50
-Paragraph 32
-Subparagraph (d)
-Publisher FASB
-URI https://asc.fasb.org//1943274/2147482810/280-10-50-32
Reference 26: http://fasb.org/us-gaap/role/ref/legacyRef
-Topic 942
-SubTopic 210
-Name Accounting Standards Codification
-Section S99
-Paragraph 1
-Subparagraph (SX 210.9-03(11))
-Publisher FASB
-URI https://asc.fasb.org//1943274/2147479853/942-210-S99-1
| Name: |
us-gaap_Assets |
| Namespace Prefix: |
us-gaap_ |
| Data Type: |
xbrli:monetaryItemType |
| Balance Type: |
debit |
| Period Type: |
instant |
|
| X |
- References
+ Details
| Name: |
us-gaap_AssetsAbstract |
| Namespace Prefix: |
us-gaap_ |
| Data Type: |
xbrli:stringItemType |
| Balance Type: |
na |
| Period Type: |
duration |
|
| X |
- DefinitionAmount of currency on hand as well as demand deposits with banks or financial institutions. Includes other kinds of accounts that have the general characteristics of demand deposits. Also includes short-term, highly liquid investments that are both readily convertible to known amounts of cash and so near their maturity that they present insignificant risk of changes in value because of changes in interest rates. Excludes cash and cash equivalents within disposal group and discontinued operation. Reference 1: http://www.xbrl.org/2003/role/disclosureRef
-Topic 210
-SubTopic 10
-Name Accounting Standards Codification
-Section S99
-Paragraph 1
-Subparagraph (SX 210.5-02(1))
-Publisher FASB
-URI https://asc.fasb.org//1943274/2147480566/210-10-S99-1
Reference 2: http://www.xbrl.org/2003/role/exampleRef
-Topic 210
-SubTopic 10
-Name Accounting Standards Codification
-Section 45
-Paragraph 1
-Subparagraph (a)
-Publisher FASB
-URI https://asc.fasb.org//1943274/2147483467/210-10-45-1
Reference 3: http://fasb.org/us-gaap/role/ref/legacyRef
-Name Accounting Standards Codification
-Topic 230
-SubTopic 10
-Section 45
-Paragraph 4
-Publisher FASB
-URI https://asc.fasb.org//1943274/2147482740/230-10-45-4
| Name: |
us-gaap_CashAndCashEquivalentsAtCarryingValue |
| Namespace Prefix: |
us-gaap_ |
| Data Type: |
xbrli:monetaryItemType |
| Balance Type: |
debit |
| Period Type: |
instant |
|
| X |
- DefinitionRepresents the caption on the face of the balance sheet to indicate that the entity has entered into (1) purchase or supply arrangements that will require expending a portion of its resources to meet the terms thereof, and (2) is exposed to potential losses or, less frequently, gains, arising from (a) possible claims against a company's resources due to future performance under contract terms, and (b) possible losses or likely gains from uncertainties that will ultimately be resolved when one or more future events that are deemed likely to occur do occur or fail to occur. Reference 1: http://www.xbrl.org/2003/role/disclosureRef
-Topic 944
-SubTopic 210
-Name Accounting Standards Codification
-Section S99
-Paragraph 1
-Subparagraph (SX 210.7-03(a)(19))
-Publisher FASB
-URI https://asc.fasb.org//1943274/2147479440/944-210-S99-1
Reference 2: http://www.xbrl.org/2003/role/disclosureRef
-Topic 946
-SubTopic 210
-Name Accounting Standards Codification
-Section S99
-Paragraph 1
-Subparagraph (SX 210.6-04(15))
-Publisher FASB
-URI https://asc.fasb.org//1943274/2147479617/946-210-S99-1
Reference 3: http://fasb.org/us-gaap/role/ref/legacyRef
-Name Accounting Standards Codification
-Topic 942
-SubTopic 210
-Section S99
-Paragraph 1
-Subparagraph (SX 210.9-03.17)
-Publisher FASB
-URI https://asc.fasb.org//1943274/2147479853/942-210-S99-1
Reference 4: http://fasb.org/us-gaap/role/ref/legacyRef
-Name Accounting Standards Codification
-Topic 210
-SubTopic 10
-Section S99
-Paragraph 1
-Subparagraph (SX 210.5-02.25)
-Publisher FASB
-URI https://asc.fasb.org//1943274/2147480566/210-10-S99-1
| Name: |
us-gaap_CommitmentsAndContingencies |
| Namespace Prefix: |
us-gaap_ |
| Data Type: |
xbrli:monetaryItemType |
| Balance Type: |
credit |
| Period Type: |
instant |
|
| X |
- DefinitionAggregate par or stated value of issued nonredeemable common stock (or common stock redeemable solely at the option of the issuer). This item includes treasury stock repurchased by the entity. Note: elements for number of nonredeemable common shares, par value and other disclosure concepts are in another section within stockholders' equity. Reference 1: http://www.xbrl.org/2003/role/exampleRef
-Topic 852
-SubTopic 10
-Name Accounting Standards Codification
-Section 55
-Paragraph 10
-Publisher FASB
-URI https://asc.fasb.org//1943274/2147481372/852-10-55-10
Reference 2: http://www.xbrl.org/2003/role/disclosureRef
-Topic 944
-SubTopic 210
-Name Accounting Standards Codification
-Section S99
-Paragraph 1
-Subparagraph (SX 210.7-03(a)(22))
-Publisher FASB
-URI https://asc.fasb.org//1943274/2147479440/944-210-S99-1
Reference 3: http://fasb.org/us-gaap/role/ref/legacyRef
-Topic 210
-SubTopic 10
-Name Accounting Standards Codification
-Section S99
-Paragraph 1
-Subparagraph (SX 210.5-02(29))
-Publisher FASB
-URI https://asc.fasb.org//1943274/2147480566/210-10-S99-1
| Name: |
us-gaap_CommonStockValue |
| Namespace Prefix: |
us-gaap_ |
| Data Type: |
xbrli:monetaryItemType |
| Balance Type: |
credit |
| Period Type: |
instant |
|
| X |
- DefinitionAmount receivable from correspondent broker-dealer. Reference 1: http://fasb.org/us-gaap/role/ref/legacyRef
-Name Accounting Standards Codification
-Section 45
-Paragraph 3
-SubTopic 20
-Topic 940
-Publisher FASB
-URI https://asc.fasb.org//1943274/2147481833/940-20-45-3
Reference 2: http://fasb.org/us-gaap/role/ref/legacyRef
-Name Accounting Standards Codification
-Section 25
-Paragraph 1
-SubTopic 20
-Topic 940
-Publisher FASB
-URI https://asc.fasb.org//1943274/2147481913/940-20-25-1
Reference 3: http://fasb.org/us-gaap/role/ref/legacyRef
-Topic 310
-SubTopic 10
-Name Accounting Standards Codification
-Section 45
-Paragraph 2
-Publisher FASB
-URI https://asc.fasb.org//1943274/2147481990/310-10-45-2
| Name: |
us-gaap_DueFromCorrespondentBrokers |
| Namespace Prefix: |
us-gaap_ |
| Data Type: |
xbrli:monetaryItemType |
| Balance Type: |
debit |
| Period Type: |
instant |
|
| X |
- DefinitionCarrying amount of finite-lived intangible assets, indefinite-lived intangible assets and goodwill. Goodwill is an asset representing the future economic benefits arising from other assets acquired in a business combination that are not individually identified and separately recognized. Intangible assets are assets, not including financial assets, lacking physical substance.
| Name: |
us-gaap_IntangibleAssetsNetIncludingGoodwill |
| Namespace Prefix: |
us-gaap_ |
| Data Type: |
xbrli:monetaryItemType |
| Balance Type: |
debit |
| Period Type: |
instant |
|
| X |
- DefinitionSum of the carrying amounts as of the balance sheet date of all investments. Reference 1: http://www.xbrl.org/2003/role/disclosureRef
-Topic 944
-SubTopic 210
-Name Accounting Standards Codification
-Section S99
-Paragraph 1
-Subparagraph (SX 210.7-03(a)(1)(h))
-Publisher FASB
-URI https://asc.fasb.org//1943274/2147479440/944-210-S99-1
| Name: |
us-gaap_Investments |
| Namespace Prefix: |
us-gaap_ |
| Data Type: |
xbrli:monetaryItemType |
| Balance Type: |
debit |
| Period Type: |
instant |
|
| X |
- DefinitionSum of the carrying amounts as of the balance sheet date of all liabilities that are recognized. Liabilities are probable future sacrifices of economic benefits arising from present obligations of an entity to transfer assets or provide services to other entities in the future. Reference 1: http://www.xbrl.org/2003/role/disclosureRef
-Topic 810
-SubTopic 10
-Name Accounting Standards Codification
-Section 50
-Paragraph 3
-Subparagraph (c)
-Publisher FASB
-URI https://asc.fasb.org//1943274/2147481203/810-10-50-3
Reference 2: http://www.xbrl.org/2003/role/disclosureRef
-Topic 810
-SubTopic 10
-Name Accounting Standards Codification
-Section 45
-Paragraph 25
-Subparagraph (b)
-Publisher FASB
-URI https://asc.fasb.org//1943274/2147481231/810-10-45-25
Reference 3: http://www.xbrl.org/2003/role/disclosureRef
-Topic 810
-SubTopic 10
-Name Accounting Standards Codification
-Section 50
-Paragraph 3
-Subparagraph (bb)
-Publisher FASB
-URI https://asc.fasb.org//1943274/2147481203/810-10-50-3
Reference 4: http://www.xbrl.org/2003/role/disclosureRef
-Topic 235
-SubTopic 10
-Name Accounting Standards Codification
-Section S99
-Paragraph 1
-Subparagraph (SX 210.4-08(g)(1)(ii))
-Publisher FASB
-URI https://asc.fasb.org//1943274/2147480678/235-10-S99-1
Reference 5: http://www.xbrl.org/2003/role/disclosureRef
-Topic 323
-SubTopic 10
-Name Accounting Standards Codification
-Section 50
-Paragraph 3
-Subparagraph (c)
-Publisher FASB
-URI https://asc.fasb.org//1943274/2147481687/323-10-50-3
Reference 6: http://www.xbrl.org/2003/role/disclosureRef
-Topic 825
-SubTopic 10
-Name Accounting Standards Codification
-Section 50
-Paragraph 28
-Subparagraph (f)
-Publisher FASB
-URI https://asc.fasb.org//1943274/2147482907/825-10-50-28
Reference 7: http://www.xbrl.org/2003/role/exampleRef
-Topic 946
-SubTopic 830
-Name Accounting Standards Codification
-Section 55
-Paragraph 12
-Publisher FASB
-URI https://asc.fasb.org//1943274/2147480167/946-830-55-12
Reference 8: http://www.xbrl.org/2003/role/disclosureRef
-Topic 946
-SubTopic 210
-Name Accounting Standards Codification
-Section S99
-Paragraph 1
-Subparagraph (SX 210.6-04(14))
-Publisher FASB
-URI https://asc.fasb.org//1943274/2147479617/946-210-S99-1
Reference 9: http://www.xbrl.org/2003/role/disclosureRef
-Topic 470
-SubTopic 10
-Name Accounting Standards Codification
-Section S99
-Paragraph 1A
-Subparagraph (SX 210.13-01(a)(4)(i))
-Publisher FASB
-URI https://asc.fasb.org//1943274/2147480097/470-10-S99-1A
Reference 10: http://www.xbrl.org/2009/role/commonPracticeRef
-Topic 470
-SubTopic 10
-Name Accounting Standards Codification
-Section S99
-Paragraph 1A
-Subparagraph (SX 210.13-01(a)(4)(ii))
-Publisher FASB
-URI https://asc.fasb.org//1943274/2147480097/470-10-S99-1A
Reference 11: http://www.xbrl.org/2003/role/disclosureRef
-Topic 470
-SubTopic 10
-Name Accounting Standards Codification
-Section S99
-Paragraph 1A
-Subparagraph (SX 210.13-01(a)(4)(iii)(A))
-Publisher FASB
-URI https://asc.fasb.org//1943274/2147480097/470-10-S99-1A
Reference 12: http://www.xbrl.org/2003/role/disclosureRef
-Topic 470
-SubTopic 10
-Name Accounting Standards Codification
-Section S99
-Paragraph 1A
-Subparagraph (SX 210.13-01(a)(4)(iv))
-Publisher FASB
-URI https://asc.fasb.org//1943274/2147480097/470-10-S99-1A
Reference 13: http://www.xbrl.org/2003/role/disclosureRef
-Topic 470
-SubTopic 10
-Name Accounting Standards Codification
-Section S99
-Paragraph 1A
-Subparagraph (SX 210.13-01(a)(5))
-Publisher FASB
-URI https://asc.fasb.org//1943274/2147480097/470-10-S99-1A
Reference 14: http://www.xbrl.org/2003/role/disclosureRef
-Topic 470
-SubTopic 10
-Name Accounting Standards Codification
-Section S99
-Paragraph 1B
-Subparagraph (SX 210.13-02(a)(4)(i))
-Publisher FASB
-URI https://asc.fasb.org//1943274/2147480097/470-10-S99-1B
Reference 15: http://www.xbrl.org/2003/role/disclosureRef
-Topic 470
-SubTopic 10
-Name Accounting Standards Codification
-Section S99
-Paragraph 1B
-Subparagraph (SX 210.13-02(a)(4)(iii)(A))
-Publisher FASB
-URI https://asc.fasb.org//1943274/2147480097/470-10-S99-1B
Reference 16: http://www.xbrl.org/2003/role/disclosureRef
-Topic 470
-SubTopic 10
-Name Accounting Standards Codification
-Section S99
-Paragraph 1B
-Subparagraph (SX 210.13-02(a)(4)(iii)(B))
-Publisher FASB
-URI https://asc.fasb.org//1943274/2147480097/470-10-S99-1B
Reference 17: http://www.xbrl.org/2003/role/disclosureRef
-Topic 470
-SubTopic 10
-Name Accounting Standards Codification
-Section S99
-Paragraph 1B
-Subparagraph (SX 210.13-02(a)(4)(iv))
-Publisher FASB
-URI https://asc.fasb.org//1943274/2147480097/470-10-S99-1B
Reference 18: http://www.xbrl.org/2003/role/disclosureRef
-Topic 470
-SubTopic 10
-Name Accounting Standards Codification
-Section S99
-Paragraph 1B
-Subparagraph (SX 210.13-02(a)(5))
-Publisher FASB
-URI https://asc.fasb.org//1943274/2147480097/470-10-S99-1B
Reference 19: http://www.xbrl.org/2009/role/commonPracticeRef
-Topic 852
-SubTopic 10
-Name Accounting Standards Codification
-Section 50
-Paragraph 7
-Subparagraph (a)
-Publisher FASB
-URI https://asc.fasb.org//1943274/2147481404/852-10-50-7
Reference 20: http://www.xbrl.org/2009/role/commonPracticeRef
-Topic 852
-SubTopic 10
-Name Accounting Standards Codification
-Section 50
-Paragraph 7
-Subparagraph (b)
-Publisher FASB
-URI https://asc.fasb.org//1943274/2147481404/852-10-50-7
Reference 21: http://www.xbrl.org/2003/role/exampleRef
-Topic 280
-SubTopic 10
-Name Accounting Standards Codification
-Section 50
-Paragraph 30
-Subparagraph (d)
-Publisher FASB
-URI https://asc.fasb.org//1943274/2147482810/280-10-50-30
Reference 22: http://fasb.org/us-gaap/role/ref/legacyRef
-Name Accounting Standards Codification
-Topic 210
-SubTopic 10
-Section S99
-Paragraph 1
-Subparagraph (SX 210.5-02.19-26)
-Publisher FASB
-URI https://asc.fasb.org//1943274/2147480566/210-10-S99-1
| Name: |
us-gaap_Liabilities |
| Namespace Prefix: |
us-gaap_ |
| Data Type: |
xbrli:monetaryItemType |
| Balance Type: |
credit |
| Period Type: |
instant |
|
| X |
- References
+ Details
| Name: |
us-gaap_LiabilitiesAbstract |
| Namespace Prefix: |
us-gaap_ |
| Data Type: |
xbrli:stringItemType |
| Balance Type: |
na |
| Period Type: |
duration |
|
| X |
- DefinitionAmount of liabilities and equity items, including the portion of equity attributable to noncontrolling interests, if any. Reference 1: http://www.xbrl.org/2003/role/exampleRef
-Topic 852
-SubTopic 10
-Name Accounting Standards Codification
-Section 55
-Paragraph 10
-Publisher FASB
-URI https://asc.fasb.org//1943274/2147481372/852-10-55-10
Reference 2: http://www.xbrl.org/2003/role/disclosureRef
-Topic 944
-SubTopic 210
-Name Accounting Standards Codification
-Section S99
-Paragraph 1
-Subparagraph (SX 210.7-03(a)(25))
-Publisher FASB
-URI https://asc.fasb.org//1943274/2147479440/944-210-S99-1
Reference 3: http://www.xbrl.org/2009/role/commonPracticeRef
-Topic 235
-SubTopic 10
-Name Accounting Standards Codification
-Section S99
-Paragraph 1
-Subparagraph (SX 210.4-08(g)(1)(ii))
-Publisher FASB
-URI https://asc.fasb.org//1943274/2147480678/235-10-S99-1
Reference 4: http://www.xbrl.org/2009/role/commonPracticeRef
-Topic 323
-SubTopic 10
-Name Accounting Standards Codification
-Section 50
-Paragraph 3
-Subparagraph (c)
-Publisher FASB
-URI https://asc.fasb.org//1943274/2147481687/323-10-50-3
Reference 5: http://www.xbrl.org/2009/role/commonPracticeRef
-Topic 825
-SubTopic 10
-Name Accounting Standards Codification
-Section 50
-Paragraph 28
-Subparagraph (f)
-Publisher FASB
-URI https://asc.fasb.org//1943274/2147482907/825-10-50-28
Reference 6: http://fasb.org/us-gaap/role/ref/legacyRef
-Topic 942
-SubTopic 210
-Name Accounting Standards Codification
-Section S99
-Paragraph 1
-Subparagraph (SX 210.9-03(23))
-Publisher FASB
-URI https://asc.fasb.org//1943274/2147479853/942-210-S99-1
Reference 7: http://fasb.org/us-gaap/role/ref/legacyRef
-Topic 210
-SubTopic 10
-Name Accounting Standards Codification
-Section S99
-Paragraph 1
-Subparagraph (SX 210.5-02(32))
-Publisher FASB
-URI https://asc.fasb.org//1943274/2147480566/210-10-S99-1
| Name: |
us-gaap_LiabilitiesAndStockholdersEquity |
| Namespace Prefix: |
us-gaap_ |
| Data Type: |
xbrli:monetaryItemType |
| Balance Type: |
credit |
| Period Type: |
instant |
|
| X |
- DefinitionPortion of equity (net assets) in a subsidiary not attributable, directly or indirectly, to the parent entity which is not redeemable by the parent entity.
| Name: |
us-gaap_NonredeemableNoncontrollingInterest |
| Namespace Prefix: |
us-gaap_ |
| Data Type: |
xbrli:monetaryItemType |
| Balance Type: |
credit |
| Period Type: |
instant |
|
| X |
- DefinitionPresent value of lessee's discounted obligation for lease payments from operating lease, classified as noncurrent. Reference 1: http://www.xbrl.org/2003/role/disclosureRef
-Topic 842
-SubTopic 20
-Name Accounting Standards Codification
-Section 45
-Paragraph 1
-Subparagraph (b)
-Publisher FASB
-URI https://asc.fasb.org//1943274/2147479041/842-20-45-1
| Name: |
us-gaap_OperatingLeaseLiabilityNoncurrent |
| Namespace Prefix: |
us-gaap_ |
| Data Type: |
xbrli:monetaryItemType |
| Balance Type: |
credit |
| Period Type: |
instant |
|
| X |
- DefinitionAmount of lessee's right to use underlying asset under operating lease. Reference 1: http://www.xbrl.org/2003/role/disclosureRef
-Topic 842
-SubTopic 20
-Name Accounting Standards Codification
-Section 45
-Paragraph 1
-Subparagraph (a)
-Publisher FASB
-URI https://asc.fasb.org//1943274/2147479041/842-20-45-1
| Name: |
us-gaap_OperatingLeaseRightOfUseAsset |
| Namespace Prefix: |
us-gaap_ |
| Data Type: |
xbrli:monetaryItemType |
| Balance Type: |
debit |
| Period Type: |
instant |
|
| X |
- DefinitionAmount of assets classified as other. Reference 1: http://www.xbrl.org/2003/role/exampleRef
-Topic 946
-SubTopic 830
-Name Accounting Standards Codification
-Section 55
-Paragraph 12
-Publisher FASB
-URI https://asc.fasb.org//1943274/2147480167/946-830-55-12
Reference 2: http://www.xbrl.org/2003/role/disclosureRef
-Topic 944
-SubTopic 210
-Name Accounting Standards Codification
-Section S99
-Paragraph 1
-Subparagraph (SX 210.7-03(a)(10))
-Publisher FASB
-URI https://asc.fasb.org//1943274/2147479440/944-210-S99-1
Reference 3: http://www.xbrl.org/2003/role/disclosureRef
-Topic 210
-SubTopic 10
-Name Accounting Standards Codification
-Section S99
-Paragraph 1
-Subparagraph (SX 210.5-02(17))
-Publisher FASB
-URI https://asc.fasb.org//1943274/2147480566/210-10-S99-1
Reference 4: http://fasb.org/us-gaap/role/ref/legacyRef
-Topic 942
-SubTopic 210
-Name Accounting Standards Codification
-Section S99
-Paragraph 1
-Subparagraph (SX 210.9-03(10))
-Publisher FASB
-URI https://asc.fasb.org//1943274/2147479853/942-210-S99-1
| Name: |
us-gaap_OtherAssets |
| Namespace Prefix: |
us-gaap_ |
| Data Type: |
xbrli:monetaryItemType |
| Balance Type: |
debit |
| Period Type: |
instant |
|
| X |
- DefinitionAmount of liabilities classified as other. Reference 1: http://www.xbrl.org/2003/role/exampleRef
-Topic 946
-SubTopic 830
-Name Accounting Standards Codification
-Section 55
-Paragraph 12
-Publisher FASB
-URI https://asc.fasb.org//1943274/2147480167/946-830-55-12
Reference 2: http://www.xbrl.org/2003/role/disclosureRef
-Topic 946
-SubTopic 210
-Name Accounting Standards Codification
-Section S99
-Paragraph 1
-Subparagraph (SX 210.6-04(12)(b)(2))
-Publisher FASB
-URI https://asc.fasb.org//1943274/2147479617/946-210-S99-1
Reference 3: http://www.xbrl.org/2003/role/disclosureRef
-Topic 946
-SubTopic 210
-Name Accounting Standards Codification
-Section S99
-Paragraph 1
-Subparagraph (SX 210.6-04(12)(b)(3))
-Publisher FASB
-URI https://asc.fasb.org//1943274/2147479617/946-210-S99-1
Reference 4: http://www.xbrl.org/2003/role/disclosureRef
-Topic 944
-SubTopic 210
-Name Accounting Standards Codification
-Section S99
-Paragraph 1
-Subparagraph (SX 210.7-03(15))
-Publisher FASB
-URI https://asc.fasb.org//1943274/2147479440/944-210-S99-1
Reference 5: http://www.xbrl.org/2009/role/commonPracticeRef
-Topic 946
-SubTopic 210
-Name Accounting Standards Codification
-Section S99
-Paragraph 1
-Subparagraph (SX 210.6-04(12)(b)(1))
-Publisher FASB
-URI https://asc.fasb.org//1943274/2147479617/946-210-S99-1
Reference 6: http://fasb.org/us-gaap/role/ref/legacyRef
-Name Accounting Standards Codification
-Topic 942
-SubTopic 210
-Section S99
-Paragraph 1
-Subparagraph (SX 210.9-03.15)
-Publisher FASB
-URI https://asc.fasb.org//1943274/2147479853/942-210-S99-1
| Name: |
us-gaap_OtherLiabilities |
| Namespace Prefix: |
us-gaap_ |
| Data Type: |
xbrli:monetaryItemType |
| Balance Type: |
credit |
| Period Type: |
instant |
|
| X |
- DefinitionAmount after accumulated depreciation, depletion and amortization of physical assets used in the normal conduct of business to produce goods and services and not intended for resale. Examples include, but are not limited to, land, buildings, machinery and equipment, office equipment, and furniture and fixtures. Reference 1: http://fasb.org/us-gaap/role/ref/legacyRef
-Name Accounting Standards Codification
-Section 50
-Paragraph 1
-SubTopic 10
-Topic 360
-Publisher FASB
-URI https://asc.fasb.org//1943274/2147482099/360-10-50-1
Reference 2: http://www.xbrl.org/2003/role/exampleRef
-Topic 852
-SubTopic 10
-Name Accounting Standards Codification
-Section 55
-Paragraph 10
-Publisher FASB
-URI https://asc.fasb.org//1943274/2147481372/852-10-55-10
Reference 3: http://www.xbrl.org/2003/role/disclosureRef
-Topic 944
-SubTopic 210
-Name Accounting Standards Codification
-Section S99
-Paragraph 1
-Subparagraph (SX 210.7-03(a)(8))
-Publisher FASB
-URI https://asc.fasb.org//1943274/2147479440/944-210-S99-1
Reference 4: http://www.xbrl.org/2003/role/disclosureRef
-Topic 942
-SubTopic 360
-Name Accounting Standards Codification
-Section 50
-Paragraph 1
-Publisher FASB
-URI https://asc.fasb.org//1943274/2147480842/942-360-50-1
| Name: |
us-gaap_PropertyPlantAndEquipmentNet |
| Namespace Prefix: |
us-gaap_ |
| Data Type: |
xbrli:monetaryItemType |
| Balance Type: |
debit |
| Period Type: |
instant |
|
| X |
- DefinitionThe fair value as of the reporting date of noncontrolling interests which are redeemable by the (parent) entity (1) at a fixed or determinable price on a fixed or determinable date, (2) at the option of the holder of the noncontrolling interest, or (3) upon occurrence of an event that is not solely within the control of the (parent) entity. The noncontrolling interest holder's ownership (or holders' ownership) may be in the form of common shares (regardless of class), limited partnership units (regardless of class), non-preferential membership interests, or any other form of common equity regardless of investee entity legal form. Reference 1: http://fasb.org/us-gaap/role/ref/legacyRef
-Name Accounting Standards Codification
-Topic 480
-SubTopic 10
-Subparagraph (12)(c)
-Section S99
-Paragraph 3A
-Publisher FASB
-URI https://asc.fasb.org//1943274/2147480244/480-10-S99-3A
Reference 2: http://fasb.org/us-gaap/role/ref/legacyRef
-Name Accounting Standards Codification
-Topic 480
-SubTopic 10
-Subparagraph 14
-Paragraph 3A
-Section S99
-Publisher FASB
-URI https://asc.fasb.org//1943274/2147480244/480-10-S99-3A
Reference 3: http://fasb.org/us-gaap/role/ref/legacyRef
-Name Accounting Standards Codification
-Topic 480
-SubTopic 10
-Subparagraph 15
-Paragraph 3A
-Section S99
-Publisher FASB
-URI https://asc.fasb.org//1943274/2147480244/480-10-S99-3A
Reference 4: http://fasb.org/us-gaap/role/ref/legacyRef
-Name Accounting Standards Codification
-Topic 480
-SubTopic 10
-Subparagraph (16)(c)
-Paragraph 3A
-Section S99
-Publisher FASB
-URI https://asc.fasb.org//1943274/2147480244/480-10-S99-3A
| Name: |
us-gaap_RedeemableNoncontrollingInterestEquityCommonFairValue |
| Namespace Prefix: |
us-gaap_ |
| Data Type: |
xbrli:monetaryItemType |
| Balance Type: |
credit |
| Period Type: |
instant |
|
| X |
- DefinitionAmount of accumulated undistributed earnings (deficit). Reference 1: http://www.xbrl.org/2003/role/exampleRef
-Topic 852
-SubTopic 10
-Name Accounting Standards Codification
-Section 55
-Paragraph 10
-Publisher FASB
-URI https://asc.fasb.org//1943274/2147481372/852-10-55-10
Reference 2: http://www.xbrl.org/2003/role/disclosureRef
-Topic 944
-SubTopic 40
-Name Accounting Standards Codification
-Section 65
-Paragraph 2
-Subparagraph (g)(2)(i)
-Publisher FASB
-URI https://asc.fasb.org//1943274/2147480016/944-40-65-2
Reference 3: http://www.xbrl.org/2003/role/disclosureRef
-Topic 944
-SubTopic 40
-Name Accounting Standards Codification
-Section 65
-Paragraph 2
-Subparagraph (h)(2)
-Publisher FASB
-URI https://asc.fasb.org//1943274/2147480016/944-40-65-2
Reference 4: http://www.xbrl.org/2003/role/disclosureRef
-Topic 946
-SubTopic 20
-Name Accounting Standards Codification
-Section 50
-Paragraph 11
-Publisher FASB
-URI https://asc.fasb.org//1943274/2147480990/946-20-50-11
Reference 5: http://www.xbrl.org/2003/role/disclosureRef
-Topic 944
-SubTopic 210
-Name Accounting Standards Codification
-Section S99
-Paragraph 1
-Subparagraph (SX 210.7-03(a)(23)(a)(4))
-Publisher FASB
-URI https://asc.fasb.org//1943274/2147479440/944-210-S99-1
Reference 6: http://www.xbrl.org/2003/role/disclosureRef
-Topic 946
-SubTopic 210
-Name Accounting Standards Codification
-Section S99
-Paragraph 1
-Subparagraph (SX 210.6-04(17))
-Publisher FASB
-URI https://asc.fasb.org//1943274/2147479617/946-210-S99-1
Reference 7: http://fasb.org/us-gaap/role/ref/legacyRef
-Topic 505
-SubTopic 10
-Name Accounting Standards Codification
-Section S99
-Paragraph 1
-Subparagraph (SX 210.3-04)
-Publisher FASB
-URI https://asc.fasb.org//1943274/2147480008/505-10-S99-1
Reference 8: http://fasb.org/us-gaap/role/ref/legacyRef
-Topic 210
-SubTopic 10
-Name Accounting Standards Codification
-Section S99
-Paragraph 1
-Subparagraph (SX 210.5-02(30)(a)(3))
-Publisher FASB
-URI https://asc.fasb.org//1943274/2147480566/210-10-S99-1
| Name: |
us-gaap_RetainedEarningsAccumulatedDeficit |
| Namespace Prefix: |
us-gaap_ |
| Data Type: |
xbrli:monetaryItemType |
| Balance Type: |
credit |
| Period Type: |
instant |
|
| X |
- DefinitionAmount of equity (deficit) attributable to parent. Excludes temporary equity and equity attributable to noncontrolling interest. Reference 1: http://www.xbrl.org/2003/role/exampleRef
-Topic 852
-SubTopic 10
-Name Accounting Standards Codification
-Section 55
-Paragraph 10
-Publisher FASB
-URI https://asc.fasb.org//1943274/2147481372/852-10-55-10
Reference 2: http://www.xbrl.org/2003/role/exampleRef
-Topic 946
-SubTopic 830
-Name Accounting Standards Codification
-Section 55
-Paragraph 12
-Publisher FASB
-URI https://asc.fasb.org//1943274/2147480167/946-830-55-12
Reference 3: http://www.xbrl.org/2003/role/disclosureRef
-Topic 946
-SubTopic 210
-Name Accounting Standards Codification
-Section S99
-Paragraph 1
-Subparagraph (SX 210.6-04(19))
-Publisher FASB
-URI https://asc.fasb.org//1943274/2147479617/946-210-S99-1
Reference 4: http://www.xbrl.org/2003/role/disclosureRef
-Topic 946
-SubTopic 210
-Name Accounting Standards Codification
-Section S99
-Paragraph 2
-Subparagraph (SX 210.6-05(4))
-Publisher FASB
-URI https://asc.fasb.org//1943274/2147479617/946-210-S99-2
Reference 5: http://www.xbrl.org/2009/role/commonPracticeRef
-Topic 946
-SubTopic 220
-Name Accounting Standards Codification
-Section S99
-Paragraph 3
-Subparagraph (SX 210.6-09(4)(b))
-Publisher FASB
-URI https://asc.fasb.org//1943274/2147483575/946-220-S99-3
Reference 6: http://www.xbrl.org/2003/role/disclosureRef
-Topic 946
-SubTopic 220
-Name Accounting Standards Codification
-Section S99
-Paragraph 3
-Subparagraph (SX 210.6-09(6))
-Publisher FASB
-URI https://asc.fasb.org//1943274/2147483575/946-220-S99-3
Reference 7: http://www.xbrl.org/2003/role/disclosureRef
-Topic 946
-SubTopic 220
-Name Accounting Standards Codification
-Section S99
-Paragraph 3
-Subparagraph (SX 210.6-09(7))
-Publisher FASB
-URI https://asc.fasb.org//1943274/2147483575/946-220-S99-3
Reference 8: http://www.xbrl.org/2009/role/commonPracticeRef
-Topic 235
-SubTopic 10
-Name Accounting Standards Codification
-Section S99
-Paragraph 1
-Subparagraph (SX 210.4-08(g)(1)(ii))
-Publisher FASB
-URI https://asc.fasb.org//1943274/2147480678/235-10-S99-1
Reference 9: http://www.xbrl.org/2009/role/commonPracticeRef
-Topic 323
-SubTopic 10
-Name Accounting Standards Codification
-Section 50
-Paragraph 3
-Subparagraph (c)
-Publisher FASB
-URI https://asc.fasb.org//1943274/2147481687/323-10-50-3
Reference 10: http://www.xbrl.org/2009/role/commonPracticeRef
-Topic 825
-SubTopic 10
-Name Accounting Standards Codification
-Section 50
-Paragraph 28
-Subparagraph (f)
-Publisher FASB
-URI https://asc.fasb.org//1943274/2147482907/825-10-50-28
Reference 11: http://fasb.org/us-gaap/role/ref/legacyRef
-Topic 210
-SubTopic 10
-Name Accounting Standards Codification
-Section S99
-Paragraph 1
-Subparagraph (SX 210.5-02(29))
-Publisher FASB
-URI https://asc.fasb.org//1943274/2147480566/210-10-S99-1
Reference 12: http://fasb.org/us-gaap/role/ref/legacyRef
-Topic 210
-SubTopic 10
-Name Accounting Standards Codification
-Section S99
-Paragraph 1
-Subparagraph (SX 210.5-02(31))
-Publisher FASB
-URI https://asc.fasb.org//1943274/2147480566/210-10-S99-1
Reference 13: http://fasb.org/us-gaap/role/ref/legacyRef
-Topic 210
-SubTopic 10
-Name Accounting Standards Codification
-Section S99
-Paragraph 1
-Subparagraph (SX 210.5-02(30))
-Publisher FASB
-URI https://asc.fasb.org//1943274/2147480566/210-10-S99-1
Reference 14: http://fasb.org/us-gaap/role/ref/legacyRef
-Topic 310
-SubTopic 10
-Name Accounting Standards Codification
-Section S99
-Paragraph 2
-Subparagraph (SAB Topic 4.E)
-Publisher FASB
-URI https://asc.fasb.org//1943274/2147480418/310-10-S99-2
| Name: |
us-gaap_StockholdersEquity |
| Namespace Prefix: |
us-gaap_ |
| Data Type: |
xbrli:monetaryItemType |
| Balance Type: |
credit |
| Period Type: |
instant |
|
| X |
- References
+ Details
| Name: |
us-gaap_StockholdersEquityAbstract |
| Namespace Prefix: |
us-gaap_ |
| Data Type: |
xbrli:stringItemType |
| Balance Type: |
na |
| Period Type: |
duration |
|
| X |
- DefinitionAmount of equity (deficit) attributable to parent and noncontrolling interest. Excludes temporary equity. Reference 1: http://www.xbrl.org/2003/role/disclosureRef
-Topic 250
-SubTopic 10
-Name Accounting Standards Codification
-Section 45
-Paragraph 24
-Publisher FASB
-URI https://asc.fasb.org//1943274/2147483421/250-10-45-24
Reference 2: http://www.xbrl.org/2003/role/disclosureRef
-Topic 250
-SubTopic 10
-Name Accounting Standards Codification
-Section 45
-Paragraph 23
-Subparagraph (b)
-Publisher FASB
-URI https://asc.fasb.org//1943274/2147483421/250-10-45-23
Reference 3: http://www.xbrl.org/2003/role/disclosureRef
-Topic 250
-SubTopic 10
-Name Accounting Standards Codification
-Section 45
-Paragraph 5
-Subparagraph (b)
-Publisher FASB
-URI https://asc.fasb.org//1943274/2147483421/250-10-45-5
Reference 4: http://www.xbrl.org/2003/role/disclosureRef
-Topic 326
-SubTopic 10
-Name Accounting Standards Codification
-Section 65
-Paragraph 5
-Subparagraph (c)(2)
-Publisher FASB
-URI https://asc.fasb.org//1943274/2147479654/326-10-65-5
Reference 5: http://www.xbrl.org/2003/role/disclosureRef
-Topic 815
-SubTopic 20
-Name Accounting Standards Codification
-Section 65
-Paragraph 6
-Subparagraph (e)
-Publisher FASB
-URI https://asc.fasb.org//1943274/2147480528/815-20-65-6
Reference 6: http://www.xbrl.org/2003/role/disclosureRef
-Topic 815
-SubTopic 20
-Name Accounting Standards Codification
-Section 65
-Paragraph 6
-Subparagraph (h)(1)
-Publisher FASB
-URI https://asc.fasb.org//1943274/2147480528/815-20-65-6
Reference 7: http://www.xbrl.org/2003/role/disclosureRef
-Topic 815
-SubTopic 20
-Name Accounting Standards Codification
-Section 65
-Paragraph 6
-Subparagraph (h)(1)(i)
-Publisher FASB
-URI https://asc.fasb.org//1943274/2147480528/815-20-65-6
Reference 8: http://www.xbrl.org/2003/role/disclosureRef
-Topic 815
-SubTopic 20
-Name Accounting Standards Codification
-Section 65
-Paragraph 6
-Subparagraph (h)(1)(iii)
-Publisher FASB
-URI https://asc.fasb.org//1943274/2147480528/815-20-65-6
Reference 9: http://www.xbrl.org/2003/role/disclosureRef
-Topic 815
-SubTopic 20
-Name Accounting Standards Codification
-Section 65
-Paragraph 6
-Subparagraph (h)(1)(iv)
-Publisher FASB
-URI https://asc.fasb.org//1943274/2147480528/815-20-65-6
Reference 10: http://www.xbrl.org/2003/role/disclosureRef
-Topic 815
-SubTopic 20
-Name Accounting Standards Codification
-Section 65
-Paragraph 6
-Subparagraph (i)(3)
-Publisher FASB
-URI https://asc.fasb.org//1943274/2147480528/815-20-65-6
Reference 11: http://www.xbrl.org/2003/role/disclosureRef
-Topic 848
-SubTopic 10
-Name Accounting Standards Codification
-Section 65
-Paragraph 2
-Subparagraph (a)(3)(iii)(03)
-Publisher FASB
-URI https://asc.fasb.org//1943274/2147483550/848-10-65-2
Reference 12: http://www.xbrl.org/2003/role/disclosureRef
-Topic 105
-SubTopic 10
-Name Accounting Standards Codification
-Section 65
-Paragraph 6
-Subparagraph (c)
-Publisher FASB
-URI https://asc.fasb.org//1943274/2147479343/105-10-65-6
Reference 13: http://www.xbrl.org/2003/role/disclosureRef
-Topic 105
-SubTopic 10
-Name Accounting Standards Codification
-Section 65
-Paragraph 6
-Subparagraph (d)
-Publisher FASB
-URI https://asc.fasb.org//1943274/2147479343/105-10-65-6
Reference 14: http://www.xbrl.org/2003/role/disclosureRef
-Topic 944
-SubTopic 40
-Name Accounting Standards Codification
-Section 65
-Paragraph 2
-Subparagraph (f)(1)
-Publisher FASB
-URI https://asc.fasb.org//1943274/2147480016/944-40-65-2
Reference 15: http://www.xbrl.org/2003/role/disclosureRef
-Topic 944
-SubTopic 40
-Name Accounting Standards Codification
-Section 65
-Paragraph 2
-Subparagraph (f)(2)
-Publisher FASB
-URI https://asc.fasb.org//1943274/2147480016/944-40-65-2
Reference 16: http://www.xbrl.org/2003/role/disclosureRef
-Topic 740
-SubTopic 10
-Name Accounting Standards Codification
-Section 65
-Paragraph 8
-Subparagraph (d)(2)
-Publisher FASB
-URI https://asc.fasb.org//1943274/2147482615/740-10-65-8
Reference 17: http://www.xbrl.org/2003/role/disclosureRef
-Topic 740
-SubTopic 10
-Name Accounting Standards Codification
-Section 65
-Paragraph 8
-Subparagraph (d)(3)
-Publisher FASB
-URI https://asc.fasb.org//1943274/2147482615/740-10-65-8
Reference 18: http://www.xbrl.org/2003/role/disclosureRef
-Topic 326
-SubTopic 10
-Name Accounting Standards Codification
-Section 65
-Paragraph 4
-Subparagraph (d)
-Publisher FASB
-URI https://asc.fasb.org//1943274/2147479654/326-10-65-4
Reference 19: http://www.xbrl.org/2003/role/disclosureRef
-Topic 718
-SubTopic 10
-Name Accounting Standards Codification
-Section 65
-Paragraph 15
-Subparagraph (e)
-Publisher FASB
-URI https://asc.fasb.org//1943274/2147480336/718-10-65-15
Reference 20: http://www.xbrl.org/2003/role/disclosureRef
-Topic 718
-SubTopic 10
-Name Accounting Standards Codification
-Section 65
-Paragraph 15
-Subparagraph (f)(1)
-Publisher FASB
-URI https://asc.fasb.org//1943274/2147480336/718-10-65-15
Reference 21: http://www.xbrl.org/2003/role/disclosureRef
-Topic 718
-SubTopic 10
-Name Accounting Standards Codification
-Section 65
-Paragraph 15
-Subparagraph (f)(2)
-Publisher FASB
-URI https://asc.fasb.org//1943274/2147480336/718-10-65-15
Reference 22: http://www.xbrl.org/2003/role/disclosureRef
-Topic 250
-SubTopic 10
-Name Accounting Standards Codification
-Section 50
-Paragraph 1
-Subparagraph (b)(3)
-Publisher FASB
-URI https://asc.fasb.org//1943274/2147483443/250-10-50-1
Reference 23: http://www.xbrl.org/2003/role/disclosureRef
-Topic 815
-SubTopic 40
-Name Accounting Standards Codification
-Section 65
-Paragraph 1
-Subparagraph (e)(3)
-Publisher FASB
-URI https://asc.fasb.org//1943274/2147480175/815-40-65-1
Reference 24: http://www.xbrl.org/2003/role/disclosureRef
-Topic 250
-SubTopic 10
-Name Accounting Standards Codification
-Section 50
-Paragraph 7
-Subparagraph (b)
-Publisher FASB
-URI https://asc.fasb.org//1943274/2147483443/250-10-50-7
Reference 25: http://www.xbrl.org/2003/role/disclosureRef
-Topic 220
-SubTopic 10
-Name Accounting Standards Codification
-Section 50
-Paragraph 5
-Publisher FASB
-URI https://asc.fasb.org//1943274/2147482765/220-10-50-5
Reference 26: http://www.xbrl.org/2003/role/disclosureRef
-Topic 830
-SubTopic 30
-Name Accounting Standards Codification
-Section 50
-Paragraph 1
-Publisher FASB
-URI https://asc.fasb.org//1943274/2147481674/830-30-50-1
Reference 27: http://www.xbrl.org/2003/role/disclosureRef
-Topic 830
-SubTopic 30
-Name Accounting Standards Codification
-Section 45
-Paragraph 17
-Publisher FASB
-URI https://asc.fasb.org//1943274/2147481694/830-30-45-17
Reference 28: http://www.xbrl.org/2003/role/disclosureRef
-Topic 830
-SubTopic 30
-Name Accounting Standards Codification
-Section 45
-Paragraph 20
-Subparagraph (a)
-Publisher FASB
-URI https://asc.fasb.org//1943274/2147481694/830-30-45-20
Reference 29: http://www.xbrl.org/2003/role/exampleRef
-Topic 946
-SubTopic 830
-Name Accounting Standards Codification
-Section 55
-Paragraph 11
-Publisher FASB
-URI https://asc.fasb.org//1943274/2147480167/946-830-55-11
Reference 30: http://www.xbrl.org/2003/role/disclosureRef
-Topic 946
-SubTopic 205
-Name Accounting Standards Codification
-Section 45
-Paragraph 3
-Publisher FASB
-URI https://asc.fasb.org//1943274/2147480767/946-205-45-3
Reference 31: http://www.xbrl.org/2003/role/disclosureRef
-Topic 946
-SubTopic 505
-Name Accounting Standards Codification
-Section 50
-Paragraph 3
-Publisher FASB
-URI https://asc.fasb.org//1943274/2147481004/946-505-50-3
Reference 32: http://www.xbrl.org/2003/role/disclosureRef
-Topic 946
-SubTopic 210
-Name Accounting Standards Codification
-Section S99
-Paragraph 1
-Subparagraph (SX 210.6-04(19))
-Publisher FASB
-URI https://asc.fasb.org//1943274/2147479617/946-210-S99-1
Reference 33: http://www.xbrl.org/2003/role/disclosureRef
-Topic 946
-SubTopic 210
-Name Accounting Standards Codification
-Section S99
-Paragraph 2
-Subparagraph (SX 210.6-05(4))
-Publisher FASB
-URI https://asc.fasb.org//1943274/2147479617/946-210-S99-2
Reference 34: http://www.xbrl.org/2009/role/commonPracticeRef
-Topic 946
-SubTopic 220
-Name Accounting Standards Codification
-Section S99
-Paragraph 3
-Subparagraph (SX 210.6-09(4)(b))
-Publisher FASB
-URI https://asc.fasb.org//1943274/2147483575/946-220-S99-3
Reference 35: http://www.xbrl.org/2003/role/disclosureRef
-Topic 946
-SubTopic 220
-Name Accounting Standards Codification
-Section S99
-Paragraph 3
-Subparagraph (SX 210.6-09(6))
-Publisher FASB
-URI https://asc.fasb.org//1943274/2147483575/946-220-S99-3
Reference 36: http://www.xbrl.org/2003/role/disclosureRef
-Topic 946
-SubTopic 220
-Name Accounting Standards Codification
-Section S99
-Paragraph 3
-Subparagraph (SX 210.6-09(7))
-Publisher FASB
-URI https://asc.fasb.org//1943274/2147483575/946-220-S99-3
Reference 37: http://www.xbrl.org/2003/role/disclosureRef
-Topic 505
-SubTopic 10
-Name Accounting Standards Codification
-Section S99
-Paragraph 1
-Subparagraph (SX 210.3-04)
-Publisher FASB
-URI https://asc.fasb.org//1943274/2147480008/505-10-S99-1
Reference 38: http://www.xbrl.org/2009/role/commonPracticeRef
-Topic 235
-SubTopic 10
-Name Accounting Standards Codification
-Section S99
-Paragraph 1
-Subparagraph (SX 210.4-08(g)(1)(ii))
-Publisher FASB
-URI https://asc.fasb.org//1943274/2147480678/235-10-S99-1
Reference 39: http://www.xbrl.org/2009/role/commonPracticeRef
-Topic 323
-SubTopic 10
-Name Accounting Standards Codification
-Section 50
-Paragraph 3
-Subparagraph (c)
-Publisher FASB
-URI https://asc.fasb.org//1943274/2147481687/323-10-50-3
Reference 40: http://www.xbrl.org/2009/role/commonPracticeRef
-Topic 825
-SubTopic 10
-Name Accounting Standards Codification
-Section 50
-Paragraph 28
-Subparagraph (f)
-Publisher FASB
-URI https://asc.fasb.org//1943274/2147482907/825-10-50-28
Reference 41: http://fasb.org/us-gaap/role/ref/legacyRef
-Name Accounting Standards Codification
-Topic 810
-SubTopic 10
-Section 45
-Paragraph 15
-Publisher FASB
-URI https://asc.fasb.org//1943274/2147481231/810-10-45-15
Reference 42: http://fasb.org/us-gaap/role/ref/legacyRef
-Name Accounting Standards Codification
-Topic 810
-SubTopic 10
-Section 45
-Paragraph 16
-Publisher FASB
-URI https://asc.fasb.org//1943274/2147481231/810-10-45-16
Reference 43: http://fasb.org/us-gaap/role/ref/legacyRef
-Name Accounting Standards Codification
-Topic 810
-SubTopic 10
-Section 55
-Paragraph 4I
-Publisher FASB
-URI https://asc.fasb.org//1943274/2147481175/810-10-55-4I
| Name: |
us-gaap_StockholdersEquityIncludingPortionAttributableToNoncontrollingInterest |
| Namespace Prefix: |
us-gaap_ |
| Data Type: |
xbrli:monetaryItemType |
| Balance Type: |
credit |
| Period Type: |
instant |
|
| X |
- DefinitionCarrying value as of the balance sheet date of obligations incurred and payable for statutory income, sales, use, payroll, excise, real, property and other taxes. Used to reflect the current portion of the liabilities (due within one year or within the normal operating cycle if longer). Reference 1: http://fasb.org/us-gaap/role/ref/legacyRef
-Name Accounting Standards Codification
-Topic 210
-SubTopic 10
-Section S99
-Paragraph 1
-Subparagraph (SX 210.5-02.19,20)
-Publisher FASB
-URI https://asc.fasb.org//1943274/2147480566/210-10-S99-1
| Name: |
us-gaap_TaxesPayableCurrent |
| Namespace Prefix: |
us-gaap_ |
| Data Type: |
xbrli:monetaryItemType |
| Balance Type: |
credit |
| Period Type: |
instant |
|
| X |
- DefinitionThe amount allocated to treasury stock. Treasury stock is common and preferred shares of an entity that were issued, repurchased by the entity, and are held in its treasury. Reference 1: http://fasb.org/us-gaap/role/ref/legacyRef
-Name Accounting Standards Codification
-Topic 505
-SubTopic 30
-Section 50
-Paragraph 4
-Publisher FASB
-URI https://asc.fasb.org//1943274/2147481520/505-30-50-4
Reference 2: http://fasb.org/us-gaap/role/ref/legacyRef
-Name Accounting Standards Codification
-Topic 505
-SubTopic 30
-Section 45
-Paragraph 1
-Publisher FASB
-URI https://asc.fasb.org//1943274/2147481549/505-30-45-1
Reference 3: http://fasb.org/us-gaap/role/ref/legacyRef
-Name Accounting Standards Codification
-Topic 210
-SubTopic 10
-Section S99
-Paragraph 1
-Subparagraph (SX 210.5-02.29,30)
-Publisher FASB
-URI https://asc.fasb.org//1943274/2147480566/210-10-S99-1
| Name: |
us-gaap_TreasuryStockValue |
| Namespace Prefix: |
us-gaap_ |
| Data Type: |
xbrli:monetaryItemType |
| Balance Type: |
debit |
| Period Type: |
instant |
|
v3.23.2
Condensed Consolidated Statements of Financial Condition - (Parenthetical) (Unaudited) - USD ($)
$ in Thousands |
Jun. 30, 2023 |
Dec. 31, 2022 |
| Investments ($139,197 and $134,925) |
[1] |
$ 188,227
|
$ 172,955
|
| Other assets |
[1] |
29,146
|
20,014
|
| Due to brokers ($630 and $11) |
[1] |
1,257
|
835
|
| Other liabilities and accrued expenses |
[1] |
$ 23,995
|
$ 12,857
|
| Common stock, par value (in dollars per share) |
|
$ 0.01
|
$ 0.01
|
| Common stock, shares authorized (in shares) |
|
500,000,000
|
500,000,000
|
| Common stock, shares issued (in shares) |
|
55,744,666
|
55,051,975
|
| Treasury stock, shares (in shares) |
|
6,617,428
|
6,329,178
|
| Total |
|
|
|
| Investments ($139,197 and $134,925) |
|
$ 139,197
|
$ 134,929
|
| Due from brokers |
|
867
|
38
|
| Other assets |
|
548
|
576
|
| Due to brokers ($630 and $11) |
|
630
|
11
|
| Other liabilities and accrued expenses |
|
$ 626
|
$ 664
|
|
|
| X |
- DefinitionAmount payable to other broker-dealer and clearing organization, including, but not limited to, security failed-to-receive, deposit received for security loaned, open transaction, and floor-brokerage payable. Reference 1: http://www.xbrl.org/2009/role/commonPracticeRef
-Name Rule 15c3-1
-Number 240
-Section 15c3-1
-Publisher SEC
| Name: |
srt_PayablesToBrokerDealersAndClearingOrganizations |
| Namespace Prefix: |
srt_ |
| Data Type: |
xbrli:monetaryItemType |
| Balance Type: |
credit |
| Period Type: |
instant |
|
| X |
- DefinitionFace amount or stated value per share of common stock. Reference 1: http://fasb.org/us-gaap/role/ref/legacyRef
-Topic 210
-SubTopic 10
-Name Accounting Standards Codification
-Section S99
-Paragraph 1
-Subparagraph (SX 210.5-02(29))
-Publisher FASB
-URI https://asc.fasb.org//1943274/2147480566/210-10-S99-1
| Name: |
us-gaap_CommonStockParOrStatedValuePerShare |
| Namespace Prefix: |
us-gaap_ |
| Data Type: |
dtr-types:perShareItemType |
| Balance Type: |
na |
| Period Type: |
instant |
|
| X |
- DefinitionThe maximum number of common shares permitted to be issued by an entity's charter and bylaws. Reference 1: http://www.xbrl.org/2003/role/disclosureRef
-Topic 946
-SubTopic 210
-Name Accounting Standards Codification
-Section S99
-Paragraph 1
-Subparagraph (SX 210.6-04(16)(a))
-Publisher FASB
-URI https://asc.fasb.org//1943274/2147479617/946-210-S99-1
Reference 2: http://fasb.org/us-gaap/role/ref/legacyRef
-Topic 210
-SubTopic 10
-Name Accounting Standards Codification
-Section S99
-Paragraph 1
-Subparagraph (SX 210.5-02(29))
-Publisher FASB
-URI https://asc.fasb.org//1943274/2147480566/210-10-S99-1
| Name: |
us-gaap_CommonStockSharesAuthorized |
| Namespace Prefix: |
us-gaap_ |
| Data Type: |
xbrli:sharesItemType |
| Balance Type: |
na |
| Period Type: |
instant |
|
| X |
- DefinitionTotal number of common shares of an entity that have been sold or granted to shareholders (includes common shares that were issued, repurchased and remain in the treasury). These shares represent capital invested by the firm's shareholders and owners, and may be all or only a portion of the number of shares authorized. Shares issued include shares outstanding and shares held in the treasury. Reference 1: http://fasb.org/us-gaap/role/ref/legacyRef
-Topic 210
-SubTopic 10
-Name Accounting Standards Codification
-Section S99
-Paragraph 1
-Subparagraph (SX 210.5-02(29))
-Publisher FASB
-URI https://asc.fasb.org//1943274/2147480566/210-10-S99-1
| Name: |
us-gaap_CommonStockSharesIssued |
| Namespace Prefix: |
us-gaap_ |
| Data Type: |
xbrli:sharesItemType |
| Balance Type: |
na |
| Period Type: |
instant |
|
| X |
- DefinitionSum of the carrying amounts as of the balance sheet date of all investments. Reference 1: http://www.xbrl.org/2003/role/disclosureRef
-Topic 944
-SubTopic 210
-Name Accounting Standards Codification
-Section S99
-Paragraph 1
-Subparagraph (SX 210.7-03(a)(1)(h))
-Publisher FASB
-URI https://asc.fasb.org//1943274/2147479440/944-210-S99-1
| Name: |
us-gaap_Investments |
| Namespace Prefix: |
us-gaap_ |
| Data Type: |
xbrli:monetaryItemType |
| Balance Type: |
debit |
| Period Type: |
instant |
|
| X |
- DefinitionAmount of assets classified as other. Reference 1: http://www.xbrl.org/2003/role/exampleRef
-Topic 946
-SubTopic 830
-Name Accounting Standards Codification
-Section 55
-Paragraph 12
-Publisher FASB
-URI https://asc.fasb.org//1943274/2147480167/946-830-55-12
Reference 2: http://www.xbrl.org/2003/role/disclosureRef
-Topic 944
-SubTopic 210
-Name Accounting Standards Codification
-Section S99
-Paragraph 1
-Subparagraph (SX 210.7-03(a)(10))
-Publisher FASB
-URI https://asc.fasb.org//1943274/2147479440/944-210-S99-1
Reference 3: http://www.xbrl.org/2003/role/disclosureRef
-Topic 210
-SubTopic 10
-Name Accounting Standards Codification
-Section S99
-Paragraph 1
-Subparagraph (SX 210.5-02(17))
-Publisher FASB
-URI https://asc.fasb.org//1943274/2147480566/210-10-S99-1
Reference 4: http://fasb.org/us-gaap/role/ref/legacyRef
-Topic 942
-SubTopic 210
-Name Accounting Standards Codification
-Section S99
-Paragraph 1
-Subparagraph (SX 210.9-03(10))
-Publisher FASB
-URI https://asc.fasb.org//1943274/2147479853/942-210-S99-1
| Name: |
us-gaap_OtherAssets |
| Namespace Prefix: |
us-gaap_ |
| Data Type: |
xbrli:monetaryItemType |
| Balance Type: |
debit |
| Period Type: |
instant |
|
| X |
- DefinitionAmount of liabilities classified as other. Reference 1: http://www.xbrl.org/2003/role/exampleRef
-Topic 946
-SubTopic 830
-Name Accounting Standards Codification
-Section 55
-Paragraph 12
-Publisher FASB
-URI https://asc.fasb.org//1943274/2147480167/946-830-55-12
Reference 2: http://www.xbrl.org/2003/role/disclosureRef
-Topic 946
-SubTopic 210
-Name Accounting Standards Codification
-Section S99
-Paragraph 1
-Subparagraph (SX 210.6-04(12)(b)(2))
-Publisher FASB
-URI https://asc.fasb.org//1943274/2147479617/946-210-S99-1
Reference 3: http://www.xbrl.org/2003/role/disclosureRef
-Topic 946
-SubTopic 210
-Name Accounting Standards Codification
-Section S99
-Paragraph 1
-Subparagraph (SX 210.6-04(12)(b)(3))
-Publisher FASB
-URI https://asc.fasb.org//1943274/2147479617/946-210-S99-1
Reference 4: http://www.xbrl.org/2003/role/disclosureRef
-Topic 944
-SubTopic 210
-Name Accounting Standards Codification
-Section S99
-Paragraph 1
-Subparagraph (SX 210.7-03(15))
-Publisher FASB
-URI https://asc.fasb.org//1943274/2147479440/944-210-S99-1
Reference 5: http://www.xbrl.org/2009/role/commonPracticeRef
-Topic 946
-SubTopic 210
-Name Accounting Standards Codification
-Section S99
-Paragraph 1
-Subparagraph (SX 210.6-04(12)(b)(1))
-Publisher FASB
-URI https://asc.fasb.org//1943274/2147479617/946-210-S99-1
Reference 6: http://fasb.org/us-gaap/role/ref/legacyRef
-Name Accounting Standards Codification
-Topic 942
-SubTopic 210
-Section S99
-Paragraph 1
-Subparagraph (SX 210.9-03.15)
-Publisher FASB
-URI https://asc.fasb.org//1943274/2147479853/942-210-S99-1
| Name: |
us-gaap_OtherLiabilities |
| Namespace Prefix: |
us-gaap_ |
| Data Type: |
xbrli:monetaryItemType |
| Balance Type: |
credit |
| Period Type: |
instant |
|
| X |
- DefinitionAmount receivable from broker-dealers and clearing organizations, including, but not limited to, securities failed-to-deliver, certain deposits for securities borrowed, open transactions, good faith and margin deposits, commissions and floor brokerage receivables. Reference 1: http://fasb.org/us-gaap/role/ref/legacyRef
-Name Accounting Standards Codification
-Section 45
-Paragraph 3
-SubTopic 20
-Topic 940
-Publisher FASB
-URI https://asc.fasb.org//1943274/2147481833/940-20-45-3
| Name: |
us-gaap_ReceivablesFromBrokersDealersAndClearingOrganizations |
| Namespace Prefix: |
us-gaap_ |
| Data Type: |
xbrli:monetaryItemType |
| Balance Type: |
debit |
| Period Type: |
instant |
|
| X |
- DefinitionNumber of previously issued common shares repurchased by the issuing entity and held in treasury. Reference 1: http://fasb.org/us-gaap/role/ref/legacyRef
-Name Accounting Standards Codification
-Topic 505
-SubTopic 30
-Section 45
-Paragraph 1
-Publisher FASB
-URI https://asc.fasb.org//1943274/2147481549/505-30-45-1
| Name: |
us-gaap_TreasuryStockCommonShares |
| Namespace Prefix: |
us-gaap_ |
| Data Type: |
xbrli:sharesItemType |
| Balance Type: |
na |
| Period Type: |
instant |
|
| X |
- Details
| Name: |
srt_ConsolidatedEntitiesAxis=cns_GLISICAVGRPCIPSICAVGREandSICAVRAPMember |
| Namespace Prefix: |
|
| Data Type: |
na |
| Balance Type: |
|
| Period Type: |
|
|
v3.23.2
Condensed Consolidated Statements of Operations (Unaudited) - USD ($)
shares in Thousands, $ in Thousands |
3 Months Ended |
6 Months Ended |
Jun. 30, 2023 |
Jun. 30, 2022 |
Jun. 30, 2023 |
Jun. 30, 2022 |
| Revenue: |
|
|
|
|
| Total revenue |
$ 120,630
|
$ 147,431
|
$ 246,712
|
$ 301,620
|
| Expenses: |
|
|
|
|
| Employee compensation and benefits |
48,893
|
53,857
|
97,750
|
108,600
|
| Distribution and service fees |
13,329
|
18,236
|
27,545
|
52,187
|
| General and administrative |
16,728
|
13,238
|
33,850
|
26,748
|
| Depreciation and amortization |
839
|
1,106
|
1,827
|
2,100
|
| Total expenses |
79,789
|
86,437
|
160,972
|
189,635
|
| Operating income |
40,841
|
60,994
|
85,740
|
111,985
|
| Non-operating income (loss): |
|
|
|
|
| Interest and dividend income—net |
3,428
|
1,888
|
6,644
|
2,785
|
| Gain (loss) from investments—net |
356
|
(28,573)
|
48
|
(25,006)
|
| Foreign currency gain (loss)—net |
(1,134)
|
1,683
|
(2,410)
|
2,329
|
| Total non-operating income (loss) |
2,650
|
(25,002)
|
4,282
|
(19,892)
|
| Income before provision for income taxes |
43,491
|
35,992
|
90,022
|
92,093
|
| Provision for income taxes |
10,986
|
9,843
|
21,219
|
19,103
|
| Net income |
32,505
|
26,149
|
68,803
|
72,990
|
| Net (income) loss attributable to noncontrolling interests |
(727)
|
25,807
|
(1,711)
|
20,984
|
| Net income attributable to common stockholders |
$ 31,778
|
$ 51,956
|
$ 67,092
|
$ 93,974
|
| Earnings per share attributable to common stockholders: |
|
|
|
|
| Basic (in dollars per share) |
$ 0.64
|
$ 1.06
|
$ 1.36
|
$ 1.93
|
| Diluted (in dollars per share) |
$ 0.64
|
$ 1.06
|
$ 1.36
|
$ 1.91
|
| Weighted average shares outstanding: |
|
|
|
|
| Basic (shares) |
49,315
|
48,805
|
49,257
|
48,739
|
| Diluted (shares) |
49,463
|
49,208
|
49,433
|
49,272
|
| Investment advisory and administration fees |
|
|
|
|
| Revenue: |
|
|
|
|
| Total revenue |
$ 113,118
|
$ 137,655
|
$ 231,152
|
$ 281,324
|
| Distribution and service fees |
|
|
|
|
| Revenue: |
|
|
|
|
| Total revenue |
6,977
|
9,005
|
14,539
|
18,874
|
| Other |
|
|
|
|
| Revenue: |
|
|
|
|
| Total revenue |
$ 535
|
$ 771
|
$ 1,021
|
$ 1,422
|
| X |
- DefinitionThe aggregate expense recognized in the current period that allocates the cost of tangible assets, intangible assets, or depleting assets to periods that benefit from use of the assets. Reference 1: http://fasb.org/us-gaap/role/ref/legacyRef
-Name Accounting Standards Codification
-Section 45
-Paragraph 28
-Subparagraph (b)
-SubTopic 10
-Topic 230
-Publisher FASB
-URI https://asc.fasb.org//1943274/2147482740/230-10-45-28
Reference 2: http://www.xbrl.org/2003/role/disclosureRef
-Topic 280
-SubTopic 10
-Name Accounting Standards Codification
-Section 50
-Paragraph 22
-Subparagraph (e)
-Publisher FASB
-URI https://asc.fasb.org//1943274/2147482810/280-10-50-22
| Name: |
us-gaap_DepreciationDepletionAndAmortization |
| Namespace Prefix: |
us-gaap_ |
| Data Type: |
xbrli:monetaryItemType |
| Balance Type: |
debit |
| Period Type: |
duration |
|
| X |
- References
+ Details
| Name: |
us-gaap_EarningsPerShareAbstract |
| Namespace Prefix: |
us-gaap_ |
| Data Type: |
xbrli:stringItemType |
| Balance Type: |
na |
| Period Type: |
duration |
|
| X |
- DefinitionThe amount of net income (loss) for the period per each share of common stock or unit outstanding during the reporting period. Reference 1: http://www.xbrl.org/2003/role/disclosureRef
-Topic 250
-SubTopic 10
-Name Accounting Standards Codification
-Section 50
-Paragraph 3
-Publisher FASB
-URI https://asc.fasb.org//1943274/2147483443/250-10-50-3
Reference 2: http://www.xbrl.org/2003/role/disclosureRef
-Topic 260
-SubTopic 10
-Name Accounting Standards Codification
-Section 55
-Paragraph 15
-Publisher FASB
-URI https://asc.fasb.org//1943274/2147482635/260-10-55-15
Reference 3: http://www.xbrl.org/2003/role/disclosureRef
-Topic 815
-SubTopic 40
-Name Accounting Standards Codification
-Section 65
-Paragraph 1
-Subparagraph (e)(4)
-Publisher FASB
-URI https://asc.fasb.org//1943274/2147480175/815-40-65-1
Reference 4: http://www.xbrl.org/2003/role/disclosureRef
-Topic 815
-SubTopic 40
-Name Accounting Standards Codification
-Section 65
-Paragraph 1
-Subparagraph (f)
-Publisher FASB
-URI https://asc.fasb.org//1943274/2147480175/815-40-65-1
Reference 5: http://www.xbrl.org/2003/role/disclosureRef
-Topic 250
-SubTopic 10
-Name Accounting Standards Codification
-Section 50
-Paragraph 11
-Subparagraph (a)
-Publisher FASB
-URI https://asc.fasb.org//1943274/2147483443/250-10-50-11
Reference 6: http://www.xbrl.org/2003/role/disclosureRef
-Topic 250
-SubTopic 10
-Name Accounting Standards Codification
-Section 50
-Paragraph 11
-Subparagraph (b)
-Publisher FASB
-URI https://asc.fasb.org//1943274/2147483443/250-10-50-11
Reference 7: http://www.xbrl.org/2003/role/disclosureRef
-Topic 250
-SubTopic 10
-Name Accounting Standards Codification
-Section 50
-Paragraph 7
-Subparagraph (a)
-Publisher FASB
-URI https://asc.fasb.org//1943274/2147483443/250-10-50-7
Reference 8: http://www.xbrl.org/2003/role/disclosureRef
-Topic 260
-SubTopic 10
-Name Accounting Standards Codification
-Section 45
-Paragraph 2
-Publisher FASB
-URI https://asc.fasb.org//1943274/2147482689/260-10-45-2
Reference 9: http://www.xbrl.org/2003/role/disclosureRef
-Topic 260
-SubTopic 10
-Name Accounting Standards Codification
-Section 45
-Paragraph 60B
-Subparagraph (d)
-Publisher FASB
-URI https://asc.fasb.org//1943274/2147482689/260-10-45-60B
Reference 10: http://www.xbrl.org/2003/role/disclosureRef
-Topic 250
-SubTopic 10
-Name Accounting Standards Codification
-Section 50
-Paragraph 4
-Publisher FASB
-URI https://asc.fasb.org//1943274/2147483443/250-10-50-4
Reference 11: http://www.xbrl.org/2003/role/disclosureRef
-Topic 260
-SubTopic 10
-Name Accounting Standards Codification
-Section 50
-Paragraph 1
-Subparagraph (a)
-Publisher FASB
-URI https://asc.fasb.org//1943274/2147482662/260-10-50-1
Reference 12: http://www.xbrl.org/2003/role/disclosureRef
-Topic 260
-SubTopic 10
-Name Accounting Standards Codification
-Section 45
-Paragraph 10
-Publisher FASB
-URI https://asc.fasb.org//1943274/2147482689/260-10-45-10
Reference 13: http://www.xbrl.org/2003/role/disclosureRef
-Topic 220
-SubTopic 10
-Name Accounting Standards Codification
-Section S99
-Paragraph 2
-Subparagraph (SX 210.5-03(25))
-Publisher FASB
-URI https://asc.fasb.org//1943274/2147483621/220-10-S99-2
Reference 14: http://www.xbrl.org/2003/role/disclosureRef
-Topic 942
-SubTopic 220
-Name Accounting Standards Codification
-Section S99
-Paragraph 1
-Subparagraph (SX 210.9-04(27))
-Publisher FASB
-URI https://asc.fasb.org//1943274/2147483589/942-220-S99-1
Reference 15: http://www.xbrl.org/2003/role/disclosureRef
-Topic 944
-SubTopic 220
-Name Accounting Standards Codification
-Section S99
-Paragraph 1
-Subparagraph (SX 210.7-04(23))
-Publisher FASB
-URI https://asc.fasb.org//1943274/2147483586/944-220-S99-1
Reference 16: http://www.xbrl.org/2003/role/exampleRef
-Topic 260
-SubTopic 10
-Name Accounting Standards Codification
-Section 55
-Paragraph 52
-Publisher FASB
-URI https://asc.fasb.org//1943274/2147482635/260-10-55-52
Reference 17: http://www.xbrl.org/2003/role/disclosureRef
-Topic 260
-SubTopic 10
-Name Accounting Standards Codification
-Section 45
-Paragraph 7
-Publisher FASB
-URI https://asc.fasb.org//1943274/2147482689/260-10-45-7
| Name: |
us-gaap_EarningsPerShareBasic |
| Namespace Prefix: |
us-gaap_ |
| Data Type: |
dtr-types:perShareItemType |
| Balance Type: |
na |
| Period Type: |
duration |
|
| X |
- DefinitionThe amount of net income (loss) for the period available to each share of common stock or common unit outstanding during the reporting period and to each share or unit that would have been outstanding assuming the issuance of common shares or units for all dilutive potential common shares or units outstanding during the reporting period. Reference 1: http://www.xbrl.org/2003/role/disclosureRef
-Topic 250
-SubTopic 10
-Name Accounting Standards Codification
-Section 50
-Paragraph 3
-Publisher FASB
-URI https://asc.fasb.org//1943274/2147483443/250-10-50-3
Reference 2: http://www.xbrl.org/2003/role/disclosureRef
-Topic 260
-SubTopic 10
-Name Accounting Standards Codification
-Section 55
-Paragraph 15
-Publisher FASB
-URI https://asc.fasb.org//1943274/2147482635/260-10-55-15
Reference 3: http://www.xbrl.org/2003/role/disclosureRef
-Topic 815
-SubTopic 40
-Name Accounting Standards Codification
-Section 65
-Paragraph 1
-Subparagraph (e)(4)
-Publisher FASB
-URI https://asc.fasb.org//1943274/2147480175/815-40-65-1
Reference 4: http://www.xbrl.org/2003/role/disclosureRef
-Topic 815
-SubTopic 40
-Name Accounting Standards Codification
-Section 65
-Paragraph 1
-Subparagraph (f)
-Publisher FASB
-URI https://asc.fasb.org//1943274/2147480175/815-40-65-1
Reference 5: http://www.xbrl.org/2003/role/disclosureRef
-Topic 250
-SubTopic 10
-Name Accounting Standards Codification
-Section 50
-Paragraph 11
-Subparagraph (a)
-Publisher FASB
-URI https://asc.fasb.org//1943274/2147483443/250-10-50-11
Reference 6: http://www.xbrl.org/2003/role/disclosureRef
-Topic 250
-SubTopic 10
-Name Accounting Standards Codification
-Section 50
-Paragraph 11
-Subparagraph (b)
-Publisher FASB
-URI https://asc.fasb.org//1943274/2147483443/250-10-50-11
Reference 7: http://www.xbrl.org/2003/role/disclosureRef
-Topic 250
-SubTopic 10
-Name Accounting Standards Codification
-Section 50
-Paragraph 7
-Subparagraph (a)
-Publisher FASB
-URI https://asc.fasb.org//1943274/2147483443/250-10-50-7
Reference 8: http://www.xbrl.org/2003/role/disclosureRef
-Topic 260
-SubTopic 10
-Name Accounting Standards Codification
-Section 45
-Paragraph 2
-Publisher FASB
-URI https://asc.fasb.org//1943274/2147482689/260-10-45-2
Reference 9: http://www.xbrl.org/2003/role/disclosureRef
-Topic 260
-SubTopic 10
-Name Accounting Standards Codification
-Section 45
-Paragraph 60B
-Subparagraph (d)
-Publisher FASB
-URI https://asc.fasb.org//1943274/2147482689/260-10-45-60B
Reference 10: http://www.xbrl.org/2003/role/disclosureRef
-Topic 250
-SubTopic 10
-Name Accounting Standards Codification
-Section 50
-Paragraph 4
-Publisher FASB
-URI https://asc.fasb.org//1943274/2147483443/250-10-50-4
Reference 11: http://www.xbrl.org/2003/role/disclosureRef
-Topic 260
-SubTopic 10
-Name Accounting Standards Codification
-Section 50
-Paragraph 1
-Subparagraph (a)
-Publisher FASB
-URI https://asc.fasb.org//1943274/2147482662/260-10-50-1
Reference 12: http://www.xbrl.org/2003/role/disclosureRef
-Topic 220
-SubTopic 10
-Name Accounting Standards Codification
-Section S99
-Paragraph 2
-Subparagraph (SX 210.5-03(25))
-Publisher FASB
-URI https://asc.fasb.org//1943274/2147483621/220-10-S99-2
Reference 13: http://www.xbrl.org/2003/role/disclosureRef
-Topic 942
-SubTopic 220
-Name Accounting Standards Codification
-Section S99
-Paragraph 1
-Subparagraph (SX 210.9-04(27))
-Publisher FASB
-URI https://asc.fasb.org//1943274/2147483589/942-220-S99-1
Reference 14: http://www.xbrl.org/2003/role/disclosureRef
-Topic 944
-SubTopic 220
-Name Accounting Standards Codification
-Section S99
-Paragraph 1
-Subparagraph (SX 210.7-04(23))
-Publisher FASB
-URI https://asc.fasb.org//1943274/2147483586/944-220-S99-1
Reference 15: http://www.xbrl.org/2003/role/exampleRef
-Topic 260
-SubTopic 10
-Name Accounting Standards Codification
-Section 55
-Paragraph 52
-Publisher FASB
-URI https://asc.fasb.org//1943274/2147482635/260-10-55-52
Reference 16: http://www.xbrl.org/2003/role/disclosureRef
-Topic 260
-SubTopic 10
-Name Accounting Standards Codification
-Section 45
-Paragraph 7
-Publisher FASB
-URI https://asc.fasb.org//1943274/2147482689/260-10-45-7
| Name: |
us-gaap_EarningsPerShareDiluted |
| Namespace Prefix: |
us-gaap_ |
| Data Type: |
dtr-types:perShareItemType |
| Balance Type: |
na |
| Period Type: |
duration |
|
| X |
- DefinitionAmount of realized and unrealized gain (loss) on investment. Reference 1: http://www.xbrl.org/2003/role/recommendedDisclosureRef
-Topic 230
-SubTopic 10
-Name Accounting Standards Codification
-Section 45
-Paragraph 28
-Subparagraph (b)
-Publisher FASB
-URI https://asc.fasb.org//1943274/2147482740/230-10-45-28
Reference 2: http://fasb.org/us-gaap/role/ref/legacyRef
-Topic 220
-SubTopic 10
-Name Accounting Standards Codification
-Section S99
-Paragraph 2
-Subparagraph (SX 210.5-03.7(c),9(a))
-Publisher FASB
-URI https://asc.fasb.org//1943274/2147483621/220-10-S99-2
| Name: |
us-gaap_GainLossOnInvestments |
| Namespace Prefix: |
us-gaap_ |
| Data Type: |
xbrli:monetaryItemType |
| Balance Type: |
credit |
| Period Type: |
duration |
|
| X |
- DefinitionThe aggregate total of expenses of managing and administering the affairs of an entity, including affiliates of the reporting entity, which are not directly or indirectly associated with the manufacture, sale or creation of a product or product line. Reference 1: http://www.xbrl.org/2003/role/disclosureRef
-Topic 946
-SubTopic 220
-Name Accounting Standards Codification
-Section S99
-Paragraph 1
-Subparagraph (SX 210.6-07(2)(a))
-Publisher FASB
-URI https://asc.fasb.org//1943274/2147483575/946-220-S99-1
Reference 2: http://fasb.org/us-gaap/role/ref/legacyRef
-Topic 220
-SubTopic 10
-Name Accounting Standards Codification
-Section S99
-Paragraph 2
-Subparagraph (SX 210.5-03.4)
-Publisher FASB
-URI https://asc.fasb.org//1943274/2147483621/220-10-S99-2
| Name: |
us-gaap_GeneralAndAdministrativeExpense |
| Namespace Prefix: |
us-gaap_ |
| Data Type: |
xbrli:monetaryItemType |
| Balance Type: |
debit |
| Period Type: |
duration |
|
| X |
- DefinitionAmount before accretion (amortization) of purchase discount (premium) of interest income and dividend income on nonoperating securities. Reference 1: http://fasb.org/us-gaap/role/ref/legacyRef
-Topic 220
-SubTopic 10
-Name Accounting Standards Codification
-Section S99
-Paragraph 2
-Subparagraph (SX 210.5-03.7(a),(b))
-Publisher FASB
-URI https://asc.fasb.org//1943274/2147483621/220-10-S99-2
| Name: |
us-gaap_InvestmentIncomeInterestAndDividend |
| Namespace Prefix: |
us-gaap_ |
| Data Type: |
xbrli:monetaryItemType |
| Balance Type: |
credit |
| Period Type: |
duration |
|
| X |
- DefinitionThe portion of profit or loss for the period, net of income taxes, which is attributable to the parent. Reference 1: http://www.xbrl.org/2003/role/disclosureRef
-Topic 235
-SubTopic 10
-Name Accounting Standards Codification
-Section S99
-Paragraph 1
-Subparagraph (SX 210.4-08(g)(1)(ii))
-Publisher FASB
-URI https://asc.fasb.org//1943274/2147480678/235-10-S99-1
Reference 2: http://www.xbrl.org/2003/role/disclosureRef
-Topic 323
-SubTopic 10
-Name Accounting Standards Codification
-Section 50
-Paragraph 3
-Subparagraph (c)
-Publisher FASB
-URI https://asc.fasb.org//1943274/2147481687/323-10-50-3
Reference 3: http://www.xbrl.org/2003/role/disclosureRef
-Topic 825
-SubTopic 10
-Name Accounting Standards Codification
-Section 50
-Paragraph 28
-Subparagraph (f)
-Publisher FASB
-URI https://asc.fasb.org//1943274/2147482907/825-10-50-28
Reference 4: http://www.xbrl.org/2003/role/disclosureRef
-Topic 220
-SubTopic 10
-Name Accounting Standards Codification
-Section 50
-Paragraph 6
-Publisher FASB
-URI https://asc.fasb.org//1943274/2147482765/220-10-50-6
Reference 5: http://www.xbrl.org/2003/role/disclosureRef
-Topic 250
-SubTopic 10
-Name Accounting Standards Codification
-Section 50
-Paragraph 3
-Publisher FASB
-URI https://asc.fasb.org//1943274/2147483443/250-10-50-3
Reference 6: http://www.xbrl.org/2003/role/disclosureRef
-Topic 250
-SubTopic 10
-Name Accounting Standards Codification
-Section 50
-Paragraph 1
-Subparagraph (b)(2)
-Publisher FASB
-URI https://asc.fasb.org//1943274/2147483443/250-10-50-1
Reference 7: http://www.xbrl.org/2003/role/disclosureRef
-Topic 815
-SubTopic 40
-Name Accounting Standards Codification
-Section 65
-Paragraph 1
-Subparagraph (f)
-Publisher FASB
-URI https://asc.fasb.org//1943274/2147480175/815-40-65-1
Reference 8: http://www.xbrl.org/2003/role/disclosureRef
-Topic 250
-SubTopic 10
-Name Accounting Standards Codification
-Section 50
-Paragraph 8
-Publisher FASB
-URI https://asc.fasb.org//1943274/2147483443/250-10-50-8
Reference 9: http://www.xbrl.org/2003/role/disclosureRef
-Topic 250
-SubTopic 10
-Name Accounting Standards Codification
-Section 50
-Paragraph 9
-Publisher FASB
-URI https://asc.fasb.org//1943274/2147483443/250-10-50-9
Reference 10: http://www.xbrl.org/2003/role/disclosureRef
-Topic 250
-SubTopic 10
-Name Accounting Standards Codification
-Section 50
-Paragraph 11
-Subparagraph (a)
-Publisher FASB
-URI https://asc.fasb.org//1943274/2147483443/250-10-50-11
Reference 11: http://www.xbrl.org/2003/role/disclosureRef
-Topic 250
-SubTopic 10
-Name Accounting Standards Codification
-Section 50
-Paragraph 11
-Subparagraph (b)
-Publisher FASB
-URI https://asc.fasb.org//1943274/2147483443/250-10-50-11
Reference 12: http://www.xbrl.org/2003/role/disclosureRef
-Topic 250
-SubTopic 10
-Name Accounting Standards Codification
-Section 50
-Paragraph 4
-Publisher FASB
-URI https://asc.fasb.org//1943274/2147483443/250-10-50-4
Reference 13: http://www.xbrl.org/2003/role/exampleRef
-Topic 946
-SubTopic 830
-Name Accounting Standards Codification
-Section 55
-Paragraph 10
-Publisher FASB
-URI https://asc.fasb.org//1943274/2147480167/946-830-55-10
Reference 14: http://www.xbrl.org/2003/role/disclosureRef
-Topic 946
-SubTopic 220
-Name Accounting Standards Codification
-Section 45
-Paragraph 7
-Publisher FASB
-URI https://asc.fasb.org//1943274/2147483581/946-220-45-7
Reference 15: http://www.xbrl.org/2003/role/disclosureRef
-Topic 944
-SubTopic 220
-Name Accounting Standards Codification
-Section S99
-Paragraph 1
-Subparagraph (SX 210.7-04(18))
-Publisher FASB
-URI https://asc.fasb.org//1943274/2147483586/944-220-S99-1
Reference 16: http://www.xbrl.org/2003/role/disclosureRef
-Topic 280
-SubTopic 10
-Name Accounting Standards Codification
-Section 50
-Paragraph 22
-Publisher FASB
-URI https://asc.fasb.org//1943274/2147482810/280-10-50-22
Reference 17: http://www.xbrl.org/2003/role/disclosureRef
-Topic 946
-SubTopic 220
-Name Accounting Standards Codification
-Section S99
-Paragraph 1
-Subparagraph (SX 210.6-07(9))
-Publisher FASB
-URI https://asc.fasb.org//1943274/2147483575/946-220-S99-1
Reference 18: http://www.xbrl.org/2003/role/disclosureRef
-Topic 946
-SubTopic 220
-Name Accounting Standards Codification
-Section S99
-Paragraph 3
-Subparagraph (SX 210.6-09(1)(d))
-Publisher FASB
-URI https://asc.fasb.org//1943274/2147483575/946-220-S99-3
Reference 19: http://www.xbrl.org/2003/role/disclosureRef
-Topic 470
-SubTopic 10
-Name Accounting Standards Codification
-Section S99
-Paragraph 1A
-Subparagraph (SX 210.13-01(a)(4)(i))
-Publisher FASB
-URI https://asc.fasb.org//1943274/2147480097/470-10-S99-1A
Reference 20: http://www.xbrl.org/2009/role/commonPracticeRef
-Topic 470
-SubTopic 10
-Name Accounting Standards Codification
-Section S99
-Paragraph 1A
-Subparagraph (SX 210.13-01(a)(4)(ii))
-Publisher FASB
-URI https://asc.fasb.org//1943274/2147480097/470-10-S99-1A
Reference 21: http://www.xbrl.org/2003/role/disclosureRef
-Topic 470
-SubTopic 10
-Name Accounting Standards Codification
-Section S99
-Paragraph 1A
-Subparagraph (SX 210.13-01(a)(4)(iii)(A))
-Publisher FASB
-URI https://asc.fasb.org//1943274/2147480097/470-10-S99-1A
Reference 22: http://www.xbrl.org/2003/role/disclosureRef
-Topic 470
-SubTopic 10
-Name Accounting Standards Codification
-Section S99
-Paragraph 1A
-Subparagraph (SX 210.13-01(a)(4)(iv))
-Publisher FASB
-URI https://asc.fasb.org//1943274/2147480097/470-10-S99-1A
Reference 23: http://www.xbrl.org/2003/role/disclosureRef
-Topic 470
-SubTopic 10
-Name Accounting Standards Codification
-Section S99
-Paragraph 1A
-Subparagraph (SX 210.13-01(a)(5))
-Publisher FASB
-URI https://asc.fasb.org//1943274/2147480097/470-10-S99-1A
Reference 24: http://www.xbrl.org/2003/role/disclosureRef
-Topic 470
-SubTopic 10
-Name Accounting Standards Codification
-Section S99
-Paragraph 1B
-Subparagraph (SX 210.13-02(a)(4)(i))
-Publisher FASB
-URI https://asc.fasb.org//1943274/2147480097/470-10-S99-1B
Reference 25: http://www.xbrl.org/2003/role/disclosureRef
-Topic 470
-SubTopic 10
-Name Accounting Standards Codification
-Section S99
-Paragraph 1B
-Subparagraph (SX 210.13-02(a)(4)(iii)(A))
-Publisher FASB
-URI https://asc.fasb.org//1943274/2147480097/470-10-S99-1B
Reference 26: http://www.xbrl.org/2003/role/disclosureRef
-Topic 470
-SubTopic 10
-Name Accounting Standards Codification
-Section S99
-Paragraph 1B
-Subparagraph (SX 210.13-02(a)(4)(iii)(B))
-Publisher FASB
-URI https://asc.fasb.org//1943274/2147480097/470-10-S99-1B
Reference 27: http://www.xbrl.org/2003/role/disclosureRef
-Topic 470
-SubTopic 10
-Name Accounting Standards Codification
-Section S99
-Paragraph 1B
-Subparagraph (SX 210.13-02(a)(4)(iv))
-Publisher FASB
-URI https://asc.fasb.org//1943274/2147480097/470-10-S99-1B
Reference 28: http://www.xbrl.org/2003/role/disclosureRef
-Topic 470
-SubTopic 10
-Name Accounting Standards Codification
-Section S99
-Paragraph 1B
-Subparagraph (SX 210.13-02(a)(5))
-Publisher FASB
-URI https://asc.fasb.org//1943274/2147480097/470-10-S99-1B
Reference 29: http://www.xbrl.org/2003/role/disclosureRef
-Topic 280
-SubTopic 10
-Name Accounting Standards Codification
-Section 50
-Paragraph 30
-Subparagraph (b)
-Publisher FASB
-URI https://asc.fasb.org//1943274/2147482810/280-10-50-30
Reference 30: http://www.xbrl.org/2003/role/disclosureRef
-Topic 280
-SubTopic 10
-Name Accounting Standards Codification
-Section 50
-Paragraph 32
-Subparagraph (f)
-Publisher FASB
-URI https://asc.fasb.org//1943274/2147482810/280-10-50-32
Reference 31: http://www.xbrl.org/2003/role/disclosureRef
-Topic 260
-SubTopic 10
-Name Accounting Standards Codification
-Section 45
-Paragraph 60B
-Subparagraph (a)
-Publisher FASB
-URI https://asc.fasb.org//1943274/2147482689/260-10-45-60B
Reference 32: http://www.xbrl.org/2003/role/exampleRef
-Topic 280
-SubTopic 10
-Name Accounting Standards Codification
-Section 50
-Paragraph 31
-Publisher FASB
-URI https://asc.fasb.org//1943274/2147482810/280-10-50-31
Reference 33: http://www.xbrl.org/2003/role/disclosureRef
-Topic 280
-SubTopic 10
-Name Accounting Standards Codification
-Section 50
-Paragraph 32
-Subparagraph (c)
-Publisher FASB
-URI https://asc.fasb.org//1943274/2147482810/280-10-50-32
Reference 34: http://www.xbrl.org/2003/role/disclosureRef
-Topic 205
-SubTopic 20
-Name Accounting Standards Codification
-Section 50
-Paragraph 7
-Publisher FASB
-URI https://asc.fasb.org//1943274/2147483499/205-20-50-7
Reference 35: http://fasb.org/us-gaap/role/ref/legacyRef
-Topic 230
-SubTopic 10
-Name Accounting Standards Codification
-Section 45
-Paragraph 28
-Publisher FASB
-URI https://asc.fasb.org//1943274/2147482740/230-10-45-28
Reference 36: http://www.xbrl.org/2003/role/disclosureRef
-Topic 220
-SubTopic 10
-Name Accounting Standards Codification
-Section 45
-Paragraph 1A
-Subparagraph (a)
-Publisher FASB
-URI https://asc.fasb.org//1943274/2147482790/220-10-45-1A
Reference 37: http://www.xbrl.org/2003/role/disclosureRef
-Topic 220
-SubTopic 10
-Name Accounting Standards Codification
-Section 45
-Paragraph 1B
-Subparagraph (a)
-Publisher FASB
-URI https://asc.fasb.org//1943274/2147482790/220-10-45-1B
Reference 38: http://fasb.org/us-gaap/role/ref/legacyRef
-Topic 220
-SubTopic 10
-Name Accounting Standards Codification
-Section S99
-Paragraph 2
-Subparagraph (SX 210.5-03(20))
-Publisher FASB
-URI https://asc.fasb.org//1943274/2147483621/220-10-S99-2
Reference 39: http://fasb.org/us-gaap/role/ref/legacyRef
-Topic 942
-SubTopic 220
-Name Accounting Standards Codification
-Section S99
-Paragraph 1
-Subparagraph (SX 210.9-04(22))
-Publisher FASB
-URI https://asc.fasb.org//1943274/2147483589/942-220-S99-1
| Name: |
us-gaap_NetIncomeLoss |
| Namespace Prefix: |
us-gaap_ |
| Data Type: |
xbrli:monetaryItemType |
| Balance Type: |
credit |
| Period Type: |
duration |
|
| X |
- DefinitionAmount of Net Income (Loss) attributable to noncontrolling interest. Reference 1: http://www.xbrl.org/2003/role/disclosureRef
-Topic 250
-SubTopic 10
-Name Accounting Standards Codification
-Section 50
-Paragraph 8
-Publisher FASB
-URI https://asc.fasb.org//1943274/2147483443/250-10-50-8
Reference 2: http://www.xbrl.org/2003/role/disclosureRef
-Topic 250
-SubTopic 10
-Name Accounting Standards Codification
-Section 50
-Paragraph 9
-Publisher FASB
-URI https://asc.fasb.org//1943274/2147483443/250-10-50-9
Reference 3: http://www.xbrl.org/2003/role/disclosureRef
-Topic 944
-SubTopic 220
-Name Accounting Standards Codification
-Section S99
-Paragraph 1
-Subparagraph (SX 210.7-04(17))
-Publisher FASB
-URI https://asc.fasb.org//1943274/2147483586/944-220-S99-1
Reference 4: http://www.xbrl.org/2009/role/commonPracticeRef
-Topic 220
-SubTopic 10
-Name Accounting Standards Codification
-Section 50
-Paragraph 6
-Publisher FASB
-URI https://asc.fasb.org//1943274/2147482765/220-10-50-6
Reference 5: http://fasb.org/us-gaap/role/ref/legacyRef
-Topic 810
-SubTopic 10
-Name Accounting Standards Codification
-Section 50
-Paragraph 1A
-Subparagraph (a)(2)
-Publisher FASB
-URI https://asc.fasb.org//1943274/2147481203/810-10-50-1A
Reference 6: http://fasb.org/us-gaap/role/ref/legacyRef
-Name Accounting Standards Codification
-Topic 810
-SubTopic 10
-Section 55
-Paragraph 4J
-Publisher FASB
-URI https://asc.fasb.org//1943274/2147481175/810-10-55-4J
Reference 7: http://www.xbrl.org/2003/role/disclosureRef
-Topic 220
-SubTopic 10
-Name Accounting Standards Codification
-Section 45
-Paragraph 1A
-Subparagraph (a)
-Publisher FASB
-URI https://asc.fasb.org//1943274/2147482790/220-10-45-1A
Reference 8: http://www.xbrl.org/2003/role/disclosureRef
-Topic 220
-SubTopic 10
-Name Accounting Standards Codification
-Section 45
-Paragraph 1B
-Subparagraph (a)
-Publisher FASB
-URI https://asc.fasb.org//1943274/2147482790/220-10-45-1B
| Name: |
us-gaap_NetIncomeLossAttributableToNoncontrollingInterest |
| Namespace Prefix: |
us-gaap_ |
| Data Type: |
xbrli:monetaryItemType |
| Balance Type: |
debit |
| Period Type: |
duration |
|
| X |
- DefinitionThe aggregate amount of income or expense from ancillary business-related activities (that is to say, excluding major activities considered part of the normal operations of the business). Reference 1: http://fasb.org/us-gaap/role/ref/legacyRef
-Topic 220
-SubTopic 10
-Name Accounting Standards Codification
-Section S99
-Paragraph 2
-Subparagraph (SX 210.5-03.7)
-Publisher FASB
-URI https://asc.fasb.org//1943274/2147483621/220-10-S99-2
| Name: |
us-gaap_NonoperatingIncomeExpense |
| Namespace Prefix: |
us-gaap_ |
| Data Type: |
xbrli:monetaryItemType |
| Balance Type: |
credit |
| Period Type: |
duration |
|
| X |
- References
+ Details
| Name: |
us-gaap_NonoperatingIncomeExpenseAbstract |
| Namespace Prefix: |
us-gaap_ |
| Data Type: |
xbrli:stringItemType |
| Balance Type: |
na |
| Period Type: |
duration |
|
| X |
- DefinitionGenerally recurring costs associated with normal operations except for the portion of these expenses which can be clearly related to production and included in cost of sales or services. Includes selling, general and administrative expense.
| Name: |
us-gaap_OperatingExpenses |
| Namespace Prefix: |
us-gaap_ |
| Data Type: |
xbrli:monetaryItemType |
| Balance Type: |
debit |
| Period Type: |
duration |
|
| X |
- References
+ Details
| Name: |
us-gaap_OperatingExpensesAbstract |
| Namespace Prefix: |
us-gaap_ |
| Data Type: |
xbrli:stringItemType |
| Balance Type: |
na |
| Period Type: |
duration |
|
| X |
- DefinitionThe net result for the period of deducting operating expenses from operating revenues. Reference 1: http://www.xbrl.org/2003/role/disclosureRef
-Topic 280
-SubTopic 10
-Name Accounting Standards Codification
-Section 50
-Paragraph 22
-Publisher FASB
-URI https://asc.fasb.org//1943274/2147482810/280-10-50-22
Reference 2: http://www.xbrl.org/2003/role/disclosureRef
-Topic 280
-SubTopic 10
-Name Accounting Standards Codification
-Section 50
-Paragraph 30
-Subparagraph (b)
-Publisher FASB
-URI https://asc.fasb.org//1943274/2147482810/280-10-50-30
Reference 3: http://www.xbrl.org/2003/role/disclosureRef
-Topic 280
-SubTopic 10
-Name Accounting Standards Codification
-Section 50
-Paragraph 32
-Subparagraph (f)
-Publisher FASB
-URI https://asc.fasb.org//1943274/2147482810/280-10-50-32
Reference 4: http://www.xbrl.org/2003/role/exampleRef
-Topic 280
-SubTopic 10
-Name Accounting Standards Codification
-Section 50
-Paragraph 31
-Publisher FASB
-URI https://asc.fasb.org//1943274/2147482810/280-10-50-31
Reference 5: http://www.xbrl.org/2003/role/disclosureRef
-Topic 280
-SubTopic 10
-Name Accounting Standards Codification
-Section 50
-Paragraph 32
-Subparagraph (c)
-Publisher FASB
-URI https://asc.fasb.org//1943274/2147482810/280-10-50-32
| Name: |
us-gaap_OperatingIncomeLoss |
| Namespace Prefix: |
us-gaap_ |
| Data Type: |
xbrli:monetaryItemType |
| Balance Type: |
credit |
| Period Type: |
duration |
|
| X |
- DefinitionAmount of income (expense) related to nonoperating activities, classified as other. Reference 1: http://fasb.org/us-gaap/role/ref/legacyRef
-Topic 220
-SubTopic 10
-Name Accounting Standards Codification
-Section S99
-Paragraph 2
-Subparagraph (SX 210.5-03.9)
-Publisher FASB
-URI https://asc.fasb.org//1943274/2147483621/220-10-S99-2
| Name: |
us-gaap_OtherNonoperatingIncomeExpense |
| Namespace Prefix: |
us-gaap_ |
| Data Type: |
xbrli:monetaryItemType |
| Balance Type: |
credit |
| Period Type: |
duration |
|
| X |
- DefinitionThe consolidated profit or loss for the period, net of income taxes, including the portion attributable to the noncontrolling interest. Reference 1: http://www.xbrl.org/2003/role/disclosureRef
-Topic 235
-SubTopic 10
-Name Accounting Standards Codification
-Section S99
-Paragraph 1
-Subparagraph (SX 210.4-08(g)(1)(ii))
-Publisher FASB
-URI https://asc.fasb.org//1943274/2147480678/235-10-S99-1
Reference 2: http://www.xbrl.org/2003/role/disclosureRef
-Topic 323
-SubTopic 10
-Name Accounting Standards Codification
-Section 50
-Paragraph 3
-Subparagraph (c)
-Publisher FASB
-URI https://asc.fasb.org//1943274/2147481687/323-10-50-3
Reference 3: http://www.xbrl.org/2003/role/disclosureRef
-Topic 825
-SubTopic 10
-Name Accounting Standards Codification
-Section 50
-Paragraph 28
-Subparagraph (f)
-Publisher FASB
-URI https://asc.fasb.org//1943274/2147482907/825-10-50-28
Reference 4: http://www.xbrl.org/2003/role/disclosureRef
-Topic 250
-SubTopic 10
-Name Accounting Standards Codification
-Section 50
-Paragraph 1
-Subparagraph (b)(2)
-Publisher FASB
-URI https://asc.fasb.org//1943274/2147483443/250-10-50-1
Reference 5: http://www.xbrl.org/2003/role/disclosureRef
-Topic 815
-SubTopic 40
-Name Accounting Standards Codification
-Section 65
-Paragraph 1
-Subparagraph (f)
-Publisher FASB
-URI https://asc.fasb.org//1943274/2147480175/815-40-65-1
Reference 6: http://www.xbrl.org/2003/role/disclosureRef
-Topic 250
-SubTopic 10
-Name Accounting Standards Codification
-Section 50
-Paragraph 8
-Publisher FASB
-URI https://asc.fasb.org//1943274/2147483443/250-10-50-8
Reference 7: http://www.xbrl.org/2003/role/disclosureRef
-Topic 250
-SubTopic 10
-Name Accounting Standards Codification
-Section 50
-Paragraph 9
-Publisher FASB
-URI https://asc.fasb.org//1943274/2147483443/250-10-50-9
Reference 8: http://www.xbrl.org/2003/role/exampleRef
-Topic 946
-SubTopic 830
-Name Accounting Standards Codification
-Section 55
-Paragraph 11
-Publisher FASB
-URI https://asc.fasb.org//1943274/2147480167/946-830-55-11
Reference 9: http://www.xbrl.org/2003/role/disclosureRef
-Topic 946
-SubTopic 205
-Name Accounting Standards Codification
-Section 45
-Paragraph 3
-Subparagraph (a)
-Publisher FASB
-URI https://asc.fasb.org//1943274/2147480767/946-205-45-3
Reference 10: http://www.xbrl.org/2003/role/disclosureRef
-Topic 946
-SubTopic 220
-Name Accounting Standards Codification
-Section 45
-Paragraph 7
-Publisher FASB
-URI https://asc.fasb.org//1943274/2147483581/946-220-45-7
Reference 11: http://www.xbrl.org/2003/role/disclosureRef
-Topic 944
-SubTopic 220
-Name Accounting Standards Codification
-Section S99
-Paragraph 1
-Subparagraph (SX 210.7-04(16))
-Publisher FASB
-URI https://asc.fasb.org//1943274/2147483586/944-220-S99-1
Reference 12: http://www.xbrl.org/2003/role/disclosureRef
-Topic 280
-SubTopic 10
-Name Accounting Standards Codification
-Section 50
-Paragraph 22
-Publisher FASB
-URI https://asc.fasb.org//1943274/2147482810/280-10-50-22
Reference 13: http://www.xbrl.org/2003/role/disclosureRef
-Topic 946
-SubTopic 220
-Name Accounting Standards Codification
-Section S99
-Paragraph 1
-Subparagraph (SX 210.6-07(9))
-Publisher FASB
-URI https://asc.fasb.org//1943274/2147483575/946-220-S99-1
Reference 14: http://www.xbrl.org/2003/role/disclosureRef
-Topic 946
-SubTopic 220
-Name Accounting Standards Codification
-Section S99
-Paragraph 3
-Subparagraph (SX 210.6-09(1)(d))
-Publisher FASB
-URI https://asc.fasb.org//1943274/2147483575/946-220-S99-3
Reference 15: http://www.xbrl.org/2003/role/disclosureRef
-Topic 810
-SubTopic 10
-Name Accounting Standards Codification
-Section 45
-Paragraph 19
-Publisher FASB
-URI https://asc.fasb.org//1943274/2147481231/810-10-45-19
Reference 16: http://www.xbrl.org/2009/role/commonPracticeRef
-Topic 220
-SubTopic 10
-Name Accounting Standards Codification
-Section 50
-Paragraph 6
-Publisher FASB
-URI https://asc.fasb.org//1943274/2147482765/220-10-50-6
Reference 17: http://www.xbrl.org/2003/role/disclosureRef
-Topic 470
-SubTopic 10
-Name Accounting Standards Codification
-Section S99
-Paragraph 1A
-Subparagraph (SX 210.13-01(a)(4)(i))
-Publisher FASB
-URI https://asc.fasb.org//1943274/2147480097/470-10-S99-1A
Reference 18: http://www.xbrl.org/2009/role/commonPracticeRef
-Topic 470
-SubTopic 10
-Name Accounting Standards Codification
-Section S99
-Paragraph 1A
-Subparagraph (SX 210.13-01(a)(4)(ii))
-Publisher FASB
-URI https://asc.fasb.org//1943274/2147480097/470-10-S99-1A
Reference 19: http://www.xbrl.org/2003/role/disclosureRef
-Topic 470
-SubTopic 10
-Name Accounting Standards Codification
-Section S99
-Paragraph 1A
-Subparagraph (SX 210.13-01(a)(4)(iii)(A))
-Publisher FASB
-URI https://asc.fasb.org//1943274/2147480097/470-10-S99-1A
Reference 20: http://www.xbrl.org/2003/role/disclosureRef
-Topic 470
-SubTopic 10
-Name Accounting Standards Codification
-Section S99
-Paragraph 1A
-Subparagraph (SX 210.13-01(a)(4)(iv))
-Publisher FASB
-URI https://asc.fasb.org//1943274/2147480097/470-10-S99-1A
Reference 21: http://www.xbrl.org/2003/role/disclosureRef
-Topic 470
-SubTopic 10
-Name Accounting Standards Codification
-Section S99
-Paragraph 1A
-Subparagraph (SX 210.13-01(a)(5))
-Publisher FASB
-URI https://asc.fasb.org//1943274/2147480097/470-10-S99-1A
Reference 22: http://www.xbrl.org/2003/role/disclosureRef
-Topic 470
-SubTopic 10
-Name Accounting Standards Codification
-Section S99
-Paragraph 1B
-Subparagraph (SX 210.13-02(a)(4)(i))
-Publisher FASB
-URI https://asc.fasb.org//1943274/2147480097/470-10-S99-1B
Reference 23: http://www.xbrl.org/2003/role/disclosureRef
-Topic 470
-SubTopic 10
-Name Accounting Standards Codification
-Section S99
-Paragraph 1B
-Subparagraph (SX 210.13-02(a)(4)(iii)(A))
-Publisher FASB
-URI https://asc.fasb.org//1943274/2147480097/470-10-S99-1B
Reference 24: http://www.xbrl.org/2003/role/disclosureRef
-Topic 470
-SubTopic 10
-Name Accounting Standards Codification
-Section S99
-Paragraph 1B
-Subparagraph (SX 210.13-02(a)(4)(iii)(B))
-Publisher FASB
-URI https://asc.fasb.org//1943274/2147480097/470-10-S99-1B
Reference 25: http://www.xbrl.org/2003/role/disclosureRef
-Topic 470
-SubTopic 10
-Name Accounting Standards Codification
-Section S99
-Paragraph 1B
-Subparagraph (SX 210.13-02(a)(4)(iv))
-Publisher FASB
-URI https://asc.fasb.org//1943274/2147480097/470-10-S99-1B
Reference 26: http://www.xbrl.org/2003/role/disclosureRef
-Topic 470
-SubTopic 10
-Name Accounting Standards Codification
-Section S99
-Paragraph 1B
-Subparagraph (SX 210.13-02(a)(5))
-Publisher FASB
-URI https://asc.fasb.org//1943274/2147480097/470-10-S99-1B
Reference 27: http://www.xbrl.org/2003/role/disclosureRef
-Topic 280
-SubTopic 10
-Name Accounting Standards Codification
-Section 50
-Paragraph 30
-Subparagraph (b)
-Publisher FASB
-URI https://asc.fasb.org//1943274/2147482810/280-10-50-30
Reference 28: http://www.xbrl.org/2003/role/disclosureRef
-Topic 280
-SubTopic 10
-Name Accounting Standards Codification
-Section 50
-Paragraph 32
-Subparagraph (f)
-Publisher FASB
-URI https://asc.fasb.org//1943274/2147482810/280-10-50-32
Reference 29: http://www.xbrl.org/2003/role/exampleRef
-Topic 280
-SubTopic 10
-Name Accounting Standards Codification
-Section 50
-Paragraph 31
-Publisher FASB
-URI https://asc.fasb.org//1943274/2147482810/280-10-50-31
Reference 30: http://www.xbrl.org/2003/role/disclosureRef
-Topic 280
-SubTopic 10
-Name Accounting Standards Codification
-Section 50
-Paragraph 32
-Subparagraph (c)
-Publisher FASB
-URI https://asc.fasb.org//1943274/2147482810/280-10-50-32
Reference 31: http://www.xbrl.org/2003/role/disclosureRef
-Topic 942
-SubTopic 235
-Name Accounting Standards Codification
-Section S99
-Paragraph 1
-Subparagraph (SX 210.9-05(b)(2))
-Publisher FASB
-URI https://asc.fasb.org//1943274/2147479557/942-235-S99-1
Reference 32: http://www.xbrl.org/2003/role/disclosureRef
-Topic 205
-SubTopic 20
-Name Accounting Standards Codification
-Section 50
-Paragraph 7
-Publisher FASB
-URI https://asc.fasb.org//1943274/2147483499/205-20-50-7
Reference 33: http://www.xbrl.org/2003/role/exampleRef
-Topic 810
-SubTopic 10
-Name Accounting Standards Codification
-Section 55
-Paragraph 4J
-Publisher FASB
-URI https://asc.fasb.org//1943274/2147481175/810-10-55-4J
Reference 34: http://www.xbrl.org/2003/role/exampleRef
-Topic 810
-SubTopic 10
-Name Accounting Standards Codification
-Section 55
-Paragraph 4K
-Publisher FASB
-URI https://asc.fasb.org//1943274/2147481175/810-10-55-4K
Reference 35: http://www.xbrl.org/2003/role/disclosureRef
-Topic 220
-SubTopic 10
-Name Accounting Standards Codification
-Section 45
-Paragraph 1A
-Subparagraph (a)
-Publisher FASB
-URI https://asc.fasb.org//1943274/2147482790/220-10-45-1A
Reference 36: http://www.xbrl.org/2003/role/disclosureRef
-Topic 220
-SubTopic 10
-Name Accounting Standards Codification
-Section 45
-Paragraph 1B
-Subparagraph (a)
-Publisher FASB
-URI https://asc.fasb.org//1943274/2147482790/220-10-45-1B
Reference 37: http://www.xbrl.org/2003/role/disclosureRef
-Topic 230
-SubTopic 10
-Name Accounting Standards Codification
-Section 45
-Paragraph 2
-Publisher FASB
-URI https://asc.fasb.org//1943274/2147482740/230-10-45-2
Reference 38: http://www.xbrl.org/2003/role/disclosureRef
-Topic 810
-SubTopic 10
-Name Accounting Standards Codification
-Section 50
-Paragraph 1A
-Subparagraph (a)(1)
-Publisher FASB
-URI https://asc.fasb.org//1943274/2147481203/810-10-50-1A
Reference 39: http://www.xbrl.org/2003/role/disclosureRef
-Topic 810
-SubTopic 10
-Name Accounting Standards Codification
-Section 50
-Paragraph 1A
-Subparagraph (c)(1)
-Publisher FASB
-URI https://asc.fasb.org//1943274/2147481203/810-10-50-1A
| Name: |
us-gaap_ProfitLoss |
| Namespace Prefix: |
us-gaap_ |
| Data Type: |
xbrli:monetaryItemType |
| Balance Type: |
credit |
| Period Type: |
duration |
|
| X |
- DefinitionAmount, including tax collected from customer, of revenue from satisfaction of performance obligation by transferring promised good or service to customer. Tax collected from customer is tax assessed by governmental authority that is both imposed on and concurrent with specific revenue-producing transaction, including, but not limited to, sales, use, value-added and excise. Reference 1: http://www.xbrl.org/2003/role/disclosureRef
-Topic 924
-SubTopic 10
-Name Accounting Standards Codification
-Section S99
-Paragraph 1
-Subparagraph (SAB Topic 11.L)
-Publisher FASB
-URI https://asc.fasb.org//1943274/2147479941/924-10-S99-1
Reference 2: http://www.xbrl.org/2003/role/disclosureRef
-Topic 606
-SubTopic 10
-Name Accounting Standards Codification
-Section 50
-Paragraph 5
-Publisher FASB
-URI https://asc.fasb.org//1943274/2147479806/606-10-50-5
Reference 3: http://www.xbrl.org/2003/role/disclosureRef
-Topic 280
-SubTopic 10
-Name Accounting Standards Codification
-Section 50
-Paragraph 30
-Subparagraph (a)
-Publisher FASB
-URI https://asc.fasb.org//1943274/2147482810/280-10-50-30
Reference 4: http://www.xbrl.org/2003/role/disclosureRef
-Topic 280
-SubTopic 10
-Name Accounting Standards Codification
-Section 50
-Paragraph 42
-Publisher FASB
-URI https://asc.fasb.org//1943274/2147482810/280-10-50-42
Reference 5: http://www.xbrl.org/2003/role/disclosureRef
-Topic 280
-SubTopic 10
-Name Accounting Standards Codification
-Section 50
-Paragraph 22
-Subparagraph (b)
-Publisher FASB
-URI https://asc.fasb.org//1943274/2147482810/280-10-50-22
Reference 6: http://www.xbrl.org/2003/role/disclosureRef
-Topic 280
-SubTopic 10
-Name Accounting Standards Codification
-Section 50
-Paragraph 32
-Subparagraph (b)
-Publisher FASB
-URI https://asc.fasb.org//1943274/2147482810/280-10-50-32
Reference 7: http://www.xbrl.org/2003/role/disclosureRef
-Topic 280
-SubTopic 10
-Name Accounting Standards Codification
-Section 50
-Paragraph 40
-Publisher FASB
-URI https://asc.fasb.org//1943274/2147482810/280-10-50-40
Reference 8: http://www.xbrl.org/2003/role/disclosureRef
-Topic 280
-SubTopic 10
-Name Accounting Standards Codification
-Section 50
-Paragraph 22
-Subparagraph (a)
-Publisher FASB
-URI https://asc.fasb.org//1943274/2147482810/280-10-50-22
Reference 9: http://www.xbrl.org/2003/role/disclosureRef
-Topic 280
-SubTopic 10
-Name Accounting Standards Codification
-Section 50
-Paragraph 32
-Subparagraph (a)
-Publisher FASB
-URI https://asc.fasb.org//1943274/2147482810/280-10-50-32
Reference 10: http://www.xbrl.org/2003/role/disclosureRef
-Topic 280
-SubTopic 10
-Name Accounting Standards Codification
-Section 50
-Paragraph 41
-Subparagraph (a)
-Publisher FASB
-URI https://asc.fasb.org//1943274/2147482810/280-10-50-41
Reference 11: http://www.xbrl.org/2003/role/disclosureRef
-Topic 606
-SubTopic 10
-Name Accounting Standards Codification
-Section 50
-Paragraph 4
-Subparagraph (a)
-Publisher FASB
-URI https://asc.fasb.org//1943274/2147479806/606-10-50-4
| Name: |
us-gaap_RevenueFromContractWithCustomerIncludingAssessedTax |
| Namespace Prefix: |
us-gaap_ |
| Data Type: |
xbrli:monetaryItemType |
| Balance Type: |
credit |
| Period Type: |
duration |
|
| X |
- References
+ Details
| Name: |
us-gaap_RevenuesAbstract |
| Namespace Prefix: |
us-gaap_ |
| Data Type: |
xbrli:stringItemType |
| Balance Type: |
na |
| Period Type: |
duration |
|
| X |
- DefinitionThe average number of shares or units issued and outstanding that are used in calculating diluted EPS or earnings per unit (EPU), determined based on the timing of issuance of shares or units in the period. Reference 1: http://www.xbrl.org/2003/role/disclosureRef
-Topic 260
-SubTopic 10
-Name Accounting Standards Codification
-Section 50
-Paragraph 1
-Subparagraph (a)
-Publisher FASB
-URI https://asc.fasb.org//1943274/2147482662/260-10-50-1
Reference 2: http://www.xbrl.org/2003/role/disclosureRef
-Topic 260
-SubTopic 10
-Name Accounting Standards Codification
-Section 45
-Paragraph 16
-Publisher FASB
-URI https://asc.fasb.org//1943274/2147482689/260-10-45-16
| Name: |
us-gaap_WeightedAverageNumberOfDilutedSharesOutstanding |
| Namespace Prefix: |
us-gaap_ |
| Data Type: |
xbrli:sharesItemType |
| Balance Type: |
na |
| Period Type: |
duration |
|
| X |
- References
+ Details
| Name: |
us-gaap_WeightedAverageNumberOfSharesOutstandingAbstract |
| Namespace Prefix: |
us-gaap_ |
| Data Type: |
xbrli:stringItemType |
| Balance Type: |
na |
| Period Type: |
duration |
|
| X |
- DefinitionNumber of [basic] shares or units, after adjustment for contingently issuable shares or units and other shares or units not deemed outstanding, determined by relating the portion of time within a reporting period that common shares or units have been outstanding to the total time in that period. Reference 1: http://www.xbrl.org/2003/role/disclosureRef
-Topic 260
-SubTopic 10
-Name Accounting Standards Codification
-Section 50
-Paragraph 1
-Subparagraph (a)
-Publisher FASB
-URI https://asc.fasb.org//1943274/2147482662/260-10-50-1
Reference 2: http://www.xbrl.org/2003/role/disclosureRef
-Topic 260
-SubTopic 10
-Name Accounting Standards Codification
-Section 45
-Paragraph 10
-Publisher FASB
-URI https://asc.fasb.org//1943274/2147482689/260-10-45-10
| Name: |
us-gaap_WeightedAverageNumberOfSharesOutstandingBasic |
| Namespace Prefix: |
us-gaap_ |
| Data Type: |
xbrli:sharesItemType |
| Balance Type: |
na |
| Period Type: |
duration |
|
| X |
- Details
| Name: |
srt_ProductOrServiceAxis=us-gaap_InvestmentAdviceMember |
| Namespace Prefix: |
|
| Data Type: |
na |
| Balance Type: |
|
| Period Type: |
|
|
| X |
- Details
| Name: |
srt_ProductOrServiceAxis=us-gaap_FinancialServiceMember |
| Namespace Prefix: |
|
| Data Type: |
na |
| Balance Type: |
|
| Period Type: |
|
|
| X |
- Details
| Name: |
srt_ProductOrServiceAxis=us-gaap_FinancialServiceOtherMember |
| Namespace Prefix: |
|
| Data Type: |
na |
| Balance Type: |
|
| Period Type: |
|
|
v3.23.2
Condensed Consolidated Statements of Comprehensive Income (Unaudited) - USD ($)
$ in Thousands |
3 Months Ended |
6 Months Ended |
Jun. 30, 2023 |
Jun. 30, 2022 |
Jun. 30, 2023 |
Jun. 30, 2022 |
| Statement of Comprehensive Income [Abstract] |
|
|
|
|
| Net income |
$ 32,505
|
$ 26,149
|
$ 68,803
|
$ 72,990
|
| Net (income) loss attributable to noncontrolling interests |
(727)
|
25,807
|
(1,711)
|
20,984
|
| Net income attributable to common stockholders |
31,778
|
51,956
|
67,092
|
93,974
|
| Foreign currency translation gain (loss) |
676
|
(3,614)
|
2,247
|
(5,165)
|
| Total comprehensive income attributable to common stockholders |
$ 32,454
|
$ 48,342
|
$ 69,339
|
$ 88,809
|
| X |
- DefinitionAmount after tax of increase (decrease) in equity from transactions and other events and circumstances from net income and other comprehensive income, attributable to parent entity. Excludes changes in equity resulting from investments by owners and distributions to owners. Reference 1: http://www.xbrl.org/2003/role/disclosureRef
-Topic 220
-SubTopic 10
-Name Accounting Standards Codification
-Section S99
-Paragraph 2
-Subparagraph (SX 210.5-03(24))
-Publisher FASB
-URI https://asc.fasb.org//1943274/2147483621/220-10-S99-2
Reference 2: http://www.xbrl.org/2003/role/disclosureRef
-Topic 942
-SubTopic 220
-Name Accounting Standards Codification
-Section S99
-Paragraph 1
-Subparagraph (SX 210.9-04(26))
-Publisher FASB
-URI https://asc.fasb.org//1943274/2147483589/942-220-S99-1
Reference 3: http://www.xbrl.org/2003/role/disclosureRef
-Topic 944
-SubTopic 220
-Name Accounting Standards Codification
-Section S99
-Paragraph 1
-Subparagraph (SX 210.7-04(22))
-Publisher FASB
-URI https://asc.fasb.org//1943274/2147483586/944-220-S99-1
Reference 4: http://www.xbrl.org/2003/role/disclosureRef
-Topic 220
-SubTopic 10
-Name Accounting Standards Codification
-Section 45
-Paragraph 1A
-Subparagraph (c)
-Publisher FASB
-URI https://asc.fasb.org//1943274/2147482790/220-10-45-1A
Reference 5: http://www.xbrl.org/2003/role/disclosureRef
-Topic 220
-SubTopic 10
-Name Accounting Standards Codification
-Section 45
-Paragraph 1B
-Subparagraph (b)
-Publisher FASB
-URI https://asc.fasb.org//1943274/2147482790/220-10-45-1B
Reference 6: http://fasb.org/us-gaap/role/ref/legacyRef
-Name Accounting Standards Codification
-Topic 220
-SubTopic 10
-Section 45
-Paragraph 5
-Publisher FASB
-URI https://asc.fasb.org//1943274/2147482790/220-10-45-5
| Name: |
us-gaap_ComprehensiveIncomeNetOfTax |
| Namespace Prefix: |
us-gaap_ |
| Data Type: |
xbrli:monetaryItemType |
| Balance Type: |
credit |
| Period Type: |
duration |
|
| X |
- DefinitionThe portion of profit or loss for the period, net of income taxes, which is attributable to the parent. Reference 1: http://www.xbrl.org/2003/role/disclosureRef
-Topic 235
-SubTopic 10
-Name Accounting Standards Codification
-Section S99
-Paragraph 1
-Subparagraph (SX 210.4-08(g)(1)(ii))
-Publisher FASB
-URI https://asc.fasb.org//1943274/2147480678/235-10-S99-1
Reference 2: http://www.xbrl.org/2003/role/disclosureRef
-Topic 323
-SubTopic 10
-Name Accounting Standards Codification
-Section 50
-Paragraph 3
-Subparagraph (c)
-Publisher FASB
-URI https://asc.fasb.org//1943274/2147481687/323-10-50-3
Reference 3: http://www.xbrl.org/2003/role/disclosureRef
-Topic 825
-SubTopic 10
-Name Accounting Standards Codification
-Section 50
-Paragraph 28
-Subparagraph (f)
-Publisher FASB
-URI https://asc.fasb.org//1943274/2147482907/825-10-50-28
Reference 4: http://www.xbrl.org/2003/role/disclosureRef
-Topic 220
-SubTopic 10
-Name Accounting Standards Codification
-Section 50
-Paragraph 6
-Publisher FASB
-URI https://asc.fasb.org//1943274/2147482765/220-10-50-6
Reference 5: http://www.xbrl.org/2003/role/disclosureRef
-Topic 250
-SubTopic 10
-Name Accounting Standards Codification
-Section 50
-Paragraph 3
-Publisher FASB
-URI https://asc.fasb.org//1943274/2147483443/250-10-50-3
Reference 6: http://www.xbrl.org/2003/role/disclosureRef
-Topic 250
-SubTopic 10
-Name Accounting Standards Codification
-Section 50
-Paragraph 1
-Subparagraph (b)(2)
-Publisher FASB
-URI https://asc.fasb.org//1943274/2147483443/250-10-50-1
Reference 7: http://www.xbrl.org/2003/role/disclosureRef
-Topic 815
-SubTopic 40
-Name Accounting Standards Codification
-Section 65
-Paragraph 1
-Subparagraph (f)
-Publisher FASB
-URI https://asc.fasb.org//1943274/2147480175/815-40-65-1
Reference 8: http://www.xbrl.org/2003/role/disclosureRef
-Topic 250
-SubTopic 10
-Name Accounting Standards Codification
-Section 50
-Paragraph 8
-Publisher FASB
-URI https://asc.fasb.org//1943274/2147483443/250-10-50-8
Reference 9: http://www.xbrl.org/2003/role/disclosureRef
-Topic 250
-SubTopic 10
-Name Accounting Standards Codification
-Section 50
-Paragraph 9
-Publisher FASB
-URI https://asc.fasb.org//1943274/2147483443/250-10-50-9
Reference 10: http://www.xbrl.org/2003/role/disclosureRef
-Topic 250
-SubTopic 10
-Name Accounting Standards Codification
-Section 50
-Paragraph 11
-Subparagraph (a)
-Publisher FASB
-URI https://asc.fasb.org//1943274/2147483443/250-10-50-11
Reference 11: http://www.xbrl.org/2003/role/disclosureRef
-Topic 250
-SubTopic 10
-Name Accounting Standards Codification
-Section 50
-Paragraph 11
-Subparagraph (b)
-Publisher FASB
-URI https://asc.fasb.org//1943274/2147483443/250-10-50-11
Reference 12: http://www.xbrl.org/2003/role/disclosureRef
-Topic 250
-SubTopic 10
-Name Accounting Standards Codification
-Section 50
-Paragraph 4
-Publisher FASB
-URI https://asc.fasb.org//1943274/2147483443/250-10-50-4
Reference 13: http://www.xbrl.org/2003/role/exampleRef
-Topic 946
-SubTopic 830
-Name Accounting Standards Codification
-Section 55
-Paragraph 10
-Publisher FASB
-URI https://asc.fasb.org//1943274/2147480167/946-830-55-10
Reference 14: http://www.xbrl.org/2003/role/disclosureRef
-Topic 946
-SubTopic 220
-Name Accounting Standards Codification
-Section 45
-Paragraph 7
-Publisher FASB
-URI https://asc.fasb.org//1943274/2147483581/946-220-45-7
Reference 15: http://www.xbrl.org/2003/role/disclosureRef
-Topic 944
-SubTopic 220
-Name Accounting Standards Codification
-Section S99
-Paragraph 1
-Subparagraph (SX 210.7-04(18))
-Publisher FASB
-URI https://asc.fasb.org//1943274/2147483586/944-220-S99-1
Reference 16: http://www.xbrl.org/2003/role/disclosureRef
-Topic 280
-SubTopic 10
-Name Accounting Standards Codification
-Section 50
-Paragraph 22
-Publisher FASB
-URI https://asc.fasb.org//1943274/2147482810/280-10-50-22
Reference 17: http://www.xbrl.org/2003/role/disclosureRef
-Topic 946
-SubTopic 220
-Name Accounting Standards Codification
-Section S99
-Paragraph 1
-Subparagraph (SX 210.6-07(9))
-Publisher FASB
-URI https://asc.fasb.org//1943274/2147483575/946-220-S99-1
Reference 18: http://www.xbrl.org/2003/role/disclosureRef
-Topic 946
-SubTopic 220
-Name Accounting Standards Codification
-Section S99
-Paragraph 3
-Subparagraph (SX 210.6-09(1)(d))
-Publisher FASB
-URI https://asc.fasb.org//1943274/2147483575/946-220-S99-3
Reference 19: http://www.xbrl.org/2003/role/disclosureRef
-Topic 470
-SubTopic 10
-Name Accounting Standards Codification
-Section S99
-Paragraph 1A
-Subparagraph (SX 210.13-01(a)(4)(i))
-Publisher FASB
-URI https://asc.fasb.org//1943274/2147480097/470-10-S99-1A
Reference 20: http://www.xbrl.org/2009/role/commonPracticeRef
-Topic 470
-SubTopic 10
-Name Accounting Standards Codification
-Section S99
-Paragraph 1A
-Subparagraph (SX 210.13-01(a)(4)(ii))
-Publisher FASB
-URI https://asc.fasb.org//1943274/2147480097/470-10-S99-1A
Reference 21: http://www.xbrl.org/2003/role/disclosureRef
-Topic 470
-SubTopic 10
-Name Accounting Standards Codification
-Section S99
-Paragraph 1A
-Subparagraph (SX 210.13-01(a)(4)(iii)(A))
-Publisher FASB
-URI https://asc.fasb.org//1943274/2147480097/470-10-S99-1A
Reference 22: http://www.xbrl.org/2003/role/disclosureRef
-Topic 470
-SubTopic 10
-Name Accounting Standards Codification
-Section S99
-Paragraph 1A
-Subparagraph (SX 210.13-01(a)(4)(iv))
-Publisher FASB
-URI https://asc.fasb.org//1943274/2147480097/470-10-S99-1A
Reference 23: http://www.xbrl.org/2003/role/disclosureRef
-Topic 470
-SubTopic 10
-Name Accounting Standards Codification
-Section S99
-Paragraph 1A
-Subparagraph (SX 210.13-01(a)(5))
-Publisher FASB
-URI https://asc.fasb.org//1943274/2147480097/470-10-S99-1A
Reference 24: http://www.xbrl.org/2003/role/disclosureRef
-Topic 470
-SubTopic 10
-Name Accounting Standards Codification
-Section S99
-Paragraph 1B
-Subparagraph (SX 210.13-02(a)(4)(i))
-Publisher FASB
-URI https://asc.fasb.org//1943274/2147480097/470-10-S99-1B
Reference 25: http://www.xbrl.org/2003/role/disclosureRef
-Topic 470
-SubTopic 10
-Name Accounting Standards Codification
-Section S99
-Paragraph 1B
-Subparagraph (SX 210.13-02(a)(4)(iii)(A))
-Publisher FASB
-URI https://asc.fasb.org//1943274/2147480097/470-10-S99-1B
Reference 26: http://www.xbrl.org/2003/role/disclosureRef
-Topic 470
-SubTopic 10
-Name Accounting Standards Codification
-Section S99
-Paragraph 1B
-Subparagraph (SX 210.13-02(a)(4)(iii)(B))
-Publisher FASB
-URI https://asc.fasb.org//1943274/2147480097/470-10-S99-1B
Reference 27: http://www.xbrl.org/2003/role/disclosureRef
-Topic 470
-SubTopic 10
-Name Accounting Standards Codification
-Section S99
-Paragraph 1B
-Subparagraph (SX 210.13-02(a)(4)(iv))
-Publisher FASB
-URI https://asc.fasb.org//1943274/2147480097/470-10-S99-1B
Reference 28: http://www.xbrl.org/2003/role/disclosureRef
-Topic 470
-SubTopic 10
-Name Accounting Standards Codification
-Section S99
-Paragraph 1B
-Subparagraph (SX 210.13-02(a)(5))
-Publisher FASB
-URI https://asc.fasb.org//1943274/2147480097/470-10-S99-1B
Reference 29: http://www.xbrl.org/2003/role/disclosureRef
-Topic 280
-SubTopic 10
-Name Accounting Standards Codification
-Section 50
-Paragraph 30
-Subparagraph (b)
-Publisher FASB
-URI https://asc.fasb.org//1943274/2147482810/280-10-50-30
Reference 30: http://www.xbrl.org/2003/role/disclosureRef
-Topic 280
-SubTopic 10
-Name Accounting Standards Codification
-Section 50
-Paragraph 32
-Subparagraph (f)
-Publisher FASB
-URI https://asc.fasb.org//1943274/2147482810/280-10-50-32
Reference 31: http://www.xbrl.org/2003/role/disclosureRef
-Topic 260
-SubTopic 10
-Name Accounting Standards Codification
-Section 45
-Paragraph 60B
-Subparagraph (a)
-Publisher FASB
-URI https://asc.fasb.org//1943274/2147482689/260-10-45-60B
Reference 32: http://www.xbrl.org/2003/role/exampleRef
-Topic 280
-SubTopic 10
-Name Accounting Standards Codification
-Section 50
-Paragraph 31
-Publisher FASB
-URI https://asc.fasb.org//1943274/2147482810/280-10-50-31
Reference 33: http://www.xbrl.org/2003/role/disclosureRef
-Topic 280
-SubTopic 10
-Name Accounting Standards Codification
-Section 50
-Paragraph 32
-Subparagraph (c)
-Publisher FASB
-URI https://asc.fasb.org//1943274/2147482810/280-10-50-32
Reference 34: http://www.xbrl.org/2003/role/disclosureRef
-Topic 205
-SubTopic 20
-Name Accounting Standards Codification
-Section 50
-Paragraph 7
-Publisher FASB
-URI https://asc.fasb.org//1943274/2147483499/205-20-50-7
Reference 35: http://fasb.org/us-gaap/role/ref/legacyRef
-Topic 230
-SubTopic 10
-Name Accounting Standards Codification
-Section 45
-Paragraph 28
-Publisher FASB
-URI https://asc.fasb.org//1943274/2147482740/230-10-45-28
Reference 36: http://www.xbrl.org/2003/role/disclosureRef
-Topic 220
-SubTopic 10
-Name Accounting Standards Codification
-Section 45
-Paragraph 1A
-Subparagraph (a)
-Publisher FASB
-URI https://asc.fasb.org//1943274/2147482790/220-10-45-1A
Reference 37: http://www.xbrl.org/2003/role/disclosureRef
-Topic 220
-SubTopic 10
-Name Accounting Standards Codification
-Section 45
-Paragraph 1B
-Subparagraph (a)
-Publisher FASB
-URI https://asc.fasb.org//1943274/2147482790/220-10-45-1B
Reference 38: http://fasb.org/us-gaap/role/ref/legacyRef
-Topic 220
-SubTopic 10
-Name Accounting Standards Codification
-Section S99
-Paragraph 2
-Subparagraph (SX 210.5-03(20))
-Publisher FASB
-URI https://asc.fasb.org//1943274/2147483621/220-10-S99-2
Reference 39: http://fasb.org/us-gaap/role/ref/legacyRef
-Topic 942
-SubTopic 220
-Name Accounting Standards Codification
-Section S99
-Paragraph 1
-Subparagraph (SX 210.9-04(22))
-Publisher FASB
-URI https://asc.fasb.org//1943274/2147483589/942-220-S99-1
| Name: |
us-gaap_NetIncomeLoss |
| Namespace Prefix: |
us-gaap_ |
| Data Type: |
xbrli:monetaryItemType |
| Balance Type: |
credit |
| Period Type: |
duration |
|
| X |
- DefinitionAmount of Net Income (Loss) attributable to noncontrolling interest. Reference 1: http://www.xbrl.org/2003/role/disclosureRef
-Topic 250
-SubTopic 10
-Name Accounting Standards Codification
-Section 50
-Paragraph 8
-Publisher FASB
-URI https://asc.fasb.org//1943274/2147483443/250-10-50-8
Reference 2: http://www.xbrl.org/2003/role/disclosureRef
-Topic 250
-SubTopic 10
-Name Accounting Standards Codification
-Section 50
-Paragraph 9
-Publisher FASB
-URI https://asc.fasb.org//1943274/2147483443/250-10-50-9
Reference 3: http://www.xbrl.org/2003/role/disclosureRef
-Topic 944
-SubTopic 220
-Name Accounting Standards Codification
-Section S99
-Paragraph 1
-Subparagraph (SX 210.7-04(17))
-Publisher FASB
-URI https://asc.fasb.org//1943274/2147483586/944-220-S99-1
Reference 4: http://www.xbrl.org/2009/role/commonPracticeRef
-Topic 220
-SubTopic 10
-Name Accounting Standards Codification
-Section 50
-Paragraph 6
-Publisher FASB
-URI https://asc.fasb.org//1943274/2147482765/220-10-50-6
Reference 5: http://fasb.org/us-gaap/role/ref/legacyRef
-Topic 810
-SubTopic 10
-Name Accounting Standards Codification
-Section 50
-Paragraph 1A
-Subparagraph (a)(2)
-Publisher FASB
-URI https://asc.fasb.org//1943274/2147481203/810-10-50-1A
Reference 6: http://fasb.org/us-gaap/role/ref/legacyRef
-Name Accounting Standards Codification
-Topic 810
-SubTopic 10
-Section 55
-Paragraph 4J
-Publisher FASB
-URI https://asc.fasb.org//1943274/2147481175/810-10-55-4J
Reference 7: http://www.xbrl.org/2003/role/disclosureRef
-Topic 220
-SubTopic 10
-Name Accounting Standards Codification
-Section 45
-Paragraph 1A
-Subparagraph (a)
-Publisher FASB
-URI https://asc.fasb.org//1943274/2147482790/220-10-45-1A
Reference 8: http://www.xbrl.org/2003/role/disclosureRef
-Topic 220
-SubTopic 10
-Name Accounting Standards Codification
-Section 45
-Paragraph 1B
-Subparagraph (a)
-Publisher FASB
-URI https://asc.fasb.org//1943274/2147482790/220-10-45-1B
| Name: |
us-gaap_NetIncomeLossAttributableToNoncontrollingInterest |
| Namespace Prefix: |
us-gaap_ |
| Data Type: |
xbrli:monetaryItemType |
| Balance Type: |
debit |
| Period Type: |
duration |
|
| X |
- DefinitionAmount after tax and reclassification adjustments of gain (loss) on foreign currency translation adjustments, foreign currency transactions designated and effective as economic hedges of a net investment in a foreign entity and intra-entity foreign currency transactions that are of a long-term-investment nature. Reference 1: http://fasb.org/us-gaap/role/ref/legacyRef
-Name Accounting Standards Codification
-Section 45
-Paragraph 10A
-Subparagraph (a)
-SubTopic 10
-Topic 220
-Publisher FASB
-URI https://asc.fasb.org//1943274/2147482790/220-10-45-10A
| Name: |
us-gaap_OtherComprehensiveIncomeLossForeignCurrencyTransactionAndTranslationAdjustmentNetOfTax |
| Namespace Prefix: |
us-gaap_ |
| Data Type: |
xbrli:monetaryItemType |
| Balance Type: |
credit |
| Period Type: |
duration |
|
| X |
- DefinitionThe consolidated profit or loss for the period, net of income taxes, including the portion attributable to the noncontrolling interest. Reference 1: http://www.xbrl.org/2003/role/disclosureRef
-Topic 235
-SubTopic 10
-Name Accounting Standards Codification
-Section S99
-Paragraph 1
-Subparagraph (SX 210.4-08(g)(1)(ii))
-Publisher FASB
-URI https://asc.fasb.org//1943274/2147480678/235-10-S99-1
Reference 2: http://www.xbrl.org/2003/role/disclosureRef
-Topic 323
-SubTopic 10
-Name Accounting Standards Codification
-Section 50
-Paragraph 3
-Subparagraph (c)
-Publisher FASB
-URI https://asc.fasb.org//1943274/2147481687/323-10-50-3
Reference 3: http://www.xbrl.org/2003/role/disclosureRef
-Topic 825
-SubTopic 10
-Name Accounting Standards Codification
-Section 50
-Paragraph 28
-Subparagraph (f)
-Publisher FASB
-URI https://asc.fasb.org//1943274/2147482907/825-10-50-28
Reference 4: http://www.xbrl.org/2003/role/disclosureRef
-Topic 250
-SubTopic 10
-Name Accounting Standards Codification
-Section 50
-Paragraph 1
-Subparagraph (b)(2)
-Publisher FASB
-URI https://asc.fasb.org//1943274/2147483443/250-10-50-1
Reference 5: http://www.xbrl.org/2003/role/disclosureRef
-Topic 815
-SubTopic 40
-Name Accounting Standards Codification
-Section 65
-Paragraph 1
-Subparagraph (f)
-Publisher FASB
-URI https://asc.fasb.org//1943274/2147480175/815-40-65-1
Reference 6: http://www.xbrl.org/2003/role/disclosureRef
-Topic 250
-SubTopic 10
-Name Accounting Standards Codification
-Section 50
-Paragraph 8
-Publisher FASB
-URI https://asc.fasb.org//1943274/2147483443/250-10-50-8
Reference 7: http://www.xbrl.org/2003/role/disclosureRef
-Topic 250
-SubTopic 10
-Name Accounting Standards Codification
-Section 50
-Paragraph 9
-Publisher FASB
-URI https://asc.fasb.org//1943274/2147483443/250-10-50-9
Reference 8: http://www.xbrl.org/2003/role/exampleRef
-Topic 946
-SubTopic 830
-Name Accounting Standards Codification
-Section 55
-Paragraph 11
-Publisher FASB
-URI https://asc.fasb.org//1943274/2147480167/946-830-55-11
Reference 9: http://www.xbrl.org/2003/role/disclosureRef
-Topic 946
-SubTopic 205
-Name Accounting Standards Codification
-Section 45
-Paragraph 3
-Subparagraph (a)
-Publisher FASB
-URI https://asc.fasb.org//1943274/2147480767/946-205-45-3
Reference 10: http://www.xbrl.org/2003/role/disclosureRef
-Topic 946
-SubTopic 220
-Name Accounting Standards Codification
-Section 45
-Paragraph 7
-Publisher FASB
-URI https://asc.fasb.org//1943274/2147483581/946-220-45-7
Reference 11: http://www.xbrl.org/2003/role/disclosureRef
-Topic 944
-SubTopic 220
-Name Accounting Standards Codification
-Section S99
-Paragraph 1
-Subparagraph (SX 210.7-04(16))
-Publisher FASB
-URI https://asc.fasb.org//1943274/2147483586/944-220-S99-1
Reference 12: http://www.xbrl.org/2003/role/disclosureRef
-Topic 280
-SubTopic 10
-Name Accounting Standards Codification
-Section 50
-Paragraph 22
-Publisher FASB
-URI https://asc.fasb.org//1943274/2147482810/280-10-50-22
Reference 13: http://www.xbrl.org/2003/role/disclosureRef
-Topic 946
-SubTopic 220
-Name Accounting Standards Codification
-Section S99
-Paragraph 1
-Subparagraph (SX 210.6-07(9))
-Publisher FASB
-URI https://asc.fasb.org//1943274/2147483575/946-220-S99-1
Reference 14: http://www.xbrl.org/2003/role/disclosureRef
-Topic 946
-SubTopic 220
-Name Accounting Standards Codification
-Section S99
-Paragraph 3
-Subparagraph (SX 210.6-09(1)(d))
-Publisher FASB
-URI https://asc.fasb.org//1943274/2147483575/946-220-S99-3
Reference 15: http://www.xbrl.org/2003/role/disclosureRef
-Topic 810
-SubTopic 10
-Name Accounting Standards Codification
-Section 45
-Paragraph 19
-Publisher FASB
-URI https://asc.fasb.org//1943274/2147481231/810-10-45-19
Reference 16: http://www.xbrl.org/2009/role/commonPracticeRef
-Topic 220
-SubTopic 10
-Name Accounting Standards Codification
-Section 50
-Paragraph 6
-Publisher FASB
-URI https://asc.fasb.org//1943274/2147482765/220-10-50-6
Reference 17: http://www.xbrl.org/2003/role/disclosureRef
-Topic 470
-SubTopic 10
-Name Accounting Standards Codification
-Section S99
-Paragraph 1A
-Subparagraph (SX 210.13-01(a)(4)(i))
-Publisher FASB
-URI https://asc.fasb.org//1943274/2147480097/470-10-S99-1A
Reference 18: http://www.xbrl.org/2009/role/commonPracticeRef
-Topic 470
-SubTopic 10
-Name Accounting Standards Codification
-Section S99
-Paragraph 1A
-Subparagraph (SX 210.13-01(a)(4)(ii))
-Publisher FASB
-URI https://asc.fasb.org//1943274/2147480097/470-10-S99-1A
Reference 19: http://www.xbrl.org/2003/role/disclosureRef
-Topic 470
-SubTopic 10
-Name Accounting Standards Codification
-Section S99
-Paragraph 1A
-Subparagraph (SX 210.13-01(a)(4)(iii)(A))
-Publisher FASB
-URI https://asc.fasb.org//1943274/2147480097/470-10-S99-1A
Reference 20: http://www.xbrl.org/2003/role/disclosureRef
-Topic 470
-SubTopic 10
-Name Accounting Standards Codification
-Section S99
-Paragraph 1A
-Subparagraph (SX 210.13-01(a)(4)(iv))
-Publisher FASB
-URI https://asc.fasb.org//1943274/2147480097/470-10-S99-1A
Reference 21: http://www.xbrl.org/2003/role/disclosureRef
-Topic 470
-SubTopic 10
-Name Accounting Standards Codification
-Section S99
-Paragraph 1A
-Subparagraph (SX 210.13-01(a)(5))
-Publisher FASB
-URI https://asc.fasb.org//1943274/2147480097/470-10-S99-1A
Reference 22: http://www.xbrl.org/2003/role/disclosureRef
-Topic 470
-SubTopic 10
-Name Accounting Standards Codification
-Section S99
-Paragraph 1B
-Subparagraph (SX 210.13-02(a)(4)(i))
-Publisher FASB
-URI https://asc.fasb.org//1943274/2147480097/470-10-S99-1B
Reference 23: http://www.xbrl.org/2003/role/disclosureRef
-Topic 470
-SubTopic 10
-Name Accounting Standards Codification
-Section S99
-Paragraph 1B
-Subparagraph (SX 210.13-02(a)(4)(iii)(A))
-Publisher FASB
-URI https://asc.fasb.org//1943274/2147480097/470-10-S99-1B
Reference 24: http://www.xbrl.org/2003/role/disclosureRef
-Topic 470
-SubTopic 10
-Name Accounting Standards Codification
-Section S99
-Paragraph 1B
-Subparagraph (SX 210.13-02(a)(4)(iii)(B))
-Publisher FASB
-URI https://asc.fasb.org//1943274/2147480097/470-10-S99-1B
Reference 25: http://www.xbrl.org/2003/role/disclosureRef
-Topic 470
-SubTopic 10
-Name Accounting Standards Codification
-Section S99
-Paragraph 1B
-Subparagraph (SX 210.13-02(a)(4)(iv))
-Publisher FASB
-URI https://asc.fasb.org//1943274/2147480097/470-10-S99-1B
Reference 26: http://www.xbrl.org/2003/role/disclosureRef
-Topic 470
-SubTopic 10
-Name Accounting Standards Codification
-Section S99
-Paragraph 1B
-Subparagraph (SX 210.13-02(a)(5))
-Publisher FASB
-URI https://asc.fasb.org//1943274/2147480097/470-10-S99-1B
Reference 27: http://www.xbrl.org/2003/role/disclosureRef
-Topic 280
-SubTopic 10
-Name Accounting Standards Codification
-Section 50
-Paragraph 30
-Subparagraph (b)
-Publisher FASB
-URI https://asc.fasb.org//1943274/2147482810/280-10-50-30
Reference 28: http://www.xbrl.org/2003/role/disclosureRef
-Topic 280
-SubTopic 10
-Name Accounting Standards Codification
-Section 50
-Paragraph 32
-Subparagraph (f)
-Publisher FASB
-URI https://asc.fasb.org//1943274/2147482810/280-10-50-32
Reference 29: http://www.xbrl.org/2003/role/exampleRef
-Topic 280
-SubTopic 10
-Name Accounting Standards Codification
-Section 50
-Paragraph 31
-Publisher FASB
-URI https://asc.fasb.org//1943274/2147482810/280-10-50-31
Reference 30: http://www.xbrl.org/2003/role/disclosureRef
-Topic 280
-SubTopic 10
-Name Accounting Standards Codification
-Section 50
-Paragraph 32
-Subparagraph (c)
-Publisher FASB
-URI https://asc.fasb.org//1943274/2147482810/280-10-50-32
Reference 31: http://www.xbrl.org/2003/role/disclosureRef
-Topic 942
-SubTopic 235
-Name Accounting Standards Codification
-Section S99
-Paragraph 1
-Subparagraph (SX 210.9-05(b)(2))
-Publisher FASB
-URI https://asc.fasb.org//1943274/2147479557/942-235-S99-1
Reference 32: http://www.xbrl.org/2003/role/disclosureRef
-Topic 205
-SubTopic 20
-Name Accounting Standards Codification
-Section 50
-Paragraph 7
-Publisher FASB
-URI https://asc.fasb.org//1943274/2147483499/205-20-50-7
Reference 33: http://www.xbrl.org/2003/role/exampleRef
-Topic 810
-SubTopic 10
-Name Accounting Standards Codification
-Section 55
-Paragraph 4J
-Publisher FASB
-URI https://asc.fasb.org//1943274/2147481175/810-10-55-4J
Reference 34: http://www.xbrl.org/2003/role/exampleRef
-Topic 810
-SubTopic 10
-Name Accounting Standards Codification
-Section 55
-Paragraph 4K
-Publisher FASB
-URI https://asc.fasb.org//1943274/2147481175/810-10-55-4K
Reference 35: http://www.xbrl.org/2003/role/disclosureRef
-Topic 220
-SubTopic 10
-Name Accounting Standards Codification
-Section 45
-Paragraph 1A
-Subparagraph (a)
-Publisher FASB
-URI https://asc.fasb.org//1943274/2147482790/220-10-45-1A
Reference 36: http://www.xbrl.org/2003/role/disclosureRef
-Topic 220
-SubTopic 10
-Name Accounting Standards Codification
-Section 45
-Paragraph 1B
-Subparagraph (a)
-Publisher FASB
-URI https://asc.fasb.org//1943274/2147482790/220-10-45-1B
Reference 37: http://www.xbrl.org/2003/role/disclosureRef
-Topic 230
-SubTopic 10
-Name Accounting Standards Codification
-Section 45
-Paragraph 2
-Publisher FASB
-URI https://asc.fasb.org//1943274/2147482740/230-10-45-2
Reference 38: http://www.xbrl.org/2003/role/disclosureRef
-Topic 810
-SubTopic 10
-Name Accounting Standards Codification
-Section 50
-Paragraph 1A
-Subparagraph (a)(1)
-Publisher FASB
-URI https://asc.fasb.org//1943274/2147481203/810-10-50-1A
Reference 39: http://www.xbrl.org/2003/role/disclosureRef
-Topic 810
-SubTopic 10
-Name Accounting Standards Codification
-Section 50
-Paragraph 1A
-Subparagraph (c)(1)
-Publisher FASB
-URI https://asc.fasb.org//1943274/2147481203/810-10-50-1A
| Name: |
us-gaap_ProfitLoss |
| Namespace Prefix: |
us-gaap_ |
| Data Type: |
xbrli:monetaryItemType |
| Balance Type: |
credit |
| Period Type: |
duration |
|
| X |
- References
+ Details
| Name: |
us-gaap_StatementOfIncomeAndComprehensiveIncomeAbstract |
| Namespace Prefix: |
us-gaap_ |
| Data Type: |
xbrli:stringItemType |
| Balance Type: |
na |
| Period Type: |
duration |
|
v3.23.2
Condensed Consolidated Statements of Changes in Stockholders' Equity and Redeemable Noncontrolling Interest (Unaudited) - USD ($)
$ in Thousands |
Total |
Common Stock |
Additional Paid-In Capital |
Accumulated Deficit |
Accumulated Other Comprehensive Income (Loss) |
Redeemable Noncontrolling Interests |
Treasury Stock, Common |
Nonredeemable Noncontrolling Interest |
Parent, Including Nonredeemable Non-Controlling Interest |
| Increase (Decrease) in Stockholders' Equity [Roll Forward] |
|
|
|
|
|
|
|
|
|
| Total stockholders’ equity |
|
|
|
|
|
|
|
|
$ 255,183
|
| Beginning balance at Dec. 31, 2021 |
|
$ 543
|
$ 715,847
|
$ (231,967)
|
$ (5,886)
|
|
$ (223,354)
|
|
|
| Beginning balance (redeemable noncontrolling interest) at Dec. 31, 2021 |
|
|
|
|
|
$ 89,143
|
|
|
|
| Increase (Decrease) in Stockholders' Equity [Roll Forward] |
|
|
|
|
|
|
|
|
|
| Dividends ($0.57 per share) |
|
|
|
(55,153)
|
|
|
|
|
(55,153)
|
| Issuance of common stock |
|
7
|
793
|
|
|
|
|
|
800
|
| Repurchase of common stock |
|
|
|
|
|
|
(25,758)
|
|
(25,758)
|
| Issuance of restricted stock units—net |
|
|
2,641
|
|
|
|
|
|
2,641
|
| Amortization of restricted stock units—net |
|
|
22,863
|
|
|
|
|
|
22,863
|
| Net income (loss) |
$ 93,974
|
|
|
93,974
|
|
|
|
|
93,974
|
| Net Income (Loss) Attributable to Redeemable Noncontrolling Interest |
|
|
|
|
|
(20,984)
|
|
|
|
| Other comprehensive income (loss) |
|
|
|
|
(5,165)
|
|
|
|
(5,165)
|
| Net contributions (distributions) from noncontrolling interests |
$ 117,839
|
|
|
|
|
|
|
|
0
|
| Net contributions (distributions) attributable to noncontrolling interests |
|
|
|
|
|
117,839
|
|
|
|
| Ending balance at Jun. 30, 2022 |
|
550
|
742,144
|
(193,146)
|
(11,051)
|
|
(249,112)
|
|
|
| Ending balance (redeemable noncontrolling interest) at Jun. 30, 2022 |
|
|
|
|
|
185,998
|
|
|
|
| Increase (Decrease) in Stockholders' Equity [Roll Forward] |
|
|
|
|
|
|
|
|
|
| Dividends declared per share (in dollars per share) |
$ 1.10
|
|
|
|
|
|
|
|
|
| Total stockholders’ equity |
|
|
|
|
|
|
|
|
255,365
|
| Beginning balance at Mar. 31, 2022 |
|
550
|
728,644
|
(217,453)
|
(7,437)
|
|
(248,939)
|
|
|
| Beginning balance (redeemable noncontrolling interest) at Mar. 31, 2022 |
|
|
|
|
|
184,656
|
|
|
|
| Increase (Decrease) in Stockholders' Equity [Roll Forward] |
|
|
|
|
|
|
|
|
|
| Dividends ($0.57 per share) |
|
|
|
(27,649)
|
|
|
|
|
(27,649)
|
| Issuance of common stock |
|
0
|
358
|
|
|
|
|
|
358
|
| Repurchase of common stock |
|
|
|
|
|
|
(173)
|
|
(173)
|
| Issuance of restricted stock units—net |
|
|
1,391
|
|
|
|
|
|
1,391
|
| Amortization of restricted stock units—net |
|
|
11,751
|
|
|
|
|
|
11,751
|
| Net income (loss) |
$ 51,956
|
|
|
51,956
|
|
|
|
|
51,956
|
| Net Income (Loss) Attributable to Redeemable Noncontrolling Interest |
|
|
|
|
|
(25,807)
|
|
|
|
| Other comprehensive income (loss) |
|
|
|
|
(3,614)
|
|
|
|
(3,614)
|
| Net contributions (distributions) from noncontrolling interests |
|
|
|
|
|
|
|
|
0
|
| Net contributions (distributions) attributable to noncontrolling interests |
|
|
|
|
|
27,149
|
|
|
|
| Ending balance at Jun. 30, 2022 |
|
550
|
742,144
|
(193,146)
|
(11,051)
|
|
(249,112)
|
|
|
| Ending balance (redeemable noncontrolling interest) at Jun. 30, 2022 |
|
|
|
|
|
185,998
|
|
|
|
| Increase (Decrease) in Stockholders' Equity [Roll Forward] |
|
|
|
|
|
|
|
|
|
| Dividends declared per share (in dollars per share) |
$ 0.55
|
|
|
|
|
|
|
|
|
| Total stockholders’ equity |
|
|
|
|
|
|
|
|
289,385
|
| Nonredeemable noncontrolling interests |
$ 4,054
|
|
|
|
|
|
|
$ 4,054
|
|
| Total stockholders’ equity |
341,608
|
|
|
|
|
|
|
|
341,608
|
| Beginning balance at Dec. 31, 2022 |
337,554
|
551
|
769,373
|
(171,417)
|
(10,784)
|
|
(250,169)
|
|
|
| Beginning balance (redeemable noncontrolling interest) at Dec. 31, 2022 |
|
|
|
|
|
85,335
|
|
|
|
| Increase (Decrease) in Stockholders' Equity [Roll Forward] |
|
|
|
|
|
|
|
|
|
| Dividends ($0.57 per share) |
|
|
|
(57,906)
|
|
|
|
|
(57,906)
|
| Issuance of common stock |
|
7
|
791
|
|
|
|
|
|
798
|
| Repurchase of common stock |
|
|
|
|
|
|
(20,628)
|
|
(20,628)
|
| Issuance of restricted stock units—net |
|
|
2,486
|
|
|
|
|
|
2,486
|
| Amortization of restricted stock units—net |
|
|
21,509
|
|
|
|
|
|
21,509
|
| Net income (loss) |
67,092
|
|
|
67,092
|
|
|
|
|
66,652
|
| Net Income (Loss) Attributable to Redeemable Noncontrolling Interest |
|
|
|
|
|
2,151
|
|
(440)
|
|
| Other comprehensive income (loss) |
|
|
|
|
2,247
|
|
|
|
2,247
|
| Net contributions (distributions) from noncontrolling interests |
(345)
|
|
|
|
|
|
|
1,623
|
1,623
|
| Net contributions (distributions) attributable to noncontrolling interests |
|
|
|
|
|
(1,968)
|
|
|
|
| Ending balance at Jun. 30, 2023 |
$ 353,152
|
558
|
794,159
|
(162,231)
|
(8,537)
|
|
(270,797)
|
|
|
| Ending balance (redeemable noncontrolling interest) at Jun. 30, 2023 |
|
|
|
|
|
85,518
|
|
|
|
| Increase (Decrease) in Stockholders' Equity [Roll Forward] |
|
|
|
|
|
|
|
|
|
| Dividends declared per share (in dollars per share) |
$ 1.14
|
|
|
|
|
|
|
|
|
| Nonredeemable noncontrolling interests |
|
|
|
|
|
|
|
5,363
|
|
| Total stockholders’ equity |
|
|
|
|
|
|
|
|
342,345
|
| Beginning balance at Mar. 31, 2023 |
|
558
|
781,300
|
(165,053)
|
(9,213)
|
|
(270,610)
|
|
|
| Beginning balance (redeemable noncontrolling interest) at Mar. 31, 2023 |
|
|
|
|
|
87,249
|
|
|
|
| Increase (Decrease) in Stockholders' Equity [Roll Forward] |
|
|
|
|
|
|
|
|
|
| Dividends ($0.57 per share) |
|
|
|
(28,956)
|
|
|
|
|
(28,956)
|
| Issuance of common stock |
|
0
|
342
|
|
|
|
|
|
342
|
| Repurchase of common stock |
|
|
|
|
|
|
(187)
|
|
(187)
|
| Issuance of restricted stock units—net |
|
|
1,308
|
|
|
|
|
|
1,308
|
| Amortization of restricted stock units—net |
|
|
11,209
|
|
|
|
|
|
11,209
|
| Net income (loss) |
$ 31,778
|
|
|
31,778
|
|
|
|
|
31,585
|
| Net Income (Loss) Attributable to Redeemable Noncontrolling Interest |
|
|
|
|
|
920
|
|
(193)
|
|
| Other comprehensive income (loss) |
|
|
|
|
676
|
|
|
|
676
|
| Net contributions (distributions) from noncontrolling interests |
|
|
|
|
|
|
|
67
|
67
|
| Net contributions (distributions) attributable to noncontrolling interests |
|
|
|
|
|
(2,651)
|
|
|
|
| Ending balance at Jun. 30, 2023 |
$ 353,152
|
$ 558
|
$ 794,159
|
$ (162,231)
|
$ (8,537)
|
|
$ (270,797)
|
|
|
| Ending balance (redeemable noncontrolling interest) at Jun. 30, 2023 |
|
|
|
|
|
$ 85,518
|
|
|
|
| Increase (Decrease) in Stockholders' Equity [Roll Forward] |
|
|
|
|
|
|
|
|
|
| Dividends declared per share (in dollars per share) |
$ 0.57
|
|
|
|
|
|
|
|
|
| Nonredeemable noncontrolling interests |
$ 5,237
|
|
|
|
|
|
|
$ 5,237
|
|
| Total stockholders’ equity |
$ 358,389
|
|
|
|
|
|
|
|
$ 358,389
|
| X |
- DefinitionSubscriptions From Redemptions And Distributions To Noncontrolling Interest Holders
| Name: |
cns_SubscriptionsFromRedemptionsAndDistributionsToNoncontrollingInterestHolders |
| Namespace Prefix: |
cns_ |
| Data Type: |
xbrli:monetaryItemType |
| Balance Type: |
debit |
| Period Type: |
duration |
|
| X |
- DefinitionAmount of increase to additional paid-in capital (APIC) for recognition of cost for award under share-based payment arrangement. Reference 1: http://www.xbrl.org/2003/role/disclosureRef
-Topic 718
-SubTopic 10
-Name Accounting Standards Codification
-Section 35
-Paragraph 2
-Publisher FASB
-URI https://asc.fasb.org//1943274/2147480483/718-10-35-2
Reference 2: http://fasb.org/us-gaap/role/ref/legacyRef
-Name Accounting Standards Codification
-Topic 718
-SubTopic 20
-Section 55
-Paragraph 13
-Publisher FASB
-URI https://asc.fasb.org//1943274/2147481089/718-20-55-13
Reference 3: http://fasb.org/us-gaap/role/ref/legacyRef
-Name Accounting Standards Codification
-Topic 718
-SubTopic 20
-Section 55
-Paragraph 12
-Publisher FASB
-URI https://asc.fasb.org//1943274/2147481089/718-20-55-12
| Name: |
us-gaap_AdjustmentsToAdditionalPaidInCapitalSharebasedCompensationRequisiteServicePeriodRecognitionValue |
| Namespace Prefix: |
us-gaap_ |
| Data Type: |
xbrli:monetaryItemType |
| Balance Type: |
credit |
| Period Type: |
duration |
|
| X |
- DefinitionAggregate dividends declared during the period for each share of common stock outstanding. Reference 1: http://fasb.org/us-gaap/role/ref/legacyRef
-Topic 505
-SubTopic 10
-Name Accounting Standards Codification
-Section S99
-Paragraph 1
-Subparagraph (SX 210.3-04)
-Publisher FASB
-URI https://asc.fasb.org//1943274/2147480008/505-10-S99-1
| Name: |
us-gaap_CommonStockDividendsPerShareDeclared |
| Namespace Prefix: |
us-gaap_ |
| Data Type: |
dtr-types:perShareItemType |
| Balance Type: |
na |
| Period Type: |
duration |
|
| X |
- DefinitionAmount of paid and unpaid cash, stock, and paid-in-kind (PIK) dividends declared, for example, but not limited to, common and preferred stock. Reference 1: http://fasb.org/us-gaap/role/ref/legacyRef
-Topic 505
-SubTopic 10
-Name Accounting Standards Codification
-Section S99
-Paragraph 1
-Subparagraph (SX 210.3-04)
-Publisher FASB
-URI https://asc.fasb.org//1943274/2147480008/505-10-S99-1
Reference 2: http://fasb.org/us-gaap/role/ref/legacyRef
-Name Accounting Standards Codification
-Section 45
-Paragraph 2
-SubTopic 405
-Topic 942
-Publisher FASB
-URI https://asc.fasb.org//1943274/2147481071/942-405-45-2
| Name: |
us-gaap_Dividends |
| Namespace Prefix: |
us-gaap_ |
| Data Type: |
xbrli:monetaryItemType |
| Balance Type: |
debit |
| Period Type: |
duration |
|
| X |
- DefinitionA roll forward is a reconciliation of a concept from the beginning of a period to the end of a period.
| Name: |
us-gaap_IncreaseDecreaseInStockholdersEquityRollForward |
| Namespace Prefix: |
us-gaap_ |
| Data Type: |
xbrli:stringItemType |
| Balance Type: |
na |
| Period Type: |
duration |
|
| X |
- DefinitionAmount of equity (deficit) attributable to noncontrolling interest. Excludes temporary equity. Reference 1: http://www.xbrl.org/2003/role/disclosureRef
-Topic 235
-SubTopic 10
-Name Accounting Standards Codification
-Section S99
-Paragraph 1
-Subparagraph (SX 210.4-08(g)(1)(ii))
-Publisher FASB
-URI https://asc.fasb.org//1943274/2147480678/235-10-S99-1
Reference 2: http://www.xbrl.org/2003/role/disclosureRef
-Topic 323
-SubTopic 10
-Name Accounting Standards Codification
-Section 50
-Paragraph 3
-Subparagraph (c)
-Publisher FASB
-URI https://asc.fasb.org//1943274/2147481687/323-10-50-3
Reference 3: http://www.xbrl.org/2003/role/disclosureRef
-Topic 825
-SubTopic 10
-Name Accounting Standards Codification
-Section 50
-Paragraph 28
-Subparagraph (f)
-Publisher FASB
-URI https://asc.fasb.org//1943274/2147482907/825-10-50-28
Reference 4: http://www.xbrl.org/2003/role/disclosureRef
-Topic 944
-SubTopic 210
-Name Accounting Standards Codification
-Section S99
-Paragraph 1
-Subparagraph (SX 210.7-03(a)(24))
-Publisher FASB
-URI https://asc.fasb.org//1943274/2147479440/944-210-S99-1
Reference 5: http://www.xbrl.org/2003/role/disclosureRef
-Topic 946
-SubTopic 210
-Name Accounting Standards Codification
-Section S99
-Paragraph 1
-Subparagraph (SX 210.6-04(19))
-Publisher FASB
-URI https://asc.fasb.org//1943274/2147479617/946-210-S99-1
Reference 6: http://www.xbrl.org/2003/role/disclosureRef
-Topic 470
-SubTopic 10
-Name Accounting Standards Codification
-Section S99
-Paragraph 1A
-Subparagraph (SX 210.13-01(a)(4)(i))
-Publisher FASB
-URI https://asc.fasb.org//1943274/2147480097/470-10-S99-1A
Reference 7: http://www.xbrl.org/2003/role/disclosureRef
-Topic 470
-SubTopic 10
-Name Accounting Standards Codification
-Section S99
-Paragraph 1A
-Subparagraph (SX 210.13-01(a)(4)(iv))
-Publisher FASB
-URI https://asc.fasb.org//1943274/2147480097/470-10-S99-1A
Reference 8: http://www.xbrl.org/2003/role/disclosureRef
-Topic 470
-SubTopic 10
-Name Accounting Standards Codification
-Section S99
-Paragraph 1A
-Subparagraph (SX 210.13-01(a)(5))
-Publisher FASB
-URI https://asc.fasb.org//1943274/2147480097/470-10-S99-1A
Reference 9: http://www.xbrl.org/2003/role/disclosureRef
-Topic 470
-SubTopic 10
-Name Accounting Standards Codification
-Section S99
-Paragraph 1B
-Subparagraph (SX 210.13-02(a)(4)(i))
-Publisher FASB
-URI https://asc.fasb.org//1943274/2147480097/470-10-S99-1B
Reference 10: http://www.xbrl.org/2003/role/disclosureRef
-Topic 470
-SubTopic 10
-Name Accounting Standards Codification
-Section S99
-Paragraph 1B
-Subparagraph (SX 210.13-02(a)(4)(iv))
-Publisher FASB
-URI https://asc.fasb.org//1943274/2147480097/470-10-S99-1B
Reference 11: http://www.xbrl.org/2003/role/disclosureRef
-Topic 470
-SubTopic 10
-Name Accounting Standards Codification
-Section S99
-Paragraph 1B
-Subparagraph (SX 210.13-02(a)(5))
-Publisher FASB
-URI https://asc.fasb.org//1943274/2147480097/470-10-S99-1B
Reference 12: http://fasb.org/us-gaap/role/ref/legacyRef
-Topic 942
-SubTopic 210
-Name Accounting Standards Codification
-Section S99
-Paragraph 1
-Subparagraph (SX 210.9-03(22))
-Publisher FASB
-URI https://asc.fasb.org//1943274/2147479853/942-210-S99-1
Reference 13: http://fasb.org/us-gaap/role/ref/legacyRef
-Name Accounting Standards Codification
-Topic 210
-SubTopic 10
-Section S99
-Paragraph 1
-Subparagraph (SX 210.5-02.31)
-Publisher FASB
-URI https://asc.fasb.org//1943274/2147480566/210-10-S99-1
| Name: |
us-gaap_MinorityInterest |
| Namespace Prefix: |
us-gaap_ |
| Data Type: |
xbrli:monetaryItemType |
| Balance Type: |
credit |
| Period Type: |
instant |
|
| X |
- DefinitionThe portion of profit or loss for the period, net of income taxes, which is attributable to the parent. Reference 1: http://www.xbrl.org/2003/role/disclosureRef
-Topic 235
-SubTopic 10
-Name Accounting Standards Codification
-Section S99
-Paragraph 1
-Subparagraph (SX 210.4-08(g)(1)(ii))
-Publisher FASB
-URI https://asc.fasb.org//1943274/2147480678/235-10-S99-1
Reference 2: http://www.xbrl.org/2003/role/disclosureRef
-Topic 323
-SubTopic 10
-Name Accounting Standards Codification
-Section 50
-Paragraph 3
-Subparagraph (c)
-Publisher FASB
-URI https://asc.fasb.org//1943274/2147481687/323-10-50-3
Reference 3: http://www.xbrl.org/2003/role/disclosureRef
-Topic 825
-SubTopic 10
-Name Accounting Standards Codification
-Section 50
-Paragraph 28
-Subparagraph (f)
-Publisher FASB
-URI https://asc.fasb.org//1943274/2147482907/825-10-50-28
Reference 4: http://www.xbrl.org/2003/role/disclosureRef
-Topic 220
-SubTopic 10
-Name Accounting Standards Codification
-Section 50
-Paragraph 6
-Publisher FASB
-URI https://asc.fasb.org//1943274/2147482765/220-10-50-6
Reference 5: http://www.xbrl.org/2003/role/disclosureRef
-Topic 250
-SubTopic 10
-Name Accounting Standards Codification
-Section 50
-Paragraph 3
-Publisher FASB
-URI https://asc.fasb.org//1943274/2147483443/250-10-50-3
Reference 6: http://www.xbrl.org/2003/role/disclosureRef
-Topic 250
-SubTopic 10
-Name Accounting Standards Codification
-Section 50
-Paragraph 1
-Subparagraph (b)(2)
-Publisher FASB
-URI https://asc.fasb.org//1943274/2147483443/250-10-50-1
Reference 7: http://www.xbrl.org/2003/role/disclosureRef
-Topic 815
-SubTopic 40
-Name Accounting Standards Codification
-Section 65
-Paragraph 1
-Subparagraph (f)
-Publisher FASB
-URI https://asc.fasb.org//1943274/2147480175/815-40-65-1
Reference 8: http://www.xbrl.org/2003/role/disclosureRef
-Topic 250
-SubTopic 10
-Name Accounting Standards Codification
-Section 50
-Paragraph 8
-Publisher FASB
-URI https://asc.fasb.org//1943274/2147483443/250-10-50-8
Reference 9: http://www.xbrl.org/2003/role/disclosureRef
-Topic 250
-SubTopic 10
-Name Accounting Standards Codification
-Section 50
-Paragraph 9
-Publisher FASB
-URI https://asc.fasb.org//1943274/2147483443/250-10-50-9
Reference 10: http://www.xbrl.org/2003/role/disclosureRef
-Topic 250
-SubTopic 10
-Name Accounting Standards Codification
-Section 50
-Paragraph 11
-Subparagraph (a)
-Publisher FASB
-URI https://asc.fasb.org//1943274/2147483443/250-10-50-11
Reference 11: http://www.xbrl.org/2003/role/disclosureRef
-Topic 250
-SubTopic 10
-Name Accounting Standards Codification
-Section 50
-Paragraph 11
-Subparagraph (b)
-Publisher FASB
-URI https://asc.fasb.org//1943274/2147483443/250-10-50-11
Reference 12: http://www.xbrl.org/2003/role/disclosureRef
-Topic 250
-SubTopic 10
-Name Accounting Standards Codification
-Section 50
-Paragraph 4
-Publisher FASB
-URI https://asc.fasb.org//1943274/2147483443/250-10-50-4
Reference 13: http://www.xbrl.org/2003/role/exampleRef
-Topic 946
-SubTopic 830
-Name Accounting Standards Codification
-Section 55
-Paragraph 10
-Publisher FASB
-URI https://asc.fasb.org//1943274/2147480167/946-830-55-10
Reference 14: http://www.xbrl.org/2003/role/disclosureRef
-Topic 946
-SubTopic 220
-Name Accounting Standards Codification
-Section 45
-Paragraph 7
-Publisher FASB
-URI https://asc.fasb.org//1943274/2147483581/946-220-45-7
Reference 15: http://www.xbrl.org/2003/role/disclosureRef
-Topic 944
-SubTopic 220
-Name Accounting Standards Codification
-Section S99
-Paragraph 1
-Subparagraph (SX 210.7-04(18))
-Publisher FASB
-URI https://asc.fasb.org//1943274/2147483586/944-220-S99-1
Reference 16: http://www.xbrl.org/2003/role/disclosureRef
-Topic 280
-SubTopic 10
-Name Accounting Standards Codification
-Section 50
-Paragraph 22
-Publisher FASB
-URI https://asc.fasb.org//1943274/2147482810/280-10-50-22
Reference 17: http://www.xbrl.org/2003/role/disclosureRef
-Topic 946
-SubTopic 220
-Name Accounting Standards Codification
-Section S99
-Paragraph 1
-Subparagraph (SX 210.6-07(9))
-Publisher FASB
-URI https://asc.fasb.org//1943274/2147483575/946-220-S99-1
Reference 18: http://www.xbrl.org/2003/role/disclosureRef
-Topic 946
-SubTopic 220
-Name Accounting Standards Codification
-Section S99
-Paragraph 3
-Subparagraph (SX 210.6-09(1)(d))
-Publisher FASB
-URI https://asc.fasb.org//1943274/2147483575/946-220-S99-3
Reference 19: http://www.xbrl.org/2003/role/disclosureRef
-Topic 470
-SubTopic 10
-Name Accounting Standards Codification
-Section S99
-Paragraph 1A
-Subparagraph (SX 210.13-01(a)(4)(i))
-Publisher FASB
-URI https://asc.fasb.org//1943274/2147480097/470-10-S99-1A
Reference 20: http://www.xbrl.org/2009/role/commonPracticeRef
-Topic 470
-SubTopic 10
-Name Accounting Standards Codification
-Section S99
-Paragraph 1A
-Subparagraph (SX 210.13-01(a)(4)(ii))
-Publisher FASB
-URI https://asc.fasb.org//1943274/2147480097/470-10-S99-1A
Reference 21: http://www.xbrl.org/2003/role/disclosureRef
-Topic 470
-SubTopic 10
-Name Accounting Standards Codification
-Section S99
-Paragraph 1A
-Subparagraph (SX 210.13-01(a)(4)(iii)(A))
-Publisher FASB
-URI https://asc.fasb.org//1943274/2147480097/470-10-S99-1A
Reference 22: http://www.xbrl.org/2003/role/disclosureRef
-Topic 470
-SubTopic 10
-Name Accounting Standards Codification
-Section S99
-Paragraph 1A
-Subparagraph (SX 210.13-01(a)(4)(iv))
-Publisher FASB
-URI https://asc.fasb.org//1943274/2147480097/470-10-S99-1A
Reference 23: http://www.xbrl.org/2003/role/disclosureRef
-Topic 470
-SubTopic 10
-Name Accounting Standards Codification
-Section S99
-Paragraph 1A
-Subparagraph (SX 210.13-01(a)(5))
-Publisher FASB
-URI https://asc.fasb.org//1943274/2147480097/470-10-S99-1A
Reference 24: http://www.xbrl.org/2003/role/disclosureRef
-Topic 470
-SubTopic 10
-Name Accounting Standards Codification
-Section S99
-Paragraph 1B
-Subparagraph (SX 210.13-02(a)(4)(i))
-Publisher FASB
-URI https://asc.fasb.org//1943274/2147480097/470-10-S99-1B
Reference 25: http://www.xbrl.org/2003/role/disclosureRef
-Topic 470
-SubTopic 10
-Name Accounting Standards Codification
-Section S99
-Paragraph 1B
-Subparagraph (SX 210.13-02(a)(4)(iii)(A))
-Publisher FASB
-URI https://asc.fasb.org//1943274/2147480097/470-10-S99-1B
Reference 26: http://www.xbrl.org/2003/role/disclosureRef
-Topic 470
-SubTopic 10
-Name Accounting Standards Codification
-Section S99
-Paragraph 1B
-Subparagraph (SX 210.13-02(a)(4)(iii)(B))
-Publisher FASB
-URI https://asc.fasb.org//1943274/2147480097/470-10-S99-1B
Reference 27: http://www.xbrl.org/2003/role/disclosureRef
-Topic 470
-SubTopic 10
-Name Accounting Standards Codification
-Section S99
-Paragraph 1B
-Subparagraph (SX 210.13-02(a)(4)(iv))
-Publisher FASB
-URI https://asc.fasb.org//1943274/2147480097/470-10-S99-1B
Reference 28: http://www.xbrl.org/2003/role/disclosureRef
-Topic 470
-SubTopic 10
-Name Accounting Standards Codification
-Section S99
-Paragraph 1B
-Subparagraph (SX 210.13-02(a)(5))
-Publisher FASB
-URI https://asc.fasb.org//1943274/2147480097/470-10-S99-1B
Reference 29: http://www.xbrl.org/2003/role/disclosureRef
-Topic 280
-SubTopic 10
-Name Accounting Standards Codification
-Section 50
-Paragraph 30
-Subparagraph (b)
-Publisher FASB
-URI https://asc.fasb.org//1943274/2147482810/280-10-50-30
Reference 30: http://www.xbrl.org/2003/role/disclosureRef
-Topic 280
-SubTopic 10
-Name Accounting Standards Codification
-Section 50
-Paragraph 32
-Subparagraph (f)
-Publisher FASB
-URI https://asc.fasb.org//1943274/2147482810/280-10-50-32
Reference 31: http://www.xbrl.org/2003/role/disclosureRef
-Topic 260
-SubTopic 10
-Name Accounting Standards Codification
-Section 45
-Paragraph 60B
-Subparagraph (a)
-Publisher FASB
-URI https://asc.fasb.org//1943274/2147482689/260-10-45-60B
Reference 32: http://www.xbrl.org/2003/role/exampleRef
-Topic 280
-SubTopic 10
-Name Accounting Standards Codification
-Section 50
-Paragraph 31
-Publisher FASB
-URI https://asc.fasb.org//1943274/2147482810/280-10-50-31
Reference 33: http://www.xbrl.org/2003/role/disclosureRef
-Topic 280
-SubTopic 10
-Name Accounting Standards Codification
-Section 50
-Paragraph 32
-Subparagraph (c)
-Publisher FASB
-URI https://asc.fasb.org//1943274/2147482810/280-10-50-32
Reference 34: http://www.xbrl.org/2003/role/disclosureRef
-Topic 205
-SubTopic 20
-Name Accounting Standards Codification
-Section 50
-Paragraph 7
-Publisher FASB
-URI https://asc.fasb.org//1943274/2147483499/205-20-50-7
Reference 35: http://fasb.org/us-gaap/role/ref/legacyRef
-Topic 230
-SubTopic 10
-Name Accounting Standards Codification
-Section 45
-Paragraph 28
-Publisher FASB
-URI https://asc.fasb.org//1943274/2147482740/230-10-45-28
Reference 36: http://www.xbrl.org/2003/role/disclosureRef
-Topic 220
-SubTopic 10
-Name Accounting Standards Codification
-Section 45
-Paragraph 1A
-Subparagraph (a)
-Publisher FASB
-URI https://asc.fasb.org//1943274/2147482790/220-10-45-1A
Reference 37: http://www.xbrl.org/2003/role/disclosureRef
-Topic 220
-SubTopic 10
-Name Accounting Standards Codification
-Section 45
-Paragraph 1B
-Subparagraph (a)
-Publisher FASB
-URI https://asc.fasb.org//1943274/2147482790/220-10-45-1B
Reference 38: http://fasb.org/us-gaap/role/ref/legacyRef
-Topic 220
-SubTopic 10
-Name Accounting Standards Codification
-Section S99
-Paragraph 2
-Subparagraph (SX 210.5-03(20))
-Publisher FASB
-URI https://asc.fasb.org//1943274/2147483621/220-10-S99-2
Reference 39: http://fasb.org/us-gaap/role/ref/legacyRef
-Topic 942
-SubTopic 220
-Name Accounting Standards Codification
-Section S99
-Paragraph 1
-Subparagraph (SX 210.9-04(22))
-Publisher FASB
-URI https://asc.fasb.org//1943274/2147483589/942-220-S99-1
| Name: |
us-gaap_NetIncomeLoss |
| Namespace Prefix: |
us-gaap_ |
| Data Type: |
xbrli:monetaryItemType |
| Balance Type: |
credit |
| Period Type: |
duration |
|
| X |
- DefinitionAmount of Net Income (Loss) attributable to redeemable noncontrolling interest. Reference 1: http://fasb.org/us-gaap/role/ref/legacyRef
-Topic 220
-SubTopic 10
-Name Accounting Standards Codification
-Section S99
-Paragraph 2
-Subparagraph (SX 210.5-03.19)
-Publisher FASB
-URI https://asc.fasb.org//1943274/2147483621/220-10-S99-2
| Name: |
us-gaap_NetIncomeLossAttributableToRedeemableNoncontrollingInterest |
| Namespace Prefix: |
us-gaap_ |
| Data Type: |
xbrli:monetaryItemType |
| Balance Type: |
debit |
| Period Type: |
duration |
|
| X |
- DefinitionPortion of equity (net assets) in a subsidiary not attributable, directly or indirectly, to the parent entity which is not redeemable by the parent entity.
| Name: |
us-gaap_NonredeemableNoncontrollingInterest |
| Namespace Prefix: |
us-gaap_ |
| Data Type: |
xbrli:monetaryItemType |
| Balance Type: |
credit |
| Period Type: |
instant |
|
| X |
- DefinitionAmount after tax and reclassification adjustments of other comprehensive income (loss). Reference 1: http://fasb.org/us-gaap/role/ref/legacyRef
-Name Accounting Standards Codification
-Section 50
-Paragraph 2
-SubTopic 10
-Topic 505
-Publisher FASB
-URI https://asc.fasb.org//1943274/2147481112/505-10-50-2
Reference 2: http://www.xbrl.org/2003/role/disclosureRef
-Topic 830
-SubTopic 30
-Name Accounting Standards Codification
-Section 50
-Paragraph 1
-Publisher FASB
-URI https://asc.fasb.org//1943274/2147481674/830-30-50-1
Reference 3: http://www.xbrl.org/2003/role/disclosureRef
-Topic 830
-SubTopic 30
-Name Accounting Standards Codification
-Section 45
-Paragraph 17
-Publisher FASB
-URI https://asc.fasb.org//1943274/2147481694/830-30-45-17
Reference 4: http://www.xbrl.org/2003/role/disclosureRef
-Topic 944
-SubTopic 220
-Name Accounting Standards Codification
-Section S99
-Paragraph 1
-Subparagraph (SX 210.7-04(19))
-Publisher FASB
-URI https://asc.fasb.org//1943274/2147483586/944-220-S99-1
Reference 5: http://www.xbrl.org/2009/role/commonPracticeRef
-Topic 220
-SubTopic 10
-Name Accounting Standards Codification
-Section 50
-Paragraph 4
-Publisher FASB
-URI https://asc.fasb.org//1943274/2147482765/220-10-50-4
Reference 6: http://www.xbrl.org/2009/role/commonPracticeRef
-Topic 220
-SubTopic 10
-Name Accounting Standards Codification
-Section 50
-Paragraph 5
-Publisher FASB
-URI https://asc.fasb.org//1943274/2147482765/220-10-50-5
Reference 7: http://www.xbrl.org/2003/role/disclosureRef
-Topic 830
-SubTopic 30
-Name Accounting Standards Codification
-Section 45
-Paragraph 20
-Publisher FASB
-URI https://asc.fasb.org//1943274/2147481694/830-30-45-20
Reference 8: http://www.xbrl.org/2003/role/disclosureRef
-Topic 220
-SubTopic 10
-Name Accounting Standards Codification
-Section S99
-Paragraph 2
-Subparagraph (SX 210.5-03(21))
-Publisher FASB
-URI https://asc.fasb.org//1943274/2147483621/220-10-S99-2
Reference 9: http://www.xbrl.org/2003/role/disclosureRef
-Topic 942
-SubTopic 220
-Name Accounting Standards Codification
-Section S99
-Paragraph 1
-Subparagraph (SX 210.9-04(23))
-Publisher FASB
-URI https://asc.fasb.org//1943274/2147483589/942-220-S99-1
Reference 10: http://www.xbrl.org/2003/role/disclosureRef
-Topic 220
-SubTopic 10
-Name Accounting Standards Codification
-Section 45
-Paragraph 1B
-Subparagraph (b)
-Publisher FASB
-URI https://asc.fasb.org//1943274/2147482790/220-10-45-1B
Reference 11: http://fasb.org/us-gaap/role/ref/legacyRef
-Name Accounting Standards Codification
-Section 55
-Paragraph 15
-SubTopic 10
-Topic 220
-Publisher FASB
-URI https://asc.fasb.org//1943274/2147482739/220-10-55-15
Reference 12: http://www.xbrl.org/2003/role/disclosureRef
-Topic 220
-SubTopic 10
-Name Accounting Standards Codification
-Section 45
-Paragraph 1A
-Subparagraph (b)
-Publisher FASB
-URI https://asc.fasb.org//1943274/2147482790/220-10-45-1A
| Name: |
us-gaap_OtherComprehensiveIncomeLossNetOfTax |
| Namespace Prefix: |
us-gaap_ |
| Data Type: |
xbrli:monetaryItemType |
| Balance Type: |
credit |
| Period Type: |
duration |
|
| X |
- DefinitionAmount of cash inflow (outflow) from (to) a noncontrolling interest. Excludes dividends paid to the noncontrolling interest.
| Name: |
us-gaap_ProceedsFromPaymentsToMinorityShareholders |
| Namespace Prefix: |
us-gaap_ |
| Data Type: |
xbrli:monetaryItemType |
| Balance Type: |
debit |
| Period Type: |
duration |
|
| X |
- DefinitionEquity impact of the value of new stock issued during the period. Includes shares issued in an initial public offering or a secondary public offering. Reference 1: http://fasb.org/us-gaap/role/ref/legacyRef
-Name Accounting Standards Codification
-Section 50
-Paragraph 2
-SubTopic 10
-Topic 505
-Publisher FASB
-URI https://asc.fasb.org//1943274/2147481112/505-10-50-2
Reference 2: http://www.xbrl.org/2003/role/exampleRef
-Topic 946
-SubTopic 830
-Name Accounting Standards Codification
-Section 55
-Paragraph 11
-Publisher FASB
-URI https://asc.fasb.org//1943274/2147480167/946-830-55-11
Reference 3: http://www.xbrl.org/2003/role/disclosureRef
-Topic 946
-SubTopic 205
-Name Accounting Standards Codification
-Section 45
-Paragraph 4
-Subparagraph (a)
-Publisher FASB
-URI https://asc.fasb.org//1943274/2147480767/946-205-45-4
Reference 4: http://www.xbrl.org/2003/role/disclosureRef
-Topic 946
-SubTopic 505
-Name Accounting Standards Codification
-Section 50
-Paragraph 2
-Subparagraph (a)
-Publisher FASB
-URI https://asc.fasb.org//1943274/2147481004/946-505-50-2
Reference 5: http://www.xbrl.org/2003/role/disclosureRef
-Topic 946
-SubTopic 220
-Name Accounting Standards Codification
-Section S99
-Paragraph 3
-Subparagraph (SX 210.6-09(4)(b))
-Publisher FASB
-URI https://asc.fasb.org//1943274/2147483575/946-220-S99-3
Reference 6: http://fasb.org/us-gaap/role/ref/legacyRef
-Topic 210
-SubTopic 10
-Name Accounting Standards Codification
-Section S99
-Paragraph 1
-Subparagraph (SX 210.5-02(28))
-Publisher FASB
-URI https://asc.fasb.org//1943274/2147480566/210-10-S99-1
Reference 7: http://fasb.org/us-gaap/role/ref/legacyRef
-Topic 505
-SubTopic 10
-Name Accounting Standards Codification
-Section S99
-Paragraph 1
-Subparagraph (SX 210.3-04)
-Publisher FASB
-URI https://asc.fasb.org//1943274/2147480008/505-10-S99-1
Reference 8: http://fasb.org/us-gaap/role/ref/legacyRef
-Topic 210
-SubTopic 10
-Name Accounting Standards Codification
-Section S99
-Paragraph 1
-Subparagraph (SX 210.5-02(29))
-Publisher FASB
-URI https://asc.fasb.org//1943274/2147480566/210-10-S99-1
| Name: |
us-gaap_StockIssuedDuringPeriodValueNewIssues |
| Namespace Prefix: |
us-gaap_ |
| Data Type: |
xbrli:monetaryItemType |
| Balance Type: |
credit |
| Period Type: |
duration |
|
| X |
- DefinitionValue of stock related to Restricted Stock Awards issued during the period, net of the stock value of such awards forfeited. Reference 1: http://fasb.org/us-gaap/role/ref/legacyRef
-Name Accounting Standards Codification
-Section 50
-Paragraph 2
-SubTopic 10
-Topic 505
-Publisher FASB
-URI https://asc.fasb.org//1943274/2147481112/505-10-50-2
Reference 2: http://fasb.org/us-gaap/role/ref/legacyRef
-Topic 505
-SubTopic 10
-Name Accounting Standards Codification
-Section S99
-Paragraph 1
-Subparagraph (SX 210.3-04)
-Publisher FASB
-URI https://asc.fasb.org//1943274/2147480008/505-10-S99-1
| Name: |
us-gaap_StockIssuedDuringPeriodValueRestrictedStockAwardNetOfForfeitures |
| Namespace Prefix: |
us-gaap_ |
| Data Type: |
xbrli:monetaryItemType |
| Balance Type: |
credit |
| Period Type: |
duration |
|
| X |
- DefinitionEquity impact of the value of stock that has been repurchased during the period and has not been retired and is not held in treasury. Some state laws may mandate the circumstances under which an entity may acquire its own stock and prescribe the accounting treatment therefore. This element is used when state law does not recognize treasury stock. Reference 1: http://fasb.org/us-gaap/role/ref/legacyRef
-Name Accounting Standards Codification
-Section 50
-Paragraph 2
-SubTopic 10
-Topic 505
-Publisher FASB
-URI https://asc.fasb.org//1943274/2147481112/505-10-50-2
Reference 2: http://www.xbrl.org/2003/role/exampleRef
-Topic 946
-SubTopic 830
-Name Accounting Standards Codification
-Section 55
-Paragraph 11
-Publisher FASB
-URI https://asc.fasb.org//1943274/2147480167/946-830-55-11
Reference 3: http://www.xbrl.org/2003/role/disclosureRef
-Topic 946
-SubTopic 205
-Name Accounting Standards Codification
-Section 45
-Paragraph 4
-Subparagraph (a)
-Publisher FASB
-URI https://asc.fasb.org//1943274/2147480767/946-205-45-4
Reference 4: http://www.xbrl.org/2003/role/disclosureRef
-Topic 946
-SubTopic 505
-Name Accounting Standards Codification
-Section 50
-Paragraph 2
-Subparagraph (c)
-Publisher FASB
-URI https://asc.fasb.org//1943274/2147481004/946-505-50-2
Reference 5: http://www.xbrl.org/2003/role/disclosureRef
-Topic 946
-SubTopic 220
-Name Accounting Standards Codification
-Section S99
-Paragraph 3
-Subparagraph (SX 210.6-09(4)(b))
-Publisher FASB
-URI https://asc.fasb.org//1943274/2147483575/946-220-S99-3
Reference 6: http://fasb.org/us-gaap/role/ref/legacyRef
-Topic 210
-SubTopic 10
-Name Accounting Standards Codification
-Section S99
-Paragraph 1
-Subparagraph (SX 210.5-02(28))
-Publisher FASB
-URI https://asc.fasb.org//1943274/2147480566/210-10-S99-1
Reference 7: http://fasb.org/us-gaap/role/ref/legacyRef
-Topic 505
-SubTopic 10
-Name Accounting Standards Codification
-Section S99
-Paragraph 1
-Subparagraph (SX 210.3-04)
-Publisher FASB
-URI https://asc.fasb.org//1943274/2147480008/505-10-S99-1
Reference 8: http://fasb.org/us-gaap/role/ref/legacyRef
-Topic 210
-SubTopic 10
-Name Accounting Standards Codification
-Section S99
-Paragraph 1
-Subparagraph (SX 210.5-02(29))
-Publisher FASB
-URI https://asc.fasb.org//1943274/2147480566/210-10-S99-1
| Name: |
us-gaap_StockRepurchasedDuringPeriodValue |
| Namespace Prefix: |
us-gaap_ |
| Data Type: |
xbrli:monetaryItemType |
| Balance Type: |
debit |
| Period Type: |
duration |
|
| X |
- DefinitionAmount of equity (deficit) attributable to parent. Excludes temporary equity and equity attributable to noncontrolling interest. Reference 1: http://www.xbrl.org/2003/role/exampleRef
-Topic 852
-SubTopic 10
-Name Accounting Standards Codification
-Section 55
-Paragraph 10
-Publisher FASB
-URI https://asc.fasb.org//1943274/2147481372/852-10-55-10
Reference 2: http://www.xbrl.org/2003/role/exampleRef
-Topic 946
-SubTopic 830
-Name Accounting Standards Codification
-Section 55
-Paragraph 12
-Publisher FASB
-URI https://asc.fasb.org//1943274/2147480167/946-830-55-12
Reference 3: http://www.xbrl.org/2003/role/disclosureRef
-Topic 946
-SubTopic 210
-Name Accounting Standards Codification
-Section S99
-Paragraph 1
-Subparagraph (SX 210.6-04(19))
-Publisher FASB
-URI https://asc.fasb.org//1943274/2147479617/946-210-S99-1
Reference 4: http://www.xbrl.org/2003/role/disclosureRef
-Topic 946
-SubTopic 210
-Name Accounting Standards Codification
-Section S99
-Paragraph 2
-Subparagraph (SX 210.6-05(4))
-Publisher FASB
-URI https://asc.fasb.org//1943274/2147479617/946-210-S99-2
Reference 5: http://www.xbrl.org/2009/role/commonPracticeRef
-Topic 946
-SubTopic 220
-Name Accounting Standards Codification
-Section S99
-Paragraph 3
-Subparagraph (SX 210.6-09(4)(b))
-Publisher FASB
-URI https://asc.fasb.org//1943274/2147483575/946-220-S99-3
Reference 6: http://www.xbrl.org/2003/role/disclosureRef
-Topic 946
-SubTopic 220
-Name Accounting Standards Codification
-Section S99
-Paragraph 3
-Subparagraph (SX 210.6-09(6))
-Publisher FASB
-URI https://asc.fasb.org//1943274/2147483575/946-220-S99-3
Reference 7: http://www.xbrl.org/2003/role/disclosureRef
-Topic 946
-SubTopic 220
-Name Accounting Standards Codification
-Section S99
-Paragraph 3
-Subparagraph (SX 210.6-09(7))
-Publisher FASB
-URI https://asc.fasb.org//1943274/2147483575/946-220-S99-3
Reference 8: http://www.xbrl.org/2009/role/commonPracticeRef
-Topic 235
-SubTopic 10
-Name Accounting Standards Codification
-Section S99
-Paragraph 1
-Subparagraph (SX 210.4-08(g)(1)(ii))
-Publisher FASB
-URI https://asc.fasb.org//1943274/2147480678/235-10-S99-1
Reference 9: http://www.xbrl.org/2009/role/commonPracticeRef
-Topic 323
-SubTopic 10
-Name Accounting Standards Codification
-Section 50
-Paragraph 3
-Subparagraph (c)
-Publisher FASB
-URI https://asc.fasb.org//1943274/2147481687/323-10-50-3
Reference 10: http://www.xbrl.org/2009/role/commonPracticeRef
-Topic 825
-SubTopic 10
-Name Accounting Standards Codification
-Section 50
-Paragraph 28
-Subparagraph (f)
-Publisher FASB
-URI https://asc.fasb.org//1943274/2147482907/825-10-50-28
Reference 11: http://fasb.org/us-gaap/role/ref/legacyRef
-Topic 210
-SubTopic 10
-Name Accounting Standards Codification
-Section S99
-Paragraph 1
-Subparagraph (SX 210.5-02(29))
-Publisher FASB
-URI https://asc.fasb.org//1943274/2147480566/210-10-S99-1
Reference 12: http://fasb.org/us-gaap/role/ref/legacyRef
-Topic 210
-SubTopic 10
-Name Accounting Standards Codification
-Section S99
-Paragraph 1
-Subparagraph (SX 210.5-02(31))
-Publisher FASB
-URI https://asc.fasb.org//1943274/2147480566/210-10-S99-1
Reference 13: http://fasb.org/us-gaap/role/ref/legacyRef
-Topic 210
-SubTopic 10
-Name Accounting Standards Codification
-Section S99
-Paragraph 1
-Subparagraph (SX 210.5-02(30))
-Publisher FASB
-URI https://asc.fasb.org//1943274/2147480566/210-10-S99-1
Reference 14: http://fasb.org/us-gaap/role/ref/legacyRef
-Topic 310
-SubTopic 10
-Name Accounting Standards Codification
-Section S99
-Paragraph 2
-Subparagraph (SAB Topic 4.E)
-Publisher FASB
-URI https://asc.fasb.org//1943274/2147480418/310-10-S99-2
| Name: |
us-gaap_StockholdersEquity |
| Namespace Prefix: |
us-gaap_ |
| Data Type: |
xbrli:monetaryItemType |
| Balance Type: |
credit |
| Period Type: |
instant |
|
| X |
- DefinitionAmount of equity (deficit) attributable to parent and noncontrolling interest. Excludes temporary equity. Reference 1: http://www.xbrl.org/2003/role/disclosureRef
-Topic 250
-SubTopic 10
-Name Accounting Standards Codification
-Section 45
-Paragraph 24
-Publisher FASB
-URI https://asc.fasb.org//1943274/2147483421/250-10-45-24
Reference 2: http://www.xbrl.org/2003/role/disclosureRef
-Topic 250
-SubTopic 10
-Name Accounting Standards Codification
-Section 45
-Paragraph 23
-Subparagraph (b)
-Publisher FASB
-URI https://asc.fasb.org//1943274/2147483421/250-10-45-23
Reference 3: http://www.xbrl.org/2003/role/disclosureRef
-Topic 250
-SubTopic 10
-Name Accounting Standards Codification
-Section 45
-Paragraph 5
-Subparagraph (b)
-Publisher FASB
-URI https://asc.fasb.org//1943274/2147483421/250-10-45-5
Reference 4: http://www.xbrl.org/2003/role/disclosureRef
-Topic 326
-SubTopic 10
-Name Accounting Standards Codification
-Section 65
-Paragraph 5
-Subparagraph (c)(2)
-Publisher FASB
-URI https://asc.fasb.org//1943274/2147479654/326-10-65-5
Reference 5: http://www.xbrl.org/2003/role/disclosureRef
-Topic 815
-SubTopic 20
-Name Accounting Standards Codification
-Section 65
-Paragraph 6
-Subparagraph (e)
-Publisher FASB
-URI https://asc.fasb.org//1943274/2147480528/815-20-65-6
Reference 6: http://www.xbrl.org/2003/role/disclosureRef
-Topic 815
-SubTopic 20
-Name Accounting Standards Codification
-Section 65
-Paragraph 6
-Subparagraph (h)(1)
-Publisher FASB
-URI https://asc.fasb.org//1943274/2147480528/815-20-65-6
Reference 7: http://www.xbrl.org/2003/role/disclosureRef
-Topic 815
-SubTopic 20
-Name Accounting Standards Codification
-Section 65
-Paragraph 6
-Subparagraph (h)(1)(i)
-Publisher FASB
-URI https://asc.fasb.org//1943274/2147480528/815-20-65-6
Reference 8: http://www.xbrl.org/2003/role/disclosureRef
-Topic 815
-SubTopic 20
-Name Accounting Standards Codification
-Section 65
-Paragraph 6
-Subparagraph (h)(1)(iii)
-Publisher FASB
-URI https://asc.fasb.org//1943274/2147480528/815-20-65-6
Reference 9: http://www.xbrl.org/2003/role/disclosureRef
-Topic 815
-SubTopic 20
-Name Accounting Standards Codification
-Section 65
-Paragraph 6
-Subparagraph (h)(1)(iv)
-Publisher FASB
-URI https://asc.fasb.org//1943274/2147480528/815-20-65-6
Reference 10: http://www.xbrl.org/2003/role/disclosureRef
-Topic 815
-SubTopic 20
-Name Accounting Standards Codification
-Section 65
-Paragraph 6
-Subparagraph (i)(3)
-Publisher FASB
-URI https://asc.fasb.org//1943274/2147480528/815-20-65-6
Reference 11: http://www.xbrl.org/2003/role/disclosureRef
-Topic 848
-SubTopic 10
-Name Accounting Standards Codification
-Section 65
-Paragraph 2
-Subparagraph (a)(3)(iii)(03)
-Publisher FASB
-URI https://asc.fasb.org//1943274/2147483550/848-10-65-2
Reference 12: http://www.xbrl.org/2003/role/disclosureRef
-Topic 105
-SubTopic 10
-Name Accounting Standards Codification
-Section 65
-Paragraph 6
-Subparagraph (c)
-Publisher FASB
-URI https://asc.fasb.org//1943274/2147479343/105-10-65-6
Reference 13: http://www.xbrl.org/2003/role/disclosureRef
-Topic 105
-SubTopic 10
-Name Accounting Standards Codification
-Section 65
-Paragraph 6
-Subparagraph (d)
-Publisher FASB
-URI https://asc.fasb.org//1943274/2147479343/105-10-65-6
Reference 14: http://www.xbrl.org/2003/role/disclosureRef
-Topic 944
-SubTopic 40
-Name Accounting Standards Codification
-Section 65
-Paragraph 2
-Subparagraph (f)(1)
-Publisher FASB
-URI https://asc.fasb.org//1943274/2147480016/944-40-65-2
Reference 15: http://www.xbrl.org/2003/role/disclosureRef
-Topic 944
-SubTopic 40
-Name Accounting Standards Codification
-Section 65
-Paragraph 2
-Subparagraph (f)(2)
-Publisher FASB
-URI https://asc.fasb.org//1943274/2147480016/944-40-65-2
Reference 16: http://www.xbrl.org/2003/role/disclosureRef
-Topic 740
-SubTopic 10
-Name Accounting Standards Codification
-Section 65
-Paragraph 8
-Subparagraph (d)(2)
-Publisher FASB
-URI https://asc.fasb.org//1943274/2147482615/740-10-65-8
Reference 17: http://www.xbrl.org/2003/role/disclosureRef
-Topic 740
-SubTopic 10
-Name Accounting Standards Codification
-Section 65
-Paragraph 8
-Subparagraph (d)(3)
-Publisher FASB
-URI https://asc.fasb.org//1943274/2147482615/740-10-65-8
Reference 18: http://www.xbrl.org/2003/role/disclosureRef
-Topic 326
-SubTopic 10
-Name Accounting Standards Codification
-Section 65
-Paragraph 4
-Subparagraph (d)
-Publisher FASB
-URI https://asc.fasb.org//1943274/2147479654/326-10-65-4
Reference 19: http://www.xbrl.org/2003/role/disclosureRef
-Topic 718
-SubTopic 10
-Name Accounting Standards Codification
-Section 65
-Paragraph 15
-Subparagraph (e)
-Publisher FASB
-URI https://asc.fasb.org//1943274/2147480336/718-10-65-15
Reference 20: http://www.xbrl.org/2003/role/disclosureRef
-Topic 718
-SubTopic 10
-Name Accounting Standards Codification
-Section 65
-Paragraph 15
-Subparagraph (f)(1)
-Publisher FASB
-URI https://asc.fasb.org//1943274/2147480336/718-10-65-15
Reference 21: http://www.xbrl.org/2003/role/disclosureRef
-Topic 718
-SubTopic 10
-Name Accounting Standards Codification
-Section 65
-Paragraph 15
-Subparagraph (f)(2)
-Publisher FASB
-URI https://asc.fasb.org//1943274/2147480336/718-10-65-15
Reference 22: http://www.xbrl.org/2003/role/disclosureRef
-Topic 250
-SubTopic 10
-Name Accounting Standards Codification
-Section 50
-Paragraph 1
-Subparagraph (b)(3)
-Publisher FASB
-URI https://asc.fasb.org//1943274/2147483443/250-10-50-1
Reference 23: http://www.xbrl.org/2003/role/disclosureRef
-Topic 815
-SubTopic 40
-Name Accounting Standards Codification
-Section 65
-Paragraph 1
-Subparagraph (e)(3)
-Publisher FASB
-URI https://asc.fasb.org//1943274/2147480175/815-40-65-1
Reference 24: http://www.xbrl.org/2003/role/disclosureRef
-Topic 250
-SubTopic 10
-Name Accounting Standards Codification
-Section 50
-Paragraph 7
-Subparagraph (b)
-Publisher FASB
-URI https://asc.fasb.org//1943274/2147483443/250-10-50-7
Reference 25: http://www.xbrl.org/2003/role/disclosureRef
-Topic 220
-SubTopic 10
-Name Accounting Standards Codification
-Section 50
-Paragraph 5
-Publisher FASB
-URI https://asc.fasb.org//1943274/2147482765/220-10-50-5
Reference 26: http://www.xbrl.org/2003/role/disclosureRef
-Topic 830
-SubTopic 30
-Name Accounting Standards Codification
-Section 50
-Paragraph 1
-Publisher FASB
-URI https://asc.fasb.org//1943274/2147481674/830-30-50-1
Reference 27: http://www.xbrl.org/2003/role/disclosureRef
-Topic 830
-SubTopic 30
-Name Accounting Standards Codification
-Section 45
-Paragraph 17
-Publisher FASB
-URI https://asc.fasb.org//1943274/2147481694/830-30-45-17
Reference 28: http://www.xbrl.org/2003/role/disclosureRef
-Topic 830
-SubTopic 30
-Name Accounting Standards Codification
-Section 45
-Paragraph 20
-Subparagraph (a)
-Publisher FASB
-URI https://asc.fasb.org//1943274/2147481694/830-30-45-20
Reference 29: http://www.xbrl.org/2003/role/exampleRef
-Topic 946
-SubTopic 830
-Name Accounting Standards Codification
-Section 55
-Paragraph 11
-Publisher FASB
-URI https://asc.fasb.org//1943274/2147480167/946-830-55-11
Reference 30: http://www.xbrl.org/2003/role/disclosureRef
-Topic 946
-SubTopic 205
-Name Accounting Standards Codification
-Section 45
-Paragraph 3
-Publisher FASB
-URI https://asc.fasb.org//1943274/2147480767/946-205-45-3
Reference 31: http://www.xbrl.org/2003/role/disclosureRef
-Topic 946
-SubTopic 505
-Name Accounting Standards Codification
-Section 50
-Paragraph 3
-Publisher FASB
-URI https://asc.fasb.org//1943274/2147481004/946-505-50-3
Reference 32: http://www.xbrl.org/2003/role/disclosureRef
-Topic 946
-SubTopic 210
-Name Accounting Standards Codification
-Section S99
-Paragraph 1
-Subparagraph (SX 210.6-04(19))
-Publisher FASB
-URI https://asc.fasb.org//1943274/2147479617/946-210-S99-1
Reference 33: http://www.xbrl.org/2003/role/disclosureRef
-Topic 946
-SubTopic 210
-Name Accounting Standards Codification
-Section S99
-Paragraph 2
-Subparagraph (SX 210.6-05(4))
-Publisher FASB
-URI https://asc.fasb.org//1943274/2147479617/946-210-S99-2
Reference 34: http://www.xbrl.org/2009/role/commonPracticeRef
-Topic 946
-SubTopic 220
-Name Accounting Standards Codification
-Section S99
-Paragraph 3
-Subparagraph (SX 210.6-09(4)(b))
-Publisher FASB
-URI https://asc.fasb.org//1943274/2147483575/946-220-S99-3
Reference 35: http://www.xbrl.org/2003/role/disclosureRef
-Topic 946
-SubTopic 220
-Name Accounting Standards Codification
-Section S99
-Paragraph 3
-Subparagraph (SX 210.6-09(6))
-Publisher FASB
-URI https://asc.fasb.org//1943274/2147483575/946-220-S99-3
Reference 36: http://www.xbrl.org/2003/role/disclosureRef
-Topic 946
-SubTopic 220
-Name Accounting Standards Codification
-Section S99
-Paragraph 3
-Subparagraph (SX 210.6-09(7))
-Publisher FASB
-URI https://asc.fasb.org//1943274/2147483575/946-220-S99-3
Reference 37: http://www.xbrl.org/2003/role/disclosureRef
-Topic 505
-SubTopic 10
-Name Accounting Standards Codification
-Section S99
-Paragraph 1
-Subparagraph (SX 210.3-04)
-Publisher FASB
-URI https://asc.fasb.org//1943274/2147480008/505-10-S99-1
Reference 38: http://www.xbrl.org/2009/role/commonPracticeRef
-Topic 235
-SubTopic 10
-Name Accounting Standards Codification
-Section S99
-Paragraph 1
-Subparagraph (SX 210.4-08(g)(1)(ii))
-Publisher FASB
-URI https://asc.fasb.org//1943274/2147480678/235-10-S99-1
Reference 39: http://www.xbrl.org/2009/role/commonPracticeRef
-Topic 323
-SubTopic 10
-Name Accounting Standards Codification
-Section 50
-Paragraph 3
-Subparagraph (c)
-Publisher FASB
-URI https://asc.fasb.org//1943274/2147481687/323-10-50-3
Reference 40: http://www.xbrl.org/2009/role/commonPracticeRef
-Topic 825
-SubTopic 10
-Name Accounting Standards Codification
-Section 50
-Paragraph 28
-Subparagraph (f)
-Publisher FASB
-URI https://asc.fasb.org//1943274/2147482907/825-10-50-28
Reference 41: http://fasb.org/us-gaap/role/ref/legacyRef
-Name Accounting Standards Codification
-Topic 810
-SubTopic 10
-Section 45
-Paragraph 15
-Publisher FASB
-URI https://asc.fasb.org//1943274/2147481231/810-10-45-15
Reference 42: http://fasb.org/us-gaap/role/ref/legacyRef
-Name Accounting Standards Codification
-Topic 810
-SubTopic 10
-Section 45
-Paragraph 16
-Publisher FASB
-URI https://asc.fasb.org//1943274/2147481231/810-10-45-16
Reference 43: http://fasb.org/us-gaap/role/ref/legacyRef
-Name Accounting Standards Codification
-Topic 810
-SubTopic 10
-Section 55
-Paragraph 4I
-Publisher FASB
-URI https://asc.fasb.org//1943274/2147481175/810-10-55-4I
| Name: |
us-gaap_StockholdersEquityIncludingPortionAttributableToNoncontrollingInterest |
| Namespace Prefix: |
us-gaap_ |
| Data Type: |
xbrli:monetaryItemType |
| Balance Type: |
credit |
| Period Type: |
instant |
|
v3.23.2
Condensed Consolidated Statements of Cash Flows (Unaudited) - USD ($)
$ in Thousands |
6 Months Ended |
Jun. 30, 2023 |
Jun. 30, 2022 |
| Cash flows from operating activities: |
|
|
| Net income |
$ 68,803
|
$ 72,990
|
| Adjustments to reconcile net income to net cash provided by (used in) operating activities: |
|
|
| Stock-based compensation expense—net |
22,410
|
24,139
|
| Depreciation and amortization |
2,349
|
2,713
|
| Amortization of right-of-use assets |
7,973
|
5,426
|
| (Gain) loss from investments—net |
(48)
|
25,006
|
| Deferred income taxes |
480
|
1,834
|
| Foreign currency (gain) loss |
573
|
2,462
|
| Changes in operating assets and liabilities: |
|
|
| Accounts receivable |
2,886
|
5,914
|
| Due from brokers |
(474)
|
(2,977)
|
| Investments within consolidated investment vehicles |
(2,882)
|
(142,774)
|
| Other assets |
(7,082)
|
6,799
|
| Accrued compensation and benefits |
(46,277)
|
(34,499)
|
| Distribution and service fees payable |
139
|
1,773
|
| Operating lease liabilities |
(2,546)
|
(6,033)
|
| Due to brokers |
1,210
|
4,754
|
| Income tax payable |
(9,896)
|
(17,068)
|
| Other liabilities and accrued expenses |
1,097
|
771
|
| Net cash provided by (used in) operating activities |
38,715
|
(48,770)
|
| Cash flows from investing activities: |
|
|
| Purchases of investments |
(45,216)
|
(73,866)
|
| Proceeds from sales and maturities of investments |
34,125
|
31,827
|
| Purchases of property and equipment |
(20,131)
|
(1,562)
|
| Net cash provided by (used in) investing activities |
(31,222)
|
(43,601)
|
| Cash flows from financing activities: |
|
|
| Issuance of common stock—net |
678
|
680
|
| Repurchase of common stock |
(20,628)
|
(25,758)
|
| Dividends to stockholders |
(56,202)
|
(53,668)
|
| Payments of Debt Issuance Costs |
(603)
|
0
|
| Net contributions (distributions) from noncontrolling interests |
(345)
|
117,839
|
| Net cash provided by (used in) financing activities |
(77,100)
|
39,093
|
| Net increase (decrease) in cash and cash equivalents |
(69,607)
|
(53,278)
|
| Effect of foreign exchange rate changes on cash and cash equivalents |
2,044
|
(4,526)
|
| Cash and cash equivalents, beginning of the year |
248,714
|
184,373
|
| Cash and cash equivalents, end of the year |
$ 181,151
|
$ 126,569
|
| X |
- DefinitionIncrease (Decrease) In Operating Lease Liability, Noncurrent
| Name: |
cns_IncreaseDecreaseInOperatingLeaseLiabilityNoncurrent |
| Namespace Prefix: |
cns_ |
| Data Type: |
xbrli:monetaryItemType |
| Balance Type: |
debit |
| Period Type: |
duration |
|
| X |
- References
+ Details
| Name: |
us-gaap_AdjustmentsToReconcileNetIncomeLossToCashProvidedByUsedInOperatingActivitiesAbstract |
| Namespace Prefix: |
us-gaap_ |
| Data Type: |
xbrli:stringItemType |
| Balance Type: |
na |
| Period Type: |
duration |
|
| X |
- DefinitionAmount of cash and cash equivalents, and cash and cash equivalents restricted to withdrawal or usage. Excludes amount for disposal group and discontinued operations. Cash includes, but is not limited to, currency on hand, demand deposits with banks or financial institutions, and other accounts with general characteristics of demand deposits. Cash equivalents include, but are not limited to, short-term, highly liquid investments that are both readily convertible to known amounts of cash and so near their maturity that they present insignificant risk of changes in value because of changes in interest rates. Reference 1: http://www.xbrl.org/2003/role/disclosureRef
-Topic 230
-SubTopic 10
-Name Accounting Standards Codification
-Section 50
-Paragraph 8
-Publisher FASB
-URI https://asc.fasb.org//1943274/2147482913/230-10-50-8
Reference 2: http://fasb.org/us-gaap/role/ref/legacyRef
-Topic 230
-SubTopic 10
-Name Accounting Standards Codification
-Section 45
-Paragraph 24
-Publisher FASB
-URI https://asc.fasb.org//1943274/2147482740/230-10-45-24
Reference 3: http://fasb.org/us-gaap/role/ref/legacyRef
-Name Accounting Standards Codification
-Topic 230
-SubTopic 10
-Section 45
-Paragraph 4
-Publisher FASB
-URI https://asc.fasb.org//1943274/2147482740/230-10-45-4
| Name: |
us-gaap_CashCashEquivalentsRestrictedCashAndRestrictedCashEquivalents |
| Namespace Prefix: |
us-gaap_ |
| Data Type: |
xbrli:monetaryItemType |
| Balance Type: |
debit |
| Period Type: |
instant |
|
| X |
- DefinitionAmount of increase (decrease) in cash, cash equivalents, and cash and cash equivalents restricted to withdrawal or usage; including effect from exchange rate change. Cash includes, but is not limited to, currency on hand, demand deposits with banks or financial institutions, and other accounts with general characteristics of demand deposits. Cash equivalents include, but are not limited to, short-term, highly liquid investments that are both readily convertible to known amounts of cash and so near their maturity that they present insignificant risk of changes in value because of changes in interest rates. Reference 1: http://fasb.org/us-gaap/role/ref/legacyRef
-Topic 230
-SubTopic 10
-Name Accounting Standards Codification
-Section 45
-Paragraph 24
-Publisher FASB
-URI https://asc.fasb.org//1943274/2147482740/230-10-45-24
Reference 2: http://fasb.org/us-gaap/role/ref/legacyRef
-Name Accounting Standards Codification
-Section 45
-Paragraph 1
-SubTopic 230
-Topic 830
-Publisher FASB
-URI https://asc.fasb.org//1943274/2147481877/830-230-45-1
| Name: |
us-gaap_CashCashEquivalentsRestrictedCashAndRestrictedCashEquivalentsPeriodIncreaseDecreaseIncludingExchangeRateEffect |
| Namespace Prefix: |
us-gaap_ |
| Data Type: |
xbrli:monetaryItemType |
| Balance Type: |
debit |
| Period Type: |
duration |
|
| X |
- DefinitionThe aggregate net amount of depreciation, amortization, and accretion recognized during an accounting period. As a noncash item, the net amount is added back to net income when calculating cash provided by or used in operations using the indirect method. Reference 1: http://fasb.org/us-gaap/role/ref/legacyRef
-Name Accounting Standards Codification
-Section 45
-Paragraph 28
-Subparagraph (b)
-SubTopic 10
-Topic 230
-Publisher FASB
-URI https://asc.fasb.org//1943274/2147482740/230-10-45-28
| Name: |
us-gaap_DepreciationAmortizationAndAccretionNet |
| Namespace Prefix: |
us-gaap_ |
| Data Type: |
xbrli:monetaryItemType |
| Balance Type: |
debit |
| Period Type: |
duration |
|
| X |
- DefinitionAmount of increase (decrease) from effect of exchange rate changes on cash and cash equivalents, and cash and cash equivalents restricted to withdrawal or usage; held in foreign currencies. Excludes amounts for disposal group and discontinued operations. Cash includes, but is not limited to, currency on hand, demand deposits with banks or financial institutions, and other accounts with general characteristics of demand deposits. Cash equivalents include, but are not limited to, short-term, highly liquid investments that are both readily convertible to known amounts of cash and so near their maturity that they present insignificant risk of changes in value because of changes in interest rates. Reference 1: http://www.xbrl.org/2003/role/disclosureRef
-Topic 830
-SubTopic 230
-Name Accounting Standards Codification
-Section 45
-Paragraph 1
-Publisher FASB
-URI https://asc.fasb.org//1943274/2147481877/830-230-45-1
| Name: |
us-gaap_EffectOfExchangeRateOnCashCashEquivalentsRestrictedCashAndRestrictedCashEquivalents |
| Namespace Prefix: |
us-gaap_ |
| Data Type: |
xbrli:monetaryItemType |
| Balance Type: |
debit |
| Period Type: |
duration |
|
| X |
- DefinitionAmount of amortization expense attributable to right-of-use asset from finance lease. Reference 1: http://www.xbrl.org/2003/role/exampleRef
-Topic 842
-SubTopic 20
-Name Accounting Standards Codification
-Section 55
-Paragraph 53
-Publisher FASB
-URI https://asc.fasb.org//1943274/2147479589/842-20-55-53
Reference 2: http://www.xbrl.org/2003/role/disclosureRef
-Topic 842
-SubTopic 20
-Name Accounting Standards Codification
-Section 45
-Paragraph 4
-Subparagraph (a)
-Publisher FASB
-URI https://asc.fasb.org//1943274/2147479041/842-20-45-4
Reference 3: http://www.xbrl.org/2003/role/disclosureRef
-Topic 842
-SubTopic 20
-Name Accounting Standards Codification
-Section 50
-Paragraph 4
-Subparagraph (a)
-Publisher FASB
-URI https://asc.fasb.org//1943274/2147478964/842-20-50-4
| Name: |
us-gaap_FinanceLeaseRightOfUseAssetAmortization |
| Namespace Prefix: |
us-gaap_ |
| Data Type: |
xbrli:monetaryItemType |
| Balance Type: |
debit |
| Period Type: |
duration |
|
| X |
- DefinitionAmount, before tax, of realized and unrealized gain (loss) from foreign currency transaction. Reference 1: http://www.xbrl.org/2003/role/disclosureRef
-Topic 946
-SubTopic 220
-Name Accounting Standards Codification
-Section S99
-Paragraph 1
-Subparagraph (SX 210.6-07(7))
-Publisher FASB
-URI https://asc.fasb.org//1943274/2147483575/946-220-S99-1
Reference 2: http://www.xbrl.org/2003/role/disclosureRef
-Topic 830
-SubTopic 20
-Name Accounting Standards Codification
-Section 35
-Paragraph 1
-Publisher FASB
-URI https://asc.fasb.org//1943274/2147482014/830-20-35-1
Reference 3: http://www.xbrl.org/2003/role/disclosureRef
-Topic 830
-SubTopic 20
-Name Accounting Standards Codification
-Section 45
-Paragraph 1
-Publisher FASB
-URI https://asc.fasb.org//1943274/2147481956/830-20-45-1
Reference 4: http://www.xbrl.org/2003/role/disclosureRef
-Topic 830
-SubTopic 20
-Name Accounting Standards Codification
-Section 50
-Paragraph 1
-Publisher FASB
-URI https://asc.fasb.org//1943274/2147481926/830-20-50-1
Reference 5: http://www.xbrl.org/2003/role/disclosureRef
-Topic 830
-SubTopic 10
-Name Accounting Standards Codification
-Section 45
-Paragraph 17
-Publisher FASB
-URI https://asc.fasb.org//1943274/2147481839/830-10-45-17
| Name: |
us-gaap_ForeignCurrencyTransactionGainLossBeforeTax |
| Namespace Prefix: |
us-gaap_ |
| Data Type: |
xbrli:monetaryItemType |
| Balance Type: |
credit |
| Period Type: |
duration |
|
| X |
- DefinitionAmount of realized and unrealized gain (loss) on investment. Reference 1: http://www.xbrl.org/2003/role/recommendedDisclosureRef
-Topic 230
-SubTopic 10
-Name Accounting Standards Codification
-Section 45
-Paragraph 28
-Subparagraph (b)
-Publisher FASB
-URI https://asc.fasb.org//1943274/2147482740/230-10-45-28
Reference 2: http://fasb.org/us-gaap/role/ref/legacyRef
-Topic 220
-SubTopic 10
-Name Accounting Standards Codification
-Section S99
-Paragraph 2
-Subparagraph (SX 210.5-03.7(c),9(a))
-Publisher FASB
-URI https://asc.fasb.org//1943274/2147483621/220-10-S99-2
| Name: |
us-gaap_GainLossOnInvestments |
| Namespace Prefix: |
us-gaap_ |
| Data Type: |
xbrli:monetaryItemType |
| Balance Type: |
credit |
| Period Type: |
duration |
|
| X |
- DefinitionAmount of increase (decrease) in obligations incurred but not paid, and operating obligations classified as other. Reference 1: http://www.xbrl.org/2009/role/commonPracticeRef
-Topic 230
-SubTopic 10
-Name Accounting Standards Codification
-Section 45
-Paragraph 28
-Subparagraph (a)
-Publisher FASB
-URI https://asc.fasb.org//1943274/2147482740/230-10-45-28
| Name: |
us-gaap_IncreaseDecreaseInAccountsPayableAndOtherOperatingLiabilities |
| Namespace Prefix: |
us-gaap_ |
| Data Type: |
xbrli:monetaryItemType |
| Balance Type: |
debit |
| Period Type: |
duration |
|
| X |
- DefinitionThe increase (decrease) during the reporting period in amount due within one year (or one business cycle) from customers for the credit sale of goods and services. Reference 1: http://fasb.org/us-gaap/role/ref/legacyRef
-Name Accounting Standards Codification
-Section 45
-Paragraph 28
-Subparagraph (a)
-SubTopic 10
-Topic 230
-Publisher FASB
-URI https://asc.fasb.org//1943274/2147482740/230-10-45-28
| Name: |
us-gaap_IncreaseDecreaseInAccountsReceivable |
| Namespace Prefix: |
us-gaap_ |
| Data Type: |
xbrli:monetaryItemType |
| Balance Type: |
credit |
| Period Type: |
duration |
|
| X |
- DefinitionThe increase (decrease) during the reporting period in the total amount due to the entity related to activities and operations with other broker dealers, and clearing organizations, including deposits. Reference 1: http://fasb.org/us-gaap/role/ref/legacyRef
-Name Accounting Standards Codification
-Section 45
-Paragraph 28
-Subparagraph (a)
-SubTopic 10
-Topic 230
-Publisher FASB
-URI https://asc.fasb.org//1943274/2147482740/230-10-45-28
| Name: |
us-gaap_IncreaseDecreaseInBrokerageReceivables |
| Namespace Prefix: |
us-gaap_ |
| Data Type: |
xbrli:monetaryItemType |
| Balance Type: |
credit |
| Period Type: |
duration |
|
| X |
- References
+ Details
| Name: |
us-gaap_IncreaseDecreaseInOperatingCapitalAbstract |
| Namespace Prefix: |
us-gaap_ |
| Data Type: |
xbrli:stringItemType |
| Balance Type: |
na |
| Period Type: |
duration |
|
| X |
- DefinitionThe increase (decrease) during the reporting period in other expenses incurred but not yet paid. Reference 1: http://fasb.org/us-gaap/role/ref/legacyRef
-Name Accounting Standards Codification
-Section 45
-Paragraph 28
-Subparagraph (a)
-SubTopic 10
-Topic 230
-Publisher FASB
-URI https://asc.fasb.org//1943274/2147482740/230-10-45-28
| Name: |
us-gaap_IncreaseDecreaseInOtherAccruedLiabilities |
| Namespace Prefix: |
us-gaap_ |
| Data Type: |
xbrli:monetaryItemType |
| Balance Type: |
debit |
| Period Type: |
duration |
|
| X |
- DefinitionAmount of increase (decrease) in operating assets classified as other. Reference 1: http://fasb.org/us-gaap/role/ref/legacyRef
-Name Accounting Standards Codification
-Section 45
-Paragraph 28
-Subparagraph (a)
-SubTopic 10
-Topic 230
-Publisher FASB
-URI https://asc.fasb.org//1943274/2147482740/230-10-45-28
| Name: |
us-gaap_IncreaseDecreaseInOtherOperatingAssets |
| Namespace Prefix: |
us-gaap_ |
| Data Type: |
xbrli:monetaryItemType |
| Balance Type: |
credit |
| Period Type: |
duration |
|
| X |
- DefinitionThe increase (decrease) during the reporting period in the aggregate amount of obligations incurred arising from transactions with broker-dealers, such as amounts due on margin and unsettled cash transactions; includes payables to brokers, dealers and clearing organizations. Reference 1: http://fasb.org/us-gaap/role/ref/legacyRef
-Name Accounting Standards Codification
-Section 45
-Paragraph 28
-Subparagraph (a)
-SubTopic 10
-Topic 230
-Publisher FASB
-URI https://asc.fasb.org//1943274/2147482740/230-10-45-28
| Name: |
us-gaap_IncreaseDecreaseInPayablesToBrokerDealers |
| Namespace Prefix: |
us-gaap_ |
| Data Type: |
xbrli:monetaryItemType |
| Balance Type: |
debit |
| Period Type: |
duration |
|
| X |
- DefinitionAmount of increase (decrease) of investment in debt and equity securities, measured at fair value with changes in fair value recognized in net income. Reference 1: http://fasb.org/us-gaap/role/ref/legacyRef
-Name Accounting Standards Codification
-Section 45
-Paragraph 28
-Subparagraph (a)
-SubTopic 10
-Topic 230
-Publisher FASB
-URI https://asc.fasb.org//1943274/2147482740/230-10-45-28
Reference 2: http://fasb.org/us-gaap/role/ref/legacyRef
-Name Accounting Standards Codification
-Topic 230
-SubTopic 10
-Section 45
-Paragraph 19
-Publisher FASB
-URI https://asc.fasb.org//1943274/2147482740/230-10-45-19
| Name: |
us-gaap_IncreaseDecreaseInTradingSecurities |
| Namespace Prefix: |
us-gaap_ |
| Data Type: |
xbrli:monetaryItemType |
| Balance Type: |
credit |
| Period Type: |
duration |
|
| X |
- DefinitionAmount of cash inflow (outflow) from financing activities, including discontinued operations. Financing activity cash flows include obtaining resources from owners and providing them with a return on, and a return of, their investment; borrowing money and repaying amounts borrowed, or settling the obligation; and obtaining and paying for other resources obtained from creditors on long-term credit. Reference 1: http://www.xbrl.org/2003/role/disclosureRef
-Topic 230
-SubTopic 10
-Name Accounting Standards Codification
-Section 45
-Paragraph 24
-Publisher FASB
-URI https://asc.fasb.org//1943274/2147482740/230-10-45-24
| Name: |
us-gaap_NetCashProvidedByUsedInFinancingActivities |
| Namespace Prefix: |
us-gaap_ |
| Data Type: |
xbrli:monetaryItemType |
| Balance Type: |
debit |
| Period Type: |
duration |
|
| X |
- References
+ Details
| Name: |
us-gaap_NetCashProvidedByUsedInFinancingActivitiesAbstract |
| Namespace Prefix: |
us-gaap_ |
| Data Type: |
xbrli:stringItemType |
| Balance Type: |
na |
| Period Type: |
duration |
|
| X |
- DefinitionAmount of cash inflow (outflow) from investing activities, including discontinued operations. Investing activity cash flows include making and collecting loans and acquiring and disposing of debt or equity instruments and property, plant, and equipment and other productive assets. Reference 1: http://www.xbrl.org/2003/role/disclosureRef
-Topic 230
-SubTopic 10
-Name Accounting Standards Codification
-Section 45
-Paragraph 24
-Publisher FASB
-URI https://asc.fasb.org//1943274/2147482740/230-10-45-24
| Name: |
us-gaap_NetCashProvidedByUsedInInvestingActivities |
| Namespace Prefix: |
us-gaap_ |
| Data Type: |
xbrli:monetaryItemType |
| Balance Type: |
debit |
| Period Type: |
duration |
|
| X |
- References
+ Details
| Name: |
us-gaap_NetCashProvidedByUsedInInvestingActivitiesAbstract |
| Namespace Prefix: |
us-gaap_ |
| Data Type: |
xbrli:stringItemType |
| Balance Type: |
na |
| Period Type: |
duration |
|
| X |
- DefinitionAmount of cash inflow (outflow) from operating activities, including discontinued operations. Operating activity cash flows include transactions, adjustments, and changes in value not defined as investing or financing activities. Reference 1: http://fasb.org/us-gaap/role/ref/legacyRef
-Topic 230
-SubTopic 10
-Name Accounting Standards Codification
-Section 45
-Paragraph 28
-Publisher FASB
-URI https://asc.fasb.org//1943274/2147482740/230-10-45-28
Reference 2: http://fasb.org/us-gaap/role/ref/legacyRef
-Topic 230
-SubTopic 10
-Name Accounting Standards Codification
-Section 45
-Paragraph 24
-Publisher FASB
-URI https://asc.fasb.org//1943274/2147482740/230-10-45-24
Reference 3: http://fasb.org/us-gaap/role/ref/legacyRef
-Topic 230
-SubTopic 10
-Name Accounting Standards Codification
-Section 45
-Paragraph 25
-Publisher FASB
-URI https://asc.fasb.org//1943274/2147482740/230-10-45-25
| Name: |
us-gaap_NetCashProvidedByUsedInOperatingActivities |
| Namespace Prefix: |
us-gaap_ |
| Data Type: |
xbrli:monetaryItemType |
| Balance Type: |
na |
| Period Type: |
duration |
|
| X |
- References
+ Details
| Name: |
us-gaap_NetCashProvidedByUsedInOperatingActivitiesAbstract |
| Namespace Prefix: |
us-gaap_ |
| Data Type: |
xbrli:stringItemType |
| Balance Type: |
na |
| Period Type: |
duration |
|
| X |
- DefinitionThe cash outflow to reacquire common stock during the period. Reference 1: http://fasb.org/us-gaap/role/ref/legacyRef
-Name Accounting Standards Codification
-Topic 230
-SubTopic 10
-Section 45
-Paragraph 15
-Subparagraph (a)
-Publisher FASB
-URI https://asc.fasb.org//1943274/2147482740/230-10-45-15
| Name: |
us-gaap_PaymentsForRepurchaseOfCommonStock |
| Namespace Prefix: |
us-gaap_ |
| Data Type: |
xbrli:monetaryItemType |
| Balance Type: |
credit |
| Period Type: |
duration |
|
| X |
- DefinitionThe cash outflow paid to third parties in connection with debt origination, which will be amortized over the remaining maturity period of the associated long-term debt. Reference 1: http://fasb.org/us-gaap/role/ref/legacyRef
-Name Accounting Standards Codification
-Topic 230
-SubTopic 10
-Section 45
-Paragraph 15
-Subparagraph (e)
-Publisher FASB
-URI https://asc.fasb.org//1943274/2147482740/230-10-45-15
| Name: |
us-gaap_PaymentsOfDebtIssuanceCosts |
| Namespace Prefix: |
us-gaap_ |
| Data Type: |
xbrli:monetaryItemType |
| Balance Type: |
credit |
| Period Type: |
duration |
|
| X |
- DefinitionAmount of cash outflow in the form of ordinary dividends to common shareholders of the parent entity. Reference 1: http://fasb.org/us-gaap/role/ref/legacyRef
-Name Accounting Standards Codification
-Topic 230
-SubTopic 10
-Section 45
-Paragraph 15
-Subparagraph (a)
-Publisher FASB
-URI https://asc.fasb.org//1943274/2147482740/230-10-45-15
| Name: |
us-gaap_PaymentsOfDividendsCommonStock |
| Namespace Prefix: |
us-gaap_ |
| Data Type: |
xbrli:monetaryItemType |
| Balance Type: |
credit |
| Period Type: |
duration |
|
| X |
- DefinitionThe cash outflow associated with the acquisition of long-lived, physical assets that are used in the normal conduct of business to produce goods and services and not intended for resale; includes cash outflows to pay for construction of self-constructed assets. Reference 1: http://fasb.org/us-gaap/role/ref/legacyRef
-Topic 230
-SubTopic 10
-Name Accounting Standards Codification
-Section 45
-Paragraph 13
-Subparagraph (c)
-Publisher FASB
-URI https://asc.fasb.org//1943274/2147482740/230-10-45-13
| Name: |
us-gaap_PaymentsToAcquirePropertyPlantAndEquipment |
| Namespace Prefix: |
us-gaap_ |
| Data Type: |
xbrli:monetaryItemType |
| Balance Type: |
credit |
| Period Type: |
duration |
|
| X |
- DefinitionThe cash inflow from the additional capital contribution to the entity. Reference 1: http://fasb.org/us-gaap/role/ref/legacyRef
-Name Accounting Standards Codification
-Section 45
-Paragraph 14
-Subparagraph (a)
-SubTopic 10
-Topic 230
-Publisher FASB
-URI https://asc.fasb.org//1943274/2147482740/230-10-45-14
| Name: |
us-gaap_ProceedsFromIssuanceOfCommonStock |
| Namespace Prefix: |
us-gaap_ |
| Data Type: |
xbrli:monetaryItemType |
| Balance Type: |
debit |
| Period Type: |
duration |
|
| X |
- DefinitionAmount of cash inflow (outflow) from (to) a noncontrolling interest. Excludes dividends paid to the noncontrolling interest.
| Name: |
us-gaap_ProceedsFromPaymentsToMinorityShareholders |
| Namespace Prefix: |
us-gaap_ |
| Data Type: |
xbrli:monetaryItemType |
| Balance Type: |
debit |
| Period Type: |
duration |
|
| X |
- DefinitionThe cash inflow associated with the sale, maturity and collection of all investments such as debt, security and so forth during the period. Reference 1: http://fasb.org/us-gaap/role/ref/legacyRef
-Name Accounting Standards Codification
-Topic 230
-SubTopic 10
-Section 45
-Paragraph 12
-Publisher FASB
-URI https://asc.fasb.org//1943274/2147482740/230-10-45-12
| Name: |
us-gaap_ProceedsFromSaleMaturityAndCollectionsOfInvestments |
| Namespace Prefix: |
us-gaap_ |
| Data Type: |
xbrli:monetaryItemType |
| Balance Type: |
debit |
| Period Type: |
duration |
|
| X |
- DefinitionThe consolidated profit or loss for the period, net of income taxes, including the portion attributable to the noncontrolling interest. Reference 1: http://www.xbrl.org/2003/role/disclosureRef
-Topic 235
-SubTopic 10
-Name Accounting Standards Codification
-Section S99
-Paragraph 1
-Subparagraph (SX 210.4-08(g)(1)(ii))
-Publisher FASB
-URI https://asc.fasb.org//1943274/2147480678/235-10-S99-1
Reference 2: http://www.xbrl.org/2003/role/disclosureRef
-Topic 323
-SubTopic 10
-Name Accounting Standards Codification
-Section 50
-Paragraph 3
-Subparagraph (c)
-Publisher FASB
-URI https://asc.fasb.org//1943274/2147481687/323-10-50-3
Reference 3: http://www.xbrl.org/2003/role/disclosureRef
-Topic 825
-SubTopic 10
-Name Accounting Standards Codification
-Section 50
-Paragraph 28
-Subparagraph (f)
-Publisher FASB
-URI https://asc.fasb.org//1943274/2147482907/825-10-50-28
Reference 4: http://www.xbrl.org/2003/role/disclosureRef
-Topic 250
-SubTopic 10
-Name Accounting Standards Codification
-Section 50
-Paragraph 1
-Subparagraph (b)(2)
-Publisher FASB
-URI https://asc.fasb.org//1943274/2147483443/250-10-50-1
Reference 5: http://www.xbrl.org/2003/role/disclosureRef
-Topic 815
-SubTopic 40
-Name Accounting Standards Codification
-Section 65
-Paragraph 1
-Subparagraph (f)
-Publisher FASB
-URI https://asc.fasb.org//1943274/2147480175/815-40-65-1
Reference 6: http://www.xbrl.org/2003/role/disclosureRef
-Topic 250
-SubTopic 10
-Name Accounting Standards Codification
-Section 50
-Paragraph 8
-Publisher FASB
-URI https://asc.fasb.org//1943274/2147483443/250-10-50-8
Reference 7: http://www.xbrl.org/2003/role/disclosureRef
-Topic 250
-SubTopic 10
-Name Accounting Standards Codification
-Section 50
-Paragraph 9
-Publisher FASB
-URI https://asc.fasb.org//1943274/2147483443/250-10-50-9
Reference 8: http://www.xbrl.org/2003/role/exampleRef
-Topic 946
-SubTopic 830
-Name Accounting Standards Codification
-Section 55
-Paragraph 11
-Publisher FASB
-URI https://asc.fasb.org//1943274/2147480167/946-830-55-11
Reference 9: http://www.xbrl.org/2003/role/disclosureRef
-Topic 946
-SubTopic 205
-Name Accounting Standards Codification
-Section 45
-Paragraph 3
-Subparagraph (a)
-Publisher FASB
-URI https://asc.fasb.org//1943274/2147480767/946-205-45-3
Reference 10: http://www.xbrl.org/2003/role/disclosureRef
-Topic 946
-SubTopic 220
-Name Accounting Standards Codification
-Section 45
-Paragraph 7
-Publisher FASB
-URI https://asc.fasb.org//1943274/2147483581/946-220-45-7
Reference 11: http://www.xbrl.org/2003/role/disclosureRef
-Topic 944
-SubTopic 220
-Name Accounting Standards Codification
-Section S99
-Paragraph 1
-Subparagraph (SX 210.7-04(16))
-Publisher FASB
-URI https://asc.fasb.org//1943274/2147483586/944-220-S99-1
Reference 12: http://www.xbrl.org/2003/role/disclosureRef
-Topic 280
-SubTopic 10
-Name Accounting Standards Codification
-Section 50
-Paragraph 22
-Publisher FASB
-URI https://asc.fasb.org//1943274/2147482810/280-10-50-22
Reference 13: http://www.xbrl.org/2003/role/disclosureRef
-Topic 946
-SubTopic 220
-Name Accounting Standards Codification
-Section S99
-Paragraph 1
-Subparagraph (SX 210.6-07(9))
-Publisher FASB
-URI https://asc.fasb.org//1943274/2147483575/946-220-S99-1
Reference 14: http://www.xbrl.org/2003/role/disclosureRef
-Topic 946
-SubTopic 220
-Name Accounting Standards Codification
-Section S99
-Paragraph 3
-Subparagraph (SX 210.6-09(1)(d))
-Publisher FASB
-URI https://asc.fasb.org//1943274/2147483575/946-220-S99-3
Reference 15: http://www.xbrl.org/2003/role/disclosureRef
-Topic 810
-SubTopic 10
-Name Accounting Standards Codification
-Section 45
-Paragraph 19
-Publisher FASB
-URI https://asc.fasb.org//1943274/2147481231/810-10-45-19
Reference 16: http://www.xbrl.org/2009/role/commonPracticeRef
-Topic 220
-SubTopic 10
-Name Accounting Standards Codification
-Section 50
-Paragraph 6
-Publisher FASB
-URI https://asc.fasb.org//1943274/2147482765/220-10-50-6
Reference 17: http://www.xbrl.org/2003/role/disclosureRef
-Topic 470
-SubTopic 10
-Name Accounting Standards Codification
-Section S99
-Paragraph 1A
-Subparagraph (SX 210.13-01(a)(4)(i))
-Publisher FASB
-URI https://asc.fasb.org//1943274/2147480097/470-10-S99-1A
Reference 18: http://www.xbrl.org/2009/role/commonPracticeRef
-Topic 470
-SubTopic 10
-Name Accounting Standards Codification
-Section S99
-Paragraph 1A
-Subparagraph (SX 210.13-01(a)(4)(ii))
-Publisher FASB
-URI https://asc.fasb.org//1943274/2147480097/470-10-S99-1A
Reference 19: http://www.xbrl.org/2003/role/disclosureRef
-Topic 470
-SubTopic 10
-Name Accounting Standards Codification
-Section S99
-Paragraph 1A
-Subparagraph (SX 210.13-01(a)(4)(iii)(A))
-Publisher FASB
-URI https://asc.fasb.org//1943274/2147480097/470-10-S99-1A
Reference 20: http://www.xbrl.org/2003/role/disclosureRef
-Topic 470
-SubTopic 10
-Name Accounting Standards Codification
-Section S99
-Paragraph 1A
-Subparagraph (SX 210.13-01(a)(4)(iv))
-Publisher FASB
-URI https://asc.fasb.org//1943274/2147480097/470-10-S99-1A
Reference 21: http://www.xbrl.org/2003/role/disclosureRef
-Topic 470
-SubTopic 10
-Name Accounting Standards Codification
-Section S99
-Paragraph 1A
-Subparagraph (SX 210.13-01(a)(5))
-Publisher FASB
-URI https://asc.fasb.org//1943274/2147480097/470-10-S99-1A
Reference 22: http://www.xbrl.org/2003/role/disclosureRef
-Topic 470
-SubTopic 10
-Name Accounting Standards Codification
-Section S99
-Paragraph 1B
-Subparagraph (SX 210.13-02(a)(4)(i))
-Publisher FASB
-URI https://asc.fasb.org//1943274/2147480097/470-10-S99-1B
Reference 23: http://www.xbrl.org/2003/role/disclosureRef
-Topic 470
-SubTopic 10
-Name Accounting Standards Codification
-Section S99
-Paragraph 1B
-Subparagraph (SX 210.13-02(a)(4)(iii)(A))
-Publisher FASB
-URI https://asc.fasb.org//1943274/2147480097/470-10-S99-1B
Reference 24: http://www.xbrl.org/2003/role/disclosureRef
-Topic 470
-SubTopic 10
-Name Accounting Standards Codification
-Section S99
-Paragraph 1B
-Subparagraph (SX 210.13-02(a)(4)(iii)(B))
-Publisher FASB
-URI https://asc.fasb.org//1943274/2147480097/470-10-S99-1B
Reference 25: http://www.xbrl.org/2003/role/disclosureRef
-Topic 470
-SubTopic 10
-Name Accounting Standards Codification
-Section S99
-Paragraph 1B
-Subparagraph (SX 210.13-02(a)(4)(iv))
-Publisher FASB
-URI https://asc.fasb.org//1943274/2147480097/470-10-S99-1B
Reference 26: http://www.xbrl.org/2003/role/disclosureRef
-Topic 470
-SubTopic 10
-Name Accounting Standards Codification
-Section S99
-Paragraph 1B
-Subparagraph (SX 210.13-02(a)(5))
-Publisher FASB
-URI https://asc.fasb.org//1943274/2147480097/470-10-S99-1B
Reference 27: http://www.xbrl.org/2003/role/disclosureRef
-Topic 280
-SubTopic 10
-Name Accounting Standards Codification
-Section 50
-Paragraph 30
-Subparagraph (b)
-Publisher FASB
-URI https://asc.fasb.org//1943274/2147482810/280-10-50-30
Reference 28: http://www.xbrl.org/2003/role/disclosureRef
-Topic 280
-SubTopic 10
-Name Accounting Standards Codification
-Section 50
-Paragraph 32
-Subparagraph (f)
-Publisher FASB
-URI https://asc.fasb.org//1943274/2147482810/280-10-50-32
Reference 29: http://www.xbrl.org/2003/role/exampleRef
-Topic 280
-SubTopic 10
-Name Accounting Standards Codification
-Section 50
-Paragraph 31
-Publisher FASB
-URI https://asc.fasb.org//1943274/2147482810/280-10-50-31
Reference 30: http://www.xbrl.org/2003/role/disclosureRef
-Topic 280
-SubTopic 10
-Name Accounting Standards Codification
-Section 50
-Paragraph 32
-Subparagraph (c)
-Publisher FASB
-URI https://asc.fasb.org//1943274/2147482810/280-10-50-32
Reference 31: http://www.xbrl.org/2003/role/disclosureRef
-Topic 942
-SubTopic 235
-Name Accounting Standards Codification
-Section S99
-Paragraph 1
-Subparagraph (SX 210.9-05(b)(2))
-Publisher FASB
-URI https://asc.fasb.org//1943274/2147479557/942-235-S99-1
Reference 32: http://www.xbrl.org/2003/role/disclosureRef
-Topic 205
-SubTopic 20
-Name Accounting Standards Codification
-Section 50
-Paragraph 7
-Publisher FASB
-URI https://asc.fasb.org//1943274/2147483499/205-20-50-7
Reference 33: http://www.xbrl.org/2003/role/exampleRef
-Topic 810
-SubTopic 10
-Name Accounting Standards Codification
-Section 55
-Paragraph 4J
-Publisher FASB
-URI https://asc.fasb.org//1943274/2147481175/810-10-55-4J
Reference 34: http://www.xbrl.org/2003/role/exampleRef
-Topic 810
-SubTopic 10
-Name Accounting Standards Codification
-Section 55
-Paragraph 4K
-Publisher FASB
-URI https://asc.fasb.org//1943274/2147481175/810-10-55-4K
Reference 35: http://www.xbrl.org/2003/role/disclosureRef
-Topic 220
-SubTopic 10
-Name Accounting Standards Codification
-Section 45
-Paragraph 1A
-Subparagraph (a)
-Publisher FASB
-URI https://asc.fasb.org//1943274/2147482790/220-10-45-1A
Reference 36: http://www.xbrl.org/2003/role/disclosureRef
-Topic 220
-SubTopic 10
-Name Accounting Standards Codification
-Section 45
-Paragraph 1B
-Subparagraph (a)
-Publisher FASB
-URI https://asc.fasb.org//1943274/2147482790/220-10-45-1B
Reference 37: http://www.xbrl.org/2003/role/disclosureRef
-Topic 230
-SubTopic 10
-Name Accounting Standards Codification
-Section 45
-Paragraph 2
-Publisher FASB
-URI https://asc.fasb.org//1943274/2147482740/230-10-45-2
Reference 38: http://www.xbrl.org/2003/role/disclosureRef
-Topic 810
-SubTopic 10
-Name Accounting Standards Codification
-Section 50
-Paragraph 1A
-Subparagraph (a)(1)
-Publisher FASB
-URI https://asc.fasb.org//1943274/2147481203/810-10-50-1A
Reference 39: http://www.xbrl.org/2003/role/disclosureRef
-Topic 810
-SubTopic 10
-Name Accounting Standards Codification
-Section 50
-Paragraph 1A
-Subparagraph (c)(1)
-Publisher FASB
-URI https://asc.fasb.org//1943274/2147481203/810-10-50-1A
| Name: |
us-gaap_ProfitLoss |
| Namespace Prefix: |
us-gaap_ |
| Data Type: |
xbrli:monetaryItemType |
| Balance Type: |
credit |
| Period Type: |
duration |
|
| X |
- DefinitionAmount of noncash expense for share-based payment arrangement. Reference 1: http://fasb.org/us-gaap/role/ref/legacyRef
-Name Accounting Standards Codification
-Section 45
-Paragraph 28
-Subparagraph (a)
-SubTopic 10
-Topic 230
-Publisher FASB
-URI https://asc.fasb.org//1943274/2147482740/230-10-45-28
| Name: |
us-gaap_ShareBasedCompensation |
| Namespace Prefix: |
us-gaap_ |
| Data Type: |
xbrli:monetaryItemType |
| Balance Type: |
debit |
| Period Type: |
duration |
|
v3.23.2
Condensed Consolidated Statements of Cash Flows - Supplemental Information - USD ($)
$ in Thousands |
6 Months Ended |
Jun. 30, 2023 |
Jun. 30, 2022 |
| Statement of Cash Flows [Abstract] |
|
|
|
| Cash and cash equivalents |
|
$ 178,471
|
$ 126,569
|
| Investments and Cash |
[1] |
2,680
|
0
|
| Total cash and cash equivalents within condensed consolidated statements of cash flows |
|
181,151
|
126,569
|
| Cash Flow, Noncash Investing and Financing Activities Disclosure [Abstract] |
|
|
|
| Income taxes paid |
|
30,600
|
34,300
|
| Restricted stock unit dividend equivalents, net of forfeitures |
|
1,700
|
$ 1,500
|
| Non-cash investing activities, purchases of property and equipment |
|
$ 9,300
|
|
|
|
| X |
- DefinitionNon-Cash Investing Activities, Purchases of Property and Equipment
| Name: |
cns_NonCashInvestingActivitiesPurchasesOfPropertyAndEquipment |
| Namespace Prefix: |
cns_ |
| Data Type: |
xbrli:monetaryItemType |
| Balance Type: |
credit |
| Period Type: |
instant |
|
| X |
- DefinitionAmount of currency on hand as well as demand deposits with banks or financial institutions. Includes other kinds of accounts that have the general characteristics of demand deposits. Also includes short-term, highly liquid investments that are both readily convertible to known amounts of cash and so near their maturity that they present insignificant risk of changes in value because of changes in interest rates. Excludes cash and cash equivalents within disposal group and discontinued operation. Reference 1: http://www.xbrl.org/2003/role/disclosureRef
-Topic 210
-SubTopic 10
-Name Accounting Standards Codification
-Section S99
-Paragraph 1
-Subparagraph (SX 210.5-02(1))
-Publisher FASB
-URI https://asc.fasb.org//1943274/2147480566/210-10-S99-1
Reference 2: http://www.xbrl.org/2003/role/exampleRef
-Topic 210
-SubTopic 10
-Name Accounting Standards Codification
-Section 45
-Paragraph 1
-Subparagraph (a)
-Publisher FASB
-URI https://asc.fasb.org//1943274/2147483467/210-10-45-1
Reference 3: http://fasb.org/us-gaap/role/ref/legacyRef
-Name Accounting Standards Codification
-Topic 230
-SubTopic 10
-Section 45
-Paragraph 4
-Publisher FASB
-URI https://asc.fasb.org//1943274/2147482740/230-10-45-4
| Name: |
us-gaap_CashAndCashEquivalentsAtCarryingValue |
| Namespace Prefix: |
us-gaap_ |
| Data Type: |
xbrli:monetaryItemType |
| Balance Type: |
debit |
| Period Type: |
instant |
|
| X |
- DefinitionAmount of cash and cash equivalents, and cash and cash equivalents restricted to withdrawal or usage. Excludes amount for disposal group and discontinued operations. Cash includes, but is not limited to, currency on hand, demand deposits with banks or financial institutions, and other accounts with general characteristics of demand deposits. Cash equivalents include, but are not limited to, short-term, highly liquid investments that are both readily convertible to known amounts of cash and so near their maturity that they present insignificant risk of changes in value because of changes in interest rates. Reference 1: http://www.xbrl.org/2003/role/disclosureRef
-Topic 230
-SubTopic 10
-Name Accounting Standards Codification
-Section 50
-Paragraph 8
-Publisher FASB
-URI https://asc.fasb.org//1943274/2147482913/230-10-50-8
Reference 2: http://fasb.org/us-gaap/role/ref/legacyRef
-Topic 230
-SubTopic 10
-Name Accounting Standards Codification
-Section 45
-Paragraph 24
-Publisher FASB
-URI https://asc.fasb.org//1943274/2147482740/230-10-45-24
Reference 3: http://fasb.org/us-gaap/role/ref/legacyRef
-Name Accounting Standards Codification
-Topic 230
-SubTopic 10
-Section 45
-Paragraph 4
-Publisher FASB
-URI https://asc.fasb.org//1943274/2147482740/230-10-45-4
| Name: |
us-gaap_CashCashEquivalentsRestrictedCashAndRestrictedCashEquivalents |
| Namespace Prefix: |
us-gaap_ |
| Data Type: |
xbrli:monetaryItemType |
| Balance Type: |
debit |
| Period Type: |
instant |
|
| X |
- References
+ Details
| Name: |
us-gaap_CashFlowNoncashInvestingAndFinancingActivitiesDisclosureAbstract |
| Namespace Prefix: |
us-gaap_ |
| Data Type: |
xbrli:stringItemType |
| Balance Type: |
na |
| Period Type: |
duration |
|
| X |
- DefinitionAmount of paid and unpaid cash, stock, and paid-in-kind dividends declared for award under share-based payment arrangement.
| Name: |
us-gaap_DividendsShareBasedCompensation |
| Namespace Prefix: |
us-gaap_ |
| Data Type: |
xbrli:monetaryItemType |
| Balance Type: |
debit |
| Period Type: |
duration |
|
| X |
- DefinitionSum of investments and unrestricted cash as of the balance sheet date. Reference 1: http://www.xbrl.org/2009/role/commonPracticeRef
-Topic 944
-SubTopic 210
-Name Accounting Standards Codification
-Section S99
-Paragraph 1
-Subparagraph (SX 210.7-03(a)(2))
-Publisher FASB
-URI https://asc.fasb.org//1943274/2147479440/944-210-S99-1
Reference 2: http://www.xbrl.org/2009/role/commonPracticeRef
-Topic 944
-SubTopic 210
-Name Accounting Standards Codification
-Section S99
-Paragraph 1
-Subparagraph (SX 210.7-03(a)(1))
-Publisher FASB
-URI https://asc.fasb.org//1943274/2147479440/944-210-S99-1
| Name: |
us-gaap_InvestmentsAndCash |
| Namespace Prefix: |
us-gaap_ |
| Data Type: |
xbrli:monetaryItemType |
| Balance Type: |
debit |
| Period Type: |
instant |
|
| X |
- References
+ Details
| Name: |
us-gaap_StatementOfCashFlowsAbstract |
| Namespace Prefix: |
us-gaap_ |
| Data Type: |
xbrli:stringItemType |
| Balance Type: |
na |
| Period Type: |
duration |
|
v3.23.2
Organization and Description of Business
|
6 Months Ended |
Jun. 30, 2023 |
|---|
| Organization, Consolidation and Presentation of Financial Statements [Abstract] |
|
| Organization and Description of Business |
Organization and Description of Business Cohen & Steers, Inc. (CNS) was organized as a Delaware corporation on March 17, 2004. CNS is the holding company for its direct and indirect subsidiaries, including Cohen & Steers Capital Management, Inc. (CSCM), Cohen & Steers Securities, LLC (CSS), Cohen & Steers UK Limited (CSUK), Cohen & Steers Ireland Limited (CSIL), Cohen & Steers Asia Limited (CSAL), Cohen & Steers Japan Limited (CSJL) and Cohen & Steers Singapore Private Limited (CSSG) (collectively, the Company). The Company is a global investment manager specializing in real assets and alternative income, including real estate, preferred securities, infrastructure, resource equities, commodities, as well as multi-strategy solutions. Founded in 1986, the Company is headquartered in New York City, with offices in London, Dublin, Hong Kong, Tokyo and Singapore.
|
| X |
- References
+ Details
| Name: |
us-gaap_OrganizationConsolidationAndPresentationOfFinancialStatementsAbstract |
| Namespace Prefix: |
us-gaap_ |
| Data Type: |
xbrli:stringItemType |
| Balance Type: |
na |
| Period Type: |
duration |
|
| X |
- DefinitionThe entire disclosure for organization, consolidation and basis of presentation of financial statements disclosure. Reference 1: http://www.xbrl.org/2003/role/disclosureRef
-Topic 946
-SubTopic 10
-Name Accounting Standards Codification
-Section 50
-Paragraph 1
-Publisher FASB
-URI https://asc.fasb.org//1943274/2147480424/946-10-50-1
Reference 2: http://www.xbrl.org/2003/role/disclosureRef
-Topic 946
-SubTopic 10
-Name Accounting Standards Codification
-Section 50
-Paragraph 2
-Publisher FASB
-URI https://asc.fasb.org//1943274/2147480424/946-10-50-2
Reference 3: http://fasb.org/us-gaap/role/ref/legacyRef
-Topic 810
-Name Accounting Standards Codification
-Publisher FASB
-URI https://asc.fasb.org//810/tableOfContent
Reference 4: http://fasb.org/us-gaap/role/ref/legacyRef
-Topic 205
-Name Accounting Standards Codification
-Publisher FASB
-URI https://asc.fasb.org//205/tableOfContent
| Name: |
us-gaap_OrganizationConsolidationAndPresentationOfFinancialStatementsDisclosureTextBlock |
| Namespace Prefix: |
us-gaap_ |
| Data Type: |
dtr-types:textBlockItemType |
| Balance Type: |
na |
| Period Type: |
duration |
|
v3.23.2
Basis of Presentation and Significant Accounting Policies
|
6 Months Ended |
Jun. 30, 2023 |
|---|
| Accounting Policies [Abstract] |
|
| Basis of Presentation and Significant Accounting Policies |
Basis of Presentation and Significant Accounting Policies The condensed consolidated financial statements have been prepared in accordance with accounting principles generally accepted in the United States of America (GAAP). The condensed consolidated financial statements set forth herein include the accounts of CNS and its direct and indirect subsidiaries. Intercompany balances and transactions have been eliminated in consolidation. The condensed consolidated financial statements of the Company included herein are unaudited and have been prepared in accordance with the instructions to Form 10-Q pursuant to the rules and regulations of the Securities and Exchange Commission (SEC). In the opinion of management, all adjustments, consisting of normal recurring adjustments, necessary for a fair presentation of the interim results have been made. The Company's condensed consolidated financial statements and the related notes should be read together with the consolidated financial statements and the related notes included in the Company's Annual Report on Form 10-K for the year ended December 31, 2022. Accounting Estimates—The preparation of the condensed consolidated financial statements in conformity with GAAP requires management to make certain estimates and assumptions that affect the reported amounts of assets and liabilities and the disclosures of contingent assets and liabilities at the dates of the condensed consolidated financial statements and the reported amounts of revenue and expenses during the reporting periods. Management believes the estimates used in preparing the condensed consolidated financial statements are reasonable and prudent. Actual results could differ from those estimates. Consolidation of Investment Vehicles—The Company's financial interests in investment vehicles, including the management fees that are received, are evaluated at inception and thereafter, if there is a reconsideration event, in order to determine whether to apply the Variable Interest Entity (VIE) model or the Voting Interest Entity (VOE) model. A VIE is an entity in which either the equity investment at risk is not sufficient to permit the entity to finance its own activities without additional financial support or the group of holders of the equity investment at risk lack certain characteristics of a controlling financial interest. The primary beneficiary is the entity that has the power to direct the activities of the VIE that most significantly affect its performance, and the obligation to absorb losses of the entity or the right to receive benefits from the entity that could potentially be significant to the VIE. Subscriptions and redemptions or amendments to the governing documents of the respective entities could affect an entity's status as a VIE or the determination of the primary beneficiary. Limited partnerships and similar entities are determined to be a VIE when the Company is the general partner and the limited partners do not hold substantive kick-out or participation rights. The Company assesses whether it is the primary beneficiary of any VIEs identified by evaluating its economic interests in the entity held either directly by the Company and its affiliates or indirectly through employees. VIEs for which the Company is deemed to be the primary beneficiary are consolidated. Investments that are determined to be VOEs are consolidated when the Company’s ownership interest is greater than 50% of the outstanding voting interests of the vehicle. The Company records noncontrolling interests in consolidated investment vehicles for which the Company’s ownership is less than 100%. Cash and Cash Equivalents—Cash and cash equivalents include short-term, highly liquid investments, which are readily convertible into cash and have original maturities of three months or less. Due from/to Brokers—The Company, including the consolidated investment vehicles, may transact with brokers for certain investment activities. The clearing and custody operations for these investment activities are performed pursuant to contractual agreements. The due from/to brokers balances represent cash and/or cash collateral balances at brokers/custodians and/or receivables and payables for unsettled securities transactions with brokers/custodians. Investments—Management of the Company determines the appropriate classification of its investments at the time of purchase and re-evaluates such determination no less than on a quarterly basis. The Company's investments are categorized as follows: •Equity investments at fair value generally represent common stocks, limited partnership interests, master limited partnership interests, preferred securities and other seed investments in Company-sponsored vehicles. •Trading investments generally represent U.S. Treasury securities and investment-grade corporate debt securities. Realized and unrealized gains and losses on our investments are recorded in gain (loss) from investments—net in the Company's condensed consolidated statements of operations. From time to time, the Company, including the consolidated investment vehicles, may enter into derivative contracts, including options, futures and swaps contracts, to gain exposure to the underlying commodities markets or to economically hedge market risk of the underlying portfolios. Gains and losses on derivative contracts are recorded in gain (loss) from investments—net in the Company's condensed consolidated statements of operations. The fair values of these instruments are recorded in other assets or other liabilities and accrued expenses on the Company's condensed consolidated statements of financial condition. Additionally, from time to time, the Company, including the consolidated investment vehicles, may enter into forward foreign exchange contracts to economically hedge currency exposure. These instruments are measured at fair value based on the prevailing forward exchange rate with gains and losses recorded in foreign currency gain (loss)—net in the Company’s condensed consolidated statements of operations. The fair values of these contracts are recorded in other assets or other liabilities and accrued expenses on the Company’s condensed consolidated statements of financial condition. Leases—The Company determines if an arrangement is a lease at inception. The Company has operating leases for corporate offices and certain information technology equipment which are included in operating lease right-of-use (ROU) assets and operating lease liabilities on the Company’s condensed consolidated statements of financial condition. ROU assets represent the right to use an underlying asset for the lease term and lease liabilities represent obligations to make lease payments arising from the lease. Operating lease ROU assets and lease liabilities are recognized at commencement date based on the net present value of lease payments over the life of the lease and thereafter, are remeasured if there is a change in lease terms. The majority of the Company’s lease agreements do not provide an implicit rate. As a result, the Company used its estimated incremental borrowing rate based on the information available as of lease commencement dates in determining the present value of lease payments. The operating lease ROU assets reflect any upfront lease payments made as well as lease incentives received. During the second quarter of 2023, the Company incurred costs related to the build-out of its future headquarters which qualified for reimbursement from the landlord. As a result, the Company remeasured its ROU asset and lease liability resulting in a $22.2 million reduction. The lease terms may include options to extend or terminate the lease and these are factored into the determination of the ROU asset and lease liability at lease inception when and if it is reasonably certain that the Company will exercise that option. Lease expense for fixed lease payments is recognized on a straight-line basis over the lease term. The Company has certain lease agreements with non-lease components such as maintenance and executory costs, which are accounted for separately and not included in ROU assets. ROU assets are tested for impairment whenever changes in facts or circumstances indicate that the carrying amount of an asset may not be recoverable. Modification of a lease term would result in remeasurement of the lease liability and a corresponding adjustment to the ROU asset. Noncontrolling Interests—Noncontrolling interests consist of nonredeemable and redeemable third-party interests in the Company's consolidated investment vehicles. Noncontrolling interests that are not redeemable at the option of the investors are classified as nonredeemable noncontrolling interests and are included in stockholders’ equity. Noncontrolling interests that are redeemable at the option of the investors are classified as redeemable noncontrolling interests and are not treated as permanent equity. Noncontrolling interests are recorded at fair value which approximates the net asset value at each reporting period. Investment Advisory and Administration Fees—The Company earns revenue by providing asset management services to institutional accounts, open-end and closed-end funds as well as model-based portfolios. Investment advisory fees are earned pursuant to the terms of investment management agreements and are generally based on a contractual fee rate applied to the average assets under management. The Company also earns administration fees from certain open-end and closed-end funds pursuant to the terms of underlying administration contracts. Administration fees are based on the average daily assets under management of such funds. Investment advisory and administration fee revenue is recognized when earned and is recorded net of any fund reimbursements. The investment advisory and administration contracts each include a single performance obligation as the services provided are not separately identifiable and are accounted for as a series satisfied over time using a time-based method (days elapsed). Additionally, investment advisory and administration fees represent variable consideration, as fees are based on average assets under management which fluctuate daily. In certain instances, the Company may earn performance fees when specified performance hurdles are met during the performance period. Performance fees are forms of variable consideration and are not recognized until it becomes probable that there will not be a significant reversal of the cumulative revenue recognized. Distribution and Service Fee Revenue—Distribution and service fee revenue is based on the average daily net assets of certain share classes of open-end funds distributed by CSS. Distribution and service fee revenue is earned daily and is recorded gross of any third-party distribution and service fee expense for applicable share classes. Distribution fee agreements include a single performance obligation that is satisfied at a point in time when an investor purchases shares in an open-end fund. For all periods presented, a portion of the distribution fee revenue recognized in the period may relate to performance obligations satisfied (or partially satisfied) in prior periods. Service fee agreements include a single performance obligation as the services provided are not separately identifiable and are accounted for as a series satisfied over time using a time-based method (days elapsed). Additionally, distribution and service fees represent variable consideration, as fees are based on average assets under management which fluctuate daily. Distribution and Service Fee Expense—Distribution and service fee expense includes distribution fees, shareholder servicing fees and intermediary assistance payments. Distribution fees represent payments made to qualified intermediaries for assistance in connection with the distribution of certain open-end funds' shares and for other expenses such as advertising, printing and distribution of prospectuses to investors. Such amounts may also be used to pay financial intermediaries for services as specified in the terms of written agreements complying with Rule 12b-1 of the Investment Company Act of 1940. Distribution fees are based on average daily net assets under management of certain share classes of certain of the funds. Shareholder servicing fees represent payments made to qualified intermediaries for shareholder account service and maintenance. These services are provided pursuant to written agreements with such qualified institutions. Shareholder servicing fees are generally based on average daily net assets under management. Intermediary assistance payments represent payments to qualified intermediaries for activities related to distribution, shareholder servicing as well as marketing and support of certain open-end funds and are incremental to those described above. Intermediary assistance payments are generally based on average daily net assets under management. Stock-based Compensation—The Company recognizes compensation expense for the grant-date fair value of restricted stock unit awards to certain employees. This expense is recognized over the period during which employees are required to provide service. Forfeitures are recorded as incurred. Any change to the key terms of an employee’s award subsequent to the grant date is evaluated and, if necessary, accounted for as a modification. If the modification results in the remeasurement of the fair value of the award, the remeasured compensation cost is recognized over the remaining service period. Income Taxes—The Company records the current and deferred tax consequences of all transactions that have been recognized in the condensed consolidated financial statements in accordance with the provisions of the enacted tax laws. Deferred tax assets are recognized for temporary differences that will result in deductible amounts in future years at tax rates that are expected to apply in those years. Deferred tax liabilities are recognized for temporary differences that will result in taxable income in future years at tax rates that are expected to apply in those years. The Company records a valuation allowance, when necessary, to reduce deferred tax assets to an amount that more likely than not will be realized. The effective tax rate for interim periods is based on the Company's best estimate of the effective tax rate expected to be applied to the full fiscal year adjusted for discrete tax items during the period. The calculation of tax liabilities involves uncertainties in the application of complex tax laws and regulations across the Company's global operations. A tax benefit from an uncertain tax position is recognized when it is more likely than not that the position will be sustained upon examination, including resolution of any related appeals or litigation processes, on the basis of the technical merits. The Company records potential interest and penalties related to uncertain tax positions in the provision for income taxes in the condensed consolidated statements of operations. Comprehensive Income—The Company reports all changes in comprehensive income in the condensed consolidated statements of comprehensive income. Comprehensive income generally includes net income or loss attributable to common stockholders and amounts attributable to foreign currency translation gain (loss). Currency Translation and Transactions—Assets and liabilities of subsidiaries having non-U.S. dollar functional currencies are translated at exchange rates at the applicable condensed consolidated statement of financial condition date. Revenue and expenses of such subsidiaries are translated at average exchange rates during the period. The gains or losses resulting from translating non-U.S. dollar functional currency into U.S. dollars are included in the Company's condensed consolidated statements of comprehensive income. The cumulative translation adjustment was $(8.5) million and $(10.8) million at June 30, 2023 and December 31, 2022, respectively, and was reported within accumulated other comprehensive income (loss) on the condensed consolidated statements of financial condition. Gains or losses resulting from transactions denominated in currencies other than the U.S. dollar within certain foreign subsidiaries and gains and losses arising on revaluation of U.S. dollar-denominated assets and liabilities held by certain foreign subsidiaries are included in foreign currency gain (loss)—net in the Company’s condensed consolidated statements of operations. Recently Issued Accounting Pronouncements—In June 2022, the Financial Accounting Standards Board issued Accounting Standards Update 2022-03 (ASU), Fair Value Measurement (Topic 820): Fair Value Measurement of Equity Securities Subject to Contractual Sale Restrictions. The standard clarifies that contractual sale restrictions are not considered in measuring the fair value of equity securities, which would be a change in practice for certain entities. The ASU also indicates that a contractual sale restriction is not a separate unit of account, and requires new disclosures for all entities with equity securities subject to a contractual sale restriction. This new guidance will be effective on January 1, 2024. The Company does not expect that the adoption of this new standard will have a material effect on the Company's condensed consolidated financial statements and related disclosures.
|
| X |
- References
+ Details
| Name: |
us-gaap_AccountingPoliciesAbstract |
| Namespace Prefix: |
us-gaap_ |
| Data Type: |
xbrli:stringItemType |
| Balance Type: |
na |
| Period Type: |
duration |
|
| X |
- DefinitionThe entire disclosure for all significant accounting policies of the reporting entity. Reference 1: http://www.xbrl.org/2003/role/disclosureRef
-Topic 235
-SubTopic 10
-Name Accounting Standards Codification
-Section 50
-Paragraph 1
-Publisher FASB
-URI https://asc.fasb.org//1943274/2147483426/235-10-50-1
Reference 2: http://fasb.org/us-gaap/role/ref/legacyRef
-Topic 235
-Name Accounting Standards Codification
-Publisher FASB
-URI https://asc.fasb.org//235/tableOfContent
| Name: |
us-gaap_SignificantAccountingPoliciesTextBlock |
| Namespace Prefix: |
us-gaap_ |
| Data Type: |
dtr-types:textBlockItemType |
| Balance Type: |
na |
| Period Type: |
duration |
|
v3.23.2
Revenue
|
6 Months Ended |
Jun. 30, 2023 |
|---|
| Revenue from Contract with Customer [Abstract] |
|
| Revenue |
Revenue The following tables summarize revenue recognized from contracts with customers by client domicile and by investment vehicle: | | | | | | | | | | | | | | | | | | | | | | | | | Three Months Ended
June 30, | | Six Months Ended
June 30, | | (in thousands) | 2023 | | 2022 | | 2023 | | 2022 | | Client domicile: | | | | | | | | | North America | $ | 104,686 | | | $ | 129,428 | | | $ | 214,456 | | | $ | 264,628 | | | Japan | 8,014 | | | 9,263 | | | 16,133 | | | 18,786 | | | Europe, Middle East and Africa | 4,654 | | | 5,405 | | | 9,541 | | | 11,358 | | | Asia Pacific excluding Japan | 3,276 | | | 3,335 | | | 6,582 | | | 6,848 | | | Total | $ | 120,630 | | | $ | 147,431 | | | $ | 246,712 | | | $ | 301,620 | | | | | | | | | | | | | | | | | | | | | | | | | | | | | | | | | | | | | | | | | | | | | | | | | | | | | | | | | | | | | | | | | | | | | | | | | | | | | | | | | | | | | | | | | | | | | | | | | |
| | | | | | | | | | | | | | | | | | | | | | | | | Three Months Ended
June 30, | | Six Months Ended
June 30, | | (in thousands) | 2023 | | 2022 | | 2023 | | 2022 | | Investment vehicle: | | | | | | | | | Open-end funds | $ | 66,574 | | | $ | 85,561 | | | $ | 137,142 | | | $ | 175,746 | | | Institutional accounts | 30,166 | | | 34,429 | | | 60,795 | | | 71,112 | | | Closed-end funds | 23,890 | | | 27,441 | | | 48,775 | | | 54,762 | | | | | | | | | | | Total | $ | 120,630 | | | $ | 147,431 | | | $ | 246,712 | | | $ | 301,620 | |
|
| X |
- References
+ Details
| Name: |
us-gaap_RevenueFromContractWithCustomerAbstract |
| Namespace Prefix: |
us-gaap_ |
| Data Type: |
xbrli:stringItemType |
| Balance Type: |
na |
| Period Type: |
duration |
|
| X |
- DefinitionThe entire disclosure of revenue from contract with customer to transfer good or service and to transfer nonfinancial asset. Includes, but is not limited to, disaggregation of revenue, credit loss recognized from contract with customer, judgment and change in judgment related to contract with customer, and asset recognized from cost incurred to obtain or fulfill contract with customer. Excludes insurance and lease contracts. Reference 1: http://www.xbrl.org/2003/role/disclosureRef
-Topic 606
-SubTopic 10
-Name Accounting Standards Codification
-Section 50
-Paragraph 9
-Publisher FASB
-URI https://asc.fasb.org//1943274/2147479806/606-10-50-9
Reference 2: http://www.xbrl.org/2003/role/disclosureRef
-Topic 606
-SubTopic 10
-Name Accounting Standards Codification
-Section 50
-Paragraph 10
-Publisher FASB
-URI https://asc.fasb.org//1943274/2147479806/606-10-50-10
Reference 3: http://www.xbrl.org/2003/role/disclosureRef
-Topic 606
-SubTopic 10
-Name Accounting Standards Codification
-Section 50
-Paragraph 15
-Publisher FASB
-URI https://asc.fasb.org//1943274/2147479806/606-10-50-15
Reference 4: http://www.xbrl.org/2003/role/disclosureRef
-Topic 606
-SubTopic 10
-Name Accounting Standards Codification
-Section 50
-Paragraph 12
-Subparagraph (a)
-Publisher FASB
-URI https://asc.fasb.org//1943274/2147479806/606-10-50-12
Reference 5: http://www.xbrl.org/2003/role/disclosureRef
-Topic 606
-SubTopic 10
-Name Accounting Standards Codification
-Section 50
-Paragraph 12
-Subparagraph (b)
-Publisher FASB
-URI https://asc.fasb.org//1943274/2147479806/606-10-50-12
Reference 6: http://www.xbrl.org/2003/role/disclosureRef
-Topic 606
-SubTopic 10
-Name Accounting Standards Codification
-Section 50
-Paragraph 12
-Subparagraph (c)
-Publisher FASB
-URI https://asc.fasb.org//1943274/2147479806/606-10-50-12
Reference 7: http://www.xbrl.org/2003/role/disclosureRef
-Topic 606
-SubTopic 10
-Name Accounting Standards Codification
-Section 50
-Paragraph 12
-Subparagraph (d)
-Publisher FASB
-URI https://asc.fasb.org//1943274/2147479806/606-10-50-12
Reference 8: http://www.xbrl.org/2003/role/disclosureRef
-Topic 606
-SubTopic 10
-Name Accounting Standards Codification
-Section 50
-Paragraph 12
-Subparagraph (e)
-Publisher FASB
-URI https://asc.fasb.org//1943274/2147479806/606-10-50-12
Reference 9: http://www.xbrl.org/2003/role/disclosureRef
-Topic 606
-SubTopic 10
-Name Accounting Standards Codification
-Section 50
-Paragraph 13
-Subparagraph (b)(2)
-Publisher FASB
-URI https://asc.fasb.org//1943274/2147479806/606-10-50-13
Reference 10: http://www.xbrl.org/2003/role/disclosureRef
-Name Accounting Standards Codification
-Topic 606
-Publisher FASB
-URI https://asc.fasb.org//606/tableOfContent
| Name: |
us-gaap_RevenueFromContractWithCustomerTextBlock |
| Namespace Prefix: |
us-gaap_ |
| Data Type: |
dtr-types:textBlockItemType |
| Balance Type: |
na |
| Period Type: |
duration |
|
v3.23.2
Investments
|
6 Months Ended |
Jun. 30, 2023 |
|---|
| Investments [Abstract] |
|
| Investments |
Investments The following table summarizes the Company's investments:
| | | | | | | | | | | | | (in thousands) | June 30,
2023 | | December 31, 2022 | | Equity investments at fair value | $ | 161,051 | | | $ | 157,646 | | | Trading | 27,155 | | | 15,289 | | | Equity method | 21 | | | 20 | | | Total investments | $ | 188,227 | | | $ | 172,955 | |
The following table summarizes gain (loss) from investments—net, including derivative financial instruments, the majority of which are used to economically hedge certain exposures (see Note 6, Derivatives):
| | | | | | | | | | | | | | | | | | | | | | | | | | Three Months Ended
June 30, | | Six Months Ended
June 30, | | (in thousands) | 2023 | | 2022 | | 2023 | | 2022 | Net realized gains (losses) during the period | $ | (761) | | | $ | 2,664 | | | $ | (3,091) | | | $ | 10,845 | | Net unrealized gains (losses) during the period on investments still held at the end of the period | 1,117 | | | (31,237) | | | 3,139 | | | (35,851) | | Gain (loss) from investments—net (1) | $ | 356 | | | $ | (28,573) | | | $ | 48 | | | $ | (25,006) | |
________________________(1)Included gain (loss) attributable to noncontrolling interests. At June 30, 2023 and December 31, 2022, the Company's consolidated VIEs included the Cohen & Steers SICAV Global Listed Infrastructure Fund (SICAV GLI), the Cohen & Steers SICAV Global Real Estate Fund (SICAV GRE), the Cohen & Steers Co-Investment Partnership, L.P. (GRP-CIP) and the Cohen & Steers Real Estate Opportunities Fund, L.P. (REOF). The following tables summarize the statements of financial condition attributable to the Company's consolidated VIEs:
| | | | | | | | | | | | | | | | | | | | | | | | | | | | | | | | | June 30, 2023 | | (in thousands) | SICAV GLI | | SICAV GRE | | | | GRP-CIP | | REOF | | Total | Assets (1) | | | | | | | | | | | | Investments | $ | 37,011 | | | $ | 79,033 | | | | | $ | 151 | | | $ | 23,002 | | | $ | 139,197 | | Due from brokers | 233 | | | 609 | | | | | 25 | | | — | | | 867 | | Other assets | 190 | | | 357 | | | | | — | | | 1 | | | 548 | | | Total assets | 37,434 | | | 79,999 | | | | | 176 | | | 23,003 | | | 140,612 | | | | | | | | | | | | | | Liabilities (1) | | | | | | | | | | | | Due to brokers | $ | 272 | | | $ | 358 | | | | | $ | — | | | $ | — | | | $ | 630 | | | Other liabilities and accrued expenses | 70 | | | 140 | | | | | 5 | | | 411 | | | 626 | | | Total liabilities | 342 | | | 498 | | | | | 5 | | | 411 | | | 1,256 | | | | | | | | | | | | | | | Net assets | $ | 37,092 | | | $ | 79,501 | | | | | $ | 171 | | | $ | 22,592 | | | $ | 139,356 | | | | | | | | | | | | | | | Attributable to the Company | $ | 19,232 | | | $ | 11,843 | | | | | $ | 171 | | | $ | 17,355 | | | $ | 48,601 | | | Attributable to noncontrolling interests | 17,860 | | | 67,658 | | | | | — | | | 5,237 | | | 90,755 | | | Net assets | $ | 37,092 | | | $ | 79,501 | | | | | $ | 171 | | | $ | 22,592 | | | $ | 139,356 | |
_________________________ (1) The assets may only be used to settle obligations of each VIE and the liabilities are the sole obligation of each VIE, for which creditors do not have recourse to the general credit of the Company. | | | | | | | | | | | | | | | | | | | | | | | | | | | | | | | | | December 31, 2022 | | (in thousands) | SICAV GLI | | SICAV GRE | | | | GRP-CIP | | REOF | | Total | Assets (1) | | | | | | | | | | | | Investments | $ | 36,296 | | | $ | 79,434 | | | | | $ | 147 | | | $ | 19,052 | | | $ | 134,929 | | Due from brokers | 11 | | | — | | | | | 27 | | | — | | | 38 | | Other assets | 151 | | | 370 | | | | | — | | | 55 | | | 576 | | | Total assets | 36,458 | | | 79,804 | | | | | 174 | | | 19,107 | | | 135,543 | | | | | | | | | | | | | | Liabilities (1) | | | | | | | | | | | | Due to brokers | $ | 11 | | | $ | — | | | | | $ | — | | | $ | — | | | $ | 11 | | | Other liabilities and accrued expenses | 91 | | | 214 | | | | | 5 | | | 354 | | | 664 | | | Total liabilities | 102 | | | 214 | | | | | 5 | | | 354 | | | 675 | | | | | | | | | | | | | | | Net assets | $ | 36,356 | | | $ | 79,590 | | | | | $ | 169 | | | $ | 18,753 | | | $ | 134,868 | | | | | | | | | | | | | | | Attributable to the Company | $ | 19,116 | | | $ | 11,495 | | | | | $ | 169 | | | $ | 14,699 | | | $ | 45,479 | | | Attributable to noncontrolling interests | 17,240 | | | 68,095 | | | | | — | | | 4,054 | | | 89,389 | | | Net assets | $ | 36,356 | | | $ | 79,590 | | | | | $ | 169 | | | $ | 18,753 | | | $ | 134,868 | |
_________________________ (1) The assets may only be used to settle obligations of each VIE and the liabilities are the sole obligation of each VIE, for which creditors do not have recourse to the general credit of the Company.
|
| X |
- DefinitionThe entire disclosure for investment holdings. This includes the long positions of investments for the entity. It contains investments in affiliated and unaffiliated issuers. The investments include securities and non securities (i.e. commodities and futures contracts). Reference 1: http://www.xbrl.org/2003/role/disclosureRef
-Topic 946
-SubTopic 210
-Name Accounting Standards Codification
-Section 50
-Paragraph 12
-Publisher FASB
-URI https://asc.fasb.org//1943274/2147480524/946-210-50-12
| Name: |
us-gaap_InvestmentHoldingsTextBlock |
| Namespace Prefix: |
us-gaap_ |
| Data Type: |
dtr-types:textBlockItemType |
| Balance Type: |
na |
| Period Type: |
duration |
|
| X |
- References
+ Details
| Name: |
us-gaap_InvestmentsAbstract |
| Namespace Prefix: |
us-gaap_ |
| Data Type: |
xbrli:stringItemType |
| Balance Type: |
na |
| Period Type: |
duration |
|
v3.23.2
Fair Value
|
6 Months Ended |
Jun. 30, 2023 |
|---|
| Fair Value Disclosures [Abstract] |
|
| Fair Value |
Fair Value Accounting Standards Codification Topic 820, Fair Value Measurement (ASC 820) specifies a hierarchy of valuation classifications based on whether the inputs to the valuation techniques used in each valuation classification are observable or unobservable. These classifications are summarized in the three broad levels listed below: •Level 1—Unadjusted quoted prices for identical instruments in active markets. •Level 2—Quoted prices for similar instruments in active markets; quoted prices for identical or similar instruments in markets that are not active; and model-derived valuations in which all significant inputs and significant value drivers are observable. •Level 3—Valuations derived from valuation techniques in which significant inputs or significant value drivers are unobservable. Inputs used to measure fair value might fall in different levels of the fair value hierarchy, in which case the Company defaults to the lowest level input that is significant to the fair value measurement in its entirety. These levels are not necessarily an indication of the risk or liquidity associated with the investments. The following tables present fair value measurements: | | | | | | | | | | | | | | | | | | | | | | | | | | | | | | | | | June 30, 2023 | | (in thousands) | Level 1 | | Level 2 | | Level 3 | | Investments Measured at NAV (1) | | | | Total | | Cash equivalents | $ | 133,860 | | | $ | — | | | $ | — | | | $ | — | | | | | $ | 133,860 | | | Equity investments at fair value: | | | | | | | | | | | | | Common stocks | $ | 143,489 | | | $ | — | | | $ | — | | | $ | — | | | | | $ | 143,489 | | | Limited partnership interests | — | | | — | | | 13,986 | | | 1,397 | | | | | 15,383 | | | Master limited partnership interests | 321 | | | — | | | — | | | — | | | | | 321 | | | Preferred securities | 1,415 | | | 108 | | | — | | | — | | | | | 1,523 | | | Other | 215 | | | — | | | — | | | 120 | | | | | 335 | | | Total | $ | 145,440 | | | $ | 108 | | | $ | 13,986 | | | $ | 1,517 | | | | | $ | 161,051 | | | Trading investments: | | | | | | | | | | | | | Fixed income | $ | — | | | $ | 27,155 | | | $ | — | | | $ | — | | | | | $ | 27,155 | | | | | | | | | | | | | | | Equity method investments | $ | — | | | $ | — | | | $ | — | | | $ | 21 | | | | | $ | 21 | | | | | | | | | | | | | | | Total investments | $ | 145,440 | | | $ | 27,263 | | | $ | 13,986 | | | $ | 1,538 | | | | | $ | 188,227 | | | | | | | | | | | | | | | Derivatives - assets: | | | | | | | | | | | | | Total return swaps | $ | — | | | $ | 374 | | | $ | — | | | $ | — | | | | | $ | 374 | | | Forward contracts - foreign exchange | — | | | 476 | | | — | | | — | | | | | 476 | | | Total | $ | — | | | $ | 850 | | | $ | — | | | $ | — | | | | | $ | 850 | | | Derivatives - liabilities: | | | | | | | | | | | | | Total return swaps | $ | — | | | $ | 249 | | | $ | — | | | $ | — | | | | | $ | 249 | | | | | | | | | | | | | | | Forward contracts - foreign exchange | — | | | 18 | | | — | | | — | | | | | 18 | | | Total | $ | — | | | $ | 267 | | | $ | — | | | $ | — | | | | | $ | 267 | |
________________________ (1) Comprised of certain investments measured at fair value using net asset value (NAV) as a practical expedient. | | | | | | | | | | | | | | | | | | | | | | | | | | | | | | | December 31, 2022 | | (in thousands) | Level 1 | | Level 2 | | Level 3 | | Investments Measured at NAV (1) | | Total | | Cash equivalents | $ | 208,557 | | | $ | — | | | $ | — | | | $ | — | | | $ | 208,557 | | | Equity investments at fair value: | | | | | | | | | | | Common stocks | $ | 142,268 | | | $ | 987 | | | $ | — | | | $ | — | | | $ | 143,255 | | | Limited partnership interests | — | | | — | | | 10,759 | | | 1,544 | | | 12,303 | | | Master limited partnership interests | 316 | | | — | | | — | | | — | | | 316 | | | Preferred securities | 1,391 | | | 49 | | | — | | | — | | | 1,440 | | | Other | 200 | | | — | | | — | | | 132 | | | 332 | | | Total | $ | 144,175 | | | $ | 1,036 | | | $ | 10,759 | | | $ | 1,676 | | | $ | 157,646 | | | Trading investments: | | | | | | | | | | | Fixed income | $ | — | | | $ | 15,289 | | | $ | — | | | $ | — | | | $ | 15,289 | | | Equity method investments | $ | — | | | $ | — | | | $ | — | | | $ | 20 | | | $ | 20 | | | | | | | | | | | | | Total investments | $ | 144,175 | | | $ | 16,325 | | | $ | 10,759 | | | $ | 1,696 | | | $ | 172,955 | | | | | | | | | | | | | Derivatives - assets: | | | | | | | | | | | Total return swaps | $ | — | | | $ | 276 | | | $ | — | | | $ | — | | | $ | 276 | | | | | | | | | | | | | Total | $ | — | | | $ | 276 | | | $ | — | | | $ | — | | | $ | 276 | | | Derivatives - liabilities: | | | | | | | | | | | Total return swaps | $ | — | | | $ | 717 | | | $ | — | | | $ | — | | | $ | 717 | | | | | | | | | | | | | Forward contracts - foreign exchange | — | | | 742 | | | — | | | — | | | 742 | | | Total | $ | — | | | $ | 1,459 | | | $ | — | | | $ | — | | | $ | 1,459 | |
________________________ (1) Comprised of certain investments measured at fair value using NAV as a practical expedient. Equity investments at fair value classified as Level 2 were comprised of common stocks for which quoted prices in active markets are not available. Fair values for the common stocks classified as Level 2 were generally based on quoted prices for similar instruments in active markets. Equity investments at fair value classified as Level 3 were comprised of limited partnership interests in joint ventures that hold investments in private real estate. Trading investments classified as Level 2 were comprised of U.S. Treasury securities and corporate debt securities. Fair values were generally determined using third-party pricing services. The pricing services may utilize evaluated pricing models that vary by asset class and incorporate available trade, bid and other market information. Investments measured at NAV were comprised of certain investments measured at fair value using NAV (or its equivalent) as a practical expedient as follows: •Equity investments at fair value included: ◦limited partnership interests in private real estate funds; and ◦the Company's co-investment in a Cayman trust invested in global listed infrastructure securities (which is included in "Other" in the leveling table). •Equity method investments included the Company's partnership interests in Cohen & Steers Global Realty Partners III-TE, L.P. (GRP-TE) and Cohen & Steers Global Listed Infrastructure Fund L.P. (LPGI). GRP-TE invests in non-registered real estate funds and LPGI invests in global infrastructure securities. The Company's ownership interest in GRP-TE was approximately 0.2% at June 30, 2023 and December 31, 2022. The Company's ownership interest in LPGI was approximately 0.01% at June 30, 2023 and December 31, 2022. At June 30, 2023 and December 31, 2022, the Company did not have the ability to redeem its limited partnership interests in private real estate funds or its interest in GRP-TE. There were no contractual restrictions on the Company's ability to redeem its interest in the Cayman trust or LPGI. Investments measured at NAV as a practical expedient have not been classified in the fair value hierarchy. The amounts presented in the above tables are intended to permit reconciliation of the fair value hierarchy to the amounts presented on the condensed consolidated statements of financial condition. Total return swap contracts classified as Level 2 were valued based on the underlying futures contracts or equity indices. Foreign currency exchange contracts classified as Level 2 were valued based on the prevailing forward exchange rate, which is an input that is observable in active markets. The following table summarizes the changes in Level 3 investments measured at fair value on a recurring basis:
| | | | | | | | | | | | | | | | | | | | | | | | | Three Months Ended
June 30, | | Six Months Ended
June 30, | | (in thousands) | 2023 | | 2022 | | 2023 | | 2022 | | Balance at beginning of period | $ | 13,633 | | | $ | 17,753 | | | $ | 10,759 | | | $ | — | | | Purchases/contributions | 4,625 | | | — | | | 7,517 | | | 19,380 | | | Sales/distributions | (2,975) | | | — | | | (2,975) | | | — | | | | | | | | | | | Unrealized gains (losses) | (1,297) | | | 839 | | | (1,315) | | | (788) | | | | | | | | | | | Balance at end of period | $ | 13,986 | | | $ | 18,592 | | | $ | 13,986 | | | $ | 18,592 | |
Unrealized gains (losses) and realized gains (losses), if any, in the above table were recorded in gain (loss) from investments—net in the Company's condensed consolidated statements of operations. Valuation Techniques In certain instances, debt and equity securities are valued on the basis of prices from an orderly transaction between market participants provided by reputable broker-dealers or independent pricing services. In determining the value of a particular investment, independent pricing services may use information with respect to transactions in such investments, broker quotes, pricing matrices, market transactions in comparable investments and various relationships between investments. As part of its independent price verification process, the Company generally performs reviews of valuations provided by broker-dealers or independent pricing services. Investments in funds are valued at their closing price or NAV (or its equivalent) as a practical expedient. In the absence of observable market prices, the Company values its investments using valuation methodologies applied on a consistent basis. For some investments, little market activity may exist; management's determination of fair value is then based on the best information available in the circumstances, and may incorporate management's own assumptions and involve a significant degree of judgment, taking into consideration a combination of internal and external factors. Such investments are valued no less than on a quarterly basis, taking into consideration any changes in key inputs and changes in economic and other relevant conditions, and valuation models are updated accordingly. The Company has established a valuation committee, comprised of senior members from various departments within the Company, to administer, implement and oversee the valuation policies and procedures. Additionally, the Company has retained an independent valuation services firm to assist in the determination of the fair value of certain private real estate investments. The following table summarizes the valuation techniques and significant unobservable inputs approved by the Valuation Committee for Level 3 investments measured at fair value on a recurring basis: | | | | | | | | | | | | | | | | | | | | | | | | | | | | | Fair Value as of June 30, 2023 (in thousands) | | Valuation Technique | | Unobservable Inputs | | Value | Limited partnership interest | | $ | 13,986 | | | Discounted cash flow | | Discount rate
Terminal capitalization rate | | 8.75% 7.25% | | | | | Transaction price | | n/a | | |
| | | | | | | | | | | | | | | | | | | | | | | | | | | | | Fair Value as of December 31, 2022 (in thousands) | | Valuation Technique | | Unobservable Inputs | | Value | Limited partnership interest | | $ | 10,759 | | | Discounted cash flow | | Discount rate
Terminal capitalization rate | | 8.75% 7.25% |
Changes in the significant unobservable inputs in the above tables may result in a materially higher or lower fair value measurement.
|
| X |
- References
+ Details
| Name: |
us-gaap_FairValueDisclosuresAbstract |
| Namespace Prefix: |
us-gaap_ |
| Data Type: |
xbrli:stringItemType |
| Balance Type: |
na |
| Period Type: |
duration |
|
| X |
- DefinitionThe entire disclosure for the fair value of financial instruments (as defined), including financial assets and financial liabilities (collectively, as defined), and the measurements of those instruments as well as disclosures related to the fair value of non-financial assets and liabilities. Such disclosures about the financial instruments, assets, and liabilities would include: (1) the fair value of the required items together with their carrying amounts (as appropriate); (2) for items for which it is not practicable to estimate fair value, disclosure would include: (a) information pertinent to estimating fair value (including, carrying amount, effective interest rate, and maturity, and (b) the reasons why it is not practicable to estimate fair value; (3) significant concentrations of credit risk including: (a) information about the activity, region, or economic characteristics identifying a concentration, (b) the maximum amount of loss the entity is exposed to based on the gross fair value of the related item, (c) policy for requiring collateral or other security and information as to accessing such collateral or security, and (d) the nature and brief description of such collateral or security; (4) quantitative information about market risks and how such risks are managed; (5) for items measured on both a recurring and nonrecurring basis information regarding the inputs used to develop the fair value measurement; and (6) for items presented in the financial statement for which fair value measurement is elected: (a) information necessary to understand the reasons for the election, (b) discussion of the effect of fair value changes on earnings, (c) a description of [similar groups] items for which the election is made and the relation thereof to the balance sheet, the aggregate carrying value of items included in the balance sheet that are not eligible for the election; (7) all other required (as defined) and desired information. Reference 1: http://www.xbrl.org/2003/role/disclosureRef
-Topic 820
-SubTopic 10
-Name Accounting Standards Codification
-Section 50
-Paragraph 2
-Publisher FASB
-URI https://asc.fasb.org//1943274/2147482106/820-10-50-2
| Name: |
us-gaap_FairValueDisclosuresTextBlock |
| Namespace Prefix: |
us-gaap_ |
| Data Type: |
dtr-types:textBlockItemType |
| Balance Type: |
na |
| Period Type: |
duration |
|
v3.23.2
Derivatives
|
6 Months Ended |
Jun. 30, 2023 |
|---|
| Derivative Instruments and Hedging Activities Disclosure [Abstract] |
|
| Derivatives |
Derivatives The following tables summarize the notional amount and fair value of the outstanding derivative financial instruments, none of which were designated in a formal hedging relationship:
| | | | | | | | | | | | | | | | | | | | | | | | | As of June 30, 2023 | | Notional Amount | | Fair Value (1) | | (in thousands) | Long | | Short | | Assets | | Liabilities | | Corporate derivatives: | | | | | | | | | Total return swaps | $ | 2,330 | | | $ | 40,996 | | | $ | 374 | | | $ | 249 | | | Forward contracts - foreign exchange | — | | | 10,039 | | | 476 | | | 18 | | | Total corporate derivatives | $ | 2,330 | | | $ | 51,035 | | | $ | 850 | | | $ | 267 | | | | | | | | | | | | | | | | | | | | | | | | | | | | | | | | | | | | | | | | | |
| | | | | | | | | | | | | | | | | | | | | | | | | As of December 31, 2022 | | Notional Amount | | Fair Value (1) | | (in thousands) | Long | | Short | | Assets | | Liabilities | | Corporate derivatives: | | | | | | | | | Total return swaps | $ | 2,340 | | | $ | 33,637 | | | $ | 276 | | | $ | 717 | | | | | | | | | | | Forward contracts - foreign exchange | — | | | 9,810 | | | — | | | 742 | | | Total corporate derivatives | $ | 2,340 | | | $ | 43,447 | | | $ | 276 | | | $ | 1,459 | |
________________________ (1) The fair value of derivative financial instruments is recorded in other assets and other liabilities and accrued expenses on the Company's condensed consolidated statements of financial condition. The Company's corporate derivatives included: •Total return swaps which are utilized to economically hedge a portion of the market risk of certain seed investments and to gain exposure for the purpose of establishing a performance track record; and •Forward foreign exchange contracts which are utilized to economically hedge currency exposure arising from certain non-U.S. dollar investment advisory fees. Cash and U.S. Treasury securities pledged as collateral for forward and swap contracts totaled $1.7 million and $2.2 million at June 30, 2023 and December 31, 2022, respectively. Cash collateral received for swap contracts was $0.6 million at June 30, 2023. The following table summarizes net gains (losses) from derivative financial instruments: | | | | | | | | | | | | | | | | | | | | | | | | | | Three Months Ended
June 30, | | Six Months Ended
June 30, | | (in thousands) | 2023 | | 2022 | | 2023 | | 2022 | | Corporate derivatives: | | | | | | | | | | | | | | | | | Total return swaps | $ | (25) | | | $ | 3,269 | | | $ | (677) | | | $ | 3,188 | | | | | | | | | | | Forward contracts - foreign exchange | 769 | | | (420) | | | 1,200 | | | 390 | | | Total corporate derivatives | $ | 744 | | | $ | 2,849 | | | $ | 523 | | | $ | 3,578 | | Derivatives held by consolidated investment vehicles: | | | | | | | | | Total return swaps | — | | | (1,152) | | | — | | | 3,160 | | | | | | | | | | Total (1) | $ | 744 | | | $ | 1,697 | | | $ | 523 | | | $ | 6,738 | |
________________________ (1)Gains and losses on total return swaps are included in gain (loss) from investments—net in the Company's condensed consolidated statements of operations. Gains and losses on forward foreign exchange contracts are included in foreign currency gain (loss)—net in the Company's condensed consolidated statements of operations.
|
| X |
- References
+ Details
| Name: |
us-gaap_DerivativeInstrumentsAndHedgingActivitiesDisclosureAbstract |
| Namespace Prefix: |
us-gaap_ |
| Data Type: |
xbrli:stringItemType |
| Balance Type: |
na |
| Period Type: |
duration |
|
| X |
- DefinitionThe entire disclosure for derivatives and fair value of assets and liabilities. Reference 1: http://fasb.org/us-gaap/role/ref/legacyRef
-Topic 815
-Name Accounting Standards Codification
-Publisher FASB
-URI https://asc.fasb.org//815/tableOfContent
Reference 2: http://fasb.org/us-gaap/role/ref/legacyRef
-Topic 820
-Name Accounting Standards Codification
-Publisher FASB
-URI https://asc.fasb.org//820/tableOfContent
| Name: |
us-gaap_DerivativesAndFairValueTextBlock |
| Namespace Prefix: |
us-gaap_ |
| Data Type: |
dtr-types:textBlockItemType |
| Balance Type: |
na |
| Period Type: |
duration |
|
v3.23.2
Earnings Per Share
|
6 Months Ended |
Jun. 30, 2023 |
|---|
| Earnings Per Share [Abstract] |
|
| Earnings Per Share |
Earnings Per Share Basic earnings per share is calculated by dividing net income attributable to common stockholders by the weighted average shares outstanding. Diluted earnings per share is calculated by dividing net income attributable to common stockholders by the total weighted average shares of common stock outstanding and common stock equivalents determined using the treasury stock method. Common stock equivalents are comprised of dilutive potential shares from restricted stock unit awards and are excluded from the computation if their effect is anti-dilutive. The following table reconciles income and share data used in the basic and diluted earnings per share computations:
| | | | | | | | | | | | | | | | | | | | | | | | | | Three Months Ended
June 30, | | Six Months Ended
June 30, | | (in thousands, except per share data) | 2023 | | 2022 | | 2023 | | 2022 | | Net income | $ | 32,505 | | | $ | 26,149 | | | $ | 68,803 | | | $ | 72,990 | | | Net (income) loss attributable to noncontrolling interests | (727) | | | 25,807 | | | (1,711) | | | 20,984 | | | Net income attributable to common stockholders | $ | 31,778 | | | $ | 51,956 | | | $ | 67,092 | | | $ | 93,974 | | | Basic weighted average shares outstanding | 49,315 | | | 48,805 | | | 49,257 | | | 48,739 | | | Dilutive potential shares from restricted stock units | 148 | | | 403 | | | 176 | | | 533 | | | Diluted weighted average shares outstanding | 49,463 | | | 49,208 | | | 49,433 | | | 49,272 | | | | | | | | | | | Basic earnings per share attributable to common stockholders | $ | 0.64 | | | $ | 1.06 | | | $ | 1.36 | | | $ | 1.93 | | | Diluted earnings per share attributable to common stockholders | $ | 0.64 | | | $ | 1.06 | | | $ | 1.36 | | | $ | 1.91 | | | | | | | | | | Anti-dilutive common stock equivalents excluded from the calculation | 214 | | | 2 | | | 141 | | | 2 | |
|
| X |
- References
+ Details
| Name: |
us-gaap_EarningsPerShareAbstract |
| Namespace Prefix: |
us-gaap_ |
| Data Type: |
xbrli:stringItemType |
| Balance Type: |
na |
| Period Type: |
duration |
|
| X |
- DefinitionThe entire disclosure for earnings per share. Reference 1: http://www.xbrl.org/2003/role/disclosureRef
-Topic 260
-SubTopic 10
-Name Accounting Standards Codification
-Section 50
-Paragraph 1
-Subparagraph (c)
-Publisher FASB
-URI https://asc.fasb.org//1943274/2147482662/260-10-50-1
Reference 2: http://www.xbrl.org/2003/role/disclosureRef
-Topic 260
-Name Accounting Standards Codification
-Publisher FASB
-URI https://asc.fasb.org//260/tableOfContent
Reference 3: http://www.xbrl.org/2003/role/disclosureRef
-Topic 260
-SubTopic 10
-Name Accounting Standards Codification
-Section 50
-Paragraph 2
-Publisher FASB
-URI https://asc.fasb.org//1943274/2147482662/260-10-50-2
Reference 4: http://www.xbrl.org/2003/role/disclosureRef
-Topic 260
-SubTopic 10
-Name Accounting Standards Codification
-Section 50
-Paragraph 3
-Publisher FASB
-URI https://asc.fasb.org//1943274/2147482662/260-10-50-3
| Name: |
us-gaap_EarningsPerShareTextBlock |
| Namespace Prefix: |
us-gaap_ |
| Data Type: |
dtr-types:textBlockItemType |
| Balance Type: |
na |
| Period Type: |
duration |
|
v3.23.2
Income Taxes
|
6 Months Ended |
Jun. 30, 2023 |
|---|
| Income Tax Disclosure [Abstract] |
|
| Income Taxes |
Income Taxes The provision for income taxes included U.S. federal, state, local and foreign taxes. A reconciliation of the Company’s statutory federal income tax rate and the effective income tax rate is summarized in the following table:
| | | | | | | | | | | | | | | | | | | | | | | | | Three Months Ended
June 30, | | Six Months Ended
June 30, | | 2023 | | 2022 | | 2023 | | 2022 | | U.S. statutory tax rate | 21.0 | % | | 21.0 | % | | 21.0 | % | | 21.0 | % | | State and local income taxes, net of federal benefit | 3.1 | | | 3.1 | | | 3.1 | | | 3.1 | | | Non-deductible executive compensation | 1.4 | | | 1.6 | | | 2.2 | | | 3.3 | | | Excess tax benefits related to the vesting and delivery of restricted stock units | — | | | 0.2 | | | (2.4) | | | (5.1) | | | Unrecognized tax benefit adjustments | — | | | (10.1) | | | 0.1 | | | (5.5) | | | Other | 0.2 | | | 0.1 | | | — | | | 0.1 | | | Effective income tax rate | 25.7 | % | | 15.9 | % | | 24.0 | % | | 16.9 | % |
|
| X |
- DefinitionThe entire disclosure for income taxes. Disclosures may include net deferred tax liability or asset recognized in an enterprise's statement of financial position, net change during the year in the total valuation allowance, approximate tax effect of each type of temporary difference and carryforward that gives rise to a significant portion of deferred tax liabilities and deferred tax assets, utilization of a tax carryback, and tax uncertainties information. Reference 1: http://www.xbrl.org/2003/role/disclosureRef
-Topic 946
-SubTopic 20
-Name Accounting Standards Codification
-Section 50
-Paragraph 13
-Publisher FASB
-URI https://asc.fasb.org//1943274/2147480990/946-20-50-13
Reference 2: http://www.xbrl.org/2003/role/disclosureRef
-Topic 235
-SubTopic 10
-Name Accounting Standards Codification
-Section S99
-Paragraph 1
-Subparagraph (SX 210.4-08(h)(2))
-Publisher FASB
-URI https://asc.fasb.org//1943274/2147480678/235-10-S99-1
Reference 3: http://www.xbrl.org/2003/role/disclosureRef
-Topic 740
-Name Accounting Standards Codification
-Publisher FASB
-URI https://asc.fasb.org//740/tableOfContent
Reference 4: http://www.xbrl.org/2003/role/disclosureRef
-Topic 740
-SubTopic 10
-Name Accounting Standards Codification
-Section 50
-Paragraph 14
-Publisher FASB
-URI https://asc.fasb.org//1943274/2147482685/740-10-50-14
Reference 5: http://www.xbrl.org/2003/role/disclosureRef
-Topic 740
-SubTopic 10
-Name Accounting Standards Codification
-Section 50
-Paragraph 21
-Publisher FASB
-URI https://asc.fasb.org//1943274/2147482685/740-10-50-21
Reference 6: http://www.xbrl.org/2003/role/disclosureRef
-Topic 740
-SubTopic 270
-Name Accounting Standards Codification
-Section 50
-Paragraph 1
-Publisher FASB
-URI https://asc.fasb.org//1943274/2147482526/740-270-50-1
Reference 7: http://www.xbrl.org/2003/role/disclosureRef
-Topic 740
-SubTopic 10
-Name Accounting Standards Codification
-Section 50
-Paragraph 17
-Subparagraph (b)
-Publisher FASB
-URI https://asc.fasb.org//1943274/2147482685/740-10-50-17
Reference 8: http://www.xbrl.org/2003/role/disclosureRef
-Topic 740
-SubTopic 10
-Name Accounting Standards Codification
-Section S99
-Paragraph 1
-Subparagraph (SAB TOPIC 6.I.5.Q1)
-Publisher FASB
-URI https://asc.fasb.org//1943274/2147479360/740-10-S99-1
Reference 9: http://www.xbrl.org/2003/role/disclosureRef
-Topic 740
-SubTopic 10
-Name Accounting Standards Codification
-Section S99
-Paragraph 2
-Subparagraph (SAB Topic 11.C)
-Publisher FASB
-URI https://asc.fasb.org//1943274/2147479360/740-10-S99-2
Reference 10: http://www.xbrl.org/2003/role/disclosureRef
-Topic 740
-SubTopic 30
-Name Accounting Standards Codification
-Section 50
-Paragraph 2
-Subparagraph (a)
-Publisher FASB
-URI https://asc.fasb.org//1943274/2147482603/740-30-50-2
| Name: |
us-gaap_IncomeTaxDisclosureTextBlock |
| Namespace Prefix: |
us-gaap_ |
| Data Type: |
dtr-types:textBlockItemType |
| Balance Type: |
na |
| Period Type: |
duration |
|
v3.23.2
Related Party Transactions
|
6 Months Ended |
Jun. 30, 2023 |
|---|
| Related Party Transactions [Abstract] |
|
| Related Party Transactions |
Related Party Transactions The Company is an investment adviser to, and has administration agreements with, Company-sponsored funds and investment products for which certain employees are officers and/or directors. The following table summarizes the amount of revenue the Company earned from these affiliated funds:
| | | | | | | | | | | | | | | | | | | | | | | | | | Three Months Ended
June 30, | | Six Months Ended
June 30, | | (in thousands) | 2023 | | 2022 | | 2023 | | 2022 | Investment advisory and administration fees (1) | $ | 81,113 | | | $ | 100,803 | | | $ | 166,612 | | | $ | 205,040 | | | Distribution and service fees | 6,977 | | | 9,005 | | | 14,539 | | | 18,874 | | | Total | $ | 88,090 | | | $ | 109,808 | | | $ | 181,151 | | | $ | 223,914 | |
_________________________ (1) Investment advisory and administration fees are reflected net of fund reimbursements of $4.3 million for both the three months ended June 30, 2023 and 2022, and $8.9 million and $8.6 million for the six months ended June 30, 2023 and 2022, respectively. Included in accounts receivable at June 30, 2023 and December 31, 2022 are receivables due from Company-sponsored funds, which are generally collectible the next business day, of $30.7 million and $32.9 million, respectively. Included in accounts payable at June 30, 2023 and December 31, 2022 are payables due to Company-sponsored funds of $0.8 million and $1.0 million, respectively. Included in other assets at June 30, 2023 and December 31, 2022 is an advance to Cohen & Steers Income Opportunities REIT, Inc. (CNSREIT) of $6.4 million and $3.5 million, respectively. CNSREIT will reimburse the Company ratably over a 60-month period commencing at the earlier of December 31, 2025, or the month that CNREIT's NAV is at least $1.0 billion. At June 30, 2023 and December 31, 2022, the Company determined the advance to be collectible. At June 30, 2023, the Company reclassified the advance from accounts receivable to other assets on its condensed consolidated statement of financial condition as of December 31, 2022. See discussion of commitments to Company-sponsored vehicles in Note 11.
|
| X |
- DefinitionThe entire disclosure for related party transactions. Examples of related party transactions include transactions between (a) a parent company and its subsidiary; (b) subsidiaries of a common parent; (c) and entity and its principal owners; and (d) affiliates. Reference 1: http://www.xbrl.org/2003/role/disclosureRef
-Topic 946
-SubTopic 20
-Name Accounting Standards Codification
-Section 50
-Paragraph 2
-Publisher FASB
-URI https://asc.fasb.org//1943274/2147480990/946-20-50-2
Reference 2: http://www.xbrl.org/2003/role/disclosureRef
-Topic 946
-SubTopic 20
-Name Accounting Standards Codification
-Section 50
-Paragraph 5
-Publisher FASB
-URI https://asc.fasb.org//1943274/2147480990/946-20-50-5
Reference 3: http://www.xbrl.org/2003/role/disclosureRef
-Topic 946
-SubTopic 20
-Name Accounting Standards Codification
-Section 50
-Paragraph 6
-Publisher FASB
-URI https://asc.fasb.org//1943274/2147480990/946-20-50-6
Reference 4: http://www.xbrl.org/2003/role/disclosureRef
-Topic 946
-SubTopic 235
-Name Accounting Standards Codification
-Section 50
-Paragraph 2
-Subparagraph (c)
-Publisher FASB
-URI https://asc.fasb.org//1943274/2147481062/946-235-50-2
Reference 5: http://www.xbrl.org/2003/role/disclosureRef
-Topic 946
-SubTopic 235
-Name Accounting Standards Codification
-Section 50
-Paragraph 2
-Subparagraph (e)
-Publisher FASB
-URI https://asc.fasb.org//1943274/2147481062/946-235-50-2
Reference 6: http://www.xbrl.org/2003/role/disclosureRef
-Topic 850
-SubTopic 10
-Name Accounting Standards Codification
-Section 50
-Paragraph 1
-Subparagraph (d)
-Publisher FASB
-URI https://asc.fasb.org//1943274/2147483326/850-10-50-1
Reference 7: http://www.xbrl.org/2003/role/disclosureRef
-Topic 946
-SubTopic 220
-Name Accounting Standards Codification
-Section S99
-Paragraph 1
-Subparagraph (SX 210.6-07(2)(g)(3))
-Publisher FASB
-URI https://asc.fasb.org//1943274/2147483575/946-220-S99-1
Reference 8: http://www.xbrl.org/2003/role/disclosureRef
-Topic 946
-SubTopic 220
-Name Accounting Standards Codification
-Section S99
-Paragraph 1
-Subparagraph (SX 210.6-07(2)(c))
-Publisher FASB
-URI https://asc.fasb.org//1943274/2147483575/946-220-S99-1
Reference 9: http://www.xbrl.org/2003/role/disclosureRef
-Topic 946
-SubTopic 220
-Name Accounting Standards Codification
-Section S99
-Paragraph 1
-Subparagraph (SX 210.6-07(2)(e))
-Publisher FASB
-URI https://asc.fasb.org//1943274/2147483575/946-220-S99-1
Reference 10: http://www.xbrl.org/2003/role/disclosureRef
-Topic 850
-Name Accounting Standards Codification
-Publisher FASB
-URI https://asc.fasb.org//850/tableOfContent
Reference 11: http://www.xbrl.org/2003/role/disclosureRef
-Topic 850
-SubTopic 10
-Name Accounting Standards Codification
-Section 50
-Paragraph 6
-Publisher FASB
-URI https://asc.fasb.org//1943274/2147483326/850-10-50-6
Reference 12: http://www.xbrl.org/2003/role/disclosureRef
-Topic 850
-SubTopic 10
-Name Accounting Standards Codification
-Section 50
-Paragraph 1
-Subparagraph (a)
-Publisher FASB
-URI https://asc.fasb.org//1943274/2147483326/850-10-50-1
Reference 13: http://www.xbrl.org/2003/role/disclosureRef
-Topic 850
-SubTopic 10
-Name Accounting Standards Codification
-Section 50
-Paragraph 1
-Subparagraph (b)
-Publisher FASB
-URI https://asc.fasb.org//1943274/2147483326/850-10-50-1
| Name: |
us-gaap_RelatedPartyTransactionsDisclosureTextBlock |
| Namespace Prefix: |
us-gaap_ |
| Data Type: |
dtr-types:textBlockItemType |
| Balance Type: |
na |
| Period Type: |
duration |
|
v3.23.2
Credit Losses
|
6 Months Ended |
Jun. 30, 2023 |
|---|
| Credit Loss [Abstract] |
|
| Credit Agreement |
Credit Agreement On January 20, 2023, the Company entered into a Credit Agreement with Bank of America, N.A. (Credit Agreement) providing for a $100.0 million senior unsecured revolving credit facility maturing on January 20, 2026. Borrowings under the Credit Agreement bear interest at a variable annual rate equal to, at the Company’s option, either, (i) in respect of Term Secured Overnight Financing Rate (SOFR) Loans (as defined in the Credit Agreement), a rate equal to Term SOFR (as defined in the Credit Agreement) in effect for such period plus an applicable rate as determined according to a performance pricing grid and, (ii) in respect of Base Rate Loans (as defined in the Credit Agreement), a rate equal to a Base Rate (as defined in the Credit Agreement) plus an applicable rate as determined according to a performance pricing grid. The Company is also required to pay a commitment fee determined according to a performance pricing grid and based on the actual daily unused amount of the Credit Agreement payable quarterly.
Borrowings under the Credit Agreement may be used for working capital and other general corporate purposes. The Credit Agreement contains affirmative, negative and financial covenants, which are customary for facilities of this type, including with respect to leverage and interest coverage, limitations on priority indebtedness, asset dispositions and fundamental corporate changes. As of June 30, 2023, the Company was in compliance with these covenants.
As of June 30, 2023, the Company had not drawn upon the credit agreement.
|
| X |
- Definition
+ References
+ Details
| Name: |
cns_CreditAgreementTextBlock |
| Namespace Prefix: |
cns_ |
| Data Type: |
dtr-types:textBlockItemType |
| Balance Type: |
na |
| Period Type: |
duration |
|
| X |
- References
+ Details
| Name: |
us-gaap_CreditLossAbstract |
| Namespace Prefix: |
us-gaap_ |
| Data Type: |
xbrli:stringItemType |
| Balance Type: |
na |
| Period Type: |
duration |
|
v3.23.2
Commitments and Contingencies
|
6 Months Ended |
Jun. 30, 2023 |
|---|
| Commitments and Contingencies Disclosure [Abstract] |
|
| Commitments and Contingencies |
Commitments and Contingencies From time to time, the Company is involved in legal matters relating to claims arising in the ordinary course of business. There are currently no such matters pending that the Company believes could have a material adverse effect on its consolidated results of operations, cash flows or financial position. The Company has committed to invest up to $50.0 million in REOF. As of June 30, 2023, the Company had funded $21.2 million of this commitment. In addition, the Company has committed to invest up to $125.0 million in CNSREIT. As of June 30, 2023, the Company had funded $0.2 million of this commitment to enable CNSREIT to capitalize a share class in preparation for an offering. The timing for funding the remaining portion of the Company's commitments is determined by the investment vehicles.
|
| X |
- References
+ Details
| Name: |
us-gaap_CommitmentsAndContingenciesDisclosureAbstract |
| Namespace Prefix: |
us-gaap_ |
| Data Type: |
xbrli:stringItemType |
| Balance Type: |
na |
| Period Type: |
duration |
|
| X |
- DefinitionThe entire disclosure for commitments and contingencies. Reference 1: http://www.xbrl.org/2003/role/disclosureRef
-Topic 440
-SubTopic 10
-Name Accounting Standards Codification
-Section 50
-Paragraph 4
-Subparagraph (a)
-Publisher FASB
-URI https://asc.fasb.org//1943274/2147482648/440-10-50-4
Reference 2: http://www.xbrl.org/2009/role/commonPracticeRef
-Topic 450
-Name Accounting Standards Codification
-Publisher FASB
-URI https://asc.fasb.org//450/tableOfContent
Reference 3: http://www.xbrl.org/2003/role/disclosureRef
-Topic 954
-SubTopic 440
-Name Accounting Standards Codification
-Section 50
-Paragraph 1
-Subparagraph (a)
-Publisher FASB
-URI https://asc.fasb.org//1943274/2147480327/954-440-50-1
Reference 4: http://www.xbrl.org/2003/role/disclosureRef
-Topic 440
-SubTopic 10
-Name Accounting Standards Codification
-Section 50
-Paragraph 4
-Subparagraph (c)
-Publisher FASB
-URI https://asc.fasb.org//1943274/2147482648/440-10-50-4
Reference 5: http://fasb.org/us-gaap/role/ref/legacyRef
-Topic 440
-Name Accounting Standards Codification
-Publisher FASB
-URI https://asc.fasb.org//440/tableOfContent
| Name: |
us-gaap_CommitmentsAndContingenciesDisclosureTextBlock |
| Namespace Prefix: |
us-gaap_ |
| Data Type: |
dtr-types:textBlockItemType |
| Balance Type: |
na |
| Period Type: |
duration |
|
v3.23.2
Concentration of Credit Risk
|
6 Months Ended |
Jun. 30, 2023 |
|---|
| Risks and Uncertainties [Abstract] |
|
| Concentration of Credit Risk |
Concentration of Credit Risk The Company's cash and cash equivalents are principally on deposit with highly rated national financial institutions and are subject to credit risk should these financial institutions be unable to fulfill their obligations. The Company limits its exposure to such credit risks by diversifying its cash and cash equivalents among several highly rated national financial institutions.
|
| X |
- DefinitionThe entire disclosure for any concentrations existing at the date of the financial statements that make an entity vulnerable to a reasonably possible, near-term, severe impact. This disclosure informs financial statement users about the general nature of the risk associated with the concentration, and may indicate the percentage of concentration risk as of the balance sheet date. Reference 1: http://fasb.org/us-gaap/role/ref/legacyRef
-Topic 275
-Name Accounting Standards Codification
-Publisher FASB
-URI https://asc.fasb.org//275/tableOfContent
| Name: |
us-gaap_ConcentrationRiskDisclosureTextBlock |
| Namespace Prefix: |
us-gaap_ |
| Data Type: |
dtr-types:textBlockItemType |
| Balance Type: |
na |
| Period Type: |
duration |
|
| X |
- References
+ Details
| Name: |
us-gaap_RisksAndUncertaintiesAbstract |
| Namespace Prefix: |
us-gaap_ |
| Data Type: |
xbrli:stringItemType |
| Balance Type: |
na |
| Period Type: |
duration |
|
v3.23.2
Subsequent Events
|
6 Months Ended |
Jun. 30, 2023 |
|---|
| Subsequent Events [Abstract] |
|
| Subsequent Events |
Subsequent Events The Company has evaluated the need for disclosures and/or adjustments resulting from subsequent events through the date the condensed consolidated financial statements were issued. Other than the items described below, the Company determined that there were no additional subsequent events that require disclosure and/or adjustment. On August 3, 2023, the Company declared a quarterly dividend on its common stock in the amount of $0.57 per share. This dividend will be payable on August 24, 2023 to stockholders of record at the close of business on August 14, 2023.
|
| X |
- References
+ Details
| Name: |
us-gaap_SubsequentEventsAbstract |
| Namespace Prefix: |
us-gaap_ |
| Data Type: |
xbrli:stringItemType |
| Balance Type: |
na |
| Period Type: |
duration |
|
| X |
- DefinitionThe entire disclosure for significant events or transactions that occurred after the balance sheet date through the date the financial statements were issued or the date the financial statements were available to be issued. Examples include: the sale of a capital stock issue, purchase of a business, settlement of litigation, catastrophic loss, significant foreign exchange rate changes, loans to insiders or affiliates, and transactions not in the ordinary course of business. Reference 1: http://www.xbrl.org/2003/role/disclosureRef
-Topic 855
-Name Accounting Standards Codification
-Publisher FASB
-URI https://asc.fasb.org//855/tableOfContent
Reference 2: http://www.xbrl.org/2003/role/disclosureRef
-Topic 855
-SubTopic 10
-Name Accounting Standards Codification
-Section 50
-Paragraph 2
-Subparagraph (a)
-Publisher FASB
-URI https://asc.fasb.org//1943274/2147483399/855-10-50-2
| Name: |
us-gaap_SubsequentEventsTextBlock |
| Namespace Prefix: |
us-gaap_ |
| Data Type: |
dtr-types:textBlockItemType |
| Balance Type: |
na |
| Period Type: |
duration |
|
v3.23.2
| X |
- ReferencesReference 1: http://www.xbrl.org/2003/role/presentationRef
-Publisher SEC
-Name Regulation S-K
-Number 229
-Section 402
-Subsection v
-Paragraph 1
| Name: |
ecd_PvpTable |
| Namespace Prefix: |
ecd_ |
| Data Type: |
xbrli:stringItemType |
| Balance Type: |
na |
| Period Type: |
duration |
|
| X |
- DefinitionThe portion of profit or loss for the period, net of income taxes, which is attributable to the parent. Reference 1: http://www.xbrl.org/2003/role/disclosureRef
-Topic 235
-SubTopic 10
-Name Accounting Standards Codification
-Section S99
-Paragraph 1
-Subparagraph (SX 210.4-08(g)(1)(ii))
-Publisher FASB
-URI https://asc.fasb.org//1943274/2147480678/235-10-S99-1
Reference 2: http://www.xbrl.org/2003/role/disclosureRef
-Topic 323
-SubTopic 10
-Name Accounting Standards Codification
-Section 50
-Paragraph 3
-Subparagraph (c)
-Publisher FASB
-URI https://asc.fasb.org//1943274/2147481687/323-10-50-3
Reference 3: http://www.xbrl.org/2003/role/disclosureRef
-Topic 825
-SubTopic 10
-Name Accounting Standards Codification
-Section 50
-Paragraph 28
-Subparagraph (f)
-Publisher FASB
-URI https://asc.fasb.org//1943274/2147482907/825-10-50-28
Reference 4: http://www.xbrl.org/2003/role/disclosureRef
-Topic 220
-SubTopic 10
-Name Accounting Standards Codification
-Section 50
-Paragraph 6
-Publisher FASB
-URI https://asc.fasb.org//1943274/2147482765/220-10-50-6
Reference 5: http://www.xbrl.org/2003/role/disclosureRef
-Topic 250
-SubTopic 10
-Name Accounting Standards Codification
-Section 50
-Paragraph 3
-Publisher FASB
-URI https://asc.fasb.org//1943274/2147483443/250-10-50-3
Reference 6: http://www.xbrl.org/2003/role/disclosureRef
-Topic 250
-SubTopic 10
-Name Accounting Standards Codification
-Section 50
-Paragraph 1
-Subparagraph (b)(2)
-Publisher FASB
-URI https://asc.fasb.org//1943274/2147483443/250-10-50-1
Reference 7: http://www.xbrl.org/2003/role/disclosureRef
-Topic 815
-SubTopic 40
-Name Accounting Standards Codification
-Section 65
-Paragraph 1
-Subparagraph (f)
-Publisher FASB
-URI https://asc.fasb.org//1943274/2147480175/815-40-65-1
Reference 8: http://www.xbrl.org/2003/role/disclosureRef
-Topic 250
-SubTopic 10
-Name Accounting Standards Codification
-Section 50
-Paragraph 8
-Publisher FASB
-URI https://asc.fasb.org//1943274/2147483443/250-10-50-8
Reference 9: http://www.xbrl.org/2003/role/disclosureRef
-Topic 250
-SubTopic 10
-Name Accounting Standards Codification
-Section 50
-Paragraph 9
-Publisher FASB
-URI https://asc.fasb.org//1943274/2147483443/250-10-50-9
Reference 10: http://www.xbrl.org/2003/role/disclosureRef
-Topic 250
-SubTopic 10
-Name Accounting Standards Codification
-Section 50
-Paragraph 11
-Subparagraph (a)
-Publisher FASB
-URI https://asc.fasb.org//1943274/2147483443/250-10-50-11
Reference 11: http://www.xbrl.org/2003/role/disclosureRef
-Topic 250
-SubTopic 10
-Name Accounting Standards Codification
-Section 50
-Paragraph 11
-Subparagraph (b)
-Publisher FASB
-URI https://asc.fasb.org//1943274/2147483443/250-10-50-11
Reference 12: http://www.xbrl.org/2003/role/disclosureRef
-Topic 250
-SubTopic 10
-Name Accounting Standards Codification
-Section 50
-Paragraph 4
-Publisher FASB
-URI https://asc.fasb.org//1943274/2147483443/250-10-50-4
Reference 13: http://www.xbrl.org/2003/role/exampleRef
-Topic 946
-SubTopic 830
-Name Accounting Standards Codification
-Section 55
-Paragraph 10
-Publisher FASB
-URI https://asc.fasb.org//1943274/2147480167/946-830-55-10
Reference 14: http://www.xbrl.org/2003/role/disclosureRef
-Topic 946
-SubTopic 220
-Name Accounting Standards Codification
-Section 45
-Paragraph 7
-Publisher FASB
-URI https://asc.fasb.org//1943274/2147483581/946-220-45-7
Reference 15: http://www.xbrl.org/2003/role/disclosureRef
-Topic 944
-SubTopic 220
-Name Accounting Standards Codification
-Section S99
-Paragraph 1
-Subparagraph (SX 210.7-04(18))
-Publisher FASB
-URI https://asc.fasb.org//1943274/2147483586/944-220-S99-1
Reference 16: http://www.xbrl.org/2003/role/disclosureRef
-Topic 280
-SubTopic 10
-Name Accounting Standards Codification
-Section 50
-Paragraph 22
-Publisher FASB
-URI https://asc.fasb.org//1943274/2147482810/280-10-50-22
Reference 17: http://www.xbrl.org/2003/role/disclosureRef
-Topic 946
-SubTopic 220
-Name Accounting Standards Codification
-Section S99
-Paragraph 1
-Subparagraph (SX 210.6-07(9))
-Publisher FASB
-URI https://asc.fasb.org//1943274/2147483575/946-220-S99-1
Reference 18: http://www.xbrl.org/2003/role/disclosureRef
-Topic 946
-SubTopic 220
-Name Accounting Standards Codification
-Section S99
-Paragraph 3
-Subparagraph (SX 210.6-09(1)(d))
-Publisher FASB
-URI https://asc.fasb.org//1943274/2147483575/946-220-S99-3
Reference 19: http://www.xbrl.org/2003/role/disclosureRef
-Topic 470
-SubTopic 10
-Name Accounting Standards Codification
-Section S99
-Paragraph 1A
-Subparagraph (SX 210.13-01(a)(4)(i))
-Publisher FASB
-URI https://asc.fasb.org//1943274/2147480097/470-10-S99-1A
Reference 20: http://www.xbrl.org/2009/role/commonPracticeRef
-Topic 470
-SubTopic 10
-Name Accounting Standards Codification
-Section S99
-Paragraph 1A
-Subparagraph (SX 210.13-01(a)(4)(ii))
-Publisher FASB
-URI https://asc.fasb.org//1943274/2147480097/470-10-S99-1A
Reference 21: http://www.xbrl.org/2003/role/disclosureRef
-Topic 470
-SubTopic 10
-Name Accounting Standards Codification
-Section S99
-Paragraph 1A
-Subparagraph (SX 210.13-01(a)(4)(iii)(A))
-Publisher FASB
-URI https://asc.fasb.org//1943274/2147480097/470-10-S99-1A
Reference 22: http://www.xbrl.org/2003/role/disclosureRef
-Topic 470
-SubTopic 10
-Name Accounting Standards Codification
-Section S99
-Paragraph 1A
-Subparagraph (SX 210.13-01(a)(4)(iv))
-Publisher FASB
-URI https://asc.fasb.org//1943274/2147480097/470-10-S99-1A
Reference 23: http://www.xbrl.org/2003/role/disclosureRef
-Topic 470
-SubTopic 10
-Name Accounting Standards Codification
-Section S99
-Paragraph 1A
-Subparagraph (SX 210.13-01(a)(5))
-Publisher FASB
-URI https://asc.fasb.org//1943274/2147480097/470-10-S99-1A
Reference 24: http://www.xbrl.org/2003/role/disclosureRef
-Topic 470
-SubTopic 10
-Name Accounting Standards Codification
-Section S99
-Paragraph 1B
-Subparagraph (SX 210.13-02(a)(4)(i))
-Publisher FASB
-URI https://asc.fasb.org//1943274/2147480097/470-10-S99-1B
Reference 25: http://www.xbrl.org/2003/role/disclosureRef
-Topic 470
-SubTopic 10
-Name Accounting Standards Codification
-Section S99
-Paragraph 1B
-Subparagraph (SX 210.13-02(a)(4)(iii)(A))
-Publisher FASB
-URI https://asc.fasb.org//1943274/2147480097/470-10-S99-1B
Reference 26: http://www.xbrl.org/2003/role/disclosureRef
-Topic 470
-SubTopic 10
-Name Accounting Standards Codification
-Section S99
-Paragraph 1B
-Subparagraph (SX 210.13-02(a)(4)(iii)(B))
-Publisher FASB
-URI https://asc.fasb.org//1943274/2147480097/470-10-S99-1B
Reference 27: http://www.xbrl.org/2003/role/disclosureRef
-Topic 470
-SubTopic 10
-Name Accounting Standards Codification
-Section S99
-Paragraph 1B
-Subparagraph (SX 210.13-02(a)(4)(iv))
-Publisher FASB
-URI https://asc.fasb.org//1943274/2147480097/470-10-S99-1B
Reference 28: http://www.xbrl.org/2003/role/disclosureRef
-Topic 470
-SubTopic 10
-Name Accounting Standards Codification
-Section S99
-Paragraph 1B
-Subparagraph (SX 210.13-02(a)(5))
-Publisher FASB
-URI https://asc.fasb.org//1943274/2147480097/470-10-S99-1B
Reference 29: http://www.xbrl.org/2003/role/disclosureRef
-Topic 280
-SubTopic 10
-Name Accounting Standards Codification
-Section 50
-Paragraph 30
-Subparagraph (b)
-Publisher FASB
-URI https://asc.fasb.org//1943274/2147482810/280-10-50-30
Reference 30: http://www.xbrl.org/2003/role/disclosureRef
-Topic 280
-SubTopic 10
-Name Accounting Standards Codification
-Section 50
-Paragraph 32
-Subparagraph (f)
-Publisher FASB
-URI https://asc.fasb.org//1943274/2147482810/280-10-50-32
Reference 31: http://www.xbrl.org/2003/role/disclosureRef
-Topic 260
-SubTopic 10
-Name Accounting Standards Codification
-Section 45
-Paragraph 60B
-Subparagraph (a)
-Publisher FASB
-URI https://asc.fasb.org//1943274/2147482689/260-10-45-60B
Reference 32: http://www.xbrl.org/2003/role/exampleRef
-Topic 280
-SubTopic 10
-Name Accounting Standards Codification
-Section 50
-Paragraph 31
-Publisher FASB
-URI https://asc.fasb.org//1943274/2147482810/280-10-50-31
Reference 33: http://www.xbrl.org/2003/role/disclosureRef
-Topic 280
-SubTopic 10
-Name Accounting Standards Codification
-Section 50
-Paragraph 32
-Subparagraph (c)
-Publisher FASB
-URI https://asc.fasb.org//1943274/2147482810/280-10-50-32
Reference 34: http://www.xbrl.org/2003/role/disclosureRef
-Topic 205
-SubTopic 20
-Name Accounting Standards Codification
-Section 50
-Paragraph 7
-Publisher FASB
-URI https://asc.fasb.org//1943274/2147483499/205-20-50-7
Reference 35: http://fasb.org/us-gaap/role/ref/legacyRef
-Topic 230
-SubTopic 10
-Name Accounting Standards Codification
-Section 45
-Paragraph 28
-Publisher FASB
-URI https://asc.fasb.org//1943274/2147482740/230-10-45-28
Reference 36: http://www.xbrl.org/2003/role/disclosureRef
-Topic 220
-SubTopic 10
-Name Accounting Standards Codification
-Section 45
-Paragraph 1A
-Subparagraph (a)
-Publisher FASB
-URI https://asc.fasb.org//1943274/2147482790/220-10-45-1A
Reference 37: http://www.xbrl.org/2003/role/disclosureRef
-Topic 220
-SubTopic 10
-Name Accounting Standards Codification
-Section 45
-Paragraph 1B
-Subparagraph (a)
-Publisher FASB
-URI https://asc.fasb.org//1943274/2147482790/220-10-45-1B
Reference 38: http://fasb.org/us-gaap/role/ref/legacyRef
-Topic 220
-SubTopic 10
-Name Accounting Standards Codification
-Section S99
-Paragraph 2
-Subparagraph (SX 210.5-03(20))
-Publisher FASB
-URI https://asc.fasb.org//1943274/2147483621/220-10-S99-2
Reference 39: http://fasb.org/us-gaap/role/ref/legacyRef
-Topic 942
-SubTopic 220
-Name Accounting Standards Codification
-Section S99
-Paragraph 1
-Subparagraph (SX 210.9-04(22))
-Publisher FASB
-URI https://asc.fasb.org//1943274/2147483589/942-220-S99-1
| Name: |
us-gaap_NetIncomeLoss |
| Namespace Prefix: |
us-gaap_ |
| Data Type: |
xbrli:monetaryItemType |
| Balance Type: |
credit |
| Period Type: |
duration |
|
v3.23.2
| X |
- ReferencesReference 1: http://www.xbrl.org/2003/role/presentationRef
-Publisher SEC
-Name Regulation S-K
-Number 229
-Section 408
-Subsection a
-Paragraph 1
| Name: |
ecd_NonRule10b51ArrAdoptedFlag |
| Namespace Prefix: |
ecd_ |
| Data Type: |
xbrli:booleanItemType |
| Balance Type: |
na |
| Period Type: |
duration |
|
| X |
- ReferencesReference 1: http://www.xbrl.org/2003/role/presentationRef
-Publisher SEC
-Name Regulation S-K
-Number 229
-Section 408
-Subsection a
-Paragraph 1
| Name: |
ecd_NonRule10b51ArrTrmntdFlag |
| Namespace Prefix: |
ecd_ |
| Data Type: |
xbrli:booleanItemType |
| Balance Type: |
na |
| Period Type: |
duration |
|
| X |
- ReferencesReference 1: http://www.xbrl.org/2003/role/presentationRef
-Publisher SEC
-Name Regulation S-K
-Number 229
-Section 408
-Subsection a
-Paragraph 1
| Name: |
ecd_Rule10b51ArrAdoptedFlag |
| Namespace Prefix: |
ecd_ |
| Data Type: |
xbrli:booleanItemType |
| Balance Type: |
na |
| Period Type: |
duration |
|
| X |
- ReferencesReference 1: http://www.xbrl.org/2003/role/presentationRef
-Publisher SEC
-Name Regulation S-K
-Number 229
-Section 408
-Subsection a
-Paragraph 1
| Name: |
ecd_Rule10b51ArrTrmntdFlag |
| Namespace Prefix: |
ecd_ |
| Data Type: |
xbrli:booleanItemType |
| Balance Type: |
na |
| Period Type: |
duration |
|
| X |
- ReferencesReference 1: http://www.xbrl.org/2003/role/presentationRef
-Publisher SEC
-Name Regulation S-K
-Number 229
-Section 408
-Subsection a
-Paragraph 2
-Subparagraph A
| Name: |
ecd_TradingArrByIndTable |
| Namespace Prefix: |
ecd_ |
| Data Type: |
xbrli:stringItemType |
| Balance Type: |
na |
| Period Type: |
duration |
|
v3.23.2
Basis of Presentation and Significant Accounting Policies (Policies)
|
6 Months Ended |
Jun. 30, 2023 |
|---|
| Accounting Policies [Abstract] |
|
| Accounting Estimates |
Accounting Estimates—The preparation of the condensed consolidated financial statements in conformity with GAAP requires management to make certain estimates and assumptions that affect the reported amounts of assets and liabilities and the disclosures of contingent assets and liabilities at the dates of the condensed consolidated financial statements and the reported amounts of revenue and expenses during the reporting periods. Management believes the estimates used in preparing the condensed consolidated financial statements are reasonable and prudent. Actual results could differ from those estimates.
|
| Consolidation of investment vehicles |
Consolidation of Investment Vehicles—The Company's financial interests in investment vehicles, including the management fees that are received, are evaluated at inception and thereafter, if there is a reconsideration event, in order to determine whether to apply the Variable Interest Entity (VIE) model or the Voting Interest Entity (VOE) model. A VIE is an entity in which either the equity investment at risk is not sufficient to permit the entity to finance its own activities without additional financial support or the group of holders of the equity investment at risk lack certain characteristics of a controlling financial interest. The primary beneficiary is the entity that has the power to direct the activities of the VIE that most significantly affect its performance, and the obligation to absorb losses of the entity or the right to receive benefits from the entity that could potentially be significant to the VIE. Subscriptions and redemptions or amendments to the governing documents of the respective entities could affect an entity's status as a VIE or the determination of the primary beneficiary. Limited partnerships and similar entities are determined to be a VIE when the Company is the general partner and the limited partners do not hold substantive kick-out or participation rights. The Company assesses whether it is the primary beneficiary of any VIEs identified by evaluating its economic interests in the entity held either directly by the Company and its affiliates or indirectly through employees. VIEs for which the Company is deemed to be the primary beneficiary are consolidated. Investments that are determined to be VOEs are consolidated when the Company’s ownership interest is greater than 50% of the outstanding voting interests of the vehicle. The Company records noncontrolling interests in consolidated investment vehicles for which the Company’s ownership is less than 100%.
|
| Cash and Cash Equivalents |
Cash and Cash Equivalents—Cash and cash equivalents include short-term, highly liquid investments, which are readily convertible into cash and have original maturities of three months or less.
|
| Due from/to Brokers |
Due from/to Brokers—The Company, including the consolidated investment vehicles, may transact with brokers for certain investment activities. The clearing and custody operations for these investment activities are performed pursuant to contractual agreements. The due from/to brokers balances represent cash and/or cash collateral balances at brokers/custodians and/or receivables and payables for unsettled securities transactions with brokers/custodians.
|
| Investments |
Investments—Management of the Company determines the appropriate classification of its investments at the time of purchase and re-evaluates such determination no less than on a quarterly basis. The Company's investments are categorized as follows: •Equity investments at fair value generally represent common stocks, limited partnership interests, master limited partnership interests, preferred securities and other seed investments in Company-sponsored vehicles. •Trading investments generally represent U.S. Treasury securities and investment-grade corporate debt securities. Realized and unrealized gains and losses on our investments are recorded in gain (loss) from investments—net in the Company's condensed consolidated statements of operations. From time to time, the Company, including the consolidated investment vehicles, may enter into derivative contracts, including options, futures and swaps contracts, to gain exposure to the underlying commodities markets or to economically hedge market risk of the underlying portfolios. Gains and losses on derivative contracts are recorded in gain (loss) from investments—net in the Company's condensed consolidated statements of operations. The fair values of these instruments are recorded in other assets or other liabilities and accrued expenses on the Company's condensed consolidated statements of financial condition. Additionally, from time to time, the Company, including the consolidated investment vehicles, may enter into forward foreign exchange contracts to economically hedge currency exposure. These instruments are measured at fair value based on the prevailing forward exchange rate with gains and losses recorded in foreign currency gain (loss)—net in the Company’s condensed consolidated statements of operations. The fair values of these contracts are recorded in other assets or other liabilities and accrued expenses on the Company’s condensed consolidated statements of financial condition.
|
| Leases |
Leases—The Company determines if an arrangement is a lease at inception. The Company has operating leases for corporate offices and certain information technology equipment which are included in operating lease right-of-use (ROU) assets and operating lease liabilities on the Company’s condensed consolidated statements of financial condition. ROU assets represent the right to use an underlying asset for the lease term and lease liabilities represent obligations to make lease payments arising from the lease. Operating lease ROU assets and lease liabilities are recognized at commencement date based on the net present value of lease payments over the life of the lease and thereafter, are remeasured if there is a change in lease terms. The majority of the Company’s lease agreements do not provide an implicit rate. As a result, the Company used its estimated incremental borrowing rate based on the information available as of lease commencement dates in determining the present value of lease payments. The operating lease ROU assets reflect any upfront lease payments made as well as lease incentives received. During the second quarter of 2023, the Company incurred costs related to the build-out of its future headquarters which qualified for reimbursement from the landlord. As a result, the Company remeasured its ROU asset and lease liability resulting in a $22.2 million reduction. The lease terms may include options to extend or terminate the lease and these are factored into the determination of the ROU asset and lease liability at lease inception when and if it is reasonably certain that the Company will exercise that option. Lease expense for fixed lease payments is recognized on a straight-line basis over the lease term. The Company has certain lease agreements with non-lease components such as maintenance and executory costs, which are accounted for separately and not included in ROU assets. ROU assets are tested for impairment whenever changes in facts or circumstances indicate that the carrying amount of an asset may not be recoverable. Modification of a lease term would result in remeasurement of the lease liability and a corresponding adjustment to the ROU asset.
|
| Redeemable Noncontrolling Interests |
Noncontrolling Interests—Noncontrolling interests consist of nonredeemable and redeemable third-party interests in the Company's consolidated investment vehicles. Noncontrolling interests that are not redeemable at the option of the investors are classified as nonredeemable noncontrolling interests and are included in stockholders’ equity. Noncontrolling interests that are redeemable at the option of the investors are classified as redeemable noncontrolling interests and are not treated as permanent equity. Noncontrolling interests are recorded at fair value which approximates the net asset value at each reporting period.
|
| Investment Advisory and Administration Fees |
Investment Advisory and Administration Fees—The Company earns revenue by providing asset management services to institutional accounts, open-end and closed-end funds as well as model-based portfolios. Investment advisory fees are earned pursuant to the terms of investment management agreements and are generally based on a contractual fee rate applied to the average assets under management. The Company also earns administration fees from certain open-end and closed-end funds pursuant to the terms of underlying administration contracts. Administration fees are based on the average daily assets under management of such funds. Investment advisory and administration fee revenue is recognized when earned and is recorded net of any fund reimbursements. The investment advisory and administration contracts each include a single performance obligation as the services provided are not separately identifiable and are accounted for as a series satisfied over time using a time-based method (days elapsed). Additionally, investment advisory and administration fees represent variable consideration, as fees are based on average assets under management which fluctuate daily. In certain instances, the Company may earn performance fees when specified performance hurdles are met during the performance period. Performance fees are forms of variable consideration and are not recognized until it becomes probable that there will not be a significant reversal of the cumulative revenue recognized.
|
| Distribution and Service Fee Revenue |
Distribution and Service Fee Revenue—Distribution and service fee revenue is based on the average daily net assets of certain share classes of open-end funds distributed by CSS. Distribution and service fee revenue is earned daily and is recorded gross of any third-party distribution and service fee expense for applicable share classes. Distribution fee agreements include a single performance obligation that is satisfied at a point in time when an investor purchases shares in an open-end fund. For all periods presented, a portion of the distribution fee revenue recognized in the period may relate to performance obligations satisfied (or partially satisfied) in prior periods. Service fee agreements include a single performance obligation as the services provided are not separately identifiable and are accounted for as a series satisfied over time using a time-based method (days elapsed). Additionally, distribution and service fees represent variable consideration, as fees are based on average assets under management which fluctuate daily.
|
| Distribution and Service Fee Expense |
Distribution and Service Fee Expense—Distribution and service fee expense includes distribution fees, shareholder servicing fees and intermediary assistance payments. Distribution fees represent payments made to qualified intermediaries for assistance in connection with the distribution of certain open-end funds' shares and for other expenses such as advertising, printing and distribution of prospectuses to investors. Such amounts may also be used to pay financial intermediaries for services as specified in the terms of written agreements complying with Rule 12b-1 of the Investment Company Act of 1940. Distribution fees are based on average daily net assets under management of certain share classes of certain of the funds. Shareholder servicing fees represent payments made to qualified intermediaries for shareholder account service and maintenance. These services are provided pursuant to written agreements with such qualified institutions. Shareholder servicing fees are generally based on average daily net assets under management. Intermediary assistance payments represent payments to qualified intermediaries for activities related to distribution, shareholder servicing as well as marketing and support of certain open-end funds and are incremental to those described above. Intermediary assistance payments are generally based on average daily net assets under management.
|
| Stock-based Compensation |
Stock-based Compensation—The Company recognizes compensation expense for the grant-date fair value of restricted stock unit awards to certain employees. This expense is recognized over the period during which employees are required to provide service. Forfeitures are recorded as incurred. Any change to the key terms of an employee’s award subsequent to the grant date is evaluated and, if necessary, accounted for as a modification. If the modification results in the remeasurement of the fair value of the award, the remeasured compensation cost is recognized over the remaining service period.
|
| Income Taxes |
Income Taxes—The Company records the current and deferred tax consequences of all transactions that have been recognized in the condensed consolidated financial statements in accordance with the provisions of the enacted tax laws. Deferred tax assets are recognized for temporary differences that will result in deductible amounts in future years at tax rates that are expected to apply in those years. Deferred tax liabilities are recognized for temporary differences that will result in taxable income in future years at tax rates that are expected to apply in those years. The Company records a valuation allowance, when necessary, to reduce deferred tax assets to an amount that more likely than not will be realized. The effective tax rate for interim periods is based on the Company's best estimate of the effective tax rate expected to be applied to the full fiscal year adjusted for discrete tax items during the period. The calculation of tax liabilities involves uncertainties in the application of complex tax laws and regulations across the Company's global operations. A tax benefit from an uncertain tax position is recognized when it is more likely than not that the position will be sustained upon examination, including resolution of any related appeals or litigation processes, on the basis of the technical merits. The Company records potential interest and penalties related to uncertain tax positions in the provision for income taxes in the condensed consolidated statements of operations.
|
| Comprehensive Income |
Comprehensive Income—The Company reports all changes in comprehensive income in the condensed consolidated statements of comprehensive income. Comprehensive income generally includes net income or loss attributable to common stockholders and amounts attributable to foreign currency translation gain (loss).
|
| Currency Translation and Transactions |
Currency Translation and Transactions—Assets and liabilities of subsidiaries having non-U.S. dollar functional currencies are translated at exchange rates at the applicable condensed consolidated statement of financial condition date. Revenue and expenses of such subsidiaries are translated at average exchange rates during the period. The gains or losses resulting from translating non-U.S. dollar functional currency into U.S. dollars are included in the Company's condensed consolidated statements of comprehensive income. The cumulative translation adjustment was $(8.5) million and $(10.8) million at June 30, 2023 and December 31, 2022, respectively, and was reported within accumulated other comprehensive income (loss) on the condensed consolidated statements of financial condition. Gains or losses resulting from transactions denominated in currencies other than the U.S. dollar within certain foreign subsidiaries and gains and losses arising on revaluation of U.S. dollar-denominated assets and liabilities held by certain foreign subsidiaries are included in foreign currency gain (loss)—net in the Company’s condensed consolidated statements of operations.
|
| Recently Issued Accounting Pronouncements |
Recently Issued Accounting Pronouncements—In June 2022, the Financial Accounting Standards Board issued Accounting Standards Update 2022-03 (ASU), Fair Value Measurement (Topic 820): Fair Value Measurement of Equity Securities Subject to Contractual Sale Restrictions. The standard clarifies that contractual sale restrictions are not considered in measuring the fair value of equity securities, which would be a change in practice for certain entities. The ASU also indicates that a contractual sale restriction is not a separate unit of account, and requires new disclosures for all entities with equity securities subject to a contractual sale restriction. This new guidance will be effective on January 1, 2024. The Company does not expect that the adoption of this new standard will have a material effect on the Company's condensed consolidated financial statements and related disclosures.
|
| X |
- DefinitionDistribution and Service Fee Expense [Policy Text Block]
| Name: |
cns_DistributionandServiceFeeExpensePolicyTextBlock |
| Namespace Prefix: |
cns_ |
| Data Type: |
dtr-types1:textBlockItemType |
| Balance Type: |
na |
| Period Type: |
duration |
|
| X |
- DefinitionDistribution and Service Fee Revenue [Policy Text Block]
| Name: |
cns_DistributionandServiceFeeRevenuePolicyTextBlock |
| Namespace Prefix: |
cns_ |
| Data Type: |
dtr-types1:textBlockItemType |
| Balance Type: |
na |
| Period Type: |
duration |
|
| X |
- References
+ Details
| Name: |
us-gaap_AccountingPoliciesAbstract |
| Namespace Prefix: |
us-gaap_ |
| Data Type: |
xbrli:stringItemType |
| Balance Type: |
na |
| Period Type: |
duration |
|
| X |
- DefinitionDisclosure of accounting policy for cash and cash equivalents, including the policy for determining which items are treated as cash equivalents. Other information that may be disclosed includes (1) the nature of any restrictions on the entity's use of its cash and cash equivalents, (2) whether the entity's cash and cash equivalents are insured or expose the entity to credit risk, (3) the classification of any negative balance accounts (overdrafts), and (4) the carrying basis of cash equivalents (for example, at cost) and whether the carrying amount of cash equivalents approximates fair value. Reference 1: http://fasb.org/us-gaap/role/ref/legacyRef
-Name Accounting Standards Codification
-Topic 230
-SubTopic 10
-Section 50
-Paragraph 1
-Publisher FASB
-URI https://asc.fasb.org//1943274/2147482913/230-10-50-1
| Name: |
us-gaap_CashAndCashEquivalentsPolicyTextBlock |
| Namespace Prefix: |
us-gaap_ |
| Data Type: |
dtr-types:textBlockItemType |
| Balance Type: |
na |
| Period Type: |
duration |
|
| X |
- DefinitionDisclosure of accounting policy for comprehensive income.
| Name: |
us-gaap_ComprehensiveIncomePolicyPolicyTextBlock |
| Namespace Prefix: |
us-gaap_ |
| Data Type: |
dtr-types:textBlockItemType |
| Balance Type: |
na |
| Period Type: |
duration |
|
| X |
- DefinitionDisclosure of accounting policy regarding (1) the principles it follows in consolidating or combining the separate financial statements, including the principles followed in determining the inclusion or exclusion of subsidiaries or other entities in the consolidated or combined financial statements and (2) its treatment of interests (for example, common stock, a partnership interest or other means of exerting influence) in other entities, for example consolidation or use of the equity or cost methods of accounting. The accounting policy may also address the accounting treatment for intercompany accounts and transactions, noncontrolling interest, and the income statement treatment in consolidation for issuances of stock by a subsidiary. Reference 1: http://www.xbrl.org/2003/role/exampleRef
-Topic 235
-SubTopic 10
-Name Accounting Standards Codification
-Section 50
-Paragraph 4
-Subparagraph (a)
-Publisher FASB
-URI https://asc.fasb.org//1943274/2147483426/235-10-50-4
Reference 2: http://fasb.org/us-gaap/role/ref/legacyRef
-Name Accounting Standards Codification
-Topic 810
-SubTopic 10
-Section 50
-Paragraph 1
-Publisher FASB
-URI https://asc.fasb.org//1943274/2147481203/810-10-50-1
| Name: |
us-gaap_ConsolidationPolicyTextBlock |
| Namespace Prefix: |
us-gaap_ |
| Data Type: |
dtr-types:textBlockItemType |
| Balance Type: |
na |
| Period Type: |
duration |
|
| X |
- DefinitionDisclosure of accounting policy for (1) transactions denominated in a currency other than the reporting enterprise's functional currency, (2) translating foreign currency financial statements that are incorporated into the financial statements of the reporting enterprise by consolidation, combination, or the equity method of accounting, and (3) remeasurement of the financial statements of a foreign reporting enterprise in a hyperinflationary economy. Reference 1: http://www.xbrl.org/2003/role/disclosureRef
-Topic 830
-Name Accounting Standards Codification
-Publisher FASB
-URI https://asc.fasb.org//830/tableOfContent
| Name: |
us-gaap_ForeignCurrencyTransactionsAndTranslationsPolicyTextBlock |
| Namespace Prefix: |
us-gaap_ |
| Data Type: |
dtr-types:textBlockItemType |
| Balance Type: |
na |
| Period Type: |
duration |
|
| X |
- DefinitionDisclosure of accounting policy for income taxes, which may include its accounting policies for recognizing and measuring deferred tax assets and liabilities and related valuation allowances, recognizing investment tax credits, operating loss carryforwards, tax credit carryforwards, and other carryforwards, methodologies for determining its effective income tax rate and the characterization of interest and penalties in the financial statements. Reference 1: http://www.xbrl.org/2003/role/disclosureRef
-Topic 946
-SubTopic 10
-Name Accounting Standards Codification
-Section S99
-Paragraph 3
-Subparagraph (SX 210.6-03(h)(1))
-Publisher FASB
-URI https://asc.fasb.org//1943274/2147479886/946-10-S99-3
Reference 2: http://www.xbrl.org/2003/role/disclosureRef
-Topic 740
-SubTopic 10
-Name Accounting Standards Codification
-Section 50
-Paragraph 17
-Subparagraph (b)
-Publisher FASB
-URI https://asc.fasb.org//1943274/2147482685/740-10-50-17
Reference 3: http://www.xbrl.org/2003/role/disclosureRef
-Topic 740
-SubTopic 10
-Name Accounting Standards Codification
-Section 50
-Paragraph 9
-Publisher FASB
-URI https://asc.fasb.org//1943274/2147482685/740-10-50-9
Reference 4: http://www.xbrl.org/2003/role/disclosureRef
-Topic 740
-SubTopic 10
-Name Accounting Standards Codification
-Section 45
-Paragraph 25
-Publisher FASB
-URI https://asc.fasb.org//1943274/2147482525/740-10-45-25
Reference 5: http://www.xbrl.org/2003/role/disclosureRef
-Topic 740
-SubTopic 10
-Name Accounting Standards Codification
-Section 45
-Paragraph 28
-Publisher FASB
-URI https://asc.fasb.org//1943274/2147482525/740-10-45-28
Reference 6: http://www.xbrl.org/2003/role/disclosureRef
-Topic 740
-SubTopic 10
-Name Accounting Standards Codification
-Section 50
-Paragraph 19
-Publisher FASB
-URI https://asc.fasb.org//1943274/2147482685/740-10-50-19
Reference 7: http://www.xbrl.org/2003/role/disclosureRef
-Topic 220
-SubTopic 10
-Name Accounting Standards Codification
-Section 50
-Paragraph 1
-Publisher FASB
-URI https://asc.fasb.org//1943274/2147482765/220-10-50-1
Reference 8: http://www.xbrl.org/2003/role/disclosureRef
-Topic 740
-SubTopic 10
-Name Accounting Standards Codification
-Section 50
-Paragraph 20
-Publisher FASB
-URI https://asc.fasb.org//1943274/2147482685/740-10-50-20
| Name: |
us-gaap_IncomeTaxPolicyTextBlock |
| Namespace Prefix: |
us-gaap_ |
| Data Type: |
dtr-types:textBlockItemType |
| Balance Type: |
na |
| Period Type: |
duration |
|
| X |
- DefinitionDisclosure of accounting policy for recognition of revenues and expenses including commissions, underwriting, management and investment advisory fees, trading gains and losses, interest income and expense, dividend income and expense, floor brokerage, and exchange fees. Also, may include the broker-dealers' disclosure on the nature of operations and estimates used in preparation of financial statements and significant estimates. Reference 1: http://fasb.org/us-gaap/role/ref/legacyRef
-Name Accounting Standards Codification
-Section 05
-Paragraph 1
-SubTopic 10
-Topic 940
-Publisher FASB
-URI https://asc.fasb.org//1943274/2147481645/940-10-05-1
| Name: |
us-gaap_IndustrySpecificPoliciesBrokerDealerTextBlock |
| Namespace Prefix: |
us-gaap_ |
| Data Type: |
dtr-types:textBlockItemType |
| Balance Type: |
na |
| Period Type: |
duration |
|
| X |
- DefinitionDisclosure of accounting policy for investment in financial asset. Reference 1: http://www.xbrl.org/2003/role/disclosureRef
-Topic 944
-SubTopic 220
-Name Accounting Standards Codification
-Section S99
-Paragraph 1
-Subparagraph (SX 210.7-04(3)(b))
-Publisher FASB
-URI https://asc.fasb.org//1943274/2147483586/944-220-S99-1
Reference 2: http://www.xbrl.org/2003/role/disclosureRef
-Topic 946
-SubTopic 10
-Name Accounting Standards Codification
-Section S99
-Paragraph 3
-Subparagraph (SX 210.6-03(d))
-Publisher FASB
-URI https://asc.fasb.org//1943274/2147479886/946-10-S99-3
Reference 3: http://www.xbrl.org/2003/role/disclosureRef
-Topic 946
-SubTopic 10
-Name Accounting Standards Codification
-Section S99
-Paragraph 3
-Subparagraph (SX 210.6-03(f)(1))
-Publisher FASB
-URI https://asc.fasb.org//1943274/2147479886/946-10-S99-3
Reference 4: http://www.xbrl.org/2003/role/disclosureRef
-Topic 946
-SubTopic 10
-Name Accounting Standards Codification
-Section S99
-Paragraph 3
-Subparagraph (SX 210.6-03(f)(2))
-Publisher FASB
-URI https://asc.fasb.org//1943274/2147479886/946-10-S99-3
Reference 5: http://www.xbrl.org/2003/role/disclosureRef
-Topic 946
-SubTopic 10
-Name Accounting Standards Codification
-Section S99
-Paragraph 3
-Subparagraph (SX 210.6-03(f)(3))
-Publisher FASB
-URI https://asc.fasb.org//1943274/2147479886/946-10-S99-3
Reference 6: http://www.xbrl.org/2003/role/disclosureRef
-Topic 946
-SubTopic 320
-Name Accounting Standards Codification
-Section S99
-Paragraph 12
-Subparagraph (i)
-Publisher FASB
-URI https://asc.fasb.org//1943274/2147480032/946-320-S99-12
Reference 7: http://www.xbrl.org/2003/role/disclosureRef
-Topic 946
-SubTopic 320
-Name Accounting Standards Codification
-Section S99
-Paragraph 19
-Subparagraph (2)
-Publisher FASB
-URI https://asc.fasb.org//1943274/2147480032/946-320-S99-19
| Name: |
us-gaap_InvestmentPolicyTextBlock |
| Namespace Prefix: |
us-gaap_ |
| Data Type: |
dtr-types:textBlockItemType |
| Balance Type: |
na |
| Period Type: |
duration |
|
| X |
- DefinitionDisclosure of accounting policy for leasing arrangement entered into by lessee. Reference 1: http://www.xbrl.org/2003/role/disclosureRef
-Topic 842
-SubTopic 20
-Name Accounting Standards Codification
-Section 50
-Paragraph 1
-Subparagraph (b)
-Publisher FASB
-URI https://asc.fasb.org//1943274/2147478964/842-20-50-1
| Name: |
us-gaap_LesseeLeasesPolicyTextBlock |
| Namespace Prefix: |
us-gaap_ |
| Data Type: |
dtr-types:textBlockItemType |
| Balance Type: |
na |
| Period Type: |
duration |
|
| X |
- DefinitionDisclosure of accounting policy for the recognition of fees for investment advise, research, administrative and investment account management services provided to customers by broker dealers. This fee is generally based on the net assets of the fund or the account.
| Name: |
us-gaap_ManagementAndInvestmentAdvisoryFeesPolicy |
| Namespace Prefix: |
us-gaap_ |
| Data Type: |
dtr-types:textBlockItemType |
| Balance Type: |
na |
| Period Type: |
duration |
|
| X |
- DefinitionDisclosure of accounting policy pertaining to new accounting pronouncements that may impact the entity's financial reporting. Includes, but is not limited to, quantification of the expected or actual impact.
| Name: |
us-gaap_NewAccountingPronouncementsPolicyPolicyTextBlock |
| Namespace Prefix: |
us-gaap_ |
| Data Type: |
dtr-types:textBlockItemType |
| Balance Type: |
na |
| Period Type: |
duration |
|
| X |
- DefinitionDisclosure of accounting policy for award under share-based payment arrangement. Includes, but is not limited to, methodology and assumption used in measuring cost. Reference 1: http://www.xbrl.org/2003/role/disclosureRef
-Topic 718
-SubTopic 10
-Name Accounting Standards Codification
-Section 50
-Paragraph 2
-Subparagraph (f)(2)(i)
-Publisher FASB
-URI https://asc.fasb.org//1943274/2147480429/718-10-50-2
Reference 2: http://www.xbrl.org/2003/role/disclosureRef
-Topic 718
-SubTopic 10
-Name Accounting Standards Codification
-Section 50
-Paragraph 2
-Subparagraph (f)(2)(ii)
-Publisher FASB
-URI https://asc.fasb.org//1943274/2147480429/718-10-50-2
Reference 3: http://www.xbrl.org/2003/role/disclosureRef
-Topic 718
-SubTopic 10
-Name Accounting Standards Codification
-Section 50
-Paragraph 2
-Subparagraph (f)(2)(v)
-Publisher FASB
-URI https://asc.fasb.org//1943274/2147480429/718-10-50-2
Reference 4: http://www.xbrl.org/2003/role/disclosureRef
-Topic 718
-SubTopic 10
-Name Accounting Standards Codification
-Section S99
-Paragraph 1
-Subparagraph (SAB Topic 14.C.Q3)
-Publisher FASB
-URI https://asc.fasb.org//1943274/2147479830/718-10-S99-1
Reference 5: http://www.xbrl.org/2003/role/disclosureRef
-Topic 718
-SubTopic 10
-Name Accounting Standards Codification
-Section S99
-Paragraph 1
-Subparagraph (SAB Topic 14.D.1.Q5)
-Publisher FASB
-URI https://asc.fasb.org//1943274/2147479830/718-10-S99-1
Reference 6: http://www.xbrl.org/2003/role/disclosureRef
-Topic 718
-SubTopic 10
-Name Accounting Standards Codification
-Section S99
-Paragraph 1
-Subparagraph (SAB Topic 14.D.3.Q2)
-Publisher FASB
-URI https://asc.fasb.org//1943274/2147479830/718-10-S99-1
Reference 7: http://www.xbrl.org/2003/role/disclosureRef
-Topic 718
-SubTopic 10
-Name Accounting Standards Codification
-Section S99
-Paragraph 1
-Subparagraph (SAB Topic 14.D.2.Q6)
-Publisher FASB
-URI https://asc.fasb.org//1943274/2147479830/718-10-S99-1
Reference 8: http://www.xbrl.org/2003/role/disclosureRef
-Topic 718
-Name Accounting Standards Codification
-Publisher FASB
-URI https://asc.fasb.org//718/tableOfContent
Reference 9: http://www.xbrl.org/2003/role/disclosureRef
-Topic 718
-SubTopic 10
-Name Accounting Standards Codification
-Section 50
-Paragraph 2
-Subparagraph (b)
-Publisher FASB
-URI https://asc.fasb.org//1943274/2147480429/718-10-50-2
Reference 10: http://www.xbrl.org/2003/role/disclosureRef
-Topic 718
-SubTopic 10
-Name Accounting Standards Codification
-Section 50
-Paragraph 2
-Subparagraph (f)(1)
-Publisher FASB
-URI https://asc.fasb.org//1943274/2147480429/718-10-50-2
Reference 11: http://www.xbrl.org/2003/role/disclosureRef
-Topic 718
-SubTopic 10
-Name Accounting Standards Codification
-Section 50
-Paragraph 2
-Subparagraph (f)(2)
-Publisher FASB
-URI https://asc.fasb.org//1943274/2147480429/718-10-50-2
| Name: |
us-gaap_ShareBasedCompensationOptionAndIncentivePlansPolicy |
| Namespace Prefix: |
us-gaap_ |
| Data Type: |
dtr-types:textBlockItemType |
| Balance Type: |
na |
| Period Type: |
duration |
|
| X |
- DefinitionDisclosure of accounting policy for redeemable preferred stock issued. This disclosure may include the accounting treatment for the difference, if there is any, between the carrying value and redemption amount. For example, describe whether the issuer accretes changes in the redemption value. Reference 1: http://fasb.org/us-gaap/role/ref/legacyRef
-Topic 210
-SubTopic 10
-Name Accounting Standards Codification
-Section S99
-Paragraph 1
-Subparagraph (SX 210.5-02(27)(c))
-Publisher FASB
-URI https://asc.fasb.org//1943274/2147480566/210-10-S99-1
Reference 2: http://fasb.org/us-gaap/role/ref/legacyRef
-Topic 210
-SubTopic 10
-Name Accounting Standards Codification
-Section S99
-Paragraph 1
-Subparagraph (SX 210.5-02(27)(b))
-Publisher FASB
-URI https://asc.fasb.org//1943274/2147480566/210-10-S99-1
Reference 3: http://fasb.org/us-gaap/role/ref/legacyRef
-Name Accounting Standards Codification
-Section 05
-Paragraph 1
-SubTopic 10
-Topic 505
-Publisher FASB
-URI https://asc.fasb.org//1943274/2147481288/505-10-05-1
| Name: |
us-gaap_StockholdersEquityNoteRedeemablePreferredStockIssuePolicy |
| Namespace Prefix: |
us-gaap_ |
| Data Type: |
dtr-types:textBlockItemType |
| Balance Type: |
na |
| Period Type: |
duration |
|
| X |
- DefinitionDisclosure of accounting policy for the use of estimates in the preparation of financial statements in conformity with generally accepted accounting principles. Reference 1: http://fasb.org/us-gaap/role/ref/legacyRef
-Name Accounting Standards Codification
-Topic 275
-SubTopic 10
-Section 50
-Paragraph 9
-Publisher FASB
-URI https://asc.fasb.org//1943274/2147482861/275-10-50-9
Reference 2: http://fasb.org/us-gaap/role/ref/legacyRef
-Name Accounting Standards Codification
-Topic 275
-SubTopic 10
-Section 50
-Paragraph 4
-Publisher FASB
-URI https://asc.fasb.org//1943274/2147482861/275-10-50-4
Reference 3: http://www.xbrl.org/2003/role/disclosureRef
-Name Accounting Standards Codification
-Section 50
-Paragraph 1
-Subparagraph (b)
-SubTopic 10
-Topic 275
-Publisher FASB
-URI https://asc.fasb.org//1943274/2147482861/275-10-50-1
Reference 4: http://www.xbrl.org/2003/role/disclosureRef
-Name Accounting Standards Codification
-Section 50
-Paragraph 1
-Subparagraph (c)
-SubTopic 10
-Topic 275
-Publisher FASB
-URI https://asc.fasb.org//1943274/2147482861/275-10-50-1
Reference 5: http://www.xbrl.org/2003/role/disclosureRef
-Name Accounting Standards Codification
-Section 50
-Paragraph 11
-SubTopic 10
-Topic 275
-Publisher FASB
-URI https://asc.fasb.org//1943274/2147482861/275-10-50-11
Reference 6: http://www.xbrl.org/2003/role/disclosureRef
-Name Accounting Standards Codification
-Section 50
-Paragraph 12
-SubTopic 10
-Topic 275
-Publisher FASB
-URI https://asc.fasb.org//1943274/2147482861/275-10-50-12
Reference 7: http://fasb.org/us-gaap/role/ref/legacyRef
-Name Accounting Standards Codification
-Topic 275
-SubTopic 10
-Section 50
-Paragraph 8
-Publisher FASB
-URI https://asc.fasb.org//1943274/2147482861/275-10-50-8
| Name: |
us-gaap_UseOfEstimates |
| Namespace Prefix: |
us-gaap_ |
| Data Type: |
dtr-types:textBlockItemType |
| Balance Type: |
na |
| Period Type: |
duration |
|
v3.23.2
Revenue (Tables)
|
6 Months Ended |
Jun. 30, 2023 |
|---|
| Revenue from Contract with Customer [Abstract] |
|
| Disaggregation of Revenue |
The following tables summarize revenue recognized from contracts with customers by client domicile and by investment vehicle: | | | | | | | | | | | | | | | | | | | | | | | | | Three Months Ended
June 30, | | Six Months Ended
June 30, | | (in thousands) | 2023 | | 2022 | | 2023 | | 2022 | | Client domicile: | | | | | | | | | North America | $ | 104,686 | | | $ | 129,428 | | | $ | 214,456 | | | $ | 264,628 | | | Japan | 8,014 | | | 9,263 | | | 16,133 | | | 18,786 | | | Europe, Middle East and Africa | 4,654 | | | 5,405 | | | 9,541 | | | 11,358 | | | Asia Pacific excluding Japan | 3,276 | | | 3,335 | | | 6,582 | | | 6,848 | | | Total | $ | 120,630 | | | $ | 147,431 | | | $ | 246,712 | | | $ | 301,620 | | | | | | | | | | | | | | | | | | | | | | | | | | | | | | | | | | | | | | | | | | | | | | | | | | | | | | | | | | | | | | | | | | | | | | | | | | | | | | | | | | | | | | | | | | | | | | | | | |
| | | | | | | | | | | | | | | | | | | | | | | | | Three Months Ended
June 30, | | Six Months Ended
June 30, | | (in thousands) | 2023 | | 2022 | | 2023 | | 2022 | | Investment vehicle: | | | | | | | | | Open-end funds | $ | 66,574 | | | $ | 85,561 | | | $ | 137,142 | | | $ | 175,746 | | | Institutional accounts | 30,166 | | | 34,429 | | | 60,795 | | | 71,112 | | | Closed-end funds | 23,890 | | | 27,441 | | | 48,775 | | | 54,762 | | | | | | | | | | | Total | $ | 120,630 | | | $ | 147,431 | | | $ | 246,712 | | | $ | 301,620 | |
|
| X |
- DefinitionTabular disclosure of disaggregation of revenue into categories depicting how nature, amount, timing, and uncertainty of revenue and cash flows are affected by economic factor. Reference 1: http://www.xbrl.org/2009/role/commonPracticeRef
-Topic 606
-SubTopic 10
-Name Accounting Standards Codification
-Section 50
-Paragraph 5
-Publisher FASB
-URI https://asc.fasb.org//1943274/2147479806/606-10-50-5
| Name: |
us-gaap_DisaggregationOfRevenueTableTextBlock |
| Namespace Prefix: |
us-gaap_ |
| Data Type: |
dtr-types:textBlockItemType |
| Balance Type: |
na |
| Period Type: |
duration |
|
| X |
- References
+ Details
| Name: |
us-gaap_RevenueFromContractWithCustomerAbstract |
| Namespace Prefix: |
us-gaap_ |
| Data Type: |
xbrli:stringItemType |
| Balance Type: |
na |
| Period Type: |
duration |
|
v3.23.2
Investments (Tables)
|
6 Months Ended |
Jun. 30, 2023 |
|---|
| Investments [Abstract] |
|
| Summary Investment Holdings |
The following table summarizes the Company's investments:
| | | | | | | | | | | | | (in thousands) | June 30,
2023 | | December 31, 2022 | | Equity investments at fair value | $ | 161,051 | | | $ | 157,646 | | | Trading | 27,155 | | | 15,289 | | | Equity method | 21 | | | 20 | | | Total investments | $ | 188,227 | | | $ | 172,955 | |
|
| Gain (Loss) on Investments |
The following table summarizes gain (loss) from investments—net, including derivative financial instruments, the majority of which are used to economically hedge certain exposures (see Note 6, Derivatives):
| | | | | | | | | | | | | | | | | | | | | | | | | | Three Months Ended
June 30, | | Six Months Ended
June 30, | | (in thousands) | 2023 | | 2022 | | 2023 | | 2022 | Net realized gains (losses) during the period | $ | (761) | | | $ | 2,664 | | | $ | (3,091) | | | $ | 10,845 | | Net unrealized gains (losses) during the period on investments still held at the end of the period | 1,117 | | | (31,237) | | | 3,139 | | | (35,851) | | Gain (loss) from investments—net (1) | $ | 356 | | | $ | (28,573) | | | $ | 48 | | | $ | (25,006) | |
________________________(1)Included gain (loss) attributable to noncontrolling interests.
|
| Schedule of Variable Interest Entities |
The following tables summarize the statements of financial condition attributable to the Company's consolidated VIEs:
| | | | | | | | | | | | | | | | | | | | | | | | | | | | | | | | | June 30, 2023 | | (in thousands) | SICAV GLI | | SICAV GRE | | | | GRP-CIP | | REOF | | Total | Assets (1) | | | | | | | | | | | | Investments | $ | 37,011 | | | $ | 79,033 | | | | | $ | 151 | | | $ | 23,002 | | | $ | 139,197 | | Due from brokers | 233 | | | 609 | | | | | 25 | | | — | | | 867 | | Other assets | 190 | | | 357 | | | | | — | | | 1 | | | 548 | | | Total assets | 37,434 | | | 79,999 | | | | | 176 | | | 23,003 | | | 140,612 | | | | | | | | | | | | | | Liabilities (1) | | | | | | | | | | | | Due to brokers | $ | 272 | | | $ | 358 | | | | | $ | — | | | $ | — | | | $ | 630 | | | Other liabilities and accrued expenses | 70 | | | 140 | | | | | 5 | | | 411 | | | 626 | | | Total liabilities | 342 | | | 498 | | | | | 5 | | | 411 | | | 1,256 | | | | | | | | | | | | | | | Net assets | $ | 37,092 | | | $ | 79,501 | | | | | $ | 171 | | | $ | 22,592 | | | $ | 139,356 | | | | | | | | | | | | | | | Attributable to the Company | $ | 19,232 | | | $ | 11,843 | | | | | $ | 171 | | | $ | 17,355 | | | $ | 48,601 | | | Attributable to noncontrolling interests | 17,860 | | | 67,658 | | | | | — | | | 5,237 | | | 90,755 | | | Net assets | $ | 37,092 | | | $ | 79,501 | | | | | $ | 171 | | | $ | 22,592 | | | $ | 139,356 | |
_________________________ (1) The assets may only be used to settle obligations of each VIE and the liabilities are the sole obligation of each VIE, for which creditors do not have recourse to the general credit of the Company. | | | | | | | | | | | | | | | | | | | | | | | | | | | | | | | | | December 31, 2022 | | (in thousands) | SICAV GLI | | SICAV GRE | | | | GRP-CIP | | REOF | | Total | Assets (1) | | | | | | | | | | | | Investments | $ | 36,296 | | | $ | 79,434 | | | | | $ | 147 | | | $ | 19,052 | | | $ | 134,929 | | Due from brokers | 11 | | | — | | | | | 27 | | | — | | | 38 | | Other assets | 151 | | | 370 | | | | | — | | | 55 | | | 576 | | | Total assets | 36,458 | | | 79,804 | | | | | 174 | | | 19,107 | | | 135,543 | | | | | | | | | | | | | | Liabilities (1) | | | | | | | | | | | | Due to brokers | $ | 11 | | | $ | — | | | | | $ | — | | | $ | — | | | $ | 11 | | | Other liabilities and accrued expenses | 91 | | | 214 | | | | | 5 | | | 354 | | | 664 | | | Total liabilities | 102 | | | 214 | | | | | 5 | | | 354 | | | 675 | | | | | | | | | | | | | | | Net assets | $ | 36,356 | | | $ | 79,590 | | | | | $ | 169 | | | $ | 18,753 | | | $ | 134,868 | | | | | | | | | | | | | | | Attributable to the Company | $ | 19,116 | | | $ | 11,495 | | | | | $ | 169 | | | $ | 14,699 | | | $ | 45,479 | | | Attributable to noncontrolling interests | 17,240 | | | 68,095 | | | | | — | | | 4,054 | | | 89,389 | | | Net assets | $ | 36,356 | | | $ | 79,590 | | | | | $ | 169 | | | $ | 18,753 | | | $ | 134,868 | |
_________________________ (1) The assets may only be used to settle obligations of each VIE and the liabilities are the sole obligation of each VIE, for which creditors do not have recourse to the general credit of the Company.
|
| X |
- DefinitionTabular disclosure of realized and unrealized gain (loss) on investment in security. Reference 1: http://www.xbrl.org/2009/role/commonPracticeRef
-Topic 220
-SubTopic 10
-Name Accounting Standards Codification
-Section S99
-Paragraph 2
-Subparagraph (SX 210.5-03(7)(c))
-Publisher FASB
-URI https://asc.fasb.org//1943274/2147483621/220-10-S99-2
Reference 2: http://www.xbrl.org/2009/role/commonPracticeRef
-Topic 220
-SubTopic 10
-Name Accounting Standards Codification
-Section S99
-Paragraph 2
-Subparagraph (SX 210.5-03(9)(a))
-Publisher FASB
-URI https://asc.fasb.org//1943274/2147483621/220-10-S99-2
| Name: |
us-gaap_GainLossOnInvestmentsTextBlock |
| Namespace Prefix: |
us-gaap_ |
| Data Type: |
dtr-types:textBlockItemType |
| Balance Type: |
na |
| Period Type: |
duration |
|
| X |
- References
+ Details
| Name: |
us-gaap_InvestmentsAbstract |
| Namespace Prefix: |
us-gaap_ |
| Data Type: |
xbrli:stringItemType |
| Balance Type: |
na |
| Period Type: |
duration |
|
| X |
- DefinitionTabular disclosure of the significant judgments and assumptions made in determining whether a variable interest (as defined) held by the entity requires the variable interest entity (VIE) (as defined) to be consolidated and (or) disclose information about its involvement with the VIE, individually or in aggregate (as applicable); the nature of restrictions, if any, on the consolidated VIE's assets and on the settlement of its liabilities reported by an entity in its statement of financial position, including the carrying amounts of such assets and liabilities; the nature of, and changes in, the risks associated with involvement in the VIE; how involvement with the VIE affects the entity's financial position, financial performance, and cash flows; the lack of recourse if creditors (or beneficial interest holders) of the consolidated VIE have no recourse to the general credit of the primary beneficiary (if applicable); the terms of arrangements, giving consideration to both explicit arrangements and implicit variable interests, if any, that could require the entity to provide financial support to the VIE, including events or circumstances that could expose the entity to a loss; the methodology used by the entity for determining whether or not it is the primary beneficiary of the variable interest entity; the significant factors considered and judgments made in determining that the power to direct the activities of a VIE that most significantly impact the VIE's economic performance are shared (as defined); the carrying amounts and classification of assets and liabilities of the VIE included in the statement of financial position; the entity's maximum exposure to loss, if any, as a result of its involvement with the VIE, including how the maximum exposure is determined and significant sources of the entity's exposure to the VIE; a comparison of the carrying amounts of the assets and liabilities and the entity's maximum exposure to loss; information about any liquidity arrangements, guarantees, and (or) other commitments by third parties that may affect the fair value or risk of the entity's variable interest in the VIE; whether or not the entity has provided financial support or other support (explicitly or implicitly) to the VIE that it was not previously contractually required to provide or whether the entity intends to provide that support, including the type and amount of the support and the primary reasons for providing the support; and supplemental information the entity determines necessary to provide. Reference 1: http://fasb.org/us-gaap/role/ref/legacyRef
-Name Accounting Standards Codification
-Topic 810
-SubTopic 10
-Section 50
-Paragraph 3
-Publisher FASB
-URI https://asc.fasb.org//1943274/2147481203/810-10-50-3
Reference 2: http://fasb.org/us-gaap/role/ref/legacyRef
-Name Accounting Standards Codification
-Topic 810
-SubTopic 10
-Section 50
-Paragraph 5A
-Publisher FASB
-URI https://asc.fasb.org//1943274/2147481203/810-10-50-5A
Reference 3: http://fasb.org/us-gaap/role/ref/legacyRef
-Name Accounting Standards Codification
-Topic 810
-SubTopic 10
-Section 50
-Paragraph 9
-Publisher FASB
-URI https://asc.fasb.org//1943274/2147481203/810-10-50-9
Reference 4: http://fasb.org/us-gaap/role/ref/legacyRef
-Name Accounting Standards Codification
-Topic 810
-SubTopic 10
-Section 50
-Paragraph 4
-Publisher FASB
-URI https://asc.fasb.org//1943274/2147481203/810-10-50-4
Reference 5: http://fasb.org/us-gaap/role/ref/legacyRef
-Name Accounting Standards Codification
-Topic 810
-SubTopic 10
-Section 50
-Paragraph 6
-Publisher FASB
-URI https://asc.fasb.org//1943274/2147481203/810-10-50-6
| Name: |
us-gaap_ScheduleOfVariableInterestEntitiesTextBlock |
| Namespace Prefix: |
us-gaap_ |
| Data Type: |
dtr-types:textBlockItemType |
| Balance Type: |
na |
| Period Type: |
duration |
|
| X |
- DefinitionTabular disclosure of the summary of investment holdings.
| Name: |
us-gaap_SummaryInvestmentHoldingsTextBlock |
| Namespace Prefix: |
us-gaap_ |
| Data Type: |
dtr-types:textBlockItemType |
| Balance Type: |
na |
| Period Type: |
duration |
|
v3.23.2
Fair Value (Tables)
|
6 Months Ended |
Jun. 30, 2023 |
|---|
| Fair Value Disclosures [Abstract] |
|
| Fair Value Measurements, Recurring and Nonrecurring |
The following tables present fair value measurements: | | | | | | | | | | | | | | | | | | | | | | | | | | | | | | | | | June 30, 2023 | | (in thousands) | Level 1 | | Level 2 | | Level 3 | | Investments Measured at NAV (1) | | | | Total | | Cash equivalents | $ | 133,860 | | | $ | — | | | $ | — | | | $ | — | | | | | $ | 133,860 | | | Equity investments at fair value: | | | | | | | | | | | | | Common stocks | $ | 143,489 | | | $ | — | | | $ | — | | | $ | — | | | | | $ | 143,489 | | | Limited partnership interests | — | | | — | | | 13,986 | | | 1,397 | | | | | 15,383 | | | Master limited partnership interests | 321 | | | — | | | — | | | — | | | | | 321 | | | Preferred securities | 1,415 | | | 108 | | | — | | | — | | | | | 1,523 | | | Other | 215 | | | — | | | — | | | 120 | | | | | 335 | | | Total | $ | 145,440 | | | $ | 108 | | | $ | 13,986 | | | $ | 1,517 | | | | | $ | 161,051 | | | Trading investments: | | | | | | | | | | | | | Fixed income | $ | — | | | $ | 27,155 | | | $ | — | | | $ | — | | | | | $ | 27,155 | | | | | | | | | | | | | | | Equity method investments | $ | — | | | $ | — | | | $ | — | | | $ | 21 | | | | | $ | 21 | | | | | | | | | | | | | | | Total investments | $ | 145,440 | | | $ | 27,263 | | | $ | 13,986 | | | $ | 1,538 | | | | | $ | 188,227 | | | | | | | | | | | | | | | Derivatives - assets: | | | | | | | | | | | | | Total return swaps | $ | — | | | $ | 374 | | | $ | — | | | $ | — | | | | | $ | 374 | | | Forward contracts - foreign exchange | — | | | 476 | | | — | | | — | | | | | 476 | | | Total | $ | — | | | $ | 850 | | | $ | — | | | $ | — | | | | | $ | 850 | | | Derivatives - liabilities: | | | | | | | | | | | | | Total return swaps | $ | — | | | $ | 249 | | | $ | — | | | $ | — | | | | | $ | 249 | | | | | | | | | | | | | | | Forward contracts - foreign exchange | — | | | 18 | | | — | | | — | | | | | 18 | | | Total | $ | — | | | $ | 267 | | | $ | — | | | $ | — | | | | | $ | 267 | |
________________________ (1) Comprised of certain investments measured at fair value using net asset value (NAV) as a practical expedient. | | | | | | | | | | | | | | | | | | | | | | | | | | | | | | | December 31, 2022 | | (in thousands) | Level 1 | | Level 2 | | Level 3 | | Investments Measured at NAV (1) | | Total | | Cash equivalents | $ | 208,557 | | | $ | — | | | $ | — | | | $ | — | | | $ | 208,557 | | | Equity investments at fair value: | | | | | | | | | | | Common stocks | $ | 142,268 | | | $ | 987 | | | $ | — | | | $ | — | | | $ | 143,255 | | | Limited partnership interests | — | | | — | | | 10,759 | | | 1,544 | | | 12,303 | | | Master limited partnership interests | 316 | | | — | | | — | | | — | | | 316 | | | Preferred securities | 1,391 | | | 49 | | | — | | | — | | | 1,440 | | | Other | 200 | | | — | | | — | | | 132 | | | 332 | | | Total | $ | 144,175 | | | $ | 1,036 | | | $ | 10,759 | | | $ | 1,676 | | | $ | 157,646 | | | Trading investments: | | | | | | | | | | | Fixed income | $ | — | | | $ | 15,289 | | | $ | — | | | $ | — | | | $ | 15,289 | | | Equity method investments | $ | — | | | $ | — | | | $ | — | | | $ | 20 | | | $ | 20 | | | | | | | | | | | | | Total investments | $ | 144,175 | | | $ | 16,325 | | | $ | 10,759 | | | $ | 1,696 | | | $ | 172,955 | | | | | | | | | | | | | Derivatives - assets: | | | | | | | | | | | Total return swaps | $ | — | | | $ | 276 | | | $ | — | | | $ | — | | | $ | 276 | | | | | | | | | | | | | Total | $ | — | | | $ | 276 | | | $ | — | | | $ | — | | | $ | 276 | | | Derivatives - liabilities: | | | | | | | | | | | Total return swaps | $ | — | | | $ | 717 | | | $ | — | | | $ | — | | | $ | 717 | | | | | | | | | | | | | Forward contracts - foreign exchange | — | | | 742 | | | — | | | — | | | 742 | | | Total | $ | — | | | $ | 1,459 | | | $ | — | | | $ | — | | | $ | 1,459 | |
________________________ (1) Comprised of certain investments measured at fair value using NAV as a practical expedient.
|
| Fair Value, Assets Measured on Recurring Basis, Unobservable Input Reconciliation |
The following table summarizes the changes in Level 3 investments measured at fair value on a recurring basis:
| | | | | | | | | | | | | | | | | | | | | | | | | Three Months Ended
June 30, | | Six Months Ended
June 30, | | (in thousands) | 2023 | | 2022 | | 2023 | | 2022 | | Balance at beginning of period | $ | 13,633 | | | $ | 17,753 | | | $ | 10,759 | | | $ | — | | | Purchases/contributions | 4,625 | | | — | | | 7,517 | | | 19,380 | | | Sales/distributions | (2,975) | | | — | | | (2,975) | | | — | | | | | | | | | | | Unrealized gains (losses) | (1,297) | | | 839 | | | (1,315) | | | (788) | | | | | | | | | | | Balance at end of period | $ | 13,986 | | | $ | 18,592 | | | $ | 13,986 | | | $ | 18,592 | |
|
| Fair Value Measurement Inputs and Valuation Techniques |
The following table summarizes the valuation techniques and significant unobservable inputs approved by the Valuation Committee for Level 3 investments measured at fair value on a recurring basis: | | | | | | | | | | | | | | | | | | | | | | | | | | | | | Fair Value as of June 30, 2023 (in thousands) | | Valuation Technique | | Unobservable Inputs | | Value | Limited partnership interest | | $ | 13,986 | | | Discounted cash flow | | Discount rate
Terminal capitalization rate | | 8.75% 7.25% | | | | | Transaction price | | n/a | | |
| | | | | | | | | | | | | | | | | | | | | | | | | | | | | Fair Value as of December 31, 2022 (in thousands) | | Valuation Technique | | Unobservable Inputs | | Value | Limited partnership interest | | $ | 10,759 | | | Discounted cash flow | | Discount rate
Terminal capitalization rate | | 8.75% 7.25% |
|
| X |
- DefinitionTabular disclosure of financial instruments measured at fair value, including those classified in shareholders' equity measured on a recurring or nonrecurring basis. Disclosures include, but are not limited to, fair value measurements recorded and the reasons for the measurements, level within the fair value hierarchy in which the fair value measurements are categorized and transfers between levels 1 and 2. Nonrecurring fair value measurements are those that are required or permitted in the statement of financial position in particular circumstances. Reference 1: http://fasb.org/us-gaap/role/ref/legacyRef
-Name Accounting Standards Codification
-Section 50
-Paragraph 2C
-SubTopic 10
-Topic 820
-Publisher FASB
-URI https://asc.fasb.org//1943274/2147482106/820-10-50-2C
Reference 2: http://fasb.org/us-gaap/role/ref/legacyRef
-Name Accounting Standards Codification
-Topic 820
-SubTopic 10
-Section 50
-Paragraph 2
-Subparagraph (a)
-Publisher FASB
-URI https://asc.fasb.org//1943274/2147482106/820-10-50-2
Reference 3: http://fasb.org/us-gaap/role/ref/legacyRef
-Name Accounting Standards Codification
-Topic 820
-SubTopic 10
-Section 50
-Paragraph 3
-Publisher FASB
-URI https://asc.fasb.org//1943274/2147482106/820-10-50-3
Reference 4: http://fasb.org/us-gaap/role/ref/legacyRef
-Topic 820
-SubTopic 10
-Name Accounting Standards Codification
-Section 50
-Paragraph 2
-Subparagraph (b)
-Publisher FASB
-URI https://asc.fasb.org//1943274/2147482106/820-10-50-2
| Name: |
us-gaap_FairValueAssetsAndLiabilitiesMeasuredOnRecurringAndNonrecurringBasisTableTextBlock |
| Namespace Prefix: |
us-gaap_ |
| Data Type: |
dtr-types:textBlockItemType |
| Balance Type: |
na |
| Period Type: |
duration |
|
| X |
- DefinitionTabular disclosure of input and valuation technique used to measure fair value and change in valuation approach and technique for each separate class of asset and liability measured on recurring and nonrecurring basis. Reference 1: http://fasb.org/us-gaap/role/ref/legacyRef
-Name Accounting Standards Codification
-Section 50
-Paragraph 2
-Subparagraph (bbb)
-SubTopic 10
-Topic 820
-Publisher FASB
-URI https://asc.fasb.org//1943274/2147482106/820-10-50-2
| Name: |
us-gaap_FairValueAssetsAndLiabilitiesMeasuredOnRecurringAndNonrecurringBasisValuationTechniquesTableTextBlock |
| Namespace Prefix: |
us-gaap_ |
| Data Type: |
dtr-types:textBlockItemType |
| Balance Type: |
na |
| Period Type: |
duration |
|
| X |
- DefinitionTabular disclosure of the fair value measurement of assets using significant unobservable inputs (Level 3), a reconciliation of the beginning and ending balances, separately presenting changes during the period attributable to the following: (1) total gains or losses for the period (realized and unrealized), segregating those gains or losses included in earnings (or changes in net assets) and gains or losses recognized in other comprehensive income (loss), and a description of where those gains or losses included in earnings (or changes in net assets) are reported in the statement of income (or activities); (2) purchases, sales, issues, and settlements (each type disclosed separately); and (3) transfers in and transfers out of Level 3 (for example, transfers due to changes in the observability of significant inputs), by class of asset. Reference 1: http://fasb.org/us-gaap/role/ref/legacyRef
-Name Accounting Standards Codification
-Section 50
-Paragraph 2
-Subparagraph (c)
-SubTopic 10
-Topic 820
-Publisher FASB
-URI https://asc.fasb.org//1943274/2147482106/820-10-50-2
Reference 2: http://fasb.org/us-gaap/role/ref/legacyRef
-Name Accounting Standards Codification
-Topic 820
-SubTopic 10
-Section 50
-Paragraph 3
-Publisher FASB
-URI https://asc.fasb.org//1943274/2147482106/820-10-50-3
| Name: |
us-gaap_FairValueAssetsMeasuredOnRecurringBasisUnobservableInputReconciliationTextBlock |
| Namespace Prefix: |
us-gaap_ |
| Data Type: |
dtr-types:textBlockItemType |
| Balance Type: |
na |
| Period Type: |
duration |
|
| X |
- References
+ Details
| Name: |
us-gaap_FairValueDisclosuresAbstract |
| Namespace Prefix: |
us-gaap_ |
| Data Type: |
xbrli:stringItemType |
| Balance Type: |
na |
| Period Type: |
duration |
|
v3.23.2
Derivatives (Tables)
|
6 Months Ended |
Jun. 30, 2023 |
|---|
| Derivative Instruments and Hedging Activities Disclosure [Abstract] |
|
| Schedule of Derivative Instruments |
The following tables summarize the notional amount and fair value of the outstanding derivative financial instruments, none of which were designated in a formal hedging relationship:
| | | | | | | | | | | | | | | | | | | | | | | | | As of June 30, 2023 | | Notional Amount | | Fair Value (1) | | (in thousands) | Long | | Short | | Assets | | Liabilities | | Corporate derivatives: | | | | | | | | | Total return swaps | $ | 2,330 | | | $ | 40,996 | | | $ | 374 | | | $ | 249 | | | Forward contracts - foreign exchange | — | | | 10,039 | | | 476 | | | 18 | | | Total corporate derivatives | $ | 2,330 | | | $ | 51,035 | | | $ | 850 | | | $ | 267 | | | | | | | | | | | | | | | | | | | | | | | | | | | | | | | | | | | | | | | | | |
| | | | | | | | | | | | | | | | | | | | | | | | | As of December 31, 2022 | | Notional Amount | | Fair Value (1) | | (in thousands) | Long | | Short | | Assets | | Liabilities | | Corporate derivatives: | | | | | | | | | Total return swaps | $ | 2,340 | | | $ | 33,637 | | | $ | 276 | | | $ | 717 | | | | | | | | | | | Forward contracts - foreign exchange | — | | | 9,810 | | | — | | | 742 | | | Total corporate derivatives | $ | 2,340 | | | $ | 43,447 | | | $ | 276 | | | $ | 1,459 | |
________________________ (1) The fair value of derivative financial instruments is recorded in other assets and other liabilities and accrued expenses on the Company's condensed consolidated statements of financial condition.
|
| Gains (losses) on Derivatives |
The following table summarizes net gains (losses) from derivative financial instruments: | | | | | | | | | | | | | | | | | | | | | | | | | | Three Months Ended
June 30, | | Six Months Ended
June 30, | | (in thousands) | 2023 | | 2022 | | 2023 | | 2022 | | Corporate derivatives: | | | | | | | | | | | | | | | | | Total return swaps | $ | (25) | | | $ | 3,269 | | | $ | (677) | | | $ | 3,188 | | | | | | | | | | | Forward contracts - foreign exchange | 769 | | | (420) | | | 1,200 | | | 390 | | | Total corporate derivatives | $ | 744 | | | $ | 2,849 | | | $ | 523 | | | $ | 3,578 | | Derivatives held by consolidated investment vehicles: | | | | | | | | | Total return swaps | — | | | (1,152) | | | — | | | 3,160 | | | | | | | | | | Total (1) | $ | 744 | | | $ | 1,697 | | | $ | 523 | | | $ | 6,738 | |
________________________ (1)Gains and losses on total return swaps are included in gain (loss) from investments—net in the Company's condensed consolidated statements of operations. Gains and losses on forward foreign exchange contracts are included in foreign currency gain (loss)—net in the Company's condensed consolidated statements of operations.
|
| X |
- References
+ Details
| Name: |
us-gaap_DerivativeInstrumentsAndHedgingActivitiesDisclosureAbstract |
| Namespace Prefix: |
us-gaap_ |
| Data Type: |
xbrli:stringItemType |
| Balance Type: |
na |
| Period Type: |
duration |
|
| X |
- DefinitionTabular disclosure of the location and amount of derivative instruments and nonderivative instruments designated as hedging instruments reported before netting adjustments, and the amount of gain (loss) on derivative instruments and nonderivative instruments designated and qualified as hedging instruments. Reference 1: http://www.xbrl.org/2003/role/disclosureRef
-Topic 815
-SubTopic 10
-Name Accounting Standards Codification
-Section 50
-Paragraph 4E
-Publisher FASB
-URI https://asc.fasb.org//1943274/2147480434/815-10-50-4E
Reference 2: http://fasb.org/us-gaap/role/ref/legacyRef
-Name Accounting Standards Codification
-Topic 815
-SubTopic 10
-Section 50
-Paragraph 4C
-Publisher FASB
-URI https://asc.fasb.org//1943274/2147480434/815-10-50-4C
Reference 3: http://fasb.org/us-gaap/role/ref/legacyRef
-Name Accounting Standards Codification
-Topic 815
-SubTopic 10
-Section 50
-Paragraph 4A
-Subparagraph (b)
-Publisher FASB
-URI https://asc.fasb.org//1943274/2147480434/815-10-50-4A
| Name: |
us-gaap_ScheduleOfDerivativeInstrumentsGainLossInStatementOfFinancialPerformanceTextBlock |
| Namespace Prefix: |
us-gaap_ |
| Data Type: |
dtr-types:textBlockItemType |
| Balance Type: |
na |
| Period Type: |
duration |
|
| X |
- DefinitionTabular disclosure of pertinent information about a derivative or group of derivatives on a disaggregated basis, such as for individual instruments, or small groups of similar instruments. May include a combination of the type of instrument, risks being hedged, notional amount, hedge designation, related hedged item, inception date, maturity date, or other relevant item. Reference 1: http://fasb.org/us-gaap/role/ref/legacyRef
-Name Accounting Standards Codification
-Section 50
-Paragraph 2
-SubTopic 10
-Topic 815
-Publisher FASB
-URI https://asc.fasb.org//1943274/2147480434/815-10-50-2
Reference 2: http://fasb.org/us-gaap/role/ref/legacyRef
-Name Accounting Standards Codification
-Topic 815
-SubTopic 10
-Section 50
-Paragraph 1A
-Publisher FASB
-URI https://asc.fasb.org//1943274/2147480434/815-10-50-1A
Reference 3: http://fasb.org/us-gaap/role/ref/legacyRef
-Name Accounting Standards Codification
-Topic 815
-SubTopic 10
-Section 50
-Paragraph 1B
-Publisher FASB
-URI https://asc.fasb.org//1943274/2147480434/815-10-50-1B
Reference 4: http://fasb.org/us-gaap/role/ref/legacyRef
-Name Accounting Standards Codification
-Topic 815
-SubTopic 10
-Section 50
-Paragraph 8
-Publisher FASB
-URI https://asc.fasb.org//1943274/2147480434/815-10-50-8
Reference 5: http://fasb.org/us-gaap/role/ref/legacyRef
-Name Accounting Standards Codification
-Topic 815
-SubTopic 10
-Section 50
-Paragraph 4B
-Publisher FASB
-URI https://asc.fasb.org//1943274/2147480434/815-10-50-4B
Reference 6: http://fasb.org/us-gaap/role/ref/legacyRef
-Name Accounting Standards Codification
-Topic 815
-SubTopic 10
-Section 50
-Paragraph 1
-Publisher FASB
-URI https://asc.fasb.org//1943274/2147480434/815-10-50-1
Reference 7: http://fasb.org/us-gaap/role/ref/legacyRef
-Name Accounting Standards Codification
-Topic 815
-SubTopic 10
-Section 50
-Paragraph 4
-Publisher FASB
-URI https://asc.fasb.org//1943274/2147480434/815-10-50-4
Reference 8: http://fasb.org/us-gaap/role/ref/legacyRef
-Name Accounting Standards Codification
-Topic 815
-SubTopic 10
-Section 50
-Paragraph 5
-Publisher FASB
-URI https://asc.fasb.org//1943274/2147480434/815-10-50-5
Reference 9: http://fasb.org/us-gaap/role/ref/legacyRef
-Name Accounting Standards Codification
-Topic 815
-SubTopic 10
-Section 50
-Paragraph 4C
-Publisher FASB
-URI https://asc.fasb.org//1943274/2147480434/815-10-50-4C
| Name: |
us-gaap_ScheduleOfDerivativeInstrumentsTextBlock |
| Namespace Prefix: |
us-gaap_ |
| Data Type: |
dtr-types:textBlockItemType |
| Balance Type: |
na |
| Period Type: |
duration |
|
v3.23.2
Earnings Per Share (Tables)
|
6 Months Ended |
Jun. 30, 2023 |
|---|
| Earnings Per Share [Abstract] |
|
| Schedule of Earnings Per Share, Basic and Diluted |
The following table reconciles income and share data used in the basic and diluted earnings per share computations:
| | | | | | | | | | | | | | | | | | | | | | | | | | Three Months Ended
June 30, | | Six Months Ended
June 30, | | (in thousands, except per share data) | 2023 | | 2022 | | 2023 | | 2022 | | Net income | $ | 32,505 | | | $ | 26,149 | | | $ | 68,803 | | | $ | 72,990 | | | Net (income) loss attributable to noncontrolling interests | (727) | | | 25,807 | | | (1,711) | | | 20,984 | | | Net income attributable to common stockholders | $ | 31,778 | | | $ | 51,956 | | | $ | 67,092 | | | $ | 93,974 | | | Basic weighted average shares outstanding | 49,315 | | | 48,805 | | | 49,257 | | | 48,739 | | | Dilutive potential shares from restricted stock units | 148 | | | 403 | | | 176 | | | 533 | | | Diluted weighted average shares outstanding | 49,463 | | | 49,208 | | | 49,433 | | | 49,272 | | | | | | | | | | | Basic earnings per share attributable to common stockholders | $ | 0.64 | | | $ | 1.06 | | | $ | 1.36 | | | $ | 1.93 | | | Diluted earnings per share attributable to common stockholders | $ | 0.64 | | | $ | 1.06 | | | $ | 1.36 | | | $ | 1.91 | | | | | | | | | | Anti-dilutive common stock equivalents excluded from the calculation | 214 | | | 2 | | | 141 | | | 2 | |
|
| X |
- References
+ Details
| Name: |
us-gaap_EarningsPerShareAbstract |
| Namespace Prefix: |
us-gaap_ |
| Data Type: |
xbrli:stringItemType |
| Balance Type: |
na |
| Period Type: |
duration |
|
| X |
- DefinitionTabular disclosure of an entity's basic and diluted earnings per share calculations, including a reconciliation of numerators and denominators of the basic and diluted per-share computations for income from continuing operations. Reference 1: http://www.xbrl.org/2009/role/commonPracticeRef
-Topic 260
-SubTopic 10
-Name Accounting Standards Codification
-Section 50
-Paragraph 1
-Subparagraph (a)
-Publisher FASB
-URI https://asc.fasb.org//1943274/2147482662/260-10-50-1
| Name: |
us-gaap_ScheduleOfEarningsPerShareBasicAndDilutedTableTextBlock |
| Namespace Prefix: |
us-gaap_ |
| Data Type: |
dtr-types:textBlockItemType |
| Balance Type: |
na |
| Period Type: |
duration |
|
v3.23.2
Income Taxes (Tables)
|
6 Months Ended |
Jun. 30, 2023 |
|---|
| Income Tax Disclosure [Abstract] |
|
| Schedule of Effective Income Tax Rate Reconciliation |
The provision for income taxes included U.S. federal, state, local and foreign taxes. A reconciliation of the Company’s statutory federal income tax rate and the effective income tax rate is summarized in the following table:
| | | | | | | | | | | | | | | | | | | | | | | | | Three Months Ended
June 30, | | Six Months Ended
June 30, | | 2023 | | 2022 | | 2023 | | 2022 | | U.S. statutory tax rate | 21.0 | % | | 21.0 | % | | 21.0 | % | | 21.0 | % | | State and local income taxes, net of federal benefit | 3.1 | | | 3.1 | | | 3.1 | | | 3.1 | | | Non-deductible executive compensation | 1.4 | | | 1.6 | | | 2.2 | | | 3.3 | | | Excess tax benefits related to the vesting and delivery of restricted stock units | — | | | 0.2 | | | (2.4) | | | (5.1) | | | Unrecognized tax benefit adjustments | — | | | (10.1) | | | 0.1 | | | (5.5) | | | Other | 0.2 | | | 0.1 | | | — | | | 0.1 | | | Effective income tax rate | 25.7 | % | | 15.9 | % | | 24.0 | % | | 16.9 | % |
|
| X |
- DefinitionTabular disclosure of the reconciliation using percentage or dollar amounts of the reported amount of income tax expense attributable to continuing operations for the year to the amount of income tax expense that would result from applying domestic federal statutory tax rates to pretax income from continuing operations. Reference 1: http://fasb.org/us-gaap/role/ref/legacyRef
-Topic 740
-SubTopic 10
-Name Accounting Standards Codification
-Paragraph 12
-Section 50
-Publisher FASB
-URI https://asc.fasb.org//1943274/2147482685/740-10-50-12
| Name: |
us-gaap_ScheduleOfEffectiveIncomeTaxRateReconciliationTableTextBlock |
| Namespace Prefix: |
us-gaap_ |
| Data Type: |
dtr-types:textBlockItemType |
| Balance Type: |
na |
| Period Type: |
duration |
|
v3.23.2
Related Party Transactions (Tables)
|
6 Months Ended |
Jun. 30, 2023 |
|---|
| Related Party Transactions [Abstract] |
|
| Schedule of Related Party Transactions |
The following table summarizes the amount of revenue the Company earned from these affiliated funds:
| | | | | | | | | | | | | | | | | | | | | | | | | | Three Months Ended
June 30, | | Six Months Ended
June 30, | | (in thousands) | 2023 | | 2022 | | 2023 | | 2022 | Investment advisory and administration fees (1) | $ | 81,113 | | | $ | 100,803 | | | $ | 166,612 | | | $ | 205,040 | | | Distribution and service fees | 6,977 | | | 9,005 | | | 14,539 | | | 18,874 | | | Total | $ | 88,090 | | | $ | 109,808 | | | $ | 181,151 | | | $ | 223,914 | |
_________________________ (1) Investment advisory and administration fees are reflected net of fund reimbursements of $4.3 million for both the three months ended June 30, 2023 and 2022, and $8.9 million and $8.6 million for the six months ended June 30, 2023 and 2022, respectively.
|
| X |
- DefinitionTabular disclosure of related party transactions. Examples of related party transactions include, but are not limited to, transactions between (a) a parent company and its subsidiary; (b) subsidiaries of a common parent; (c) and entity and its principal owners and (d) affiliates.
| Name: |
us-gaap_ScheduleOfRelatedPartyTransactionsTableTextBlock |
| Namespace Prefix: |
us-gaap_ |
| Data Type: |
dtr-types:textBlockItemType |
| Balance Type: |
na |
| Period Type: |
duration |
|
v3.23.2
| X |
- DefinitionAccumulated adjustment, net of tax, that results from the process of translating subsidiary financial statements and foreign equity investments into the reporting currency from the functional currency of the reporting entity, net of reclassification of realized foreign currency translation gains or losses. Reference 1: http://www.xbrl.org/2003/role/disclosureRef
-Topic 220
-SubTopic 10
-Name Accounting Standards Codification
-Section 45
-Paragraph 11
-Publisher FASB
-URI https://asc.fasb.org//1943274/2147482790/220-10-45-11
Reference 2: http://www.xbrl.org/2003/role/disclosureRef
-Topic 220
-SubTopic 10
-Name Accounting Standards Codification
-Section 45
-Paragraph 14A
-Publisher FASB
-URI https://asc.fasb.org//1943274/2147482790/220-10-45-14A
Reference 3: http://www.xbrl.org/2003/role/disclosureRef
-Topic 825
-SubTopic 10
-Name Accounting Standards Codification
-Section 45
-Paragraph 5A
-Publisher FASB
-URI https://asc.fasb.org//1943274/2147482736/825-10-45-5A
Reference 4: http://www.xbrl.org/2003/role/disclosureRef
-Topic 220
-SubTopic 10
-Name Accounting Standards Codification
-Section 45
-Paragraph 10A
-Subparagraph (a)
-Publisher FASB
-URI https://asc.fasb.org//1943274/2147482790/220-10-45-10A
Reference 5: http://www.xbrl.org/2003/role/disclosureRef
-Topic 220
-SubTopic 10
-Name Accounting Standards Codification
-Section 45
-Paragraph 14
-Publisher FASB
-URI https://asc.fasb.org//1943274/2147482790/220-10-45-14
| Name: |
us-gaap_AccumulatedOtherComprehensiveIncomeLossForeignCurrencyTranslationAdjustmentNetOfTax |
| Namespace Prefix: |
us-gaap_ |
| Data Type: |
xbrli:monetaryItemType |
| Balance Type: |
credit |
| Period Type: |
instant |
|
| X |
- DefinitionAmount of periodic reduction over lease term of carrying amount of right-of-use asset from operating lease. Reference 1: http://www.xbrl.org/2009/role/commonPracticeRef
-Topic 230
-SubTopic 10
-Name Accounting Standards Codification
-Section 45
-Paragraph 28
-Subparagraph (b)
-Publisher FASB
-URI https://asc.fasb.org//1943274/2147482740/230-10-45-28
| Name: |
us-gaap_OperatingLeaseRightOfUseAssetAmortizationExpense |
| Namespace Prefix: |
us-gaap_ |
| Data Type: |
xbrli:monetaryItemType |
| Balance Type: |
debit |
| Period Type: |
duration |
|
| X |
- Details
| Name: |
us-gaap_IntercompanyForeignCurrencyBalanceByDescriptionAxis=us-gaap_AccumulatedTranslationAdjustmentMember |
| Namespace Prefix: |
|
| Data Type: |
na |
| Balance Type: |
|
| Period Type: |
|
|
v3.23.2
Revenue (Details) - USD ($)
$ in Thousands |
3 Months Ended |
6 Months Ended |
Jun. 30, 2023 |
Jun. 30, 2022 |
Jun. 30, 2023 |
Jun. 30, 2022 |
| Disaggregation of Revenue [Line Items] |
|
|
|
|
| Total revenue |
$ 120,630
|
$ 147,431
|
$ 246,712
|
$ 301,620
|
| Open-end funds |
|
|
|
|
| Disaggregation of Revenue [Line Items] |
|
|
|
|
| Total revenue |
66,574
|
85,561
|
137,142
|
175,746
|
| Institutional accounts |
|
|
|
|
| Disaggregation of Revenue [Line Items] |
|
|
|
|
| Total revenue |
30,166
|
34,429
|
60,795
|
71,112
|
| Closed-end funds |
|
|
|
|
| Disaggregation of Revenue [Line Items] |
|
|
|
|
| Total revenue |
23,890
|
27,441
|
48,775
|
54,762
|
| North America |
|
|
|
|
| Disaggregation of Revenue [Line Items] |
|
|
|
|
| Total revenue |
104,686
|
129,428
|
214,456
|
264,628
|
| Japan |
|
|
|
|
| Disaggregation of Revenue [Line Items] |
|
|
|
|
| Total revenue |
8,014
|
9,263
|
16,133
|
18,786
|
| Europe, Middle East and Africa |
|
|
|
|
| Disaggregation of Revenue [Line Items] |
|
|
|
|
| Total revenue |
4,654
|
5,405
|
9,541
|
11,358
|
| Asia Pacific excluding Japan |
|
|
|
|
| Disaggregation of Revenue [Line Items] |
|
|
|
|
| Total revenue |
$ 3,276
|
$ 3,335
|
$ 6,582
|
$ 6,848
|
| X |
- DefinitionLine items represent financial concepts included in a table. These concepts are used to disclose reportable information associated with domain members defined in one or many axes to the table. Reference 1: http://www.xbrl.org/2003/role/disclosureRef
-Topic 606
-SubTopic 10
-Name Accounting Standards Codification
-Section 50
-Paragraph 5
-Publisher FASB
-URI https://asc.fasb.org//1943274/2147479806/606-10-50-5
Reference 2: http://www.xbrl.org/2003/role/exampleRef
-Topic 606
-SubTopic 10
-Name Accounting Standards Codification
-Section 55
-Paragraph 91
-Subparagraph (a)
-Publisher FASB
-URI https://asc.fasb.org//1943274/2147479777/606-10-55-91
Reference 3: http://www.xbrl.org/2003/role/exampleRef
-Topic 606
-SubTopic 10
-Name Accounting Standards Codification
-Section 55
-Paragraph 91
-Subparagraph (b)
-Publisher FASB
-URI https://asc.fasb.org//1943274/2147479777/606-10-55-91
Reference 4: http://www.xbrl.org/2003/role/exampleRef
-Topic 606
-SubTopic 10
-Name Accounting Standards Codification
-Section 55
-Paragraph 91
-Subparagraph (c)
-Publisher FASB
-URI https://asc.fasb.org//1943274/2147479777/606-10-55-91
Reference 5: http://www.xbrl.org/2003/role/exampleRef
-Topic 606
-SubTopic 10
-Name Accounting Standards Codification
-Section 55
-Paragraph 91
-Subparagraph (d)
-Publisher FASB
-URI https://asc.fasb.org//1943274/2147479777/606-10-55-91
Reference 6: http://www.xbrl.org/2003/role/exampleRef
-Topic 606
-SubTopic 10
-Name Accounting Standards Codification
-Section 55
-Paragraph 91
-Subparagraph (e)
-Publisher FASB
-URI https://asc.fasb.org//1943274/2147479777/606-10-55-91
Reference 7: http://www.xbrl.org/2003/role/exampleRef
-Topic 606
-SubTopic 10
-Name Accounting Standards Codification
-Section 55
-Paragraph 91
-Subparagraph (f)
-Publisher FASB
-URI https://asc.fasb.org//1943274/2147479777/606-10-55-91
Reference 8: http://www.xbrl.org/2003/role/exampleRef
-Topic 606
-SubTopic 10
-Name Accounting Standards Codification
-Section 55
-Paragraph 91
-Subparagraph (g)
-Publisher FASB
-URI https://asc.fasb.org//1943274/2147479777/606-10-55-91
| Name: |
us-gaap_DisaggregationOfRevenueLineItems |
| Namespace Prefix: |
us-gaap_ |
| Data Type: |
xbrli:stringItemType |
| Balance Type: |
na |
| Period Type: |
duration |
|
| X |
- DefinitionAmount, including tax collected from customer, of revenue from satisfaction of performance obligation by transferring promised good or service to customer. Tax collected from customer is tax assessed by governmental authority that is both imposed on and concurrent with specific revenue-producing transaction, including, but not limited to, sales, use, value-added and excise. Reference 1: http://www.xbrl.org/2003/role/disclosureRef
-Topic 924
-SubTopic 10
-Name Accounting Standards Codification
-Section S99
-Paragraph 1
-Subparagraph (SAB Topic 11.L)
-Publisher FASB
-URI https://asc.fasb.org//1943274/2147479941/924-10-S99-1
Reference 2: http://www.xbrl.org/2003/role/disclosureRef
-Topic 606
-SubTopic 10
-Name Accounting Standards Codification
-Section 50
-Paragraph 5
-Publisher FASB
-URI https://asc.fasb.org//1943274/2147479806/606-10-50-5
Reference 3: http://www.xbrl.org/2003/role/disclosureRef
-Topic 280
-SubTopic 10
-Name Accounting Standards Codification
-Section 50
-Paragraph 30
-Subparagraph (a)
-Publisher FASB
-URI https://asc.fasb.org//1943274/2147482810/280-10-50-30
Reference 4: http://www.xbrl.org/2003/role/disclosureRef
-Topic 280
-SubTopic 10
-Name Accounting Standards Codification
-Section 50
-Paragraph 42
-Publisher FASB
-URI https://asc.fasb.org//1943274/2147482810/280-10-50-42
Reference 5: http://www.xbrl.org/2003/role/disclosureRef
-Topic 280
-SubTopic 10
-Name Accounting Standards Codification
-Section 50
-Paragraph 22
-Subparagraph (b)
-Publisher FASB
-URI https://asc.fasb.org//1943274/2147482810/280-10-50-22
Reference 6: http://www.xbrl.org/2003/role/disclosureRef
-Topic 280
-SubTopic 10
-Name Accounting Standards Codification
-Section 50
-Paragraph 32
-Subparagraph (b)
-Publisher FASB
-URI https://asc.fasb.org//1943274/2147482810/280-10-50-32
Reference 7: http://www.xbrl.org/2003/role/disclosureRef
-Topic 280
-SubTopic 10
-Name Accounting Standards Codification
-Section 50
-Paragraph 40
-Publisher FASB
-URI https://asc.fasb.org//1943274/2147482810/280-10-50-40
Reference 8: http://www.xbrl.org/2003/role/disclosureRef
-Topic 280
-SubTopic 10
-Name Accounting Standards Codification
-Section 50
-Paragraph 22
-Subparagraph (a)
-Publisher FASB
-URI https://asc.fasb.org//1943274/2147482810/280-10-50-22
Reference 9: http://www.xbrl.org/2003/role/disclosureRef
-Topic 280
-SubTopic 10
-Name Accounting Standards Codification
-Section 50
-Paragraph 32
-Subparagraph (a)
-Publisher FASB
-URI https://asc.fasb.org//1943274/2147482810/280-10-50-32
Reference 10: http://www.xbrl.org/2003/role/disclosureRef
-Topic 280
-SubTopic 10
-Name Accounting Standards Codification
-Section 50
-Paragraph 41
-Subparagraph (a)
-Publisher FASB
-URI https://asc.fasb.org//1943274/2147482810/280-10-50-41
Reference 11: http://www.xbrl.org/2003/role/disclosureRef
-Topic 606
-SubTopic 10
-Name Accounting Standards Codification
-Section 50
-Paragraph 4
-Subparagraph (a)
-Publisher FASB
-URI https://asc.fasb.org//1943274/2147479806/606-10-50-4
| Name: |
us-gaap_RevenueFromContractWithCustomerIncludingAssessedTax |
| Namespace Prefix: |
us-gaap_ |
| Data Type: |
xbrli:monetaryItemType |
| Balance Type: |
credit |
| Period Type: |
duration |
|
| X |
- Details
| Name: |
srt_ProductOrServiceAxis=cns_OpenEndInvestmentFundsMember |
| Namespace Prefix: |
|
| Data Type: |
na |
| Balance Type: |
|
| Period Type: |
|
|
| X |
- Details
| Name: |
srt_ProductOrServiceAxis=cns_InstitutionalAccountsMember |
| Namespace Prefix: |
|
| Data Type: |
na |
| Balance Type: |
|
| Period Type: |
|
|
| X |
- Details
| Name: |
srt_ProductOrServiceAxis=cns_ClosedEndInvestmentFundsMember |
| Namespace Prefix: |
|
| Data Type: |
na |
| Balance Type: |
|
| Period Type: |
|
|
| X |
- Details
| Name: |
srt_StatementGeographicalAxis=srt_NorthAmericaMember |
| Namespace Prefix: |
|
| Data Type: |
na |
| Balance Type: |
|
| Period Type: |
|
|
| X |
- Details
| Name: |
srt_StatementGeographicalAxis=country_JP |
| Namespace Prefix: |
|
| Data Type: |
na |
| Balance Type: |
|
| Period Type: |
|
|
| X |
- Details
| Name: |
srt_StatementGeographicalAxis=srt_EuropeMember |
| Namespace Prefix: |
|
| Data Type: |
na |
| Balance Type: |
|
| Period Type: |
|
|
| X |
- Details
| Name: |
srt_StatementGeographicalAxis=cns_AsiaExcludingJapanMember |
| Namespace Prefix: |
|
| Data Type: |
na |
| Balance Type: |
|
| Period Type: |
|
|
v3.23.2
Investments (Details) - USD ($)
$ in Thousands |
3 Months Ended |
6 Months Ended |
|
Jun. 30, 2023 |
Jun. 30, 2022 |
Jun. 30, 2023 |
Jun. 30, 2022 |
Dec. 31, 2022 |
| Summary of Investments |
|
|
|
|
|
|
| Equity investments at fair value |
|
$ 161,051
|
|
$ 161,051
|
|
$ 157,646
|
| Trading |
|
27,155
|
|
27,155
|
|
15,289
|
| Equity method |
|
21
|
|
21
|
|
20
|
| Total investments |
[1] |
188,227
|
|
188,227
|
|
$ 172,955
|
| Gain (Loss) on Investments [Abstract] |
|
|
|
|
|
|
| Net realized gains (losses) during the period |
|
(761)
|
$ 2,664
|
(3,091)
|
$ 10,845
|
|
| Net unrealized gains (losses) during the period on investments still held at the end of the period |
|
1,117
|
(31,237)
|
3,139
|
(35,851)
|
|
| Gain (loss) from investments—net |
|
$ 356
|
$ (28,573)
|
$ 48
|
$ (25,006)
|
|
|
|
| X |
- Definition
+ References
+ Details
| Name: |
cns_SummaryOfInvestmentsAbstract |
| Namespace Prefix: |
cns_ |
| Data Type: |
xbrli:stringItemType |
| Balance Type: |
na |
| Period Type: |
duration |
|
| X |
- DefinitionAmount of realized gain (loss) on investment in debt and equity securities. Reference 1: http://www.xbrl.org/2003/role/disclosureRef
-Topic 946
-SubTopic 320
-Name Accounting Standards Codification
-Section S99
-Paragraph 6
-Subparagraph (SX 210.12-14(Column C)(Footnote 4))
-Publisher FASB
-URI https://asc.fasb.org//1943274/2147480032/946-320-S99-6
Reference 2: http://www.xbrl.org/2003/role/disclosureRef
-Topic 946
-SubTopic 320
-Name Accounting Standards Codification
-Section S99
-Paragraph 6
-Subparagraph (SX 210.12-14(Column C)(Footnote 6)(e))
-Publisher FASB
-URI https://asc.fasb.org//1943274/2147480032/946-320-S99-6
Reference 3: http://www.xbrl.org/2003/role/disclosureRef
-Topic 946
-SubTopic 320
-Name Accounting Standards Codification
-Section S99
-Paragraph 6
-Subparagraph (SX 210.12-14(Column C))
-Publisher FASB
-URI https://asc.fasb.org//1943274/2147480032/946-320-S99-6
Reference 4: http://www.xbrl.org/2009/role/commonPracticeRef
-Topic 220
-SubTopic 10
-Name Accounting Standards Codification
-Section S99
-Paragraph 2
-Subparagraph (SX 210.5-03(7)(c))
-Publisher FASB
-URI https://asc.fasb.org//1943274/2147483621/220-10-S99-2
Reference 5: http://www.xbrl.org/2009/role/commonPracticeRef
-Topic 220
-SubTopic 10
-Name Accounting Standards Codification
-Section S99
-Paragraph 2
-Subparagraph (SX 210.5-03(9)(a))
-Publisher FASB
-URI https://asc.fasb.org//1943274/2147483621/220-10-S99-2
Reference 6: http://www.xbrl.org/2003/role/disclosureRef
-Topic 946
-SubTopic 220
-Name Accounting Standards Codification
-Section S99
-Paragraph 1
-Subparagraph (SX 210.6-07(7)(a)(1))
-Publisher FASB
-URI https://asc.fasb.org//1943274/2147483575/946-220-S99-1
Reference 7: http://www.xbrl.org/2003/role/disclosureRef
-Topic 946
-SubTopic 220
-Name Accounting Standards Codification
-Section S99
-Paragraph 1
-Subparagraph (SX 210.6-07(7)(a)(2))
-Publisher FASB
-URI https://asc.fasb.org//1943274/2147483575/946-220-S99-1
| Name: |
us-gaap_DebtAndEquitySecuritiesRealizedGainLoss |
| Namespace Prefix: |
us-gaap_ |
| Data Type: |
xbrli:monetaryItemType |
| Balance Type: |
credit |
| Period Type: |
duration |
|
| X |
- DefinitionThis item represents the carrying amount on the entity's balance sheet of its investment in common stock of an equity method investee. This is not an indicator of the fair value of the investment, rather it is the initial cost adjusted for the entity's share of earnings and losses of the investee, adjusted for any distributions (dividends) and other than temporary impairment (OTTI) losses recognized. Reference 1: http://www.xbrl.org/2003/role/disclosureRef
-Topic 323
-SubTopic 10
-Name Accounting Standards Codification
-Section 45
-Paragraph 1
-Publisher FASB
-URI https://asc.fasb.org//1943274/2147481664/323-10-45-1
Reference 2: http://www.xbrl.org/2009/role/commonPracticeRef
-Topic 323
-SubTopic 10
-Name Accounting Standards Codification
-Section 50
-Paragraph 3
-Subparagraph (a)(3)
-Publisher FASB
-URI https://asc.fasb.org//1943274/2147481687/323-10-50-3
Reference 3: http://www.xbrl.org/2009/role/commonPracticeRef
-Topic 210
-SubTopic 10
-Name Accounting Standards Codification
-Section S99
-Paragraph 1
-Subparagraph (SX 210.5-02(10))
-Publisher FASB
-URI https://asc.fasb.org//1943274/2147480566/210-10-S99-1
Reference 4: http://www.xbrl.org/2003/role/disclosureRef
-Topic 280
-SubTopic 10
-Name Accounting Standards Codification
-Section 50
-Paragraph 25
-Subparagraph (a)
-Publisher FASB
-URI https://asc.fasb.org//1943274/2147482810/280-10-50-25
| Name: |
us-gaap_EquityMethodInvestments |
| Namespace Prefix: |
us-gaap_ |
| Data Type: |
xbrli:monetaryItemType |
| Balance Type: |
debit |
| Period Type: |
instant |
|
| X |
- DefinitionAmount of investment in equity security measured at fair value with change in fair value recognized in net income (FV-NI), classified as current. Reference 1: http://www.xbrl.org/2003/role/disclosureRef
-Topic 210
-SubTopic 10
-Name Accounting Standards Codification
-Section S99
-Paragraph 1
-Subparagraph (SX 210.5-02(2))
-Publisher FASB
-URI https://asc.fasb.org//1943274/2147480566/210-10-S99-1
Reference 2: http://www.xbrl.org/2003/role/exampleRef
-Topic 210
-SubTopic 10
-Name Accounting Standards Codification
-Section 45
-Paragraph 1
-Subparagraph (f)
-Publisher FASB
-URI https://asc.fasb.org//1943274/2147483467/210-10-45-1
Reference 3: http://www.xbrl.org/2003/role/disclosureRef
-Topic 825
-SubTopic 10
-Name Accounting Standards Codification
-Section 45
-Paragraph 1A
-Publisher FASB
-URI https://asc.fasb.org//1943274/2147482736/825-10-45-1A
| Name: |
us-gaap_EquitySecuritiesFvNi |
| Namespace Prefix: |
us-gaap_ |
| Data Type: |
xbrli:monetaryItemType |
| Balance Type: |
debit |
| Period Type: |
instant |
|
| X |
- DefinitionAmount of realized and unrealized gain (loss) on investment. Reference 1: http://www.xbrl.org/2003/role/recommendedDisclosureRef
-Topic 230
-SubTopic 10
-Name Accounting Standards Codification
-Section 45
-Paragraph 28
-Subparagraph (b)
-Publisher FASB
-URI https://asc.fasb.org//1943274/2147482740/230-10-45-28
Reference 2: http://fasb.org/us-gaap/role/ref/legacyRef
-Topic 220
-SubTopic 10
-Name Accounting Standards Codification
-Section S99
-Paragraph 2
-Subparagraph (SX 210.5-03.7(c),9(a))
-Publisher FASB
-URI https://asc.fasb.org//1943274/2147483621/220-10-S99-2
| Name: |
us-gaap_GainLossOnInvestments |
| Namespace Prefix: |
us-gaap_ |
| Data Type: |
xbrli:monetaryItemType |
| Balance Type: |
credit |
| Period Type: |
duration |
|
| X |
- References
+ Details
| Name: |
us-gaap_GainLossOnInvestmentsAbstract |
| Namespace Prefix: |
us-gaap_ |
| Data Type: |
xbrli:stringItemType |
| Balance Type: |
na |
| Period Type: |
duration |
|
| X |
- DefinitionSum of the carrying amounts as of the balance sheet date of all investments. Reference 1: http://www.xbrl.org/2003/role/disclosureRef
-Topic 944
-SubTopic 210
-Name Accounting Standards Codification
-Section S99
-Paragraph 1
-Subparagraph (SX 210.7-03(a)(1)(h))
-Publisher FASB
-URI https://asc.fasb.org//1943274/2147479440/944-210-S99-1
| Name: |
us-gaap_Investments |
| Namespace Prefix: |
us-gaap_ |
| Data Type: |
xbrli:monetaryItemType |
| Balance Type: |
debit |
| Period Type: |
instant |
|
| X |
- DefinitionAmount of unrealized gain (loss) on investment in marketable security. Reference 1: http://fasb.org/us-gaap/role/ref/legacyRef
-Topic 220
-SubTopic 10
-Name Accounting Standards Codification
-Section S99
-Paragraph 2
-Subparagraph (SX 210.5-03(7)(c))
-Publisher FASB
-URI https://asc.fasb.org//1943274/2147483621/220-10-S99-2
| Name: |
us-gaap_MarketableSecuritiesUnrealizedGainLoss |
| Namespace Prefix: |
us-gaap_ |
| Data Type: |
xbrli:monetaryItemType |
| Balance Type: |
credit |
| Period Type: |
duration |
|
| X |
- DefinitionAmount of investment in debt security measured at fair value with change in fair value recognized in net income (trading). Reference 1: http://www.xbrl.org/2009/role/commonPracticeRef
-Topic 320
-SubTopic 10
-Name Accounting Standards Codification
-Section 45
-Paragraph 1
-Subparagraph (b)
-Publisher FASB
-URI https://asc.fasb.org//1943274/2147481830/320-10-45-1
Reference 2: http://www.xbrl.org/2003/role/disclosureRef
-Topic 210
-SubTopic 10
-Name Accounting Standards Codification
-Section S99
-Paragraph 1
-Subparagraph (SX 210.5-02(2))
-Publisher FASB
-URI https://asc.fasb.org//1943274/2147480566/210-10-S99-1
Reference 3: http://www.xbrl.org/2003/role/exampleRef
-Topic 210
-SubTopic 10
-Name Accounting Standards Codification
-Section 45
-Paragraph 1
-Subparagraph (f)
-Publisher FASB
-URI https://asc.fasb.org//1943274/2147483467/210-10-45-1
| Name: |
us-gaap_TradingSecuritiesDebt |
| Namespace Prefix: |
us-gaap_ |
| Data Type: |
xbrli:monetaryItemType |
| Balance Type: |
debit |
| Period Type: |
instant |
|
v3.23.2
Investments Variable Interest Entity (Details) - USD ($)
$ in Thousands |
Jun. 30, 2023 |
Dec. 31, 2022 |
| Variable Interest Entity [Line Items] |
|
|
|
| Investments |
[1] |
$ 188,227
|
$ 172,955
|
| Other assets |
[1] |
29,146
|
20,014
|
| Total assets |
|
624,987
|
673,379
|
| Due to brokers |
[1] |
1,257
|
835
|
| Other liabilities and accrued expenses |
[1] |
23,995
|
12,857
|
| Total liabilities |
|
181,080
|
246,436
|
| SICAV GLI |
|
|
|
| Variable Interest Entity [Line Items] |
|
|
|
| Investments |
|
37,011
|
36,296
|
| Due from brokers ($145 and $1,743) |
|
233
|
11
|
| Other assets |
|
190
|
151
|
| Total assets |
|
37,434
|
36,458
|
| Due to brokers |
|
272
|
11
|
| Other liabilities and accrued expenses |
|
70
|
91
|
| Total liabilities |
|
342
|
102
|
| Net assets |
|
37,092
|
36,356
|
| Attributable to the Company |
|
19,232
|
19,116
|
| Attributable to noncontrolling interests |
|
17,860
|
17,240
|
| SICAV GRE |
|
|
|
| Variable Interest Entity [Line Items] |
|
|
|
| Investments |
|
79,033
|
79,434
|
| Due from brokers ($145 and $1,743) |
|
609
|
0
|
| Other assets |
|
357
|
370
|
| Total assets |
|
79,999
|
79,804
|
| Due to brokers |
|
358
|
0
|
| Other liabilities and accrued expenses |
|
140
|
214
|
| Total liabilities |
|
498
|
214
|
| Net assets |
|
79,501
|
79,590
|
| Attributable to the Company |
|
11,843
|
11,495
|
| Attributable to noncontrolling interests |
|
67,658
|
68,095
|
| GRP-CIP |
|
|
|
| Variable Interest Entity [Line Items] |
|
|
|
| Investments |
|
151
|
147
|
| Due from brokers ($145 and $1,743) |
|
25
|
27
|
| Other assets |
|
0
|
0
|
| Total assets |
|
176
|
174
|
| Due to brokers |
|
0
|
0
|
| Other liabilities and accrued expenses |
|
5
|
5
|
| Total liabilities |
|
5
|
5
|
| Net assets |
|
171
|
169
|
| Attributable to the Company |
|
171
|
169
|
| Attributable to noncontrolling interests |
|
0
|
0
|
| REOF |
|
|
|
| Variable Interest Entity [Line Items] |
|
|
|
| Investments |
|
23,002
|
19,052
|
| Due from brokers ($145 and $1,743) |
|
0
|
0
|
| Other assets |
|
1
|
55
|
| Total assets |
|
23,003
|
19,107
|
| Due to brokers |
|
0
|
0
|
| Other liabilities and accrued expenses |
|
411
|
354
|
| Total liabilities |
|
411
|
354
|
| Net assets |
|
22,592
|
18,753
|
| Attributable to the Company |
|
17,355
|
14,699
|
| Attributable to noncontrolling interests |
|
5,237
|
4,054
|
| Total |
|
|
|
| Variable Interest Entity [Line Items] |
|
|
|
| Investments |
|
139,197
|
134,929
|
| Due from brokers ($145 and $1,743) |
|
867
|
38
|
| Other assets |
|
548
|
576
|
| Total assets |
|
140,612
|
135,543
|
| Due to brokers |
|
630
|
11
|
| Other liabilities and accrued expenses |
|
626
|
664
|
| Total liabilities |
|
1,256
|
675
|
| Net assets |
|
139,356
|
134,868
|
| Attributable to the Company |
|
48,601
|
45,479
|
| Attributable to noncontrolling interests |
|
$ 90,755
|
$ 89,389
|
|
|
| X |
- DefinitionNet Assets Attributable to Redeemable Non-Controlling Interests
| Name: |
cns_NetAssetsAttributableToRedeemableNonControllingInterests |
| Namespace Prefix: |
cns_ |
| Data Type: |
xbrli:monetaryItemType |
| Balance Type: |
credit |
| Period Type: |
instant |
|
| X |
- DefinitionNet Assets Attributable to the Company
| Name: |
cns_NetAssetsAttributableToTheCompany |
| Namespace Prefix: |
cns_ |
| Data Type: |
xbrli:monetaryItemType |
| Balance Type: |
credit |
| Period Type: |
instant |
|
| X |
- DefinitionAmount payable to other broker-dealer and clearing organization, including, but not limited to, security failed-to-receive, deposit received for security loaned, open transaction, and floor-brokerage payable. Reference 1: http://www.xbrl.org/2009/role/commonPracticeRef
-Name Rule 15c3-1
-Number 240
-Section 15c3-1
-Publisher SEC
| Name: |
srt_PayablesToBrokerDealersAndClearingOrganizations |
| Namespace Prefix: |
srt_ |
| Data Type: |
xbrli:monetaryItemType |
| Balance Type: |
credit |
| Period Type: |
instant |
|
| X |
- DefinitionSum of the carrying amounts as of the balance sheet date of all assets that are recognized. Assets are probable future economic benefits obtained or controlled by an entity as a result of past transactions or events. Reference 1: http://www.xbrl.org/2003/role/disclosureRef
-Topic 810
-SubTopic 10
-Name Accounting Standards Codification
-Section 50
-Paragraph 3
-Subparagraph (bb)
-Publisher FASB
-URI https://asc.fasb.org//1943274/2147481203/810-10-50-3
Reference 2: http://www.xbrl.org/2003/role/disclosureRef
-Topic 810
-SubTopic 10
-Name Accounting Standards Codification
-Section 45
-Paragraph 25
-Subparagraph (a)
-Publisher FASB
-URI https://asc.fasb.org//1943274/2147481231/810-10-45-25
Reference 3: http://www.xbrl.org/2003/role/disclosureRef
-Topic 235
-SubTopic 10
-Name Accounting Standards Codification
-Section S99
-Paragraph 1
-Subparagraph (SX 210.4-08(g)(1)(ii))
-Publisher FASB
-URI https://asc.fasb.org//1943274/2147480678/235-10-S99-1
Reference 4: http://www.xbrl.org/2003/role/disclosureRef
-Topic 323
-SubTopic 10
-Name Accounting Standards Codification
-Section 50
-Paragraph 3
-Subparagraph (c)
-Publisher FASB
-URI https://asc.fasb.org//1943274/2147481687/323-10-50-3
Reference 5: http://www.xbrl.org/2003/role/disclosureRef
-Topic 825
-SubTopic 10
-Name Accounting Standards Codification
-Section 50
-Paragraph 28
-Subparagraph (f)
-Publisher FASB
-URI https://asc.fasb.org//1943274/2147482907/825-10-50-28
Reference 6: http://www.xbrl.org/2003/role/exampleRef
-Topic 852
-SubTopic 10
-Name Accounting Standards Codification
-Section 55
-Paragraph 10
-Publisher FASB
-URI https://asc.fasb.org//1943274/2147481372/852-10-55-10
Reference 7: http://www.xbrl.org/2003/role/exampleRef
-Topic 946
-SubTopic 830
-Name Accounting Standards Codification
-Section 55
-Paragraph 12
-Publisher FASB
-URI https://asc.fasb.org//1943274/2147480167/946-830-55-12
Reference 8: http://www.xbrl.org/2003/role/disclosureRef
-Topic 944
-SubTopic 210
-Name Accounting Standards Codification
-Section S99
-Paragraph 1
-Subparagraph (SX 210.7-03(a)(12))
-Publisher FASB
-URI https://asc.fasb.org//1943274/2147479440/944-210-S99-1
Reference 9: http://www.xbrl.org/2003/role/disclosureRef
-Topic 280
-SubTopic 10
-Name Accounting Standards Codification
-Section 50
-Paragraph 22
-Publisher FASB
-URI https://asc.fasb.org//1943274/2147482810/280-10-50-22
Reference 10: http://www.xbrl.org/2003/role/disclosureRef
-Topic 946
-SubTopic 210
-Name Accounting Standards Codification
-Section S99
-Paragraph 1
-Subparagraph (SX 210.6-04(8))
-Publisher FASB
-URI https://asc.fasb.org//1943274/2147479617/946-210-S99-1
Reference 11: http://www.xbrl.org/2003/role/disclosureRef
-Topic 210
-SubTopic 10
-Name Accounting Standards Codification
-Section S99
-Paragraph 1
-Subparagraph (SX 210.5-02(18))
-Publisher FASB
-URI https://asc.fasb.org//1943274/2147480566/210-10-S99-1
Reference 12: http://www.xbrl.org/2003/role/disclosureRef
-Topic 470
-SubTopic 10
-Name Accounting Standards Codification
-Section S99
-Paragraph 1A
-Subparagraph (SX 210.13-01(a)(4)(i))
-Publisher FASB
-URI https://asc.fasb.org//1943274/2147480097/470-10-S99-1A
Reference 13: http://www.xbrl.org/2009/role/commonPracticeRef
-Topic 470
-SubTopic 10
-Name Accounting Standards Codification
-Section S99
-Paragraph 1A
-Subparagraph (SX 210.13-01(a)(4)(ii))
-Publisher FASB
-URI https://asc.fasb.org//1943274/2147480097/470-10-S99-1A
Reference 14: http://www.xbrl.org/2009/role/commonPracticeRef
-Topic 470
-SubTopic 10
-Name Accounting Standards Codification
-Section S99
-Paragraph 1A
-Subparagraph (SX 210.13-01(a)(4)(iii))
-Publisher FASB
-URI https://asc.fasb.org//1943274/2147480097/470-10-S99-1A
Reference 15: http://www.xbrl.org/2003/role/disclosureRef
-Topic 470
-SubTopic 10
-Name Accounting Standards Codification
-Section S99
-Paragraph 1A
-Subparagraph (SX 210.13-01(a)(4)(iii)(A))
-Publisher FASB
-URI https://asc.fasb.org//1943274/2147480097/470-10-S99-1A
Reference 16: http://www.xbrl.org/2003/role/disclosureRef
-Topic 470
-SubTopic 10
-Name Accounting Standards Codification
-Section S99
-Paragraph 1A
-Subparagraph (SX 210.13-01(a)(4)(iv))
-Publisher FASB
-URI https://asc.fasb.org//1943274/2147480097/470-10-S99-1A
Reference 17: http://www.xbrl.org/2003/role/disclosureRef
-Topic 470
-SubTopic 10
-Name Accounting Standards Codification
-Section S99
-Paragraph 1A
-Subparagraph (SX 210.13-01(a)(5))
-Publisher FASB
-URI https://asc.fasb.org//1943274/2147480097/470-10-S99-1A
Reference 18: http://www.xbrl.org/2003/role/disclosureRef
-Topic 470
-SubTopic 10
-Name Accounting Standards Codification
-Section S99
-Paragraph 1B
-Subparagraph (SX 210.13-02(a)(4)(i))
-Publisher FASB
-URI https://asc.fasb.org//1943274/2147480097/470-10-S99-1B
Reference 19: http://www.xbrl.org/2003/role/disclosureRef
-Topic 470
-SubTopic 10
-Name Accounting Standards Codification
-Section S99
-Paragraph 1B
-Subparagraph (SX 210.13-02(a)(4)(iii)(A))
-Publisher FASB
-URI https://asc.fasb.org//1943274/2147480097/470-10-S99-1B
Reference 20: http://www.xbrl.org/2003/role/disclosureRef
-Topic 470
-SubTopic 10
-Name Accounting Standards Codification
-Section S99
-Paragraph 1B
-Subparagraph (SX 210.13-02(a)(4)(iii)(B))
-Publisher FASB
-URI https://asc.fasb.org//1943274/2147480097/470-10-S99-1B
Reference 21: http://www.xbrl.org/2003/role/disclosureRef
-Topic 470
-SubTopic 10
-Name Accounting Standards Codification
-Section S99
-Paragraph 1B
-Subparagraph (SX 210.13-02(a)(4)(iv))
-Publisher FASB
-URI https://asc.fasb.org//1943274/2147480097/470-10-S99-1B
Reference 22: http://www.xbrl.org/2003/role/disclosureRef
-Topic 470
-SubTopic 10
-Name Accounting Standards Codification
-Section S99
-Paragraph 1B
-Subparagraph (SX 210.13-02(a)(5))
-Publisher FASB
-URI https://asc.fasb.org//1943274/2147480097/470-10-S99-1B
Reference 23: http://www.xbrl.org/2009/role/commonPracticeRef
-Topic 852
-SubTopic 10
-Name Accounting Standards Codification
-Section 50
-Paragraph 7
-Subparagraph (a)
-Publisher FASB
-URI https://asc.fasb.org//1943274/2147481404/852-10-50-7
Reference 24: http://www.xbrl.org/2003/role/disclosureRef
-Topic 280
-SubTopic 10
-Name Accounting Standards Codification
-Section 50
-Paragraph 30
-Subparagraph (c)
-Publisher FASB
-URI https://asc.fasb.org//1943274/2147482810/280-10-50-30
Reference 25: http://www.xbrl.org/2003/role/disclosureRef
-Topic 280
-SubTopic 10
-Name Accounting Standards Codification
-Section 50
-Paragraph 32
-Subparagraph (d)
-Publisher FASB
-URI https://asc.fasb.org//1943274/2147482810/280-10-50-32
Reference 26: http://fasb.org/us-gaap/role/ref/legacyRef
-Topic 942
-SubTopic 210
-Name Accounting Standards Codification
-Section S99
-Paragraph 1
-Subparagraph (SX 210.9-03(11))
-Publisher FASB
-URI https://asc.fasb.org//1943274/2147479853/942-210-S99-1
| Name: |
us-gaap_Assets |
| Namespace Prefix: |
us-gaap_ |
| Data Type: |
xbrli:monetaryItemType |
| Balance Type: |
debit |
| Period Type: |
instant |
|
| X |
- DefinitionAmount of net assets (liabilities). Reference 1: http://fasb.org/us-gaap/role/ref/legacyRef
-Name Accounting Standards Codification
-Section 50
-Paragraph 1
-SubTopic 30
-Topic 205
-Publisher FASB
-URI https://asc.fasb.org//1943274/2147479910/205-30-50-1
| Name: |
us-gaap_AssetsNet |
| Namespace Prefix: |
us-gaap_ |
| Data Type: |
xbrli:monetaryItemType |
| Balance Type: |
debit |
| Period Type: |
instant |
|
| X |
- DefinitionSum of the carrying amounts as of the balance sheet date of all investments. Reference 1: http://www.xbrl.org/2003/role/disclosureRef
-Topic 944
-SubTopic 210
-Name Accounting Standards Codification
-Section S99
-Paragraph 1
-Subparagraph (SX 210.7-03(a)(1)(h))
-Publisher FASB
-URI https://asc.fasb.org//1943274/2147479440/944-210-S99-1
| Name: |
us-gaap_Investments |
| Namespace Prefix: |
us-gaap_ |
| Data Type: |
xbrli:monetaryItemType |
| Balance Type: |
debit |
| Period Type: |
instant |
|
| X |
- DefinitionSum of the carrying amounts as of the balance sheet date of all liabilities that are recognized. Liabilities are probable future sacrifices of economic benefits arising from present obligations of an entity to transfer assets or provide services to other entities in the future. Reference 1: http://www.xbrl.org/2003/role/disclosureRef
-Topic 810
-SubTopic 10
-Name Accounting Standards Codification
-Section 50
-Paragraph 3
-Subparagraph (c)
-Publisher FASB
-URI https://asc.fasb.org//1943274/2147481203/810-10-50-3
Reference 2: http://www.xbrl.org/2003/role/disclosureRef
-Topic 810
-SubTopic 10
-Name Accounting Standards Codification
-Section 45
-Paragraph 25
-Subparagraph (b)
-Publisher FASB
-URI https://asc.fasb.org//1943274/2147481231/810-10-45-25
Reference 3: http://www.xbrl.org/2003/role/disclosureRef
-Topic 810
-SubTopic 10
-Name Accounting Standards Codification
-Section 50
-Paragraph 3
-Subparagraph (bb)
-Publisher FASB
-URI https://asc.fasb.org//1943274/2147481203/810-10-50-3
Reference 4: http://www.xbrl.org/2003/role/disclosureRef
-Topic 235
-SubTopic 10
-Name Accounting Standards Codification
-Section S99
-Paragraph 1
-Subparagraph (SX 210.4-08(g)(1)(ii))
-Publisher FASB
-URI https://asc.fasb.org//1943274/2147480678/235-10-S99-1
Reference 5: http://www.xbrl.org/2003/role/disclosureRef
-Topic 323
-SubTopic 10
-Name Accounting Standards Codification
-Section 50
-Paragraph 3
-Subparagraph (c)
-Publisher FASB
-URI https://asc.fasb.org//1943274/2147481687/323-10-50-3
Reference 6: http://www.xbrl.org/2003/role/disclosureRef
-Topic 825
-SubTopic 10
-Name Accounting Standards Codification
-Section 50
-Paragraph 28
-Subparagraph (f)
-Publisher FASB
-URI https://asc.fasb.org//1943274/2147482907/825-10-50-28
Reference 7: http://www.xbrl.org/2003/role/exampleRef
-Topic 946
-SubTopic 830
-Name Accounting Standards Codification
-Section 55
-Paragraph 12
-Publisher FASB
-URI https://asc.fasb.org//1943274/2147480167/946-830-55-12
Reference 8: http://www.xbrl.org/2003/role/disclosureRef
-Topic 946
-SubTopic 210
-Name Accounting Standards Codification
-Section S99
-Paragraph 1
-Subparagraph (SX 210.6-04(14))
-Publisher FASB
-URI https://asc.fasb.org//1943274/2147479617/946-210-S99-1
Reference 9: http://www.xbrl.org/2003/role/disclosureRef
-Topic 470
-SubTopic 10
-Name Accounting Standards Codification
-Section S99
-Paragraph 1A
-Subparagraph (SX 210.13-01(a)(4)(i))
-Publisher FASB
-URI https://asc.fasb.org//1943274/2147480097/470-10-S99-1A
Reference 10: http://www.xbrl.org/2009/role/commonPracticeRef
-Topic 470
-SubTopic 10
-Name Accounting Standards Codification
-Section S99
-Paragraph 1A
-Subparagraph (SX 210.13-01(a)(4)(ii))
-Publisher FASB
-URI https://asc.fasb.org//1943274/2147480097/470-10-S99-1A
Reference 11: http://www.xbrl.org/2003/role/disclosureRef
-Topic 470
-SubTopic 10
-Name Accounting Standards Codification
-Section S99
-Paragraph 1A
-Subparagraph (SX 210.13-01(a)(4)(iii)(A))
-Publisher FASB
-URI https://asc.fasb.org//1943274/2147480097/470-10-S99-1A
Reference 12: http://www.xbrl.org/2003/role/disclosureRef
-Topic 470
-SubTopic 10
-Name Accounting Standards Codification
-Section S99
-Paragraph 1A
-Subparagraph (SX 210.13-01(a)(4)(iv))
-Publisher FASB
-URI https://asc.fasb.org//1943274/2147480097/470-10-S99-1A
Reference 13: http://www.xbrl.org/2003/role/disclosureRef
-Topic 470
-SubTopic 10
-Name Accounting Standards Codification
-Section S99
-Paragraph 1A
-Subparagraph (SX 210.13-01(a)(5))
-Publisher FASB
-URI https://asc.fasb.org//1943274/2147480097/470-10-S99-1A
Reference 14: http://www.xbrl.org/2003/role/disclosureRef
-Topic 470
-SubTopic 10
-Name Accounting Standards Codification
-Section S99
-Paragraph 1B
-Subparagraph (SX 210.13-02(a)(4)(i))
-Publisher FASB
-URI https://asc.fasb.org//1943274/2147480097/470-10-S99-1B
Reference 15: http://www.xbrl.org/2003/role/disclosureRef
-Topic 470
-SubTopic 10
-Name Accounting Standards Codification
-Section S99
-Paragraph 1B
-Subparagraph (SX 210.13-02(a)(4)(iii)(A))
-Publisher FASB
-URI https://asc.fasb.org//1943274/2147480097/470-10-S99-1B
Reference 16: http://www.xbrl.org/2003/role/disclosureRef
-Topic 470
-SubTopic 10
-Name Accounting Standards Codification
-Section S99
-Paragraph 1B
-Subparagraph (SX 210.13-02(a)(4)(iii)(B))
-Publisher FASB
-URI https://asc.fasb.org//1943274/2147480097/470-10-S99-1B
Reference 17: http://www.xbrl.org/2003/role/disclosureRef
-Topic 470
-SubTopic 10
-Name Accounting Standards Codification
-Section S99
-Paragraph 1B
-Subparagraph (SX 210.13-02(a)(4)(iv))
-Publisher FASB
-URI https://asc.fasb.org//1943274/2147480097/470-10-S99-1B
Reference 18: http://www.xbrl.org/2003/role/disclosureRef
-Topic 470
-SubTopic 10
-Name Accounting Standards Codification
-Section S99
-Paragraph 1B
-Subparagraph (SX 210.13-02(a)(5))
-Publisher FASB
-URI https://asc.fasb.org//1943274/2147480097/470-10-S99-1B
Reference 19: http://www.xbrl.org/2009/role/commonPracticeRef
-Topic 852
-SubTopic 10
-Name Accounting Standards Codification
-Section 50
-Paragraph 7
-Subparagraph (a)
-Publisher FASB
-URI https://asc.fasb.org//1943274/2147481404/852-10-50-7
Reference 20: http://www.xbrl.org/2009/role/commonPracticeRef
-Topic 852
-SubTopic 10
-Name Accounting Standards Codification
-Section 50
-Paragraph 7
-Subparagraph (b)
-Publisher FASB
-URI https://asc.fasb.org//1943274/2147481404/852-10-50-7
Reference 21: http://www.xbrl.org/2003/role/exampleRef
-Topic 280
-SubTopic 10
-Name Accounting Standards Codification
-Section 50
-Paragraph 30
-Subparagraph (d)
-Publisher FASB
-URI https://asc.fasb.org//1943274/2147482810/280-10-50-30
Reference 22: http://fasb.org/us-gaap/role/ref/legacyRef
-Name Accounting Standards Codification
-Topic 210
-SubTopic 10
-Section S99
-Paragraph 1
-Subparagraph (SX 210.5-02.19-26)
-Publisher FASB
-URI https://asc.fasb.org//1943274/2147480566/210-10-S99-1
| Name: |
us-gaap_Liabilities |
| Namespace Prefix: |
us-gaap_ |
| Data Type: |
xbrli:monetaryItemType |
| Balance Type: |
credit |
| Period Type: |
instant |
|
| X |
- DefinitionAmount of assets classified as other. Reference 1: http://www.xbrl.org/2003/role/exampleRef
-Topic 946
-SubTopic 830
-Name Accounting Standards Codification
-Section 55
-Paragraph 12
-Publisher FASB
-URI https://asc.fasb.org//1943274/2147480167/946-830-55-12
Reference 2: http://www.xbrl.org/2003/role/disclosureRef
-Topic 944
-SubTopic 210
-Name Accounting Standards Codification
-Section S99
-Paragraph 1
-Subparagraph (SX 210.7-03(a)(10))
-Publisher FASB
-URI https://asc.fasb.org//1943274/2147479440/944-210-S99-1
Reference 3: http://www.xbrl.org/2003/role/disclosureRef
-Topic 210
-SubTopic 10
-Name Accounting Standards Codification
-Section S99
-Paragraph 1
-Subparagraph (SX 210.5-02(17))
-Publisher FASB
-URI https://asc.fasb.org//1943274/2147480566/210-10-S99-1
Reference 4: http://fasb.org/us-gaap/role/ref/legacyRef
-Topic 942
-SubTopic 210
-Name Accounting Standards Codification
-Section S99
-Paragraph 1
-Subparagraph (SX 210.9-03(10))
-Publisher FASB
-URI https://asc.fasb.org//1943274/2147479853/942-210-S99-1
| Name: |
us-gaap_OtherAssets |
| Namespace Prefix: |
us-gaap_ |
| Data Type: |
xbrli:monetaryItemType |
| Balance Type: |
debit |
| Period Type: |
instant |
|
| X |
- DefinitionAmount of liabilities classified as other. Reference 1: http://www.xbrl.org/2003/role/exampleRef
-Topic 946
-SubTopic 830
-Name Accounting Standards Codification
-Section 55
-Paragraph 12
-Publisher FASB
-URI https://asc.fasb.org//1943274/2147480167/946-830-55-12
Reference 2: http://www.xbrl.org/2003/role/disclosureRef
-Topic 946
-SubTopic 210
-Name Accounting Standards Codification
-Section S99
-Paragraph 1
-Subparagraph (SX 210.6-04(12)(b)(2))
-Publisher FASB
-URI https://asc.fasb.org//1943274/2147479617/946-210-S99-1
Reference 3: http://www.xbrl.org/2003/role/disclosureRef
-Topic 946
-SubTopic 210
-Name Accounting Standards Codification
-Section S99
-Paragraph 1
-Subparagraph (SX 210.6-04(12)(b)(3))
-Publisher FASB
-URI https://asc.fasb.org//1943274/2147479617/946-210-S99-1
Reference 4: http://www.xbrl.org/2003/role/disclosureRef
-Topic 944
-SubTopic 210
-Name Accounting Standards Codification
-Section S99
-Paragraph 1
-Subparagraph (SX 210.7-03(15))
-Publisher FASB
-URI https://asc.fasb.org//1943274/2147479440/944-210-S99-1
Reference 5: http://www.xbrl.org/2009/role/commonPracticeRef
-Topic 946
-SubTopic 210
-Name Accounting Standards Codification
-Section S99
-Paragraph 1
-Subparagraph (SX 210.6-04(12)(b)(1))
-Publisher FASB
-URI https://asc.fasb.org//1943274/2147479617/946-210-S99-1
Reference 6: http://fasb.org/us-gaap/role/ref/legacyRef
-Name Accounting Standards Codification
-Topic 942
-SubTopic 210
-Section S99
-Paragraph 1
-Subparagraph (SX 210.9-03.15)
-Publisher FASB
-URI https://asc.fasb.org//1943274/2147479853/942-210-S99-1
| Name: |
us-gaap_OtherLiabilities |
| Namespace Prefix: |
us-gaap_ |
| Data Type: |
xbrli:monetaryItemType |
| Balance Type: |
credit |
| Period Type: |
instant |
|
| X |
- DefinitionAmount receivable from broker-dealers and clearing organizations, including, but not limited to, securities failed-to-deliver, certain deposits for securities borrowed, open transactions, good faith and margin deposits, commissions and floor brokerage receivables. Reference 1: http://fasb.org/us-gaap/role/ref/legacyRef
-Name Accounting Standards Codification
-Section 45
-Paragraph 3
-SubTopic 20
-Topic 940
-Publisher FASB
-URI https://asc.fasb.org//1943274/2147481833/940-20-45-3
| Name: |
us-gaap_ReceivablesFromBrokersDealersAndClearingOrganizations |
| Namespace Prefix: |
us-gaap_ |
| Data Type: |
xbrli:monetaryItemType |
| Balance Type: |
debit |
| Period Type: |
instant |
|
| X |
- DefinitionLine items represent financial concepts included in a table. These concepts are used to disclose reportable information associated with domain members defined in one or many axes to the table. Reference 1: http://www.xbrl.org/2003/role/disclosureRef
-Topic 810
-SubTopic 10
-Name Accounting Standards Codification
-Section 50
-Paragraph 3
-Subparagraph (c)
-Publisher FASB
-URI https://asc.fasb.org//1943274/2147481203/810-10-50-3
Reference 2: http://www.xbrl.org/2003/role/disclosureRef
-Topic 810
-SubTopic 10
-Name Accounting Standards Codification
-Section 45
-Paragraph 25
-Subparagraph (b)
-Publisher FASB
-URI https://asc.fasb.org//1943274/2147481231/810-10-45-25
Reference 3: http://www.xbrl.org/2003/role/disclosureRef
-Topic 810
-SubTopic 10
-Name Accounting Standards Codification
-Section 50
-Paragraph 3
-Subparagraph (bb)
-Publisher FASB
-URI https://asc.fasb.org//1943274/2147481203/810-10-50-3
Reference 4: http://www.xbrl.org/2003/role/disclosureRef
-Topic 810
-SubTopic 10
-Name Accounting Standards Codification
-Section 45
-Paragraph 25
-Subparagraph (a)
-Publisher FASB
-URI https://asc.fasb.org//1943274/2147481231/810-10-45-25
Reference 5: http://www.xbrl.org/2003/role/disclosureRef
-Topic 860
-SubTopic 30
-Name Accounting Standards Codification
-Section 50
-Paragraph 1A
-Subparagraph (b)(1)(i)
-Publisher FASB
-URI https://asc.fasb.org//1943274/2147481420/860-30-50-1A
Reference 6: http://www.xbrl.org/2003/role/disclosureRef
-Topic 860
-SubTopic 30
-Name Accounting Standards Codification
-Section 50
-Paragraph 1A
-Subparagraph (b)(1)(ii)
-Publisher FASB
-URI https://asc.fasb.org//1943274/2147481420/860-30-50-1A
Reference 7: http://www.xbrl.org/2003/role/disclosureRef
-Topic 860
-SubTopic 30
-Name Accounting Standards Codification
-Section 50
-Paragraph 1A
-Subparagraph (b)(2)
-Publisher FASB
-URI https://asc.fasb.org//1943274/2147481420/860-30-50-1A
| Name: |
us-gaap_VariableInterestEntityLineItems |
| Namespace Prefix: |
us-gaap_ |
| Data Type: |
xbrli:stringItemType |
| Balance Type: |
na |
| Period Type: |
duration |
|
| X |
- Details
| Name: |
srt_ConsolidatedEntitiesAxis=cns_CohenSteersCoInvestmentPartnershipMember |
| Namespace Prefix: |
|
| Data Type: |
na |
| Balance Type: |
|
| Period Type: |
|
|
| X |
- Details
| Name: |
srt_ConsolidatedEntitiesAxis=cns_CohenSteersRealEstateOpportunitiesFundLPMember |
| Namespace Prefix: |
|
| Data Type: |
na |
| Balance Type: |
|
| Period Type: |
|
|
| X |
- Details
| Name: |
srt_ConsolidatedEntitiesAxis=cns_GLISICAVGRPCIPSICAVGREandSICAVRAPMember |
| Namespace Prefix: |
|
| Data Type: |
na |
| Balance Type: |
|
| Period Type: |
|
|
v3.23.2
Fair Value - Fair Value Measurements, Recurring and Nonrecurring (Details) - USD ($)
$ in Thousands |
Jun. 30, 2023 |
Dec. 31, 2022 |
| Fair Value, Assets and Liabilities Measured on Recurring and Nonrecurring Basis [Line Items] |
|
|
| Equity investments at fair value |
$ 161,051
|
$ 157,646
|
| Trading |
27,155
|
15,289
|
| Equity method investments |
21
|
20
|
| Fair Value, Measurements, Recurring |
|
|
| Fair Value, Assets and Liabilities Measured on Recurring and Nonrecurring Basis [Line Items] |
|
|
| Cash equivalents |
133,860
|
208,557
|
| Equity investments at fair value |
|
157,646
|
| Total investments |
188,227
|
172,955
|
| Derivatives - assets: |
850
|
276
|
| Derivatives - liabilities: |
267
|
1,459
|
| Fair Value, Measurements, Recurring | Forward contracts - foreign exchange |
|
|
| Fair Value, Assets and Liabilities Measured on Recurring and Nonrecurring Basis [Line Items] |
|
|
| Derivatives - assets: |
476
|
|
| Derivatives - liabilities: |
18
|
742
|
| Fair Value, Measurements, Recurring | Total Return Swap |
|
|
| Fair Value, Assets and Liabilities Measured on Recurring and Nonrecurring Basis [Line Items] |
|
|
| Derivatives - assets: |
374
|
276
|
| Derivatives - liabilities: |
249
|
717
|
| Fair Value, Measurements, Recurring | Level 1 |
|
|
| Fair Value, Assets and Liabilities Measured on Recurring and Nonrecurring Basis [Line Items] |
|
|
| Cash equivalents |
133,860
|
208,557
|
| Equity investments at fair value |
145,440
|
144,175
|
| Total investments |
145,440
|
144,175
|
| Derivatives - assets: |
0
|
0
|
| Derivatives - liabilities: |
0
|
0
|
| Fair Value, Measurements, Recurring | Level 1 | Forward contracts - foreign exchange |
|
|
| Fair Value, Assets and Liabilities Measured on Recurring and Nonrecurring Basis [Line Items] |
|
|
| Derivatives - liabilities: |
0
|
|
| Fair Value, Measurements, Recurring | Level 1 | Total Return Swap |
|
|
| Fair Value, Assets and Liabilities Measured on Recurring and Nonrecurring Basis [Line Items] |
|
|
| Derivatives - assets: |
0
|
|
| Fair Value, Measurements, Recurring | Level 2 |
|
|
| Fair Value, Assets and Liabilities Measured on Recurring and Nonrecurring Basis [Line Items] |
|
|
| Equity investments at fair value |
108
|
1,036
|
| Total investments |
27,263
|
16,325
|
| Derivatives - assets: |
850
|
276
|
| Derivatives - liabilities: |
267
|
1,459
|
| Fair Value, Measurements, Recurring | Level 2 | Forward contracts - foreign exchange |
|
|
| Fair Value, Assets and Liabilities Measured on Recurring and Nonrecurring Basis [Line Items] |
|
|
| Derivatives - assets: |
476
|
|
| Derivatives - liabilities: |
18
|
742
|
| Fair Value, Measurements, Recurring | Level 2 | Total Return Swap |
|
|
| Fair Value, Assets and Liabilities Measured on Recurring and Nonrecurring Basis [Line Items] |
|
|
| Derivatives - assets: |
374
|
276
|
| Derivatives - liabilities: |
249
|
717
|
| Fair Value, Measurements, Recurring | Level 3 |
|
|
| Fair Value, Assets and Liabilities Measured on Recurring and Nonrecurring Basis [Line Items] |
|
|
| Total investments |
13,986
|
10,759
|
| Fair Value, Measurements, Recurring | Investments Measured at NAV |
|
|
| Fair Value, Assets and Liabilities Measured on Recurring and Nonrecurring Basis [Line Items] |
|
|
| Equity investments at fair value |
1,517
|
1,676
|
| Total investments |
1,538
|
1,696
|
| Common stocks | Fair Value, Measurements, Recurring |
|
|
| Fair Value, Assets and Liabilities Measured on Recurring and Nonrecurring Basis [Line Items] |
|
|
| Equity investments at fair value |
143,489
|
143,255
|
| Common stocks | Fair Value, Measurements, Recurring | Level 1 |
|
|
| Fair Value, Assets and Liabilities Measured on Recurring and Nonrecurring Basis [Line Items] |
|
|
| Equity investments at fair value |
143,489
|
142,268
|
| Common stocks | Fair Value, Measurements, Recurring | Level 2 |
|
|
| Fair Value, Assets and Liabilities Measured on Recurring and Nonrecurring Basis [Line Items] |
|
|
| Equity investments at fair value |
0
|
987
|
| Common stocks | Fair Value, Measurements, Recurring | Investments Measured at NAV |
|
|
| Fair Value, Assets and Liabilities Measured on Recurring and Nonrecurring Basis [Line Items] |
|
|
| Equity investments at fair value |
0
|
|
| Limited partnership interests | Fair Value, Measurements, Recurring |
|
|
| Fair Value, Assets and Liabilities Measured on Recurring and Nonrecurring Basis [Line Items] |
|
|
| Equity investments at fair value |
15,383
|
12,303
|
| Limited partnership interests | Fair Value, Measurements, Recurring | Level 1 |
|
|
| Fair Value, Assets and Liabilities Measured on Recurring and Nonrecurring Basis [Line Items] |
|
|
| Equity investments at fair value |
0
|
0
|
| Limited partnership interests | Fair Value, Measurements, Recurring | Level 2 |
|
|
| Fair Value, Assets and Liabilities Measured on Recurring and Nonrecurring Basis [Line Items] |
|
|
| Equity investments at fair value |
0
|
|
| Limited partnership interests | Fair Value, Measurements, Recurring | Level 3 |
|
|
| Fair Value, Assets and Liabilities Measured on Recurring and Nonrecurring Basis [Line Items] |
|
|
| Equity investments at fair value |
13,986
|
10,759
|
| Limited partnership interests | Fair Value, Measurements, Recurring | Investments Measured at NAV |
|
|
| Fair Value, Assets and Liabilities Measured on Recurring and Nonrecurring Basis [Line Items] |
|
|
| Equity investments at fair value |
1,397
|
1,544
|
| Master limited partnership interests | Fair Value, Measurements, Recurring |
|
|
| Fair Value, Assets and Liabilities Measured on Recurring and Nonrecurring Basis [Line Items] |
|
|
| Equity investments at fair value |
321
|
316
|
| Master limited partnership interests | Fair Value, Measurements, Recurring | Level 1 |
|
|
| Fair Value, Assets and Liabilities Measured on Recurring and Nonrecurring Basis [Line Items] |
|
|
| Equity investments at fair value |
321
|
316
|
| Preferred securities | Fair Value, Measurements, Recurring |
|
|
| Fair Value, Assets and Liabilities Measured on Recurring and Nonrecurring Basis [Line Items] |
|
|
| Equity investments at fair value |
1,523
|
1,440
|
| Preferred securities | Fair Value, Measurements, Recurring | Level 1 |
|
|
| Fair Value, Assets and Liabilities Measured on Recurring and Nonrecurring Basis [Line Items] |
|
|
| Equity investments at fair value |
1,415
|
1,391
|
| Preferred securities | Fair Value, Measurements, Recurring | Level 2 |
|
|
| Fair Value, Assets and Liabilities Measured on Recurring and Nonrecurring Basis [Line Items] |
|
|
| Equity investments at fair value |
108
|
49
|
| Preferred securities | Fair Value, Measurements, Recurring | Investments Measured at NAV |
|
|
| Fair Value, Assets and Liabilities Measured on Recurring and Nonrecurring Basis [Line Items] |
|
|
| Equity investments at fair value |
0
|
|
| Other | Fair Value, Measurements, Recurring |
|
|
| Fair Value, Assets and Liabilities Measured on Recurring and Nonrecurring Basis [Line Items] |
|
|
| Equity investments at fair value |
335
|
332
|
| Other | Fair Value, Measurements, Recurring | Level 1 |
|
|
| Fair Value, Assets and Liabilities Measured on Recurring and Nonrecurring Basis [Line Items] |
|
|
| Equity investments at fair value |
215
|
200
|
| Other | Fair Value, Measurements, Recurring | Level 2 |
|
|
| Fair Value, Assets and Liabilities Measured on Recurring and Nonrecurring Basis [Line Items] |
|
|
| Equity investments at fair value |
0
|
|
| Other | Fair Value, Measurements, Recurring | Investments Measured at NAV |
|
|
| Fair Value, Assets and Liabilities Measured on Recurring and Nonrecurring Basis [Line Items] |
|
|
| Equity investments at fair value |
120
|
132
|
| Fixed income | Fair Value, Measurements, Recurring |
|
|
| Fair Value, Assets and Liabilities Measured on Recurring and Nonrecurring Basis [Line Items] |
|
|
| Trading |
|
15,289
|
| Fixed income | Fair Value, Measurements, Recurring | Level 1 |
|
|
| Fair Value, Assets and Liabilities Measured on Recurring and Nonrecurring Basis [Line Items] |
|
|
| Trading |
0
|
|
| Fixed income | Fair Value, Measurements, Recurring | Level 2 |
|
|
| Fair Value, Assets and Liabilities Measured on Recurring and Nonrecurring Basis [Line Items] |
|
|
| Trading |
27,155
|
15,289
|
| Fixed income | Fair Value, Measurements, Recurring | Investments Measured at NAV |
|
|
| Fair Value, Assets and Liabilities Measured on Recurring and Nonrecurring Basis [Line Items] |
|
|
| Trading |
$ 0
|
$ 0
|
| Equity method investments | Cohen & Steers Global Realty Partners III-TE, L.P. |
|
|
| Fair Value, Assets and Liabilities Measured on Recurring and Nonrecurring Basis [Line Items] |
|
|
| Equity method investment, ownership percentage |
0.20%
|
0.20%
|
| Equity method investments | Cohen & Steers Global Listed Infrastructure Fund L.P. |
|
|
| Fair Value, Assets and Liabilities Measured on Recurring and Nonrecurring Basis [Line Items] |
|
|
| Equity method investment, ownership percentage |
0.01%
|
0.01%
|
| Equity method investments | Fair Value, Measurements, Recurring |
|
|
| Fair Value, Assets and Liabilities Measured on Recurring and Nonrecurring Basis [Line Items] |
|
|
| Equity method investments |
|
$ 20
|
| Equity method investments | Fair Value, Measurements, Recurring | Level 2 |
|
|
| Fair Value, Assets and Liabilities Measured on Recurring and Nonrecurring Basis [Line Items] |
|
|
| Equity method investments |
$ 0
|
0
|
| Equity method investments | Fair Value, Measurements, Recurring | Investments Measured at NAV |
|
|
| Fair Value, Assets and Liabilities Measured on Recurring and Nonrecurring Basis [Line Items] |
|
|
| Equity method investments |
$ 21
|
$ 20
|
| X |
- DefinitionFair value portion of probable future economic benefits obtained or controlled by an entity as a result of past transactions or events. Reference 1: http://fasb.org/us-gaap/role/ref/legacyRef
-Name Accounting Standards Codification
-Topic 820
-SubTopic 10
-Section 50
-Paragraph 2
-Subparagraph (a)
-Publisher FASB
-URI https://asc.fasb.org//1943274/2147482106/820-10-50-2
| Name: |
us-gaap_AssetsFairValueDisclosure |
| Namespace Prefix: |
us-gaap_ |
| Data Type: |
xbrli:monetaryItemType |
| Balance Type: |
debit |
| Period Type: |
instant |
|
| X |
- DefinitionFair value portion of currency on hand as well as demand deposits with banks or financial institutions. Includes other kinds of accounts that have the general characteristics of demand deposits. Also includes short-term, highly liquid investments that are both readily convertible to known amounts of cash and so near their maturity that they present insignificant risk of changes in value because of changes in interest rates.
| Name: |
us-gaap_CashAndCashEquivalentsFairValueDisclosure |
| Namespace Prefix: |
us-gaap_ |
| Data Type: |
xbrli:monetaryItemType |
| Balance Type: |
debit |
| Period Type: |
instant |
|
| X |
- DefinitionFair value, after the effects of master netting arrangements, of a financial asset or other contract with one or more underlyings, notional amount or payment provision or both, and the contract can be net settled by means outside the contract or delivery of an asset. Includes assets not subject to a master netting arrangement and not elected to be offset. Reference 1: http://www.xbrl.org/2003/role/disclosureRef
-Topic 946
-SubTopic 210
-Name Accounting Standards Codification
-Section 50
-Paragraph 12
-Publisher FASB
-URI https://asc.fasb.org//1943274/2147480524/946-210-50-12
Reference 2: http://www.xbrl.org/2003/role/disclosureRef
-Topic 946
-SubTopic 210
-Name Accounting Standards Codification
-Section 50
-Paragraph 6
-Subparagraph (e)
-Publisher FASB
-URI https://asc.fasb.org//1943274/2147480524/946-210-50-6
Reference 3: http://www.xbrl.org/2003/role/exampleRef
-Topic 946
-SubTopic 210
-Name Accounting Standards Codification
-Section 55
-Paragraph 1
-Publisher FASB
-URI https://asc.fasb.org//1943274/2147480493/946-210-55-1
Reference 4: http://www.xbrl.org/2003/role/disclosureRef
-Topic 946
-SubTopic 210
-Name Accounting Standards Codification
-Section 50
-Paragraph 6
-Subparagraph (a)(1)
-Publisher FASB
-URI https://asc.fasb.org//1943274/2147480524/946-210-50-6
Reference 5: http://www.xbrl.org/2003/role/disclosureRef
-Topic 946
-SubTopic 210
-Name Accounting Standards Codification
-Section 50
-Paragraph 6
-Subparagraph (a)(2)
-Publisher FASB
-URI https://asc.fasb.org//1943274/2147480524/946-210-50-6
Reference 6: http://www.xbrl.org/2003/role/disclosureRef
-Topic 946
-SubTopic 210
-Name Accounting Standards Codification
-Section 50
-Paragraph 6
-Subparagraph (a)(4)
-Publisher FASB
-URI https://asc.fasb.org//1943274/2147480524/946-210-50-6
Reference 7: http://www.xbrl.org/2003/role/disclosureRef
-Topic 946
-SubTopic 210
-Name Accounting Standards Codification
-Section 50
-Paragraph 1
-Subparagraph (a)(1)
-Publisher FASB
-URI https://asc.fasb.org//1943274/2147480524/946-210-50-1
Reference 8: http://www.xbrl.org/2003/role/disclosureRef
-Topic 946
-SubTopic 210
-Name Accounting Standards Codification
-Section 50
-Paragraph 1
-Subparagraph (b)(1)
-Publisher FASB
-URI https://asc.fasb.org//1943274/2147480524/946-210-50-1
Reference 9: http://www.xbrl.org/2003/role/disclosureRef
-Topic 946
-SubTopic 210
-Name Accounting Standards Codification
-Section 50
-Paragraph 1
-Subparagraph (b)(2)
-Publisher FASB
-URI https://asc.fasb.org//1943274/2147480524/946-210-50-1
Reference 10: http://www.xbrl.org/2003/role/disclosureRef
-Topic 946
-SubTopic 210
-Name Accounting Standards Codification
-Section 50
-Paragraph 1
-Subparagraph (c)(2)
-Publisher FASB
-URI https://asc.fasb.org//1943274/2147480524/946-210-50-1
Reference 11: http://www.xbrl.org/2003/role/disclosureRef
-Topic 946
-SubTopic 210
-Name Accounting Standards Codification
-Section 50
-Paragraph 6
-Subparagraph (f)
-Publisher FASB
-URI https://asc.fasb.org//1943274/2147480524/946-210-50-6
Reference 12: http://www.xbrl.org/2009/role/commonPracticeRef
-Topic 946
-SubTopic 210
-Name Accounting Standards Codification
-Section 50
-Paragraph 6
-Subparagraph (a)(3)
-Publisher FASB
-URI https://asc.fasb.org//1943274/2147480524/946-210-50-6
Reference 13: http://www.xbrl.org/2003/role/disclosureRef
-Topic 946
-SubTopic 210
-Name Accounting Standards Codification
-Section S99
-Paragraph 1
-Subparagraph (SX 210.6-04(3)(c))
-Publisher FASB
-URI https://asc.fasb.org//1943274/2147479617/946-210-S99-1
Reference 14: http://www.xbrl.org/2003/role/disclosureRef
-Topic 946
-SubTopic 320
-Name Accounting Standards Codification
-Section S99
-Paragraph 5C
-Subparagraph (SX 210.12-13C(Column H)(Footnote 7))
-Publisher FASB
-URI https://asc.fasb.org//1943274/2147480032/946-320-S99-5C
Reference 15: http://www.xbrl.org/2003/role/disclosureRef
-Topic 946
-SubTopic 210
-Name Accounting Standards Codification
-Section S99
-Paragraph 1
-Subparagraph (SX 210.6-04(3)(b))
-Publisher FASB
-URI https://asc.fasb.org//1943274/2147479617/946-210-S99-1
Reference 16: http://www.xbrl.org/2003/role/disclosureRef
-Topic 946
-SubTopic 320
-Name Accounting Standards Codification
-Section S99
-Paragraph 5
-Subparagraph (SX 210.12-13(Column A)(Footnote 3))
-Publisher FASB
-URI https://asc.fasb.org//1943274/2147480032/946-320-S99-5
Reference 17: http://www.xbrl.org/2003/role/disclosureRef
-Topic 946
-SubTopic 320
-Name Accounting Standards Codification
-Section S99
-Paragraph 5C
-Subparagraph (SX 210.12-13C(Column H))
-Publisher FASB
-URI https://asc.fasb.org//1943274/2147480032/946-320-S99-5C
Reference 18: http://www.xbrl.org/2003/role/disclosureRef
-Topic 946
-SubTopic 320
-Name Accounting Standards Codification
-Section S99
-Paragraph 5A
-Subparagraph (SX 210.12-13A(Column E))
-Publisher FASB
-URI https://asc.fasb.org//1943274/2147480032/946-320-S99-5A
Reference 19: http://www.xbrl.org/2003/role/disclosureRef
-Topic 946
-SubTopic 320
-Name Accounting Standards Codification
-Section S99
-Paragraph 5B
-Subparagraph (SX 210.12-13B(Column E))
-Publisher FASB
-URI https://asc.fasb.org//1943274/2147480032/946-320-S99-5B
Reference 20: http://www.xbrl.org/2003/role/disclosureRef
-Topic 946
-SubTopic 320
-Name Accounting Standards Codification
-Section S99
-Paragraph 5B
-Subparagraph (SX 210.12-13B(Column E)(Footnote 4))
-Publisher FASB
-URI https://asc.fasb.org//1943274/2147480032/946-320-S99-5B
Reference 21: http://www.xbrl.org/2003/role/disclosureRef
-Topic 210
-SubTopic 20
-Name Accounting Standards Codification
-Section 50
-Paragraph 3
-Subparagraph (c)
-Publisher FASB
-URI https://asc.fasb.org//1943274/2147483466/210-20-50-3
Reference 22: http://www.xbrl.org/2003/role/exampleRef
-Topic 210
-SubTopic 20
-Name Accounting Standards Codification
-Section 55
-Paragraph 22
-Publisher FASB
-URI https://asc.fasb.org//1943274/2147483444/210-20-55-22
Reference 23: http://www.xbrl.org/2003/role/disclosureRef
-Topic 210
-SubTopic 20
-Name Accounting Standards Codification
-Section 55
-Paragraph 10
-Publisher FASB
-URI https://asc.fasb.org//1943274/2147483444/210-20-55-10
Reference 24: http://www.xbrl.org/2003/role/disclosureRef
-Topic 825
-SubTopic 10
-Name Accounting Standards Codification
-Section 50
-Paragraph 10
-Publisher FASB
-URI https://asc.fasb.org//1943274/2147482907/825-10-50-10
| Name: |
us-gaap_DerivativeAssets |
| Namespace Prefix: |
us-gaap_ |
| Data Type: |
xbrli:monetaryItemType |
| Balance Type: |
debit |
| Period Type: |
instant |
|
| X |
- DefinitionFair value, after the effects of master netting arrangements, of a financial liability or contract with one or more underlyings, notional amount or payment provision or both, and the contract can be net settled by means outside the contract or delivery of an asset. Includes liabilities not subject to a master netting arrangement and not elected to be offset. Reference 1: http://www.xbrl.org/2003/role/disclosureRef
-Topic 946
-SubTopic 210
-Name Accounting Standards Codification
-Section 50
-Paragraph 6
-Subparagraph (e)
-Publisher FASB
-URI https://asc.fasb.org//1943274/2147480524/946-210-50-6
Reference 2: http://www.xbrl.org/2003/role/disclosureRef
-Topic 946
-SubTopic 210
-Name Accounting Standards Codification
-Section 50
-Paragraph 6
-Subparagraph (a)(1)
-Publisher FASB
-URI https://asc.fasb.org//1943274/2147480524/946-210-50-6
Reference 3: http://www.xbrl.org/2003/role/disclosureRef
-Topic 946
-SubTopic 210
-Name Accounting Standards Codification
-Section 50
-Paragraph 6
-Subparagraph (a)(2)
-Publisher FASB
-URI https://asc.fasb.org//1943274/2147480524/946-210-50-6
Reference 4: http://www.xbrl.org/2003/role/disclosureRef
-Topic 946
-SubTopic 210
-Name Accounting Standards Codification
-Section 50
-Paragraph 6
-Subparagraph (a)(4)
-Publisher FASB
-URI https://asc.fasb.org//1943274/2147480524/946-210-50-6
Reference 5: http://www.xbrl.org/2003/role/disclosureRef
-Topic 946
-SubTopic 210
-Name Accounting Standards Codification
-Section 50
-Paragraph 1
-Subparagraph (a)(1)
-Publisher FASB
-URI https://asc.fasb.org//1943274/2147480524/946-210-50-1
Reference 6: http://www.xbrl.org/2003/role/disclosureRef
-Topic 946
-SubTopic 210
-Name Accounting Standards Codification
-Section 50
-Paragraph 1
-Subparagraph (b)(1)
-Publisher FASB
-URI https://asc.fasb.org//1943274/2147480524/946-210-50-1
Reference 7: http://www.xbrl.org/2003/role/disclosureRef
-Topic 946
-SubTopic 210
-Name Accounting Standards Codification
-Section 50
-Paragraph 1
-Subparagraph (b)(2)
-Publisher FASB
-URI https://asc.fasb.org//1943274/2147480524/946-210-50-1
Reference 8: http://www.xbrl.org/2003/role/disclosureRef
-Topic 946
-SubTopic 210
-Name Accounting Standards Codification
-Section 50
-Paragraph 1
-Subparagraph (c)(2)
-Publisher FASB
-URI https://asc.fasb.org//1943274/2147480524/946-210-50-1
Reference 9: http://www.xbrl.org/2003/role/disclosureRef
-Topic 946
-SubTopic 210
-Name Accounting Standards Codification
-Section 50
-Paragraph 6
-Subparagraph (f)
-Publisher FASB
-URI https://asc.fasb.org//1943274/2147480524/946-210-50-6
Reference 10: http://www.xbrl.org/2009/role/commonPracticeRef
-Topic 946
-SubTopic 210
-Name Accounting Standards Codification
-Section 50
-Paragraph 6
-Subparagraph (a)(3)
-Publisher FASB
-URI https://asc.fasb.org//1943274/2147480524/946-210-50-6
Reference 11: http://www.xbrl.org/2003/role/disclosureRef
-Topic 946
-SubTopic 210
-Name Accounting Standards Codification
-Section S99
-Paragraph 1
-Subparagraph (SX 210.6-04(9)(e))
-Publisher FASB
-URI https://asc.fasb.org//1943274/2147479617/946-210-S99-1
Reference 12: http://www.xbrl.org/2003/role/disclosureRef
-Topic 946
-SubTopic 320
-Name Accounting Standards Codification
-Section S99
-Paragraph 5C
-Subparagraph (SX 210.12-13C(Column H)(Footnote 7))
-Publisher FASB
-URI https://asc.fasb.org//1943274/2147480032/946-320-S99-5C
Reference 13: http://www.xbrl.org/2003/role/disclosureRef
-Topic 946
-SubTopic 210
-Name Accounting Standards Codification
-Section S99
-Paragraph 1
-Subparagraph (SX 210.6-04(9)(b))
-Publisher FASB
-URI https://asc.fasb.org//1943274/2147479617/946-210-S99-1
Reference 14: http://www.xbrl.org/2003/role/disclosureRef
-Topic 946
-SubTopic 210
-Name Accounting Standards Codification
-Section S99
-Paragraph 1
-Subparagraph (SX 210.6-04(9)(d))
-Publisher FASB
-URI https://asc.fasb.org//1943274/2147479617/946-210-S99-1
Reference 15: http://www.xbrl.org/2003/role/disclosureRef
-Topic 946
-SubTopic 320
-Name Accounting Standards Codification
-Section S99
-Paragraph 5
-Subparagraph (SX 210.12-13(Column G)(Footnote 8))
-Publisher FASB
-URI https://asc.fasb.org//1943274/2147480032/946-320-S99-5
Reference 16: http://www.xbrl.org/2003/role/disclosureRef
-Topic 946
-SubTopic 320
-Name Accounting Standards Codification
-Section S99
-Paragraph 5C
-Subparagraph (SX 210.12-13C(Column H))
-Publisher FASB
-URI https://asc.fasb.org//1943274/2147480032/946-320-S99-5C
Reference 17: http://www.xbrl.org/2003/role/disclosureRef
-Topic 946
-SubTopic 320
-Name Accounting Standards Codification
-Section S99
-Paragraph 5
-Subparagraph (SX 210.12-13(Column G))
-Publisher FASB
-URI https://asc.fasb.org//1943274/2147480032/946-320-S99-5
Reference 18: http://www.xbrl.org/2003/role/disclosureRef
-Topic 946
-SubTopic 320
-Name Accounting Standards Codification
-Section S99
-Paragraph 5A
-Subparagraph (SX 210.12-13A(Column E))
-Publisher FASB
-URI https://asc.fasb.org//1943274/2147480032/946-320-S99-5A
Reference 19: http://www.xbrl.org/2003/role/disclosureRef
-Topic 946
-SubTopic 320
-Name Accounting Standards Codification
-Section S99
-Paragraph 5B
-Subparagraph (SX 210.12-13B(Column E))
-Publisher FASB
-URI https://asc.fasb.org//1943274/2147480032/946-320-S99-5B
Reference 20: http://www.xbrl.org/2003/role/disclosureRef
-Topic 946
-SubTopic 320
-Name Accounting Standards Codification
-Section S99
-Paragraph 5B
-Subparagraph (SX 210.12-13B(Column E)(Footnote 4))
-Publisher FASB
-URI https://asc.fasb.org//1943274/2147480032/946-320-S99-5B
Reference 21: http://www.xbrl.org/2003/role/disclosureRef
-Topic 210
-SubTopic 20
-Name Accounting Standards Codification
-Section 50
-Paragraph 3
-Subparagraph (c)
-Publisher FASB
-URI https://asc.fasb.org//1943274/2147483466/210-20-50-3
Reference 22: http://www.xbrl.org/2003/role/exampleRef
-Topic 210
-SubTopic 20
-Name Accounting Standards Codification
-Section 55
-Paragraph 22
-Publisher FASB
-URI https://asc.fasb.org//1943274/2147483444/210-20-55-22
Reference 23: http://www.xbrl.org/2003/role/disclosureRef
-Topic 210
-SubTopic 20
-Name Accounting Standards Codification
-Section 55
-Paragraph 10
-Publisher FASB
-URI https://asc.fasb.org//1943274/2147483444/210-20-55-10
Reference 24: http://www.xbrl.org/2003/role/disclosureRef
-Topic 825
-SubTopic 10
-Name Accounting Standards Codification
-Section 50
-Paragraph 10
-Publisher FASB
-URI https://asc.fasb.org//1943274/2147482907/825-10-50-10
| Name: |
us-gaap_DerivativeLiabilities |
| Namespace Prefix: |
us-gaap_ |
| Data Type: |
xbrli:monetaryItemType |
| Balance Type: |
credit |
| Period Type: |
instant |
|
| X |
- DefinitionThe percentage of ownership of common stock or equity participation in the investee accounted for under the equity method of accounting. Reference 1: http://www.xbrl.org/2003/role/disclosureRef
-Topic 323
-SubTopic 10
-Name Accounting Standards Codification
-Section 50
-Paragraph 3
-Subparagraph (a)(1)
-Publisher FASB
-URI https://asc.fasb.org//1943274/2147481687/323-10-50-3
| Name: |
us-gaap_EquityMethodInvestmentOwnershipPercentage |
| Namespace Prefix: |
us-gaap_ |
| Data Type: |
dtr-types:percentItemType |
| Balance Type: |
na |
| Period Type: |
instant |
|
| X |
- DefinitionThis item represents the carrying amount on the entity's balance sheet of its investment in common stock of an equity method investee. This is not an indicator of the fair value of the investment, rather it is the initial cost adjusted for the entity's share of earnings and losses of the investee, adjusted for any distributions (dividends) and other than temporary impairment (OTTI) losses recognized. Reference 1: http://www.xbrl.org/2003/role/disclosureRef
-Topic 323
-SubTopic 10
-Name Accounting Standards Codification
-Section 45
-Paragraph 1
-Publisher FASB
-URI https://asc.fasb.org//1943274/2147481664/323-10-45-1
Reference 2: http://www.xbrl.org/2009/role/commonPracticeRef
-Topic 323
-SubTopic 10
-Name Accounting Standards Codification
-Section 50
-Paragraph 3
-Subparagraph (a)(3)
-Publisher FASB
-URI https://asc.fasb.org//1943274/2147481687/323-10-50-3
Reference 3: http://www.xbrl.org/2009/role/commonPracticeRef
-Topic 210
-SubTopic 10
-Name Accounting Standards Codification
-Section S99
-Paragraph 1
-Subparagraph (SX 210.5-02(10))
-Publisher FASB
-URI https://asc.fasb.org//1943274/2147480566/210-10-S99-1
Reference 4: http://www.xbrl.org/2003/role/disclosureRef
-Topic 280
-SubTopic 10
-Name Accounting Standards Codification
-Section 50
-Paragraph 25
-Subparagraph (a)
-Publisher FASB
-URI https://asc.fasb.org//1943274/2147482810/280-10-50-25
| Name: |
us-gaap_EquityMethodInvestments |
| Namespace Prefix: |
us-gaap_ |
| Data Type: |
xbrli:monetaryItemType |
| Balance Type: |
debit |
| Period Type: |
instant |
|
| X |
- DefinitionAmount of investment in equity security measured at fair value with change in fair value recognized in net income (FV-NI), classified as current. Reference 1: http://www.xbrl.org/2003/role/disclosureRef
-Topic 210
-SubTopic 10
-Name Accounting Standards Codification
-Section S99
-Paragraph 1
-Subparagraph (SX 210.5-02(2))
-Publisher FASB
-URI https://asc.fasb.org//1943274/2147480566/210-10-S99-1
Reference 2: http://www.xbrl.org/2003/role/exampleRef
-Topic 210
-SubTopic 10
-Name Accounting Standards Codification
-Section 45
-Paragraph 1
-Subparagraph (f)
-Publisher FASB
-URI https://asc.fasb.org//1943274/2147483467/210-10-45-1
Reference 3: http://www.xbrl.org/2003/role/disclosureRef
-Topic 825
-SubTopic 10
-Name Accounting Standards Codification
-Section 45
-Paragraph 1A
-Publisher FASB
-URI https://asc.fasb.org//1943274/2147482736/825-10-45-1A
| Name: |
us-gaap_EquitySecuritiesFvNi |
| Namespace Prefix: |
us-gaap_ |
| Data Type: |
xbrli:monetaryItemType |
| Balance Type: |
debit |
| Period Type: |
instant |
|
| X |
- DefinitionLine items represent financial concepts included in a table. These concepts are used to disclose reportable information associated with domain members defined in one or many axes to the table. Reference 1: http://www.xbrl.org/2003/role/disclosureRef
-Topic 820
-SubTopic 10
-Name Accounting Standards Codification
-Section 50
-Paragraph 2
-Subparagraph (a)
-Publisher FASB
-URI https://asc.fasb.org//1943274/2147482106/820-10-50-2
Reference 2: http://www.xbrl.org/2003/role/disclosureRef
-Topic 820
-SubTopic 10
-Name Accounting Standards Codification
-Section 50
-Paragraph 2
-Subparagraph (b)
-Publisher FASB
-URI https://asc.fasb.org//1943274/2147482106/820-10-50-2
Reference 3: http://www.xbrl.org/2003/role/disclosureRef
-Topic 820
-SubTopic 10
-Name Accounting Standards Codification
-Section 50
-Paragraph 3
-Publisher FASB
-URI https://asc.fasb.org//1943274/2147482106/820-10-50-3
| Name: |
us-gaap_FairValueAssetsAndLiabilitiesMeasuredOnRecurringAndNonrecurringBasisLineItems |
| Namespace Prefix: |
us-gaap_ |
| Data Type: |
xbrli:stringItemType |
| Balance Type: |
na |
| Period Type: |
duration |
|
| X |
- DefinitionAmount of investment in debt security measured at fair value with change in fair value recognized in net income (trading). Reference 1: http://www.xbrl.org/2009/role/commonPracticeRef
-Topic 320
-SubTopic 10
-Name Accounting Standards Codification
-Section 45
-Paragraph 1
-Subparagraph (b)
-Publisher FASB
-URI https://asc.fasb.org//1943274/2147481830/320-10-45-1
Reference 2: http://www.xbrl.org/2003/role/disclosureRef
-Topic 210
-SubTopic 10
-Name Accounting Standards Codification
-Section S99
-Paragraph 1
-Subparagraph (SX 210.5-02(2))
-Publisher FASB
-URI https://asc.fasb.org//1943274/2147480566/210-10-S99-1
Reference 3: http://www.xbrl.org/2003/role/exampleRef
-Topic 210
-SubTopic 10
-Name Accounting Standards Codification
-Section 45
-Paragraph 1
-Subparagraph (f)
-Publisher FASB
-URI https://asc.fasb.org//1943274/2147483467/210-10-45-1
| Name: |
us-gaap_TradingSecuritiesDebt |
| Namespace Prefix: |
us-gaap_ |
| Data Type: |
xbrli:monetaryItemType |
| Balance Type: |
debit |
| Period Type: |
instant |
|
| X |
- Details
| Name: |
us-gaap_FairValueByMeasurementFrequencyAxis=us-gaap_FairValueMeasurementsRecurringMember |
| Namespace Prefix: |
|
| Data Type: |
na |
| Balance Type: |
|
| Period Type: |
|
|
| X |
- Details
| Name: |
us-gaap_DerivativeInstrumentRiskAxis=us-gaap_ForeignExchangeContractMember |
| Namespace Prefix: |
|
| Data Type: |
na |
| Balance Type: |
|
| Period Type: |
|
|
| X |
- Details
| Name: |
us-gaap_DerivativeInstrumentRiskAxis=us-gaap_TotalReturnSwapMember |
| Namespace Prefix: |
|
| Data Type: |
na |
| Balance Type: |
|
| Period Type: |
|
|
| X |
- Details
| Name: |
us-gaap_FairValueByFairValueHierarchyLevelAxis=us-gaap_FairValueMeasuredAtNetAssetValuePerShareMember |
| Namespace Prefix: |
|
| Data Type: |
na |
| Balance Type: |
|
| Period Type: |
|
|
| X |
- Details
| Name: |
us-gaap_FinancialInstrumentAxis=us-gaap_CommonStockMember |
| Namespace Prefix: |
|
| Data Type: |
na |
| Balance Type: |
|
| Period Type: |
|
|
| X |
- Details
| Name: |
us-gaap_FinancialInstrumentAxis=srt_PartnershipInterestMember |
| Namespace Prefix: |
|
| Data Type: |
na |
| Balance Type: |
|
| Period Type: |
|
|
| X |
- Details
| Name: |
us-gaap_FinancialInstrumentAxis=us-gaap_LimitedPartnerMember |
| Namespace Prefix: |
|
| Data Type: |
na |
| Balance Type: |
|
| Period Type: |
|
|
| X |
- Details
| Name: |
us-gaap_FinancialInstrumentAxis=us-gaap_PreferredStockMember |
| Namespace Prefix: |
|
| Data Type: |
na |
| Balance Type: |
|
| Period Type: |
|
|
| X |
- Details
| Name: |
us-gaap_FinancialInstrumentAxis=us-gaap_OtherInvestmentsMember |
| Namespace Prefix: |
|
| Data Type: |
na |
| Balance Type: |
|
| Period Type: |
|
|
| X |
- Details
| Name: |
us-gaap_FinancialInstrumentAxis=us-gaap_FixedIncomeSecuritiesMember |
| Namespace Prefix: |
|
| Data Type: |
na |
| Balance Type: |
|
| Period Type: |
|
|
| X |
- Details
| Name: |
us-gaap_InvestmentTypeAxis=us-gaap_EquityMethodInvestmentsMember |
| Namespace Prefix: |
|
| Data Type: |
na |
| Balance Type: |
|
| Period Type: |
|
|
| X |
- Details
| Name: |
srt_ScheduleOfEquityMethodInvestmentEquityMethodInvesteeNameAxis=cns_CohenSteersGlobalRealtyPartnersIIITELPMember |
| Namespace Prefix: |
|
| Data Type: |
na |
| Balance Type: |
|
| Period Type: |
|
|
| X |
- Details
| Name: |
srt_ScheduleOfEquityMethodInvestmentEquityMethodInvesteeNameAxis=cns_CohenSteersGlobalListedInfrastructureFundLPMember |
| Namespace Prefix: |
|
| Data Type: |
na |
| Balance Type: |
|
| Period Type: |
|
|
v3.23.2
Fair Value - Fiar Value, Assets Measured on Recurring Basis, Unobservable Input Reconciliation (Details) - USD ($)
$ in Thousands |
3 Months Ended |
6 Months Ended |
Jun. 30, 2023 |
Jun. 30, 2022 |
Jun. 30, 2023 |
Jun. 30, 2022 |
| Fair Value Disclosures [Abstract] |
|
|
|
|
| Balance at beginning of period |
$ 13,633
|
$ 17,753
|
$ 10,759
|
$ 0
|
| Purchases/contributions |
4,625
|
0
|
7,517
|
19,380
|
| Sales/distributions |
(2,975)
|
0
|
(2,975)
|
0
|
| Unrealized gains (losses) |
(1,297)
|
839
|
(1,315)
|
(788)
|
| Balance at end of period |
$ 13,986
|
$ 18,592
|
$ 13,986
|
$ 18,592
|
| X |
- DefinitionAmount of unrealized gain (loss) recognized in income from asset measured at fair value on recurring basis using unobservable input (level 3) and still held. Reference 1: http://www.xbrl.org/2003/role/disclosureRef
-Topic 820
-SubTopic 10
-Name Accounting Standards Codification
-Section 50
-Paragraph 2
-Subparagraph (d)
-Publisher FASB
-URI https://asc.fasb.org//1943274/2147482106/820-10-50-2
| Name: |
us-gaap_FairValueAssetsMeasuredOnRecurringBasisChangeInUnrealizedGainLoss |
| Namespace Prefix: |
us-gaap_ |
| Data Type: |
xbrli:monetaryItemType |
| Balance Type: |
credit |
| Period Type: |
duration |
|
| X |
- References
+ Details
| Name: |
us-gaap_FairValueDisclosuresAbstract |
| Namespace Prefix: |
us-gaap_ |
| Data Type: |
xbrli:stringItemType |
| Balance Type: |
na |
| Period Type: |
duration |
|
v3.23.2
Fair Value - Valuation Techniques (Details)
$ in Thousands |
Jun. 30, 2023
USD ($)
|
Mar. 31, 2023
USD ($)
|
Dec. 31, 2022
USD ($)
|
Jun. 30, 2022
USD ($)
|
Mar. 31, 2022
USD ($)
|
Dec. 31, 2021
USD ($)
|
| Fair Value Measurement Inputs and Valuation Techniques [Line Items] |
|
|
|
|
|
|
| Limited partnership interest |
$ 13,986
|
$ 13,633
|
$ 10,759
|
$ 18,592
|
$ 17,753
|
$ 0
|
| Level 3 | Discount Rate |
|
|
|
|
|
|
| Fair Value Measurement Inputs and Valuation Techniques [Line Items] |
|
|
|
|
|
|
| Measurement input |
0.0875
|
|
0.0875
|
|
|
|
| Level 3 | Terminal Capitalization Rate |
|
|
|
|
|
|
| Fair Value Measurement Inputs and Valuation Techniques [Line Items] |
|
|
|
|
|
|
| Measurement input |
0.0725
|
|
0.0725
|
|
|
|
| X |
- DefinitionLine items represent financial concepts included in a table. These concepts are used to disclose reportable information associated with domain members defined in one or many axes to the table.
| Name: |
us-gaap_FairValueAssetsAndLiabilitiesMeasuredOnRecurringAndNonrecurringBasisValuationTechniquesLineItems |
| Namespace Prefix: |
us-gaap_ |
| Data Type: |
xbrli:stringItemType |
| Balance Type: |
na |
| Period Type: |
duration |
|
v3.23.2
Derivatives (Details) - USD ($)
$ in Thousands |
3 Months Ended |
6 Months Ended |
|
Jun. 30, 2023 |
Jun. 30, 2022 |
Jun. 30, 2023 |
Jun. 30, 2022 |
Dec. 31, 2022 |
| Derivative [Line Items] |
|
|
|
|
|
|
| Due to brokers |
[1] |
$ 1,257
|
|
$ 1,257
|
|
$ 835
|
| Derivative, gains (losses) on derivative, net |
|
744
|
$ 1,697
|
523
|
$ 6,738
|
|
| Corporate, Non-Segment |
|
|
|
|
|
|
| Derivative [Line Items] |
|
|
|
|
|
|
| Notional amount, long |
|
2,330
|
|
2,330
|
|
2,340
|
| Notional amount, short |
|
51,035
|
|
51,035
|
|
43,447
|
| Derivative assets, fair value |
|
850
|
|
850
|
|
276
|
| Derivative liabilities, fair value |
|
267
|
|
267
|
|
1,459
|
| Derivative, gains (losses) on derivative, net |
|
744
|
2,849
|
523
|
3,578
|
|
| Forward contracts - foreign exchange |
|
|
|
|
|
|
| Derivative [Line Items] |
|
|
|
|
|
|
| Notional amount, long |
|
0
|
|
0
|
|
0
|
| Notional amount, short |
|
10,039
|
|
10,039
|
|
9,810
|
| Derivative assets, fair value |
|
476
|
|
476
|
|
0
|
| Derivative liabilities, fair value |
|
18
|
|
18
|
|
742
|
| Derivative, gains (losses) on derivative, net |
|
769
|
(420)
|
1,200
|
390
|
|
| Total Return Swap |
|
|
|
|
|
|
| Derivative [Line Items] |
|
|
|
|
|
|
| Notional amount, long |
|
2,330
|
|
2,330
|
|
2,340
|
| Notional amount, short |
|
40,996
|
|
40,996
|
|
33,637
|
| Derivative assets, fair value |
|
374
|
|
374
|
|
276
|
| Derivative liabilities, fair value |
|
249
|
|
249
|
|
717
|
| Derivative, gains (losses) on derivative, net |
|
(25)
|
3,269
|
(677)
|
3,188
|
|
| Total Return Swap | Consolidation, Eliminations |
|
|
|
|
|
|
| Derivative [Line Items] |
|
|
|
|
|
|
| Derivative, gains (losses) on derivative, net |
|
0
|
$ (1,152)
|
0
|
$ 3,160
|
|
| Cash |
|
|
|
|
|
|
| Derivative [Line Items] |
|
|
|
|
|
|
| Due to brokers |
|
600
|
|
600
|
|
|
| Cash | Asset Pledged as Collateral |
|
|
|
|
|
|
| Derivative [Line Items] |
|
|
|
|
|
|
| Trading investments and pledged as collateral |
|
$ 1,700
|
|
$ 1,700
|
|
$ 2,200
|
|
|
| X |
- DefinitionAmount payable to other broker-dealer and clearing organization, including, but not limited to, security failed-to-receive, deposit received for security loaned, open transaction, and floor-brokerage payable. Reference 1: http://www.xbrl.org/2009/role/commonPracticeRef
-Name Rule 15c3-1
-Number 240
-Section 15c3-1
-Publisher SEC
| Name: |
srt_PayablesToBrokerDealersAndClearingOrganizations |
| Namespace Prefix: |
srt_ |
| Data Type: |
xbrli:monetaryItemType |
| Balance Type: |
credit |
| Period Type: |
instant |
|
| X |
- DefinitionNominal or face amount used to calculate payments on the derivative asset. Reference 1: http://www.xbrl.org/2003/role/disclosureRef
-Topic 946
-SubTopic 320
-Name Accounting Standards Codification
-Section S99
-Paragraph 5
-Subparagraph (SX 210.12-13(Column A)(Footnote 3))
-Publisher FASB
-URI https://asc.fasb.org//1943274/2147480032/946-320-S99-5
Reference 2: http://www.xbrl.org/2003/role/disclosureRef
-Topic 946
-SubTopic 320
-Name Accounting Standards Codification
-Section S99
-Paragraph 5C
-Subparagraph (SX 210.12-13C(Column E))
-Publisher FASB
-URI https://asc.fasb.org//1943274/2147480032/946-320-S99-5C
Reference 3: http://www.xbrl.org/2003/role/disclosureRef
-Topic 946
-SubTopic 320
-Name Accounting Standards Codification
-Section S99
-Paragraph 5A
-Subparagraph (SX 210.12-13A(Column D))
-Publisher FASB
-URI https://asc.fasb.org//1943274/2147480032/946-320-S99-5A
Reference 4: http://www.xbrl.org/2003/role/disclosureRef
-Topic 946
-SubTopic 320
-Name Accounting Standards Codification
-Section S99
-Paragraph 5B
-Subparagraph (SX 210.12-13B(Column B))
-Publisher FASB
-URI https://asc.fasb.org//1943274/2147480032/946-320-S99-5B
Reference 5: http://www.xbrl.org/2009/role/commonPracticeRef
-Topic 815
-SubTopic 10
-Name Accounting Standards Codification
-Section 50
-Paragraph 1B
-Publisher FASB
-URI https://asc.fasb.org//1943274/2147480434/815-10-50-1B
Reference 6: http://www.xbrl.org/2009/role/commonPracticeRef
-Topic 815
-SubTopic 10
-Name Accounting Standards Codification
-Section 50
-Paragraph 1A
-Subparagraph (d)
-Publisher FASB
-URI https://asc.fasb.org//1943274/2147480434/815-10-50-1A
Reference 7: http://www.xbrl.org/2009/role/commonPracticeRef
-Topic 815
-SubTopic 10
-Name Accounting Standards Codification
-Section 50
-Paragraph 1A
-Subparagraph (b)
-Publisher FASB
-URI https://asc.fasb.org//1943274/2147480434/815-10-50-1A
| Name: |
us-gaap_DerivativeAssetNotionalAmount |
| Namespace Prefix: |
us-gaap_ |
| Data Type: |
xbrli:monetaryItemType |
| Balance Type: |
na |
| Period Type: |
instant |
|
| X |
- DefinitionFair value, after offset of derivative liability, of financial asset or other contract with one or more underlyings, notional amount or payment provision or both, and the contract can be net settled by means outside the contract or delivery of an asset, before offset against an obligation to return collateral under a master netting arrangement. Includes assets elected not to be offset. Excludes assets not subject to a master netting arrangement. Reference 1: http://fasb.org/us-gaap/role/ref/legacyRef
-Name Accounting Standards Codification
-Section 55
-Paragraph 9
-SubTopic 20
-Topic 210
-Publisher FASB
-URI https://asc.fasb.org//1943274/2147483444/210-20-55-9
Reference 2: http://fasb.org/us-gaap/role/ref/legacyRef
-Name Accounting Standards Codification
-Section 50
-Paragraph 3
-Subparagraph (c)
-SubTopic 20
-Topic 210
-Publisher FASB
-URI https://asc.fasb.org//1943274/2147483466/210-20-50-3
Reference 3: http://fasb.org/us-gaap/role/ref/legacyRef
-Name Accounting Standards Codification
-Section 55
-Paragraph 10
-SubTopic 20
-Topic 210
-Publisher FASB
-URI https://asc.fasb.org//1943274/2147483444/210-20-55-10
Reference 4: http://fasb.org/us-gaap/role/ref/legacyRef
-Name Accounting Standards Codification
-Topic 815
-SubTopic 10
-Section 50
-Paragraph 8
-Subparagraph (c)
-Publisher FASB
-URI https://asc.fasb.org//1943274/2147480434/815-10-50-8
| Name: |
us-gaap_DerivativeFairValueOfDerivativeAssetAmountNotOffsetAgainstCollateral |
| Namespace Prefix: |
us-gaap_ |
| Data Type: |
xbrli:monetaryItemType |
| Balance Type: |
debit |
| Period Type: |
instant |
|
| X |
- DefinitionFair value, after offset of derivative asset, of financial liability or contract with one or more underlyings, notional amount or payment provision or both, and the contract can be net settled by means outside the contract or delivery of an asset, elected not to be and before offset against a right to receive collateral under a master netting arrangement. Includes liabilities elected not to be offset. Excludes liabilities not subject to a master netting arrangement. Reference 1: http://fasb.org/us-gaap/role/ref/legacyRef
-Name Accounting Standards Codification
-Section 55
-Paragraph 9
-SubTopic 20
-Topic 210
-Publisher FASB
-URI https://asc.fasb.org//1943274/2147483444/210-20-55-9
Reference 2: http://fasb.org/us-gaap/role/ref/legacyRef
-Name Accounting Standards Codification
-Section 50
-Paragraph 3
-Subparagraph (c)
-SubTopic 20
-Topic 210
-Publisher FASB
-URI https://asc.fasb.org//1943274/2147483466/210-20-50-3
Reference 3: http://fasb.org/us-gaap/role/ref/legacyRef
-Name Accounting Standards Codification
-Section 55
-Paragraph 10
-SubTopic 20
-Topic 210
-Publisher FASB
-URI https://asc.fasb.org//1943274/2147483444/210-20-55-10
Reference 4: http://fasb.org/us-gaap/role/ref/legacyRef
-Name Accounting Standards Codification
-Topic 815
-SubTopic 10
-Section 50
-Paragraph 8
-Subparagraph (c)
-Publisher FASB
-URI https://asc.fasb.org//1943274/2147480434/815-10-50-8
| Name: |
us-gaap_DerivativeFairValueOfDerivativeLiabilityAmountNotOffsetAgainstCollateral |
| Namespace Prefix: |
us-gaap_ |
| Data Type: |
xbrli:monetaryItemType |
| Balance Type: |
credit |
| Period Type: |
instant |
|
| X |
- DefinitionAmount of increase (decrease) in the fair value of derivatives recognized in the income statement. Reference 1: http://www.xbrl.org/2009/role/commonPracticeRef
-Topic 815
-SubTopic 10
-Name Accounting Standards Codification
-Section 50
-Paragraph 4A
-Subparagraph (b)(1)
-Publisher FASB
-URI https://asc.fasb.org//1943274/2147480434/815-10-50-4A
| Name: |
us-gaap_DerivativeGainLossOnDerivativeNet |
| Namespace Prefix: |
us-gaap_ |
| Data Type: |
xbrli:monetaryItemType |
| Balance Type: |
credit |
| Period Type: |
duration |
|
| X |
- DefinitionNominal or face amount used to calculate payments on the derivative liability. Reference 1: http://www.xbrl.org/2003/role/disclosureRef
-Topic 946
-SubTopic 320
-Name Accounting Standards Codification
-Section S99
-Paragraph 5C
-Subparagraph (SX 210.12-13C(Column E))
-Publisher FASB
-URI https://asc.fasb.org//1943274/2147480032/946-320-S99-5C
Reference 2: http://www.xbrl.org/2003/role/disclosureRef
-Topic 946
-SubTopic 320
-Name Accounting Standards Codification
-Section S99
-Paragraph 5
-Subparagraph (SX 210.12-13(Column D))
-Publisher FASB
-URI https://asc.fasb.org//1943274/2147480032/946-320-S99-5
Reference 3: http://www.xbrl.org/2003/role/disclosureRef
-Topic 946
-SubTopic 320
-Name Accounting Standards Codification
-Section S99
-Paragraph 5A
-Subparagraph (SX 210.12-13A(Column D))
-Publisher FASB
-URI https://asc.fasb.org//1943274/2147480032/946-320-S99-5A
Reference 4: http://www.xbrl.org/2003/role/disclosureRef
-Topic 946
-SubTopic 320
-Name Accounting Standards Codification
-Section S99
-Paragraph 5B
-Subparagraph (SX 210.12-13B(Column A))
-Publisher FASB
-URI https://asc.fasb.org//1943274/2147480032/946-320-S99-5B
Reference 5: http://www.xbrl.org/2009/role/commonPracticeRef
-Topic 815
-SubTopic 10
-Name Accounting Standards Codification
-Section 50
-Paragraph 1B
-Publisher FASB
-URI https://asc.fasb.org//1943274/2147480434/815-10-50-1B
Reference 6: http://www.xbrl.org/2009/role/commonPracticeRef
-Topic 815
-SubTopic 10
-Name Accounting Standards Codification
-Section 50
-Paragraph 1A
-Subparagraph (d)
-Publisher FASB
-URI https://asc.fasb.org//1943274/2147480434/815-10-50-1A
Reference 7: http://www.xbrl.org/2009/role/commonPracticeRef
-Topic 815
-SubTopic 10
-Name Accounting Standards Codification
-Section 50
-Paragraph 1A
-Subparagraph (b)
-Publisher FASB
-URI https://asc.fasb.org//1943274/2147480434/815-10-50-1A
| Name: |
us-gaap_DerivativeLiabilityNotionalAmount |
| Namespace Prefix: |
us-gaap_ |
| Data Type: |
xbrli:monetaryItemType |
| Balance Type: |
na |
| Period Type: |
instant |
|
| X |
- DefinitionLine items represent financial concepts included in a table. These concepts are used to disclose reportable information associated with domain members defined in one or many axes to the table. Reference 1: http://www.xbrl.org/2003/role/disclosureRef
-Topic 815
-SubTopic 40
-Name Accounting Standards Codification
-Section 50
-Paragraph 5
-Subparagraph (f)
-Publisher FASB
-URI https://asc.fasb.org//1943274/2147480237/815-40-50-5
| Name: |
us-gaap_DerivativeLineItems |
| Namespace Prefix: |
us-gaap_ |
| Data Type: |
xbrli:stringItemType |
| Balance Type: |
na |
| Period Type: |
duration |
|
| X |
- DefinitionThe aggregate fair value as of the balance sheet date of financial instruments and other positions owned by the entity including: (1) mortgages, mortgage-backed and asset backed securities; (2) US government and agency obligations; (3) state and municipal government obligations; (4) other sovereign government debt; (5) corporate obligations; (6) corporate equities; (7) principal investments; (8) derivative contracts; and (9) physical commodities. Includes both pledged and unpledged holdings. Reference 1: http://fasb.org/us-gaap/role/ref/legacyRef
-Name Accounting Standards Codification
-Topic 940
-SubTopic 320
-Section 45
-Paragraph 2
-Publisher FASB
-URI https://asc.fasb.org//1943274/2147481961/940-320-45-2
| Name: |
us-gaap_FinancialInstrumentsOwnedAtFairValue |
| Namespace Prefix: |
us-gaap_ |
| Data Type: |
xbrli:monetaryItemType |
| Balance Type: |
debit |
| Period Type: |
instant |
|
| X |
- Details
| Name: |
srt_ConsolidationItemsAxis=us-gaap_CorporateNonSegmentMember |
| Namespace Prefix: |
|
| Data Type: |
na |
| Balance Type: |
|
| Period Type: |
|
|
| X |
- Details
| Name: |
us-gaap_DerivativeInstrumentRiskAxis=us-gaap_ForeignExchangeContractMember |
| Namespace Prefix: |
|
| Data Type: |
na |
| Balance Type: |
|
| Period Type: |
|
|
| X |
- Details
| Name: |
us-gaap_DerivativeInstrumentRiskAxis=us-gaap_TotalReturnSwapMember |
| Namespace Prefix: |
|
| Data Type: |
na |
| Balance Type: |
|
| Period Type: |
|
|
| X |
- Details
| Name: |
srt_ConsolidationItemsAxis=srt_ConsolidationEliminationsMember |
| Namespace Prefix: |
|
| Data Type: |
na |
| Balance Type: |
|
| Period Type: |
|
|
| X |
- Details
| Name: |
us-gaap_BalanceSheetLocationAxis=us-gaap_CashMember |
| Namespace Prefix: |
|
| Data Type: |
na |
| Balance Type: |
|
| Period Type: |
|
|
| X |
- Details
| Name: |
us-gaap_PledgedStatusAxis=us-gaap_AssetPledgedAsCollateralMember |
| Namespace Prefix: |
|
| Data Type: |
na |
| Balance Type: |
|
| Period Type: |
|
|
v3.23.2
Earnings Per Share (Details) - USD ($)
$ / shares in Units, $ in Thousands |
3 Months Ended |
6 Months Ended |
Jun. 30, 2023 |
Jun. 30, 2022 |
Jun. 30, 2023 |
Jun. 30, 2022 |
| Earnings Per Share [Abstract] |
|
|
|
|
| Net income |
$ 32,505
|
$ 26,149
|
$ 68,803
|
$ 72,990
|
| Net (income) loss attributable to noncontrolling interests |
(727)
|
25,807
|
(1,711)
|
20,984
|
| Net income attributable to common stockholders |
$ 31,778
|
$ 51,956
|
$ 67,092
|
$ 93,974
|
| Basic weighted average shares outstanding (shares) |
49,315,000
|
48,805,000
|
49,257,000
|
48,739,000
|
| Dilutive potential shares from restricted stock units (shares) |
148,000
|
403,000
|
176,000
|
533,000
|
| Diluted weighted average shares outstanding (shares) |
49,463,000
|
49,208,000
|
49,433,000
|
49,272,000
|
| Basic earnings per share attributable to common stockholders (in dollars per share) |
$ 0.64
|
$ 1.06
|
$ 1.36
|
$ 1.93
|
| Diluted earnings per share attributable to common stockholders (in dollars per share) |
$ 0.64
|
$ 1.06
|
$ 1.36
|
$ 1.91
|
| Antidilutive Securities Excluded from Computation of Earnings Per Share, Amount |
214,000
|
2,000
|
141,000
|
2,000
|
| X |
- DefinitionSecurities (including those issuable pursuant to contingent stock agreements) that could potentially dilute basic earnings per share (EPS) or earnings per unit (EPU) in the future that were not included in the computation of diluted EPS or EPU because to do so would increase EPS or EPU amounts or decrease loss per share or unit amounts for the period presented. Reference 1: http://www.xbrl.org/2003/role/disclosureRef
-Topic 260
-SubTopic 10
-Name Accounting Standards Codification
-Section 50
-Paragraph 1
-Subparagraph (c)
-Publisher FASB
-URI https://asc.fasb.org//1943274/2147482662/260-10-50-1
| Name: |
us-gaap_AntidilutiveSecuritiesExcludedFromComputationOfEarningsPerShareAmount |
| Namespace Prefix: |
us-gaap_ |
| Data Type: |
xbrli:sharesItemType |
| Balance Type: |
na |
| Period Type: |
duration |
|
| X |
- References
+ Details
| Name: |
us-gaap_EarningsPerShareAbstract |
| Namespace Prefix: |
us-gaap_ |
| Data Type: |
xbrli:stringItemType |
| Balance Type: |
na |
| Period Type: |
duration |
|
| X |
- DefinitionThe amount of net income (loss) for the period per each share of common stock or unit outstanding during the reporting period. Reference 1: http://www.xbrl.org/2003/role/disclosureRef
-Topic 250
-SubTopic 10
-Name Accounting Standards Codification
-Section 50
-Paragraph 3
-Publisher FASB
-URI https://asc.fasb.org//1943274/2147483443/250-10-50-3
Reference 2: http://www.xbrl.org/2003/role/disclosureRef
-Topic 260
-SubTopic 10
-Name Accounting Standards Codification
-Section 55
-Paragraph 15
-Publisher FASB
-URI https://asc.fasb.org//1943274/2147482635/260-10-55-15
Reference 3: http://www.xbrl.org/2003/role/disclosureRef
-Topic 815
-SubTopic 40
-Name Accounting Standards Codification
-Section 65
-Paragraph 1
-Subparagraph (e)(4)
-Publisher FASB
-URI https://asc.fasb.org//1943274/2147480175/815-40-65-1
Reference 4: http://www.xbrl.org/2003/role/disclosureRef
-Topic 815
-SubTopic 40
-Name Accounting Standards Codification
-Section 65
-Paragraph 1
-Subparagraph (f)
-Publisher FASB
-URI https://asc.fasb.org//1943274/2147480175/815-40-65-1
Reference 5: http://www.xbrl.org/2003/role/disclosureRef
-Topic 250
-SubTopic 10
-Name Accounting Standards Codification
-Section 50
-Paragraph 11
-Subparagraph (a)
-Publisher FASB
-URI https://asc.fasb.org//1943274/2147483443/250-10-50-11
Reference 6: http://www.xbrl.org/2003/role/disclosureRef
-Topic 250
-SubTopic 10
-Name Accounting Standards Codification
-Section 50
-Paragraph 11
-Subparagraph (b)
-Publisher FASB
-URI https://asc.fasb.org//1943274/2147483443/250-10-50-11
Reference 7: http://www.xbrl.org/2003/role/disclosureRef
-Topic 250
-SubTopic 10
-Name Accounting Standards Codification
-Section 50
-Paragraph 7
-Subparagraph (a)
-Publisher FASB
-URI https://asc.fasb.org//1943274/2147483443/250-10-50-7
Reference 8: http://www.xbrl.org/2003/role/disclosureRef
-Topic 260
-SubTopic 10
-Name Accounting Standards Codification
-Section 45
-Paragraph 2
-Publisher FASB
-URI https://asc.fasb.org//1943274/2147482689/260-10-45-2
Reference 9: http://www.xbrl.org/2003/role/disclosureRef
-Topic 260
-SubTopic 10
-Name Accounting Standards Codification
-Section 45
-Paragraph 60B
-Subparagraph (d)
-Publisher FASB
-URI https://asc.fasb.org//1943274/2147482689/260-10-45-60B
Reference 10: http://www.xbrl.org/2003/role/disclosureRef
-Topic 250
-SubTopic 10
-Name Accounting Standards Codification
-Section 50
-Paragraph 4
-Publisher FASB
-URI https://asc.fasb.org//1943274/2147483443/250-10-50-4
Reference 11: http://www.xbrl.org/2003/role/disclosureRef
-Topic 260
-SubTopic 10
-Name Accounting Standards Codification
-Section 50
-Paragraph 1
-Subparagraph (a)
-Publisher FASB
-URI https://asc.fasb.org//1943274/2147482662/260-10-50-1
Reference 12: http://www.xbrl.org/2003/role/disclosureRef
-Topic 260
-SubTopic 10
-Name Accounting Standards Codification
-Section 45
-Paragraph 10
-Publisher FASB
-URI https://asc.fasb.org//1943274/2147482689/260-10-45-10
Reference 13: http://www.xbrl.org/2003/role/disclosureRef
-Topic 220
-SubTopic 10
-Name Accounting Standards Codification
-Section S99
-Paragraph 2
-Subparagraph (SX 210.5-03(25))
-Publisher FASB
-URI https://asc.fasb.org//1943274/2147483621/220-10-S99-2
Reference 14: http://www.xbrl.org/2003/role/disclosureRef
-Topic 942
-SubTopic 220
-Name Accounting Standards Codification
-Section S99
-Paragraph 1
-Subparagraph (SX 210.9-04(27))
-Publisher FASB
-URI https://asc.fasb.org//1943274/2147483589/942-220-S99-1
Reference 15: http://www.xbrl.org/2003/role/disclosureRef
-Topic 944
-SubTopic 220
-Name Accounting Standards Codification
-Section S99
-Paragraph 1
-Subparagraph (SX 210.7-04(23))
-Publisher FASB
-URI https://asc.fasb.org//1943274/2147483586/944-220-S99-1
Reference 16: http://www.xbrl.org/2003/role/exampleRef
-Topic 260
-SubTopic 10
-Name Accounting Standards Codification
-Section 55
-Paragraph 52
-Publisher FASB
-URI https://asc.fasb.org//1943274/2147482635/260-10-55-52
Reference 17: http://www.xbrl.org/2003/role/disclosureRef
-Topic 260
-SubTopic 10
-Name Accounting Standards Codification
-Section 45
-Paragraph 7
-Publisher FASB
-URI https://asc.fasb.org//1943274/2147482689/260-10-45-7
| Name: |
us-gaap_EarningsPerShareBasic |
| Namespace Prefix: |
us-gaap_ |
| Data Type: |
dtr-types:perShareItemType |
| Balance Type: |
na |
| Period Type: |
duration |
|
| X |
- DefinitionThe amount of net income (loss) for the period available to each share of common stock or common unit outstanding during the reporting period and to each share or unit that would have been outstanding assuming the issuance of common shares or units for all dilutive potential common shares or units outstanding during the reporting period. Reference 1: http://www.xbrl.org/2003/role/disclosureRef
-Topic 250
-SubTopic 10
-Name Accounting Standards Codification
-Section 50
-Paragraph 3
-Publisher FASB
-URI https://asc.fasb.org//1943274/2147483443/250-10-50-3
Reference 2: http://www.xbrl.org/2003/role/disclosureRef
-Topic 260
-SubTopic 10
-Name Accounting Standards Codification
-Section 55
-Paragraph 15
-Publisher FASB
-URI https://asc.fasb.org//1943274/2147482635/260-10-55-15
Reference 3: http://www.xbrl.org/2003/role/disclosureRef
-Topic 815
-SubTopic 40
-Name Accounting Standards Codification
-Section 65
-Paragraph 1
-Subparagraph (e)(4)
-Publisher FASB
-URI https://asc.fasb.org//1943274/2147480175/815-40-65-1
Reference 4: http://www.xbrl.org/2003/role/disclosureRef
-Topic 815
-SubTopic 40
-Name Accounting Standards Codification
-Section 65
-Paragraph 1
-Subparagraph (f)
-Publisher FASB
-URI https://asc.fasb.org//1943274/2147480175/815-40-65-1
Reference 5: http://www.xbrl.org/2003/role/disclosureRef
-Topic 250
-SubTopic 10
-Name Accounting Standards Codification
-Section 50
-Paragraph 11
-Subparagraph (a)
-Publisher FASB
-URI https://asc.fasb.org//1943274/2147483443/250-10-50-11
Reference 6: http://www.xbrl.org/2003/role/disclosureRef
-Topic 250
-SubTopic 10
-Name Accounting Standards Codification
-Section 50
-Paragraph 11
-Subparagraph (b)
-Publisher FASB
-URI https://asc.fasb.org//1943274/2147483443/250-10-50-11
Reference 7: http://www.xbrl.org/2003/role/disclosureRef
-Topic 250
-SubTopic 10
-Name Accounting Standards Codification
-Section 50
-Paragraph 7
-Subparagraph (a)
-Publisher FASB
-URI https://asc.fasb.org//1943274/2147483443/250-10-50-7
Reference 8: http://www.xbrl.org/2003/role/disclosureRef
-Topic 260
-SubTopic 10
-Name Accounting Standards Codification
-Section 45
-Paragraph 2
-Publisher FASB
-URI https://asc.fasb.org//1943274/2147482689/260-10-45-2
Reference 9: http://www.xbrl.org/2003/role/disclosureRef
-Topic 260
-SubTopic 10
-Name Accounting Standards Codification
-Section 45
-Paragraph 60B
-Subparagraph (d)
-Publisher FASB
-URI https://asc.fasb.org//1943274/2147482689/260-10-45-60B
Reference 10: http://www.xbrl.org/2003/role/disclosureRef
-Topic 250
-SubTopic 10
-Name Accounting Standards Codification
-Section 50
-Paragraph 4
-Publisher FASB
-URI https://asc.fasb.org//1943274/2147483443/250-10-50-4
Reference 11: http://www.xbrl.org/2003/role/disclosureRef
-Topic 260
-SubTopic 10
-Name Accounting Standards Codification
-Section 50
-Paragraph 1
-Subparagraph (a)
-Publisher FASB
-URI https://asc.fasb.org//1943274/2147482662/260-10-50-1
Reference 12: http://www.xbrl.org/2003/role/disclosureRef
-Topic 220
-SubTopic 10
-Name Accounting Standards Codification
-Section S99
-Paragraph 2
-Subparagraph (SX 210.5-03(25))
-Publisher FASB
-URI https://asc.fasb.org//1943274/2147483621/220-10-S99-2
Reference 13: http://www.xbrl.org/2003/role/disclosureRef
-Topic 942
-SubTopic 220
-Name Accounting Standards Codification
-Section S99
-Paragraph 1
-Subparagraph (SX 210.9-04(27))
-Publisher FASB
-URI https://asc.fasb.org//1943274/2147483589/942-220-S99-1
Reference 14: http://www.xbrl.org/2003/role/disclosureRef
-Topic 944
-SubTopic 220
-Name Accounting Standards Codification
-Section S99
-Paragraph 1
-Subparagraph (SX 210.7-04(23))
-Publisher FASB
-URI https://asc.fasb.org//1943274/2147483586/944-220-S99-1
Reference 15: http://www.xbrl.org/2003/role/exampleRef
-Topic 260
-SubTopic 10
-Name Accounting Standards Codification
-Section 55
-Paragraph 52
-Publisher FASB
-URI https://asc.fasb.org//1943274/2147482635/260-10-55-52
Reference 16: http://www.xbrl.org/2003/role/disclosureRef
-Topic 260
-SubTopic 10
-Name Accounting Standards Codification
-Section 45
-Paragraph 7
-Publisher FASB
-URI https://asc.fasb.org//1943274/2147482689/260-10-45-7
| Name: |
us-gaap_EarningsPerShareDiluted |
| Namespace Prefix: |
us-gaap_ |
| Data Type: |
dtr-types:perShareItemType |
| Balance Type: |
na |
| Period Type: |
duration |
|
| X |
- DefinitionThe portion of profit or loss for the period, net of income taxes, which is attributable to the parent. Reference 1: http://www.xbrl.org/2003/role/disclosureRef
-Topic 235
-SubTopic 10
-Name Accounting Standards Codification
-Section S99
-Paragraph 1
-Subparagraph (SX 210.4-08(g)(1)(ii))
-Publisher FASB
-URI https://asc.fasb.org//1943274/2147480678/235-10-S99-1
Reference 2: http://www.xbrl.org/2003/role/disclosureRef
-Topic 323
-SubTopic 10
-Name Accounting Standards Codification
-Section 50
-Paragraph 3
-Subparagraph (c)
-Publisher FASB
-URI https://asc.fasb.org//1943274/2147481687/323-10-50-3
Reference 3: http://www.xbrl.org/2003/role/disclosureRef
-Topic 825
-SubTopic 10
-Name Accounting Standards Codification
-Section 50
-Paragraph 28
-Subparagraph (f)
-Publisher FASB
-URI https://asc.fasb.org//1943274/2147482907/825-10-50-28
Reference 4: http://www.xbrl.org/2003/role/disclosureRef
-Topic 220
-SubTopic 10
-Name Accounting Standards Codification
-Section 50
-Paragraph 6
-Publisher FASB
-URI https://asc.fasb.org//1943274/2147482765/220-10-50-6
Reference 5: http://www.xbrl.org/2003/role/disclosureRef
-Topic 250
-SubTopic 10
-Name Accounting Standards Codification
-Section 50
-Paragraph 3
-Publisher FASB
-URI https://asc.fasb.org//1943274/2147483443/250-10-50-3
Reference 6: http://www.xbrl.org/2003/role/disclosureRef
-Topic 250
-SubTopic 10
-Name Accounting Standards Codification
-Section 50
-Paragraph 1
-Subparagraph (b)(2)
-Publisher FASB
-URI https://asc.fasb.org//1943274/2147483443/250-10-50-1
Reference 7: http://www.xbrl.org/2003/role/disclosureRef
-Topic 815
-SubTopic 40
-Name Accounting Standards Codification
-Section 65
-Paragraph 1
-Subparagraph (f)
-Publisher FASB
-URI https://asc.fasb.org//1943274/2147480175/815-40-65-1
Reference 8: http://www.xbrl.org/2003/role/disclosureRef
-Topic 250
-SubTopic 10
-Name Accounting Standards Codification
-Section 50
-Paragraph 8
-Publisher FASB
-URI https://asc.fasb.org//1943274/2147483443/250-10-50-8
Reference 9: http://www.xbrl.org/2003/role/disclosureRef
-Topic 250
-SubTopic 10
-Name Accounting Standards Codification
-Section 50
-Paragraph 9
-Publisher FASB
-URI https://asc.fasb.org//1943274/2147483443/250-10-50-9
Reference 10: http://www.xbrl.org/2003/role/disclosureRef
-Topic 250
-SubTopic 10
-Name Accounting Standards Codification
-Section 50
-Paragraph 11
-Subparagraph (a)
-Publisher FASB
-URI https://asc.fasb.org//1943274/2147483443/250-10-50-11
Reference 11: http://www.xbrl.org/2003/role/disclosureRef
-Topic 250
-SubTopic 10
-Name Accounting Standards Codification
-Section 50
-Paragraph 11
-Subparagraph (b)
-Publisher FASB
-URI https://asc.fasb.org//1943274/2147483443/250-10-50-11
Reference 12: http://www.xbrl.org/2003/role/disclosureRef
-Topic 250
-SubTopic 10
-Name Accounting Standards Codification
-Section 50
-Paragraph 4
-Publisher FASB
-URI https://asc.fasb.org//1943274/2147483443/250-10-50-4
Reference 13: http://www.xbrl.org/2003/role/exampleRef
-Topic 946
-SubTopic 830
-Name Accounting Standards Codification
-Section 55
-Paragraph 10
-Publisher FASB
-URI https://asc.fasb.org//1943274/2147480167/946-830-55-10
Reference 14: http://www.xbrl.org/2003/role/disclosureRef
-Topic 946
-SubTopic 220
-Name Accounting Standards Codification
-Section 45
-Paragraph 7
-Publisher FASB
-URI https://asc.fasb.org//1943274/2147483581/946-220-45-7
Reference 15: http://www.xbrl.org/2003/role/disclosureRef
-Topic 944
-SubTopic 220
-Name Accounting Standards Codification
-Section S99
-Paragraph 1
-Subparagraph (SX 210.7-04(18))
-Publisher FASB
-URI https://asc.fasb.org//1943274/2147483586/944-220-S99-1
Reference 16: http://www.xbrl.org/2003/role/disclosureRef
-Topic 280
-SubTopic 10
-Name Accounting Standards Codification
-Section 50
-Paragraph 22
-Publisher FASB
-URI https://asc.fasb.org//1943274/2147482810/280-10-50-22
Reference 17: http://www.xbrl.org/2003/role/disclosureRef
-Topic 946
-SubTopic 220
-Name Accounting Standards Codification
-Section S99
-Paragraph 1
-Subparagraph (SX 210.6-07(9))
-Publisher FASB
-URI https://asc.fasb.org//1943274/2147483575/946-220-S99-1
Reference 18: http://www.xbrl.org/2003/role/disclosureRef
-Topic 946
-SubTopic 220
-Name Accounting Standards Codification
-Section S99
-Paragraph 3
-Subparagraph (SX 210.6-09(1)(d))
-Publisher FASB
-URI https://asc.fasb.org//1943274/2147483575/946-220-S99-3
Reference 19: http://www.xbrl.org/2003/role/disclosureRef
-Topic 470
-SubTopic 10
-Name Accounting Standards Codification
-Section S99
-Paragraph 1A
-Subparagraph (SX 210.13-01(a)(4)(i))
-Publisher FASB
-URI https://asc.fasb.org//1943274/2147480097/470-10-S99-1A
Reference 20: http://www.xbrl.org/2009/role/commonPracticeRef
-Topic 470
-SubTopic 10
-Name Accounting Standards Codification
-Section S99
-Paragraph 1A
-Subparagraph (SX 210.13-01(a)(4)(ii))
-Publisher FASB
-URI https://asc.fasb.org//1943274/2147480097/470-10-S99-1A
Reference 21: http://www.xbrl.org/2003/role/disclosureRef
-Topic 470
-SubTopic 10
-Name Accounting Standards Codification
-Section S99
-Paragraph 1A
-Subparagraph (SX 210.13-01(a)(4)(iii)(A))
-Publisher FASB
-URI https://asc.fasb.org//1943274/2147480097/470-10-S99-1A
Reference 22: http://www.xbrl.org/2003/role/disclosureRef
-Topic 470
-SubTopic 10
-Name Accounting Standards Codification
-Section S99
-Paragraph 1A
-Subparagraph (SX 210.13-01(a)(4)(iv))
-Publisher FASB
-URI https://asc.fasb.org//1943274/2147480097/470-10-S99-1A
Reference 23: http://www.xbrl.org/2003/role/disclosureRef
-Topic 470
-SubTopic 10
-Name Accounting Standards Codification
-Section S99
-Paragraph 1A
-Subparagraph (SX 210.13-01(a)(5))
-Publisher FASB
-URI https://asc.fasb.org//1943274/2147480097/470-10-S99-1A
Reference 24: http://www.xbrl.org/2003/role/disclosureRef
-Topic 470
-SubTopic 10
-Name Accounting Standards Codification
-Section S99
-Paragraph 1B
-Subparagraph (SX 210.13-02(a)(4)(i))
-Publisher FASB
-URI https://asc.fasb.org//1943274/2147480097/470-10-S99-1B
Reference 25: http://www.xbrl.org/2003/role/disclosureRef
-Topic 470
-SubTopic 10
-Name Accounting Standards Codification
-Section S99
-Paragraph 1B
-Subparagraph (SX 210.13-02(a)(4)(iii)(A))
-Publisher FASB
-URI https://asc.fasb.org//1943274/2147480097/470-10-S99-1B
Reference 26: http://www.xbrl.org/2003/role/disclosureRef
-Topic 470
-SubTopic 10
-Name Accounting Standards Codification
-Section S99
-Paragraph 1B
-Subparagraph (SX 210.13-02(a)(4)(iii)(B))
-Publisher FASB
-URI https://asc.fasb.org//1943274/2147480097/470-10-S99-1B
Reference 27: http://www.xbrl.org/2003/role/disclosureRef
-Topic 470
-SubTopic 10
-Name Accounting Standards Codification
-Section S99
-Paragraph 1B
-Subparagraph (SX 210.13-02(a)(4)(iv))
-Publisher FASB
-URI https://asc.fasb.org//1943274/2147480097/470-10-S99-1B
Reference 28: http://www.xbrl.org/2003/role/disclosureRef
-Topic 470
-SubTopic 10
-Name Accounting Standards Codification
-Section S99
-Paragraph 1B
-Subparagraph (SX 210.13-02(a)(5))
-Publisher FASB
-URI https://asc.fasb.org//1943274/2147480097/470-10-S99-1B
Reference 29: http://www.xbrl.org/2003/role/disclosureRef
-Topic 280
-SubTopic 10
-Name Accounting Standards Codification
-Section 50
-Paragraph 30
-Subparagraph (b)
-Publisher FASB
-URI https://asc.fasb.org//1943274/2147482810/280-10-50-30
Reference 30: http://www.xbrl.org/2003/role/disclosureRef
-Topic 280
-SubTopic 10
-Name Accounting Standards Codification
-Section 50
-Paragraph 32
-Subparagraph (f)
-Publisher FASB
-URI https://asc.fasb.org//1943274/2147482810/280-10-50-32
Reference 31: http://www.xbrl.org/2003/role/disclosureRef
-Topic 260
-SubTopic 10
-Name Accounting Standards Codification
-Section 45
-Paragraph 60B
-Subparagraph (a)
-Publisher FASB
-URI https://asc.fasb.org//1943274/2147482689/260-10-45-60B
Reference 32: http://www.xbrl.org/2003/role/exampleRef
-Topic 280
-SubTopic 10
-Name Accounting Standards Codification
-Section 50
-Paragraph 31
-Publisher FASB
-URI https://asc.fasb.org//1943274/2147482810/280-10-50-31
Reference 33: http://www.xbrl.org/2003/role/disclosureRef
-Topic 280
-SubTopic 10
-Name Accounting Standards Codification
-Section 50
-Paragraph 32
-Subparagraph (c)
-Publisher FASB
-URI https://asc.fasb.org//1943274/2147482810/280-10-50-32
Reference 34: http://www.xbrl.org/2003/role/disclosureRef
-Topic 205
-SubTopic 20
-Name Accounting Standards Codification
-Section 50
-Paragraph 7
-Publisher FASB
-URI https://asc.fasb.org//1943274/2147483499/205-20-50-7
Reference 35: http://fasb.org/us-gaap/role/ref/legacyRef
-Topic 230
-SubTopic 10
-Name Accounting Standards Codification
-Section 45
-Paragraph 28
-Publisher FASB
-URI https://asc.fasb.org//1943274/2147482740/230-10-45-28
Reference 36: http://www.xbrl.org/2003/role/disclosureRef
-Topic 220
-SubTopic 10
-Name Accounting Standards Codification
-Section 45
-Paragraph 1A
-Subparagraph (a)
-Publisher FASB
-URI https://asc.fasb.org//1943274/2147482790/220-10-45-1A
Reference 37: http://www.xbrl.org/2003/role/disclosureRef
-Topic 220
-SubTopic 10
-Name Accounting Standards Codification
-Section 45
-Paragraph 1B
-Subparagraph (a)
-Publisher FASB
-URI https://asc.fasb.org//1943274/2147482790/220-10-45-1B
Reference 38: http://fasb.org/us-gaap/role/ref/legacyRef
-Topic 220
-SubTopic 10
-Name Accounting Standards Codification
-Section S99
-Paragraph 2
-Subparagraph (SX 210.5-03(20))
-Publisher FASB
-URI https://asc.fasb.org//1943274/2147483621/220-10-S99-2
Reference 39: http://fasb.org/us-gaap/role/ref/legacyRef
-Topic 942
-SubTopic 220
-Name Accounting Standards Codification
-Section S99
-Paragraph 1
-Subparagraph (SX 210.9-04(22))
-Publisher FASB
-URI https://asc.fasb.org//1943274/2147483589/942-220-S99-1
| Name: |
us-gaap_NetIncomeLoss |
| Namespace Prefix: |
us-gaap_ |
| Data Type: |
xbrli:monetaryItemType |
| Balance Type: |
credit |
| Period Type: |
duration |
|
| X |
- DefinitionAmount of Net Income (Loss) attributable to noncontrolling interest. Reference 1: http://www.xbrl.org/2003/role/disclosureRef
-Topic 250
-SubTopic 10
-Name Accounting Standards Codification
-Section 50
-Paragraph 8
-Publisher FASB
-URI https://asc.fasb.org//1943274/2147483443/250-10-50-8
Reference 2: http://www.xbrl.org/2003/role/disclosureRef
-Topic 250
-SubTopic 10
-Name Accounting Standards Codification
-Section 50
-Paragraph 9
-Publisher FASB
-URI https://asc.fasb.org//1943274/2147483443/250-10-50-9
Reference 3: http://www.xbrl.org/2003/role/disclosureRef
-Topic 944
-SubTopic 220
-Name Accounting Standards Codification
-Section S99
-Paragraph 1
-Subparagraph (SX 210.7-04(17))
-Publisher FASB
-URI https://asc.fasb.org//1943274/2147483586/944-220-S99-1
Reference 4: http://www.xbrl.org/2009/role/commonPracticeRef
-Topic 220
-SubTopic 10
-Name Accounting Standards Codification
-Section 50
-Paragraph 6
-Publisher FASB
-URI https://asc.fasb.org//1943274/2147482765/220-10-50-6
Reference 5: http://fasb.org/us-gaap/role/ref/legacyRef
-Topic 810
-SubTopic 10
-Name Accounting Standards Codification
-Section 50
-Paragraph 1A
-Subparagraph (a)(2)
-Publisher FASB
-URI https://asc.fasb.org//1943274/2147481203/810-10-50-1A
Reference 6: http://fasb.org/us-gaap/role/ref/legacyRef
-Name Accounting Standards Codification
-Topic 810
-SubTopic 10
-Section 55
-Paragraph 4J
-Publisher FASB
-URI https://asc.fasb.org//1943274/2147481175/810-10-55-4J
Reference 7: http://www.xbrl.org/2003/role/disclosureRef
-Topic 220
-SubTopic 10
-Name Accounting Standards Codification
-Section 45
-Paragraph 1A
-Subparagraph (a)
-Publisher FASB
-URI https://asc.fasb.org//1943274/2147482790/220-10-45-1A
Reference 8: http://www.xbrl.org/2003/role/disclosureRef
-Topic 220
-SubTopic 10
-Name Accounting Standards Codification
-Section 45
-Paragraph 1B
-Subparagraph (a)
-Publisher FASB
-URI https://asc.fasb.org//1943274/2147482790/220-10-45-1B
| Name: |
us-gaap_NetIncomeLossAttributableToNoncontrollingInterest |
| Namespace Prefix: |
us-gaap_ |
| Data Type: |
xbrli:monetaryItemType |
| Balance Type: |
debit |
| Period Type: |
duration |
|
| X |
- DefinitionThe consolidated profit or loss for the period, net of income taxes, including the portion attributable to the noncontrolling interest. Reference 1: http://www.xbrl.org/2003/role/disclosureRef
-Topic 235
-SubTopic 10
-Name Accounting Standards Codification
-Section S99
-Paragraph 1
-Subparagraph (SX 210.4-08(g)(1)(ii))
-Publisher FASB
-URI https://asc.fasb.org//1943274/2147480678/235-10-S99-1
Reference 2: http://www.xbrl.org/2003/role/disclosureRef
-Topic 323
-SubTopic 10
-Name Accounting Standards Codification
-Section 50
-Paragraph 3
-Subparagraph (c)
-Publisher FASB
-URI https://asc.fasb.org//1943274/2147481687/323-10-50-3
Reference 3: http://www.xbrl.org/2003/role/disclosureRef
-Topic 825
-SubTopic 10
-Name Accounting Standards Codification
-Section 50
-Paragraph 28
-Subparagraph (f)
-Publisher FASB
-URI https://asc.fasb.org//1943274/2147482907/825-10-50-28
Reference 4: http://www.xbrl.org/2003/role/disclosureRef
-Topic 250
-SubTopic 10
-Name Accounting Standards Codification
-Section 50
-Paragraph 1
-Subparagraph (b)(2)
-Publisher FASB
-URI https://asc.fasb.org//1943274/2147483443/250-10-50-1
Reference 5: http://www.xbrl.org/2003/role/disclosureRef
-Topic 815
-SubTopic 40
-Name Accounting Standards Codification
-Section 65
-Paragraph 1
-Subparagraph (f)
-Publisher FASB
-URI https://asc.fasb.org//1943274/2147480175/815-40-65-1
Reference 6: http://www.xbrl.org/2003/role/disclosureRef
-Topic 250
-SubTopic 10
-Name Accounting Standards Codification
-Section 50
-Paragraph 8
-Publisher FASB
-URI https://asc.fasb.org//1943274/2147483443/250-10-50-8
Reference 7: http://www.xbrl.org/2003/role/disclosureRef
-Topic 250
-SubTopic 10
-Name Accounting Standards Codification
-Section 50
-Paragraph 9
-Publisher FASB
-URI https://asc.fasb.org//1943274/2147483443/250-10-50-9
Reference 8: http://www.xbrl.org/2003/role/exampleRef
-Topic 946
-SubTopic 830
-Name Accounting Standards Codification
-Section 55
-Paragraph 11
-Publisher FASB
-URI https://asc.fasb.org//1943274/2147480167/946-830-55-11
Reference 9: http://www.xbrl.org/2003/role/disclosureRef
-Topic 946
-SubTopic 205
-Name Accounting Standards Codification
-Section 45
-Paragraph 3
-Subparagraph (a)
-Publisher FASB
-URI https://asc.fasb.org//1943274/2147480767/946-205-45-3
Reference 10: http://www.xbrl.org/2003/role/disclosureRef
-Topic 946
-SubTopic 220
-Name Accounting Standards Codification
-Section 45
-Paragraph 7
-Publisher FASB
-URI https://asc.fasb.org//1943274/2147483581/946-220-45-7
Reference 11: http://www.xbrl.org/2003/role/disclosureRef
-Topic 944
-SubTopic 220
-Name Accounting Standards Codification
-Section S99
-Paragraph 1
-Subparagraph (SX 210.7-04(16))
-Publisher FASB
-URI https://asc.fasb.org//1943274/2147483586/944-220-S99-1
Reference 12: http://www.xbrl.org/2003/role/disclosureRef
-Topic 280
-SubTopic 10
-Name Accounting Standards Codification
-Section 50
-Paragraph 22
-Publisher FASB
-URI https://asc.fasb.org//1943274/2147482810/280-10-50-22
Reference 13: http://www.xbrl.org/2003/role/disclosureRef
-Topic 946
-SubTopic 220
-Name Accounting Standards Codification
-Section S99
-Paragraph 1
-Subparagraph (SX 210.6-07(9))
-Publisher FASB
-URI https://asc.fasb.org//1943274/2147483575/946-220-S99-1
Reference 14: http://www.xbrl.org/2003/role/disclosureRef
-Topic 946
-SubTopic 220
-Name Accounting Standards Codification
-Section S99
-Paragraph 3
-Subparagraph (SX 210.6-09(1)(d))
-Publisher FASB
-URI https://asc.fasb.org//1943274/2147483575/946-220-S99-3
Reference 15: http://www.xbrl.org/2003/role/disclosureRef
-Topic 810
-SubTopic 10
-Name Accounting Standards Codification
-Section 45
-Paragraph 19
-Publisher FASB
-URI https://asc.fasb.org//1943274/2147481231/810-10-45-19
Reference 16: http://www.xbrl.org/2009/role/commonPracticeRef
-Topic 220
-SubTopic 10
-Name Accounting Standards Codification
-Section 50
-Paragraph 6
-Publisher FASB
-URI https://asc.fasb.org//1943274/2147482765/220-10-50-6
Reference 17: http://www.xbrl.org/2003/role/disclosureRef
-Topic 470
-SubTopic 10
-Name Accounting Standards Codification
-Section S99
-Paragraph 1A
-Subparagraph (SX 210.13-01(a)(4)(i))
-Publisher FASB
-URI https://asc.fasb.org//1943274/2147480097/470-10-S99-1A
Reference 18: http://www.xbrl.org/2009/role/commonPracticeRef
-Topic 470
-SubTopic 10
-Name Accounting Standards Codification
-Section S99
-Paragraph 1A
-Subparagraph (SX 210.13-01(a)(4)(ii))
-Publisher FASB
-URI https://asc.fasb.org//1943274/2147480097/470-10-S99-1A
Reference 19: http://www.xbrl.org/2003/role/disclosureRef
-Topic 470
-SubTopic 10
-Name Accounting Standards Codification
-Section S99
-Paragraph 1A
-Subparagraph (SX 210.13-01(a)(4)(iii)(A))
-Publisher FASB
-URI https://asc.fasb.org//1943274/2147480097/470-10-S99-1A
Reference 20: http://www.xbrl.org/2003/role/disclosureRef
-Topic 470
-SubTopic 10
-Name Accounting Standards Codification
-Section S99
-Paragraph 1A
-Subparagraph (SX 210.13-01(a)(4)(iv))
-Publisher FASB
-URI https://asc.fasb.org//1943274/2147480097/470-10-S99-1A
Reference 21: http://www.xbrl.org/2003/role/disclosureRef
-Topic 470
-SubTopic 10
-Name Accounting Standards Codification
-Section S99
-Paragraph 1A
-Subparagraph (SX 210.13-01(a)(5))
-Publisher FASB
-URI https://asc.fasb.org//1943274/2147480097/470-10-S99-1A
Reference 22: http://www.xbrl.org/2003/role/disclosureRef
-Topic 470
-SubTopic 10
-Name Accounting Standards Codification
-Section S99
-Paragraph 1B
-Subparagraph (SX 210.13-02(a)(4)(i))
-Publisher FASB
-URI https://asc.fasb.org//1943274/2147480097/470-10-S99-1B
Reference 23: http://www.xbrl.org/2003/role/disclosureRef
-Topic 470
-SubTopic 10
-Name Accounting Standards Codification
-Section S99
-Paragraph 1B
-Subparagraph (SX 210.13-02(a)(4)(iii)(A))
-Publisher FASB
-URI https://asc.fasb.org//1943274/2147480097/470-10-S99-1B
Reference 24: http://www.xbrl.org/2003/role/disclosureRef
-Topic 470
-SubTopic 10
-Name Accounting Standards Codification
-Section S99
-Paragraph 1B
-Subparagraph (SX 210.13-02(a)(4)(iii)(B))
-Publisher FASB
-URI https://asc.fasb.org//1943274/2147480097/470-10-S99-1B
Reference 25: http://www.xbrl.org/2003/role/disclosureRef
-Topic 470
-SubTopic 10
-Name Accounting Standards Codification
-Section S99
-Paragraph 1B
-Subparagraph (SX 210.13-02(a)(4)(iv))
-Publisher FASB
-URI https://asc.fasb.org//1943274/2147480097/470-10-S99-1B
Reference 26: http://www.xbrl.org/2003/role/disclosureRef
-Topic 470
-SubTopic 10
-Name Accounting Standards Codification
-Section S99
-Paragraph 1B
-Subparagraph (SX 210.13-02(a)(5))
-Publisher FASB
-URI https://asc.fasb.org//1943274/2147480097/470-10-S99-1B
Reference 27: http://www.xbrl.org/2003/role/disclosureRef
-Topic 280
-SubTopic 10
-Name Accounting Standards Codification
-Section 50
-Paragraph 30
-Subparagraph (b)
-Publisher FASB
-URI https://asc.fasb.org//1943274/2147482810/280-10-50-30
Reference 28: http://www.xbrl.org/2003/role/disclosureRef
-Topic 280
-SubTopic 10
-Name Accounting Standards Codification
-Section 50
-Paragraph 32
-Subparagraph (f)
-Publisher FASB
-URI https://asc.fasb.org//1943274/2147482810/280-10-50-32
Reference 29: http://www.xbrl.org/2003/role/exampleRef
-Topic 280
-SubTopic 10
-Name Accounting Standards Codification
-Section 50
-Paragraph 31
-Publisher FASB
-URI https://asc.fasb.org//1943274/2147482810/280-10-50-31
Reference 30: http://www.xbrl.org/2003/role/disclosureRef
-Topic 280
-SubTopic 10
-Name Accounting Standards Codification
-Section 50
-Paragraph 32
-Subparagraph (c)
-Publisher FASB
-URI https://asc.fasb.org//1943274/2147482810/280-10-50-32
Reference 31: http://www.xbrl.org/2003/role/disclosureRef
-Topic 942
-SubTopic 235
-Name Accounting Standards Codification
-Section S99
-Paragraph 1
-Subparagraph (SX 210.9-05(b)(2))
-Publisher FASB
-URI https://asc.fasb.org//1943274/2147479557/942-235-S99-1
Reference 32: http://www.xbrl.org/2003/role/disclosureRef
-Topic 205
-SubTopic 20
-Name Accounting Standards Codification
-Section 50
-Paragraph 7
-Publisher FASB
-URI https://asc.fasb.org//1943274/2147483499/205-20-50-7
Reference 33: http://www.xbrl.org/2003/role/exampleRef
-Topic 810
-SubTopic 10
-Name Accounting Standards Codification
-Section 55
-Paragraph 4J
-Publisher FASB
-URI https://asc.fasb.org//1943274/2147481175/810-10-55-4J
Reference 34: http://www.xbrl.org/2003/role/exampleRef
-Topic 810
-SubTopic 10
-Name Accounting Standards Codification
-Section 55
-Paragraph 4K
-Publisher FASB
-URI https://asc.fasb.org//1943274/2147481175/810-10-55-4K
Reference 35: http://www.xbrl.org/2003/role/disclosureRef
-Topic 220
-SubTopic 10
-Name Accounting Standards Codification
-Section 45
-Paragraph 1A
-Subparagraph (a)
-Publisher FASB
-URI https://asc.fasb.org//1943274/2147482790/220-10-45-1A
Reference 36: http://www.xbrl.org/2003/role/disclosureRef
-Topic 220
-SubTopic 10
-Name Accounting Standards Codification
-Section 45
-Paragraph 1B
-Subparagraph (a)
-Publisher FASB
-URI https://asc.fasb.org//1943274/2147482790/220-10-45-1B
Reference 37: http://www.xbrl.org/2003/role/disclosureRef
-Topic 230
-SubTopic 10
-Name Accounting Standards Codification
-Section 45
-Paragraph 2
-Publisher FASB
-URI https://asc.fasb.org//1943274/2147482740/230-10-45-2
Reference 38: http://www.xbrl.org/2003/role/disclosureRef
-Topic 810
-SubTopic 10
-Name Accounting Standards Codification
-Section 50
-Paragraph 1A
-Subparagraph (a)(1)
-Publisher FASB
-URI https://asc.fasb.org//1943274/2147481203/810-10-50-1A
Reference 39: http://www.xbrl.org/2003/role/disclosureRef
-Topic 810
-SubTopic 10
-Name Accounting Standards Codification
-Section 50
-Paragraph 1A
-Subparagraph (c)(1)
-Publisher FASB
-URI https://asc.fasb.org//1943274/2147481203/810-10-50-1A
| Name: |
us-gaap_ProfitLoss |
| Namespace Prefix: |
us-gaap_ |
| Data Type: |
xbrli:monetaryItemType |
| Balance Type: |
credit |
| Period Type: |
duration |
|
| X |
- DefinitionThe sum of dilutive potential common shares or units used in the calculation of the diluted per-share or per-unit computation. Reference 1: http://www.xbrl.org/2009/role/commonPracticeRef
-Topic 260
-SubTopic 10
-Name Accounting Standards Codification
-Section 50
-Paragraph 1
-Subparagraph (a)
-Publisher FASB
-URI https://asc.fasb.org//1943274/2147482662/260-10-50-1
| Name: |
us-gaap_WeightedAverageNumberDilutedSharesOutstandingAdjustment |
| Namespace Prefix: |
us-gaap_ |
| Data Type: |
xbrli:sharesItemType |
| Balance Type: |
na |
| Period Type: |
duration |
|
| X |
- DefinitionThe average number of shares or units issued and outstanding that are used in calculating diluted EPS or earnings per unit (EPU), determined based on the timing of issuance of shares or units in the period. Reference 1: http://www.xbrl.org/2003/role/disclosureRef
-Topic 260
-SubTopic 10
-Name Accounting Standards Codification
-Section 50
-Paragraph 1
-Subparagraph (a)
-Publisher FASB
-URI https://asc.fasb.org//1943274/2147482662/260-10-50-1
Reference 2: http://www.xbrl.org/2003/role/disclosureRef
-Topic 260
-SubTopic 10
-Name Accounting Standards Codification
-Section 45
-Paragraph 16
-Publisher FASB
-URI https://asc.fasb.org//1943274/2147482689/260-10-45-16
| Name: |
us-gaap_WeightedAverageNumberOfDilutedSharesOutstanding |
| Namespace Prefix: |
us-gaap_ |
| Data Type: |
xbrli:sharesItemType |
| Balance Type: |
na |
| Period Type: |
duration |
|
| X |
- DefinitionNumber of [basic] shares or units, after adjustment for contingently issuable shares or units and other shares or units not deemed outstanding, determined by relating the portion of time within a reporting period that common shares or units have been outstanding to the total time in that period. Reference 1: http://www.xbrl.org/2003/role/disclosureRef
-Topic 260
-SubTopic 10
-Name Accounting Standards Codification
-Section 50
-Paragraph 1
-Subparagraph (a)
-Publisher FASB
-URI https://asc.fasb.org//1943274/2147482662/260-10-50-1
Reference 2: http://www.xbrl.org/2003/role/disclosureRef
-Topic 260
-SubTopic 10
-Name Accounting Standards Codification
-Section 45
-Paragraph 10
-Publisher FASB
-URI https://asc.fasb.org//1943274/2147482689/260-10-45-10
| Name: |
us-gaap_WeightedAverageNumberOfSharesOutstandingBasic |
| Namespace Prefix: |
us-gaap_ |
| Data Type: |
xbrli:sharesItemType |
| Balance Type: |
na |
| Period Type: |
duration |
|
v3.23.2
v3.23.2
Related Party Transactions (Details) - USD ($)
$ in Thousands |
3 Months Ended |
6 Months Ended |
|
Jun. 30, 2023 |
Jun. 30, 2022 |
Jun. 30, 2023 |
Jun. 30, 2022 |
Dec. 31, 2022 |
| Related Party Transactions, Revenue [Abstract] |
|
|
|
|
|
|
| Other assets |
[1] |
$ 29,146
|
|
$ 29,146
|
|
$ 20,014
|
| Affiliated Funds |
|
|
|
|
|
|
| Related Party Transactions, Revenue [Abstract] |
|
|
|
|
|
|
| Investment advisory and administrative fees |
|
81,113
|
$ 100,803
|
166,612
|
$ 205,040
|
|
| Distribution and service fees |
|
6,977
|
9,005
|
14,539
|
18,874
|
|
| Total |
|
88,090
|
109,808
|
181,151
|
223,914
|
|
| Related party transaction, expenses from transactions with related party |
|
4,300
|
$ 4,300
|
8,900
|
$ 8,600
|
|
| Receivables due from company-sponsored mutual funds |
|
30,700
|
|
30,700
|
|
32,900
|
| Payables due to company-sponsored mutual funds |
|
800
|
|
800
|
|
1,000
|
| Cohen & Steers Income Opportunities REIT |
|
|
|
|
|
|
| Related Party Transactions, Revenue [Abstract] |
|
|
|
|
|
|
| Other assets |
|
$ 6,400
|
|
$ 6,400
|
|
$ 3,500
|
| Reimbursement term |
|
|
|
60 months
|
|
|
| NAV threshold |
|
|
|
$ 1,000,000
|
|
|
|
|
| X |
- DefinitionNet Asset Value Threshold
| Name: |
cns_NetAssetValueThreshold |
| Namespace Prefix: |
cns_ |
| Data Type: |
xbrli:monetaryItemType |
| Balance Type: |
credit |
| Period Type: |
duration |
|
| X |
- DefinitionAmount, after allowance, receivable from customers, clients, or other third-parties, and receivables classified as other due within one year or the normal operating cycle, if longer.
| Name: |
us-gaap_AccountsAndOtherReceivablesNetCurrent |
| Namespace Prefix: |
us-gaap_ |
| Data Type: |
xbrli:monetaryItemType |
| Balance Type: |
debit |
| Period Type: |
instant |
|
| X |
- DefinitionCarrying value as of the balance sheet date of liabilities incurred (and for which invoices have typically been received) and payable to vendors for goods and services received that are used in an entity's business. Used to reflect the current portion of the liabilities (due within one year or within the normal operating cycle if longer). Reference 1: http://www.xbrl.org/2003/role/exampleRef
-Topic 852
-SubTopic 10
-Name Accounting Standards Codification
-Section 55
-Paragraph 10
-Publisher FASB
-URI https://asc.fasb.org//1943274/2147481372/852-10-55-10
Reference 2: http://fasb.org/us-gaap/role/ref/legacyRef
-Name Accounting Standards Codification
-Topic 210
-SubTopic 10
-Section S99
-Paragraph 1
-Subparagraph (SX 210.5-02.19(a))
-Publisher FASB
-URI https://asc.fasb.org//1943274/2147480566/210-10-S99-1
| Name: |
us-gaap_AccountsPayableCurrent |
| Namespace Prefix: |
us-gaap_ |
| Data Type: |
xbrli:monetaryItemType |
| Balance Type: |
credit |
| Period Type: |
instant |
|
| X |
- DefinitionPeriod of time between issuance and maturity of debt instrument, in PnYnMnDTnHnMnS' format, for example, 'P1Y5M13D' represents the reported fact of one year, five months, and thirteen days.
| Name: |
us-gaap_DebtInstrumentTerm |
| Namespace Prefix: |
us-gaap_ |
| Data Type: |
xbrli:durationItemType |
| Balance Type: |
na |
| Period Type: |
duration |
|
| X |
- DefinitionAmount of assets classified as other. Reference 1: http://www.xbrl.org/2003/role/exampleRef
-Topic 946
-SubTopic 830
-Name Accounting Standards Codification
-Section 55
-Paragraph 12
-Publisher FASB
-URI https://asc.fasb.org//1943274/2147480167/946-830-55-12
Reference 2: http://www.xbrl.org/2003/role/disclosureRef
-Topic 944
-SubTopic 210
-Name Accounting Standards Codification
-Section S99
-Paragraph 1
-Subparagraph (SX 210.7-03(a)(10))
-Publisher FASB
-URI https://asc.fasb.org//1943274/2147479440/944-210-S99-1
Reference 3: http://www.xbrl.org/2003/role/disclosureRef
-Topic 210
-SubTopic 10
-Name Accounting Standards Codification
-Section S99
-Paragraph 1
-Subparagraph (SX 210.5-02(17))
-Publisher FASB
-URI https://asc.fasb.org//1943274/2147480566/210-10-S99-1
Reference 4: http://fasb.org/us-gaap/role/ref/legacyRef
-Topic 942
-SubTopic 210
-Name Accounting Standards Codification
-Section S99
-Paragraph 1
-Subparagraph (SX 210.9-03(10))
-Publisher FASB
-URI https://asc.fasb.org//1943274/2147479853/942-210-S99-1
| Name: |
us-gaap_OtherAssets |
| Namespace Prefix: |
us-gaap_ |
| Data Type: |
xbrli:monetaryItemType |
| Balance Type: |
debit |
| Period Type: |
instant |
|
| X |
- DefinitionAmount of revenue recognized from goods sold, services rendered, insurance premiums, or other activities that constitute an earning process. Includes, but is not limited to, investment and interest income before deduction of interest expense when recognized as a component of revenue, and sales and trading gain (loss). Reference 1: http://www.xbrl.org/2003/role/disclosureRef
-Topic 235
-SubTopic 10
-Name Accounting Standards Codification
-Section S99
-Paragraph 1
-Subparagraph (SX 210.4-08(g)(1)(ii))
-Publisher FASB
-URI https://asc.fasb.org//1943274/2147480678/235-10-S99-1
Reference 2: http://www.xbrl.org/2003/role/disclosureRef
-Topic 323
-SubTopic 10
-Name Accounting Standards Codification
-Section 50
-Paragraph 3
-Subparagraph (c)
-Publisher FASB
-URI https://asc.fasb.org//1943274/2147481687/323-10-50-3
Reference 3: http://www.xbrl.org/2003/role/disclosureRef
-Topic 825
-SubTopic 10
-Name Accounting Standards Codification
-Section 50
-Paragraph 28
-Subparagraph (f)
-Publisher FASB
-URI https://asc.fasb.org//1943274/2147482907/825-10-50-28
Reference 4: http://www.xbrl.org/2003/role/disclosureRef
-Topic 220
-SubTopic 10
-Name Accounting Standards Codification
-Section S99
-Paragraph 2
-Subparagraph (SX 210.5-03(1))
-Publisher FASB
-URI https://asc.fasb.org//1943274/2147483621/220-10-S99-2
Reference 5: http://www.xbrl.org/2003/role/disclosureRef
-Topic 470
-SubTopic 10
-Name Accounting Standards Codification
-Section S99
-Paragraph 1A
-Subparagraph (SX 210.13-01(a)(4)(i))
-Publisher FASB
-URI https://asc.fasb.org//1943274/2147480097/470-10-S99-1A
Reference 6: http://www.xbrl.org/2009/role/commonPracticeRef
-Topic 470
-SubTopic 10
-Name Accounting Standards Codification
-Section S99
-Paragraph 1A
-Subparagraph (SX 210.13-01(a)(4)(ii))
-Publisher FASB
-URI https://asc.fasb.org//1943274/2147480097/470-10-S99-1A
Reference 7: http://www.xbrl.org/2003/role/disclosureRef
-Topic 470
-SubTopic 10
-Name Accounting Standards Codification
-Section S99
-Paragraph 1A
-Subparagraph (SX 210.13-01(a)(4)(iii)(A))
-Publisher FASB
-URI https://asc.fasb.org//1943274/2147480097/470-10-S99-1A
Reference 8: http://www.xbrl.org/2003/role/disclosureRef
-Topic 470
-SubTopic 10
-Name Accounting Standards Codification
-Section S99
-Paragraph 1A
-Subparagraph (SX 210.13-01(a)(4)(iv))
-Publisher FASB
-URI https://asc.fasb.org//1943274/2147480097/470-10-S99-1A
Reference 9: http://www.xbrl.org/2003/role/disclosureRef
-Topic 470
-SubTopic 10
-Name Accounting Standards Codification
-Section S99
-Paragraph 1A
-Subparagraph (SX 210.13-01(a)(5))
-Publisher FASB
-URI https://asc.fasb.org//1943274/2147480097/470-10-S99-1A
Reference 10: http://www.xbrl.org/2003/role/disclosureRef
-Topic 470
-SubTopic 10
-Name Accounting Standards Codification
-Section S99
-Paragraph 1B
-Subparagraph (SX 210.13-02(a)(4)(i))
-Publisher FASB
-URI https://asc.fasb.org//1943274/2147480097/470-10-S99-1B
Reference 11: http://www.xbrl.org/2003/role/disclosureRef
-Topic 470
-SubTopic 10
-Name Accounting Standards Codification
-Section S99
-Paragraph 1B
-Subparagraph (SX 210.13-02(a)(4)(iii)(A))
-Publisher FASB
-URI https://asc.fasb.org//1943274/2147480097/470-10-S99-1B
Reference 12: http://www.xbrl.org/2003/role/disclosureRef
-Topic 470
-SubTopic 10
-Name Accounting Standards Codification
-Section S99
-Paragraph 1B
-Subparagraph (SX 210.13-02(a)(4)(iii)(B))
-Publisher FASB
-URI https://asc.fasb.org//1943274/2147480097/470-10-S99-1B
Reference 13: http://www.xbrl.org/2003/role/disclosureRef
-Topic 470
-SubTopic 10
-Name Accounting Standards Codification
-Section S99
-Paragraph 1B
-Subparagraph (SX 210.13-02(a)(4)(iv))
-Publisher FASB
-URI https://asc.fasb.org//1943274/2147480097/470-10-S99-1B
Reference 14: http://www.xbrl.org/2003/role/disclosureRef
-Topic 470
-SubTopic 10
-Name Accounting Standards Codification
-Section S99
-Paragraph 1B
-Subparagraph (SX 210.13-02(a)(5))
-Publisher FASB
-URI https://asc.fasb.org//1943274/2147480097/470-10-S99-1B
Reference 15: http://www.xbrl.org/2003/role/disclosureRef
-Topic 280
-SubTopic 10
-Name Accounting Standards Codification
-Section 50
-Paragraph 30
-Subparagraph (a)
-Publisher FASB
-URI https://asc.fasb.org//1943274/2147482810/280-10-50-30
Reference 16: http://www.xbrl.org/2003/role/disclosureRef
-Topic 280
-SubTopic 10
-Name Accounting Standards Codification
-Section 50
-Paragraph 42
-Publisher FASB
-URI https://asc.fasb.org//1943274/2147482810/280-10-50-42
Reference 17: http://www.xbrl.org/2003/role/disclosureRef
-Topic 280
-SubTopic 10
-Name Accounting Standards Codification
-Section 50
-Paragraph 22
-Subparagraph (b)
-Publisher FASB
-URI https://asc.fasb.org//1943274/2147482810/280-10-50-22
Reference 18: http://www.xbrl.org/2003/role/disclosureRef
-Topic 280
-SubTopic 10
-Name Accounting Standards Codification
-Section 50
-Paragraph 32
-Subparagraph (b)
-Publisher FASB
-URI https://asc.fasb.org//1943274/2147482810/280-10-50-32
Reference 19: http://www.xbrl.org/2003/role/disclosureRef
-Topic 280
-SubTopic 10
-Name Accounting Standards Codification
-Section 50
-Paragraph 40
-Publisher FASB
-URI https://asc.fasb.org//1943274/2147482810/280-10-50-40
Reference 20: http://www.xbrl.org/2003/role/disclosureRef
-Topic 280
-SubTopic 10
-Name Accounting Standards Codification
-Section 50
-Paragraph 22
-Subparagraph (a)
-Publisher FASB
-URI https://asc.fasb.org//1943274/2147482810/280-10-50-22
Reference 21: http://www.xbrl.org/2003/role/disclosureRef
-Topic 280
-SubTopic 10
-Name Accounting Standards Codification
-Section 50
-Paragraph 32
-Subparagraph (a)
-Publisher FASB
-URI https://asc.fasb.org//1943274/2147482810/280-10-50-32
Reference 22: http://www.xbrl.org/2003/role/disclosureRef
-Topic 280
-SubTopic 10
-Name Accounting Standards Codification
-Section 50
-Paragraph 41
-Subparagraph (a)
-Publisher FASB
-URI https://asc.fasb.org//1943274/2147482810/280-10-50-41
Reference 23: http://www.xbrl.org/2003/role/disclosureRef
-Topic 942
-SubTopic 235
-Name Accounting Standards Codification
-Section S99
-Paragraph 1
-Subparagraph (SX 210.9-05(b)(2))
-Publisher FASB
-URI https://asc.fasb.org//1943274/2147479557/942-235-S99-1
| Name: |
us-gaap_Revenues |
| Namespace Prefix: |
us-gaap_ |
| Data Type: |
xbrli:monetaryItemType |
| Balance Type: |
credit |
| Period Type: |
duration |
|
v3.23.2
| X |
- DefinitionThe carrying value as of the balance sheet date of the current and noncurrent portions of long-term obligations drawn from a line of credit, which is a bank's commitment to make loans up to a specific amount. Examples of items that might be included in the application of this element may consist of letters of credit, standby letters of credit, and revolving credit arrangements, under which borrowings can be made up to a maximum amount as of any point in time conditional on satisfaction of specified terms before, as of and after the date of drawdowns on the line. Includes short-term obligations that would normally be classified as current liabilities but for which (a) postbalance sheet date issuance of a long term obligation to refinance the short term obligation on a long term basis, or (b) the enterprise has entered into a financing agreement that clearly permits the enterprise to refinance the short-term obligation on a long term basis and the following conditions are met (1) the agreement does not expire within 1 year and is not cancelable by the lender except for violation of an objectively determinable provision, (2) no violation exists at the BS date, and (3) the lender has entered into the financing agreement is expected to be financially capable of honoring the agreement. Reference 1: http://fasb.org/us-gaap/role/ref/legacyRef
-Name Accounting Standards Codification
-Section S99
-Paragraph 1
-Subparagraph (SX 210.5-02(22))
-SubTopic 10
-Topic 210
-Publisher FASB
-URI https://asc.fasb.org//1943274/2147480566/210-10-S99-1
Reference 2: http://www.xbrl.org/2009/role/commonPracticeRef
-Topic 944
-SubTopic 210
-Name Accounting Standards Codification
-Section S99
-Paragraph 1
-Subparagraph (SX 210.7-03(a)(16)(a)(2))
-Publisher FASB
-URI https://asc.fasb.org//1943274/2147479440/944-210-S99-1
Reference 3: http://fasb.org/us-gaap/role/ref/legacyRef
-Topic 942
-SubTopic 210
-Name Accounting Standards Codification
-Section S99
-Paragraph 1
-Subparagraph (SX 210.9-03(16))
-Publisher FASB
-URI https://asc.fasb.org//1943274/2147479853/942-210-S99-1
| Name: |
us-gaap_LineOfCredit |
| Namespace Prefix: |
us-gaap_ |
| Data Type: |
xbrli:monetaryItemType |
| Balance Type: |
credit |
| Period Type: |
instant |
|
| X |
- DefinitionLine items represent financial concepts included in a table. These concepts are used to disclose reportable information associated with domain members defined in one or many axes to the table.
| Name: |
us-gaap_OtherThanTemporaryImpairmentCreditLossesRecognizedInEarningsLineItems |
| Namespace Prefix: |
us-gaap_ |
| Data Type: |
xbrli:stringItemType |
| Balance Type: |
na |
| Period Type: |
duration |
|
| X |
- Details
| Name: |
us-gaap_CreditFacilityAxis=us-gaap_RevolvingCreditFacilityMember |
| Namespace Prefix: |
|
| Data Type: |
na |
| Balance Type: |
|
| Period Type: |
|
|
v3.23.2
| X |
- DefinitionLong-Term Commitment, Funded Amount
| Name: |
cns_LongTermCommitmentFundedAmount |
| Namespace Prefix: |
cns_ |
| Data Type: |
xbrli:monetaryItemType |
| Balance Type: |
debit |
| Period Type: |
instant |
|
| X |
- DefinitionLine items represent financial concepts included in a table. These concepts are used to disclose reportable information associated with domain members defined in one or many axes to the table. Reference 1: http://www.xbrl.org/2003/role/disclosureRef
-Topic 460
-SubTopic 10
-Name Accounting Standards Codification
-Section 50
-Paragraph 3
-Publisher FASB
-URI https://asc.fasb.org//1943274/2147482425/460-10-50-3
Reference 2: http://www.xbrl.org/2003/role/disclosureRef
-Topic 450
-SubTopic 20
-Name Accounting Standards Codification
-Section 50
-Paragraph 1
-Publisher FASB
-URI https://asc.fasb.org//1943274/2147483076/450-20-50-1
Reference 3: http://www.xbrl.org/2009/role/commonPracticeRef
-Topic 450
-SubTopic 20
-Name Accounting Standards Codification
-Section 50
-Paragraph 4
-Subparagraph (a)
-Publisher FASB
-URI https://asc.fasb.org//1943274/2147483076/450-20-50-4
Reference 4: http://www.xbrl.org/2003/role/disclosureRef
-Topic 450
-SubTopic 20
-Name Accounting Standards Codification
-Section 50
-Paragraph 4
-Subparagraph (b)
-Publisher FASB
-URI https://asc.fasb.org//1943274/2147483076/450-20-50-4
Reference 5: http://www.xbrl.org/2009/role/commonPracticeRef
-Topic 450
-SubTopic 20
-Name Accounting Standards Codification
-Section 50
-Paragraph 9
-Subparagraph (a)
-Publisher FASB
-URI https://asc.fasb.org//1943274/2147483076/450-20-50-9
Reference 6: http://www.xbrl.org/2003/role/disclosureRef
-Topic 450
-SubTopic 20
-Name Accounting Standards Codification
-Section 50
-Paragraph 9
-Subparagraph (b)
-Publisher FASB
-URI https://asc.fasb.org//1943274/2147483076/450-20-50-9
| Name: |
us-gaap_LossContingenciesLineItems |
| Namespace Prefix: |
us-gaap_ |
| Data Type: |
xbrli:stringItemType |
| Balance Type: |
na |
| Period Type: |
duration |
|
| X |
- DefinitionMinimum amount of other commitment not otherwise specified in the taxonomy. Excludes commitments explicitly modeled in the taxonomy, including but not limited to, long-term and short-term purchase commitments, recorded and unrecorded purchase obligations, supply commitments, registration payment arrangements, leases, debt, product warranties, guarantees, environmental remediation obligations, and pensions.
| Name: |
us-gaap_OtherCommitment |
| Namespace Prefix: |
us-gaap_ |
| Data Type: |
xbrli:monetaryItemType |
| Balance Type: |
credit |
| Period Type: |
instant |
|
| X |
- Details
| Name: |
dei_LegalEntityAxis=cns_CohenSteersRealEstateOpportunitiesFundLPMember |
| Namespace Prefix: |
|
| Data Type: |
na |
| Balance Type: |
|
| Period Type: |
|
|
| X |
- Details
| Name: |
us-gaap_OtherCommitmentsAxis=cns_CommitmenttoinvestMember |
| Namespace Prefix: |
|
| Data Type: |
na |
| Balance Type: |
|
| Period Type: |
|
|
| X |
- Details
| Name: |
dei_LegalEntityAxis=cns_CohenSteersIncomeOpportunitiesREITMember |
| Namespace Prefix: |
|
| Data Type: |
na |
| Balance Type: |
|
| Period Type: |
|
|
v3.23.2
| X |
- DefinitionAggregate dividends declared during the period for each share of common stock outstanding. Reference 1: http://fasb.org/us-gaap/role/ref/legacyRef
-Topic 505
-SubTopic 10
-Name Accounting Standards Codification
-Section S99
-Paragraph 1
-Subparagraph (SX 210.3-04)
-Publisher FASB
-URI https://asc.fasb.org//1943274/2147480008/505-10-S99-1
| Name: |
us-gaap_CommonStockDividendsPerShareDeclared |
| Namespace Prefix: |
us-gaap_ |
| Data Type: |
dtr-types:perShareItemType |
| Balance Type: |
na |
| Period Type: |
duration |
|
| X |
- DefinitionDetail information of subsequent event by type. User is expected to use existing line items from elsewhere in the taxonomy as the primary line items for this disclosure, which is further associated with dimension and member elements pertaining to a subsequent event. Reference 1: http://www.xbrl.org/2003/role/disclosureRef
-Topic 830
-SubTopic 30
-Name Accounting Standards Codification
-Section 50
-Paragraph 2
-Publisher FASB
-URI https://asc.fasb.org//1943274/2147481674/830-30-50-2
Reference 2: http://www.xbrl.org/2003/role/disclosureRef
-Topic 855
-SubTopic 10
-Name Accounting Standards Codification
-Section 50
-Paragraph 2
-Publisher FASB
-URI https://asc.fasb.org//1943274/2147483399/855-10-50-2
| Name: |
us-gaap_SubsequentEventLineItems |
| Namespace Prefix: |
us-gaap_ |
| Data Type: |
xbrli:stringItemType |
| Balance Type: |
na |
| Period Type: |
duration |
|
| X |
- Details
| Name: |
us-gaap_DividendsAxis=us-gaap_DividendDeclaredMember |
| Namespace Prefix: |
|
| Data Type: |
na |
| Balance Type: |
|
| Period Type: |
|
|
| X |
- Details
| Name: |
us-gaap_SubsequentEventTypeAxis=us-gaap_SubsequentEventMember |
| Namespace Prefix: |
|
| Data Type: |
na |
| Balance Type: |
|
| Period Type: |
|
|


 Hot Features