We could not find any results for:
Make sure your spelling is correct or try broadening your search.
| Share Name | Share Symbol | Market | Type |
|---|---|---|---|
| BCE Inc | NYSE:BCE | NYSE | Common Stock |
| Price Change | % Change | Share Price | High Price | Low Price | Open Price | Shares Traded | Last Trade | |
|---|---|---|---|---|---|---|---|---|
| 0.00 | 0.00% | 33.94 | 0 | 09:00:00 |
| For the month of: | November 2023 | Commission File Number: | 1-8481 | ||||||||
BCE Inc. | |||||
| By: | (signed) Curtis Millen | ||||
| Curtis
Millen Executive Vice-President and Chief Financial Officer | |||||
| Date: | November 2, 2023 | ||||
Exhibit 99.1
MD&A
Management’s discussion and analysis
Table of contents
| 1 |
Overview | 6 | ||||||
| 1.1 | Financial highlights | 6 | ||||||
| 1.2 | Key corporate and business developments | 8 | ||||||
| 1.3 | Assumptions | 9 | ||||||
| 2 |
Consolidated financial analysis | 10 | ||||||
| 2.1 | BCE consolidated income statements | 10 | ||||||
| 2.2 | Customer connections | 11 | ||||||
| 2.3 | Operating revenues | 12 | ||||||
| 2.4 | Operating costs | 13 | ||||||
| 2.5 | Net earnings | 14 | ||||||
| 2.6 | Adjusted EBITDA | 14 | ||||||
| 2.7 | Severance, acquisition and other costs | 15 | ||||||
| 2.8 | Depreciation and amortization | 15 | ||||||
| 2.9 | Finance costs | 15 | ||||||
| 2.10 | Impairment of assets | 15 | ||||||
| 2.11 | Other expense | 16 | ||||||
| 2.12 | Income taxes | 16 | ||||||
| 2.13 | Net earnings attributable to common shareholders and EPS | 16 | ||||||
| 3 |
Business segment analysis | 17 | ||||||
| 3.1 | Bell CTS | 17 | ||||||
| 3.2 | Bell Media | 24 | ||||||
| 4 |
Financial and capital management | 27 | ||||||
| 4.1 | Net debt | 27 | ||||||
| 4.2 | Outstanding share data | 27 | ||||||
| 4.3 | Cash flows | 28 | ||||||
| 4.4 | Post-employment benefit plans | 30 | ||||||
| 4.5 | Financial risk management | 31 | ||||||
| 4.6 | Credit ratings | 33 | ||||||
| 4.7 | Liquidity | 33 | ||||||
| 4.8 | Litigation | 33 | ||||||
| 5 |
Quarterly financial information | 34 | ||||||
| 6 |
Regulatory environment | 35 | ||||||
| 7 |
Accounting policies | 36 | ||||||
| 8 |
Non-GAAP financial measures, other financial measures and key performance indicators (KPIs) | 37 | ||||||
| 8.1 | Non-GAAP financial measures | 37 | ||||||
| 8.2 | Non-GAAP ratios | 40 | ||||||
| 8.3 | Total of segments measures | 40 | ||||||
| 8.4 | Capital management measures | 41 | ||||||
| 8.5 | Supplementary financial measures | 41 | ||||||
| 8.6 | KPIs | 42 | ||||||
| 9 |
Controls and procedures | 43 | ||||||
3
MD&A
Management’s discussion and analysis
In this management’s discussion and analysis (MD&A), we, us, our, BCE and the company mean, as the context may require, either BCE Inc. or, collectively, BCE Inc., Bell Canada, their subsidiaries, joint arrangements and associates. Bell means, as the context may require, either Bell Canada or, collectively, Bell Canada, its subsidiaries, joint arrangements and associates.
All amounts in this MD&A are in millions of Canadian dollars, except where noted. Please refer to section 8, Non-GAAP financial measures, other financial measures and key performance indicators (KPIs) for a list of defined non-GAAP financial measures, other financial measures and KPIs.
Please refer to BCE’s unaudited consolidated financial statements for the third quarter of 2023 (Q3 2023 Financial Statements) when reading this MD&A. We also encourage you to read BCE’s MD&A for the year ended December 31, 2022 dated March 2, 2023 (BCE 2022 Annual MD&A) as updated in BCE’s MD&A for the first quarter of 2023 dated May 3, 2023 (BCE 2023 First Quarter MD&A) and BCE’s MD&A for the second quarter of 2023 dated August 2, 2023 (BCE 2023 Second Quarter MD&A). In preparing this MD&A, we have taken into account information available to us up to November 1, 2023, the date of this MD&A, unless otherwise stated.
You will find additional information relating to BCE, including BCE’s annual information form for the year ended December 31, 2022 dated March 2, 2023 (BCE 2022 AIF) and recent financial reports, including the BCE 2022 Annual MD&A, the BCE 2023 First Quarter MD&A and the BCE 2023 Second Quarter MD&A, on BCE’s website at BCE.ca, on SEDAR+ at sedarplus.ca and on EDGAR at sec.gov.
Documents and other information contained in BCE’s website or in any other site referred to in BCE’s website or in this MD&A are not part of this MD&A and are not incorporated by reference herein.
This MD&A comments on our business operations, performance, financial position and other matters for the three months (Q3) and nine months (YTD) ended September 30, 2023 and 2022.
Caution regarding forward-looking statements
This MD&A and, in particular, but without limitation, section 1.2, Key corporate and business developments, the section and sub-sections entitled Assumptions and section 4.7, Liquidity, contain forward-looking statements. These forward-looking statements include, without limitation, statements relating to the expectation that our available liquidity, 2023 estimated cash flows from operations and capital markets financing will permit us to meet our cash requirements in 2023, our environmental, social and governance (ESG) objectives, including our board of directors diversity target and our goal to achieve our science-based targets (SBTs) and annual sustainability performance targets for greenhouse gas (GHG) emissions reduction and supplier engagement, the expected timing and completion of the proposed acquisition of the Canadian out-of-home media business of OUTFRONT Media Inc. and the benefits expected to result therefrom, potential future purchases by BCE of its preferred shares pursuant to a normal course issuer bid (NCIB), BCE’s business outlook, objectives, plans and strategic priorities, and other statements that do not refer to historical facts. A statement we make is forward-looking when it uses what we know and expect today to make a statement about the future. Forward-looking statements are typically identified by the words assumption, goal, guidance, objective, outlook, project, strategy, target, commitment and other similar expressions or future or conditional verbs such as aim, anticipate, believe, could, expect, intend, may, plan, seek, should, strive and will. All such forward-looking statements are made pursuant to the safe harbour provisions of applicable Canadian securities laws and of the United States (U.S.) Private Securities Litigation Reform Act of 1995.
Unless otherwise indicated by us, forward-looking statements in this MD&A describe our expectations as at November 1, 2023 and, accordingly, are subject to change after that date. Except as may be required by applicable securities laws, we do not undertake any obligation to update or revise any forward-looking statements, whether as a result of new information, future events or otherwise.
Forward-looking statements, by their very nature, are subject to inherent risks and uncertainties and are based on several assumptions, both general and specific, which give rise to the possibility that actual results or events could differ materially from our expectations expressed in, or implied by, such forward-looking statements and that our business outlook, objectives, plans and strategic priorities may not be achieved. These statements are not guarantees of future performance or events, and we caution you against relying on any of these forward-looking statements. Forward-looking statements are presented in this MD&A for the purpose of assisting investors and others in understanding our objectives, strategic priorities and business outlook as well as our anticipated operating environment. Readers are cautioned, however, that such information may not be appropriate for other purposes.
We have made certain economic, market, operational and other assumptions in preparing the forward-looking statements contained in this MD&A and, in particular, but without limitation, the forward-looking statements contained in the previously mentioned sections of this MD&A. These assumptions include, without limitation, the assumptions described in this section and in the section and sub-sections of this MD&A entitled Assumptions, which section and sub-sections are incorporated by reference in this cautionary statement. Subject to various factors including, without limitation, the future impacts of general economic conditions and of geopolitical events, which are difficult to predict, we believe that our assumptions were reasonable at November 1, 2023. If our assumptions turn out to be inaccurate, our actual results could be materially different from what we expect.
Important risk factors that could cause actual results or events to differ materially from those expressed in, or implied by, the previously-mentioned forward-looking statements and other forward-looking statements contained in this MD&A, include, but are not limited to: the negative effect of adverse economic conditions, including a potential recession, and related inflationary cost pressures, higher interest rates and financial and capital market volatility; the negative effect of adverse conditions associated with geopolitical events; a declining level of business and consumer spending, and the resulting negative impact on the demand for, and prices of, our products and services; regulatory initiatives, proceedings and decisions, government consultations and government positions that affect us and influence our business including, without limitation, concerning mandatory access to networks, spectrum auctions, the imposition of consumer-related codes of conduct, approval of acquisitions, broadcast and spectrum licensing, foreign ownership requirements, privacy and cybersecurity obligations and control of copyright piracy; the inability to implement enhanced compliance frameworks and to comply with legal and regulatory obligations; unfavourable resolution of legal proceedings; the intensity of competitive activity and the failure to effectively respond to evolving competitive dynamics; the combination of Rogers Communications Inc. and Shaw Communications Inc. creating a Canadian competitor with larger scale, and the acquisition of Freedom Mobile by Videotron Ltd. (Videotron) also increasing its scale with a change in competitive dynamics in several provinces; the level of technological substitution and the presence of alternative service providers contributing to disruptions and disintermediation in each of our business segments; changing customer behaviour and the expansion of cloud-based, over-the-top
| 4 | BCE INC. 2023 THIRD QUARTER SHAREHOLDER REPORT |
MD&A
(OTT) and other alternative solutions; advertising market pressures from economic conditions, fragmentation and non-traditional/global digital services; rising content costs and challenges in our ability to acquire or develop key content; higher Canadian smartphone penetration and reduced or slower immigration flow; the inability to protect our physical and non-physical assets from events such as information security attacks, unauthorized access or entry, fire and natural disasters; the failure to implement effective data governance; the failure to evolve and transform our networks, systems and operations using next-generation technologies while lowering our cost structure; the inability to drive a positive customer experience; the failure to attract, develop and retain a diverse and talented team capable of furthering our strategic imperatives; the failure to adequately manage health and safety concerns; labour disruptions and shortages; the failure to maintain operational networks; the risk that we may need to incur significant capital expenditures to provide additional capacity and reduce network congestion; the inability to maintain service consistency due to network failures or slowdowns, the failure of other infrastructure, or disruptions in the delivery of services; service interruptions or outages due to legacy infrastructure and the possibility of instability as we transition towards converged wireline and wireless networks and newer technologies; the failure by us, or by other telecommunications carriers on which we rely to provide services, to complete planned and sufficient testing, maintenance, replacement or upgrade of our or their networks, equipment and other facilities, which could disrupt our operations including through network or other infrastructure failures; events affecting the functionality of, and our ability to protect, test, maintain, replace and upgrade, our networks, information technology (IT) systems, equipment and other facilities; the complexity of our operations; the failure to implement or maintain highly effective processes and IT systems; in-orbit and other operational risks to which the satellites used to provide our satellite television (TV) services are subject; our dependence on third-party suppliers, outsourcers, and consultants to provide an uninterrupted supply of the products and services we need; the failure of our vendor selection, governance and oversight processes, including our management of supplier risk in the areas of security, data governance and responsible procurement; the quality of our products and services and the extent to which they may be subject to defects or fail to comply with applicable government regulations and standards; reputational risks and the inability to meaningfully integrate ESG considerations into our business strategy and operations; the failure to take appropriate actions to adapt to current and emerging environmental impacts, including climate change; pandemics, epidemics and other health risks, including health concerns about radio frequency emissions from wireless communications devices and equipment; the inability to adequately manage social issues; the failure to develop and implement strong corporate governance practices; various internal and external factors could challenge our ability to achieve our ESG targets including, without limitation, those related to GHG emissions reduction and diversity, equity, inclusion and belonging; the inability to access adequate sources of capital and generate sufficient cash flows from operating activities to meet our cash requirements, fund capital expenditures and provide for planned growth; uncertainty as to whether dividends will be declared by BCE’s board of directors or whether the dividend on common shares will be increased; the inability to manage various credit, liquidity and market risks; the failure to reduce costs, as well as unexpected increases in costs; the failure to evolve practices to effectively monitor and control fraudulent activities; new or higher taxes due to new tax laws or changes thereto or in the interpretation thereof, and the inability to predict the outcome of government audits; the impact on our financial statements and estimates from a number of factors; pension obligation volatility and increased contributions to post-employment benefit plans; and the expected timing and completion of the proposed acquisition of the Canadian out-of-home media business of OUTFRONT Media Inc. is subject to closing conditions and other risks and uncertainties, and there can be no certainty that the anticipated benefits will be realized.
We caution that the foregoing list of risk factors is not exhaustive and other factors could also materially adversely affect us. Please see section 9, Business risks of the BCE 2022 Annual MD&A for a more complete description of the above-mentioned and other risks, which section, and the other sections of the BCE 2022 Annual MD&A referred to therein, are incorporated by reference in this cautionary statement. In addition, please see section 4.8, Litigation in the BCE 2023 Second Quarter MD&A and in this MD&A for an update to the legal proceedings described in the BCE 2022 AIF, which sections 4.8 are incorporated by reference in this cautionary statement. Please also see section 6, Regulatory environment in the BCE 2023 First Quarter MD&A, in the BCE 2023 Second Quarter MD&A and in this MD&A for an update to the regulatory initiatives and proceedings described in the BCE 2022 Annual MD&A, which sections 6 are incorporated by reference in this cautionary statement. Please also see section 7, Competitive environment in the BCE 2023 First Quarter MD&A for an update to the risk factors relating to our competitive environment described in the BCE 2022 Annual MD&A, which section 7 is incorporated by reference in this cautionary statement. Any of those risks could cause actual results or events to differ materially from our expectations expressed in, or implied by, the forward-looking statements set out in this MD&A. Except for the updates set out in section 6, Regulatory environment and in section 7, Competitive environment of the BCE 2023 First Quarter MD&A; in section 4.8, Litigation and in section 6, Regulatory environment of the BCE 2023 Second Quarter MD&A; as well as in section 4.8, Litigation and in section 6, Regulatory environment in this MD&A, the risks described in the BCE 2022 Annual MD&A remain substantially unchanged.
Forward-looking statements contained in this MD&A for periods beyond 2023 involve longer-term assumptions and estimates than forward-looking statements for 2023 and are consequently subject to greater uncertainty. In particular, our GHG emissions reduction and supplier engagement targets are based on a number of assumptions including, without limitation, the following principal assumptions: implementation of various corporate and business initiatives to reduce our electricity and fuel consumption, as well as reduce other direct and indirect GHG emissions enablers; no new corporate initiatives, business acquisitions, business divestitures or technologies that would materially change our anticipated levels of GHG emissions; our ability to purchase sufficient credible carbon credits and renewable energy certificates to offset or further reduce our GHG emissions; no negative impact on the calculation of our GHG emissions from refinements in or modifications to international standards or the methodology we use for the calculation of such GHG emissions; no required changes to our SBTs pursuant to the Science Based Targets initiative (SBTi) methodology that would make the achievement of our updated SBTs more onerous or unachievable in light of business requirements; and sufficient supplier engagement and collaboration in setting their own SBTs, no significant change in the allocation of our spend by supplier and sufficient collaboration with partners in reducing their own GHG emissions.
Forward-looking statements for periods beyond 2023 further assume, unless otherwise indicated, that the risks described above and in section 9, Business risks of the BCE 2022 Annual MD&A will remain substantially unchanged during such periods, except for an assumed improvement in the risks related to the COVID-19 pandemic in future years.
Additional risks and uncertainties not currently known to us or that we currently deem to be immaterial may also have a material adverse effect on our business, financial condition, liquidity, financial results or reputation. We regularly consider potential acquisitions, dispositions, mergers, business combinations, investments, monetizations, joint ventures and other transactions, some of which may be significant. Except as otherwise indicated by us, forward-looking statements do not reflect the potential impact of any such transactions or of special items that may be announced or that may occur after November 1, 2023. The financial impact of these transactions and special items can be complex and depends on facts particular to each of them. We therefore cannot describe the expected impact in a meaningful way, or in the same way we present known risks affecting our business.
5
1 MD&A Overview
| 1 | Overview |
In 2022, we began modifying our internal and external reporting processes to align with organizational changes that were made to reflect an increasing strategic focus on multiproduct sales, the continually increasing technological convergence of our wireless and wireline telecommunications infrastructure and operations driven by the deployment of our Fifth Generation (5G) and fibre networks, and our digital transformation. These factors have made it increasingly difficult to distinguish between our wireless and wireline operations and resulted in changes in Q1 2023 to the financial information that is regularly provided to our chief operating decision maker to measure performance and allocate resources.
Effective with our Q1 2023 results, our previous Bell Wireless and Bell Wireline operating segments were combined to form a single reporting segment called Bell Communication and Technology Services (Bell CTS). Bell Media remains a distinct reportable segment and is unaffected. Our results are therefore reported in two segments: Bell CTS and Bell Media. As a result of our reporting changes, prior periods have been restated for comparative purposes.
| 1.1 | Financial highlights |
BCE Q3 2023 selected quarterly information
| Operating revenues | Net earnings | Adjusted EBITDA (1) | ||
| $6,080 | $707 | $2,667 | ||
| million | million | million | ||
| 0.9% vs. Q3 2022 | (8.3%) vs. Q3 2022 | 3.1% vs. Q3 2022 | ||
| Net earnings attributable | Adjusted net earnings (1) | Cash flows from | Free cash flow (1) | |||
| to common shareholders | operating activities | |||||
| $640 | $741 | $1,961 | $754 | |||
| million | million | million | million | |||
| (10.5%) vs. Q3 2022 | (7.5%) vs. Q3 2022 | (1.8%) vs. Q3 2022 | 17.4% vs. Q3 2022 | |||
|
BCE customer connections
| ||||||
| Total mobile phones (3) | Retail high-speed | Retail TV (2) (5) | Retail residential network | |||
| Internet (2) (4) (5) | access services (NAS) lines (2) (5) | |||||
| +3.8% | +8.6% | (0.3%) | (4.8%) | |||
| 10.2 million subscribers | 4.4 million subscribers | 2.7 million subscribers | 2.1 million subscribers | |||
| at September 30, 2023 | at September 30, 2023 | at September 30, 2023 | at September 30, 2023 | |||
| (1) | Adjusted EBITDA is a total of segments measure, and adjusted net earnings and free cash flow are non-GAAP financial measures. See section 8.3, Total of segments measures and section 8.1, Non-GAAP financial measures in this MD&A for more information on these measures. |
| (2) | In Q2 2023, our retail high-speed Internet, retail Internet protocol television (IPTV) and retail residential NAS lines subscriber bases increased by 35,080, 243 and 7,458 subscribers, respectively, as a result of small acquisitions. |
| (3) | In Q1 2023, we adjusted our mobile phone postpaid subscriber base to remove older non-revenue generating business subscribers of 73,229. |
| (4) | In Q1 2023, subsequent to a review of customer account records, our retail high-speed Internet subscriber base was reduced by 7,347 subscribers. |
| (5) | In Q4 2022, as a result of the acquisition of Distributel Communications Limited (Distributel), our retail high-speed Internet, retail IPTV and retail residential NAS lines subscriber bases increased by 128,065, 2,315 and 64,498 subscribers, respectively. |
| 6 | BCE INC. 2023 THIRD QUARTER SHAREHOLDER REPORT |
1 MD&A Overview
BCE income statements – selected information
| Q3 2023 | Q3 2022 | $ change | % change | YTD 2023 | YTD 2022 | $ change | % change | |||||||||||||||||||||||||
| Operating revenues |
||||||||||||||||||||||||||||||||
| Service |
5,281 | 5,193 | 88 | 1.7% | 15,806 | 15,603 | 203 | 1.3% | ||||||||||||||||||||||||
| Product |
799 | 831 | (32 | ) | (3.9% | ) | 2,394 | 2,132 | 262 | 12.3% | ||||||||||||||||||||||
| Total operating revenues |
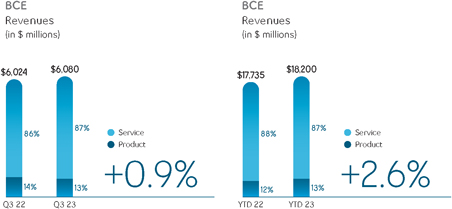
6,080 | 6,024 | 56 | 0.9% | 18,200 | 17,735 | 465 | 2.6% | ||||||||||||||||||||||||
| Operating costs |
(3,413 | ) | (3,436 | ) | 23 | 0.7% | (10,350 | ) | (9,973 | ) | (377 | ) | (3.8% | ) | ||||||||||||||||||
| Adjusted EBITDA |
2,667 | 2,588 | 79 | 3.1% | 7,850 | 7,762 | 88 | 1.1% | ||||||||||||||||||||||||
| Adjusted EBITDA margin (1) |
43.9% | 43.0% | 0.9 pts | 43.1% | 43.8% | (0.7) pts | ||||||||||||||||||||||||||
| Net earnings attributable to: |
||||||||||||||||||||||||||||||||
| Common shareholders |
640 | 715 | (75 | ) | (10.5% | ) | 1,694 | 2,188 | (494 | ) | (22.6% | ) | ||||||||||||||||||||
| Preferred shareholders |
47 | 39 | 8 | 20.5% | 139 | 108 | 31 | 28.7% | ||||||||||||||||||||||||
|
Non-controlling interest |
20 | 17 | 3 | 17.6% | 59 | 63 | (4 | ) | (6.3% | ) | ||||||||||||||||||||||
| Net earnings |
707 | 771 | (64 | ) | (8.3% | ) | 1,892 | 2,359 | (467 | ) | (19.8% | ) | ||||||||||||||||||||
| Adjusted net earnings |
741 | 801 | (60 | ) | (7.5% | ) | 2,235 | 2,403 | (168 | ) | (7.0% | ) | ||||||||||||||||||||
| Net earnings per common share (EPS) |
0.70 | 0.78 | (0.08 | ) | (10.3% | ) | 1.86 | 2.40 | (0.54 | ) | (22.5% | ) | ||||||||||||||||||||
| Adjusted EPS (2) |
0.81 | 0.88 | (0.07 | ) | (8.0% | ) | 2.45 | 2.64 | (0.19 | ) | (7.2% | ) | ||||||||||||||||||||
| (1) | Adjusted EBITDA margin is defined as adjusted EBITDA divided by operating revenues. |
| (2) | Adjusted EPS is a non-GAAP ratio. Refer to section 8.2, Non-GAAP ratios in this MD&A for more information on this measure. |
BCE statements of cash flows – selected information
| Q3 2023 | Q3 2022 | $ change | % change | YTD 2023 | YTD 2022 | $ change | % change | |||||||||||||||||||||||||
| Cash flows from operating activities |
1,961 | 1,996 | (35 | ) | (1.8% | ) | 5,573 | 6,309 | (736 | ) | (11.7% | ) | ||||||||||||||||||||
| Capital expenditures |
(1,159 | ) | (1,317 | ) | 158 | 12.0% | (3,552 | ) | (3,495 | ) | (57 | ) | (1.6% | ) | ||||||||||||||||||
| Free cash flow |
754 | 642 | 112 | 17.4% | 1,855 | 2,691 | (836 | ) | (31.1% | ) | ||||||||||||||||||||||
Q3 2023 financial highlights
BCE operating revenues grew by 0.9% in Q3 2023, compared to Q3 2022, driven by higher service revenues of 1.7%, partly offset by lower product revenues of 3.9%. The increase in service revenues was driven by ongoing growth in wireless and Internet revenues, along with the contribution from various acquisitions and higher media subscriber revenues. This was partly offset by continued erosion in voice and satellite TV revenues and reduced media advertising revenues, mainly as a result of the advertising recession. The decline in product revenues was primarily attributable to timing of sales to large business customers.
Net earnings and net earnings attributable to common shareholders in the third quarter of 2023 decreased by $64 million and $75 million, respectively, compared to the same period last year, mainly due to higher interest expense, higher income taxes and higher depreciation and amortization, partly offset by higher adjusted EBITDA.
BCE’s adjusted EBITDA increased by 3.1% in the third quarter of 2023, compared to the same period last year, due to growth in both our Bell CTS and Bell Media segments. The year-over-year increase in adjusted EBITDA was driven by higher operating revenues, coupled with lower operating expenses, including the favourable impact from various cost reduction initiatives and operating efficiencies across the company. This resulted in a corresponding adjusted EBITDA margin of 43.9% in Q3 2023, up 0.9 pts over the same period last year, due to a reduced proportion of low-margin product sales in our total revenue base, lower operating costs and service revenue flow-through.
BCE’s EPS of $0.70 in Q3 2023 decreased by $0.08 compared to the same period last year.
In the third quarter of 2023, adjusted net earnings, which excludes the impact of severance, acquisition and other costs, net mark-to-market gains (losses) on derivatives used to economically hedge equity settled share-based compensation plans, net equity gains (losses) on investments in associates and joint ventures, net gains (losses) on investments, early debt redemption costs and impairment of assets, net of tax and NCI, was $741 million, or $0.81 per common share, compared to $801 million, or $0.88 per common share, for the same period last year.
Cash flows from operating activities in the third quarter of 2023 decreased by $35 million, compared to the same period last year, mainly due to lower cash from working capital, due in part to timing of supplier payments, and higher interest paid, partly offset by higher adjusted EBITDA.
Free cash flow in Q3 2023 increased by $112 million, compared to the same period last year, due to lower capital expenditures, partly offset by lower cash flows from operating activities, excluding cash from acquisition and other costs paid.
7
1 MD&A Overview
| 1.2 | Key corporate and business developments |
This section contains forward-looking statements, including relating to our ESG objectives, the proposed acquisition of the Canadian out-of-home media business of OUTFRONT Media Inc., and potential future purchases by BCE of its preferred shares pursuant to a NCIB. Refer to the section Caution regarding forward-looking statements at the beginning of this MD&A.
Appointment to BCE’s and Bell Canada’s Boards of Directors
On November 1, 2023, Johan Wibergh was appointed to the BCE and Bell Canada Boards of Directors. Mr. Wibergh is the former Chief Technology and Information Officer of Vodafone Group Plc. Previously, Mr. Wibergh was Executive Vice President and Head of Business Unit Networks for Telefonaktiebolaget LM Ericsson. He brings to BCE’s and Bell Canada’s Boards a wealth of experience in technology innovation and leadership in networking and telecommunications. Mr. Wibergh is also a corporate director who serves on the board of directors of Trimble Inc., Inception Holdings, LLC (comprising Marconi, LLC and Avanci, LLC), and Cohere Technologies.
Following the appointment of Johan Wibergh, 33% of all directors identify as women. The BCE Board will be temporarily below its target of a minimum of 35% gender diverse directors, to allow for an orderly transition ahead of the retirement of Robert C. Simmonds at the 2024 Annual General Shareholder Meeting, after which directors identifying as women will represent more than 35% of all directors.
BCE executive team update
On November 1, 2023, Sean Cohan assumed leadership of Bell Media and joined the BCE leadership team, following the retirement of Wade Oosterman as President of Bell Media. Sean Cohan joined Bell Media after having spent decades in media and consumer businesses, including a 15-year tenure at A+E Networks ultimately in the role of President, International and Digital Media. He and his A+E teams are credited with driving global content, digital, and commercial transformation and notable growth across the business. Wade Oosterman will remain in his role as Vice-Chair, BCE Inc. and Bell Canada until early January 2024, and will provide support to the new President of Bell Media to ensure a smooth transition.
Public debt offering
On August 11, 2023, Bell Canada completed a public offering in Canada of Cdn $1.0 billion of medium-term notes (MTN) debentures in two series pursuant to its MTN program. The $600 million Series M-60 MTN debentures will mature on November 14, 2028 and carry an annual interest rate of 5.15%. The $400 million Series M-61 MTN debentures will mature on August 11, 2053 and carry an annual interest rate of 5.60%. The net proceeds of the offering were used to repay short-term debt and for general corporate purposes.
Amendments to securitization program to add sustainability-linked pricing
Bell amended its existing Cdn $2.3 billion securitization program to add sustainability-linked pricing. These amendments underscore Bell’s continued focus on ESG priorities and our purpose to advance how Canadians connect with each other and the world. The amendments introduce an annual pricing adjustment that reduces or increases the financing cost based on Bell’s performance of two key annual sustainability performance targets (SPTs) related to the following Bell science-based targets for GHG emissions reduction and supplier engagement (1):
| • | Reducing absolute scope 1 and 2 GHG emissions 58% by 2030 from a 2020 base year; and |
| • | Reaching 64% of our suppliers by spend, covering purchased goods and services, having science-based targets by 2026. |
Bell selected these two targets as they collectively cover the vast majority (2) of Bell’s total carbon footprint.
Proposed acquisition of the Canadian out-of-home media business
of OUTFRONT Media Inc.
On October 23, 2023, Bell Media announced it plans to acquire the Canadian out-of-home media business of OUTFRONT Media Inc. The transaction is valued at $410 million, subject to certain adjustments, and is expected to close in the first half of 2024, subject to regulatory approval and other closing conditions. The acquisition of the Canadian out-of-home media business of OUTFRONT Media Inc. is expected to support Bell Media’s digital media strategy and to deliver impactful, multi-channel marketing solutions coast-to-coast. The results of the Canadian out-of-home media business of OUTFRONT Media Inc. will be included in our Bell Media segment.
| (1) | The Science Based Targets initiative (SBTi) has approved our targets in 2022, prior to the recalculation to reflect restated GHG emissions for our 2020 base year. The impact of this recalculation is a targeted reduction of our absolute scope 1 and 2 GHG emissions of 58% instead of 57% by 2030, from a 2020 base year. This recalculation does not impact our other science-based targets covering scope 3 GHG emissions. The recalculated target has been submitted to the SBTi for approval on October 20, 2023. Our science-based targets may need to be further adjusted in the future because the SBTi requires that targets be recalculated (following the most recent applicable SBTi criteria and recommendations) at a minimum every five years, or more often if significant changes occur (e.g. business acquisitions/divestitures). |
| (2) | GHG emissions from our scope 1 and 2, and category 1 (purchased goods and services) of scope 3 represented 84% of BCE’s total GHG emissions in 2022. |
| 8 | BCE INC. 2023 THIRD QUARTER SHAREHOLDER REPORT |
1 MD&A Overview
Renewal of normal course issuer bid for BCE first preferred shares
On November 1, 2023, BCE’s Board of Directors authorized the company to renew its NCIB to purchase for cancellation up to 10% of the public float of each series of BCE’s outstanding First Preferred Shares (Preferred Shares) that are listed on the Toronto Stock Exchange (TSX). The NCIB will extend from November 9, 2023 to November 8, 2024, or an earlier date should BCE complete its purchases under the NCIB. Under the NCIB, BCE is authorized to repurchase up to 789,480 Series R Preferred Shares, 206,496 Series S Preferred Shares, 535,483 Series T Preferred Shares, 666,705 Series Y Preferred Shares, 278,569 Series Z Preferred Shares, 1,160,466 Series AA Preferred Shares, 705,563 Series AB Preferred Shares, 650,577 Series AC Preferred Shares, 1,267,112 Series AD Preferred Shares, 609,791 Series AE Preferred Shares, 914,538 Series AF Preferred Shares, 863,693 Series AG Preferred Shares, 487,837 Series AH Preferred Shares, 936,254 Series AI Preferred Shares, 427,996 Series AJ Preferred Shares, 2,245,531 Series AK Preferred Shares, 176,118 Series AL Preferred Shares, 1,025,397 Series AM Preferred Shares, 104,232 Series AN Preferred Shares and 841,041 Series AQ Preferred Shares, representing approximately 10% of the public float in respect of each series of Preferred Shares. The actual number of Preferred Shares to be repurchased under the NCIB and the timing of such repurchases will be at BCE’s discretion and shall be subject to the limitations set out by the TSX. BCE is making this NCIB because it believes that, from time to time, the Preferred Shares may trade in price ranges that do not fully reflect their value. BCE believes that, in such circumstances, the repurchase of its Preferred Shares represents an appropriate use of its available funds. Since the beginning of BCE’s previous NCIB for Preferred Shares on November 9, 2022 until October 31, 2023, BCE repurchased and canceled 6,730,536 Preferred Shares with a stated capital of $169 million for a total of cost of $116 million. A copy of BCE’s Notice of Intention to Make a Normal Course Issuer Bid through the facilities of the TSX may be obtained, without charge, by contacting BCE’s Investor Relations department at investor.relations@bce.ca or by phone at 1-800-339-6353.
| 1.3 | Assumptions |
As at the date of this MD&A, our forward-looking statements set out in the BCE 2022 Annual MD&A, as updated or supplemented in the BCE 2023 First Quarter MD&A, in the BCE 2023 Second Quarter MD&A and in this MD&A, are based on certain assumptions including, without limitation, the following assumptions, the various assumptions referred to under the sub-sections entitled Assumptions set out in section 3, Business segment analysis of this MD&A, as well as the assumptions referred to in the section Caution regarding forward-looking statements at the beginning of this MD&A.
Assumptions about the Canadian economy
We have made certain assumptions concerning the Canadian economy. In particular, we have assumed:
| • | Slowing economic growth, given the Bank of Canada’s most recent estimated growth in Canadian gross domestic product of 1.2% in 2023, representing a decrease from the earlier estimate of 1.8% |
| • | Easing, but still elevated, consumer price index (CPI) inflation as the effects of past interest rate increases work through the economy |
| • | Easing labour market pressures |
| • | Muted growth in household spending due to the ongoing effects of higher interest rates and the rising cost of living |
| • | Soft business investment growth due to elevated borrowing costs, tight credit conditions and the prospect of slowing economic activity |
| • | Prevailing high interest rates expected to remain at or near current levels |
| • | Population growth resulting from strong immigration |
| • | Canadian dollar expected to remain near current levels. Further movements may be impacted by the degree of strength of the U.S. dollar, interest rates and changes in commodity prices |
Market assumptions
| • | A higher level of wireline and wireless competition in consumer, business and wholesale markets |
| • | Higher, but slowing, wireless industry penetration |
| • | A shrinking data and voice connectivity market as business customers migrate to lower-priced telecommunications solutions or alternative OTT competitors |
| • | The Canadian advertising market is experiencing a slowdown consistent with trends in the global advertising market, with improvement expected in the medium term, although visibility to the specific timing and pace of recovery remains limited |
| • | Declines in broadcasting distribution undertaking (BDU) subscribers driven by increasing competition from the continued rollout of subscription video-on-demand (SVOD) streaming services together with further scaling of OTT aggregators |
Assumptions underlying expected reductions in 2023 annual contributions
to our pension plans
| • | At the relevant time, our defined benefit (DB) pension plans will remain in funded positions with going concern surpluses and maintain solvency ratios that exceed the minimum legal requirements for a contribution holiday to be taken for applicable DB and defined contribution (DC) components |
| • | No significant declines in our DB pension plans’ financial position due to declines in investment returns or interest rates |
| • | No material experience losses from other events such as through litigation or changes in laws, regulations or actuarial standards |
9
2 MD&A Consolidated financial analysis
| 2 | Consolidated financial analysis |
This section provides detailed information and analysis about BCE’s performance in Q3 and YTD 2023 compared with Q3 and YTD 2022. It focuses on BCE’s consolidated operating results and provides financial information for our Bell CTS and Bell Media business segments. For further discussion and analysis of our business segments, refer to section 3, Business segment analysis.
| 2.1 | BCE consolidated income statements |
| Q3 2023 | Q3 2022 | $ change | % change | YTD 2023 | YTD 2022 | $ change | % change | |||||||||||||||||||||||||
| Operating revenues |
||||||||||||||||||||||||||||||||
| Service |
5,281 | 5,193 | 88 | 1.7% | 15,806 | 15,603 | 203 | 1.3% | ||||||||||||||||||||||||
| Product |
799 | 831 | (32 | ) | (3.9%) | 2,394 | 2,132 | 262 | 12.3% | |||||||||||||||||||||||
| Total operating revenues |
6,080 | 6,024 | 56 | 0.9% | 18,200 | 17,735 | 465 | 2.6% | ||||||||||||||||||||||||
| Operating costs |
(3,413 | ) | (3,436 | ) | 23 | 0.7% | (10,350 | ) | (9,973 | ) | (377 | ) | (3.8%) | |||||||||||||||||||
| Adjusted EBITDA |
2,667 | 2,588 | 79 | 3.1% | 7,850 | 7,762 | 88 | 1.1% | ||||||||||||||||||||||||
| Adjusted EBITDA margin |
43.9% | 43.0% | 0.9 pts | 43.1% | 43.8% | (0.7) pts | ||||||||||||||||||||||||||
| Severance, acquisition and other costs |
(10 | ) | (22 | ) | 12 | 54.5% | (159 | ) | (75 | ) | (84 | ) | n.m. | |||||||||||||||||||
| Depreciation |
(937 | ) | (914 | ) | (23 | ) | (2.5%) | (2,791 | ) | (2,738 | ) | (53 | ) | (1.9%) | ||||||||||||||||||
| Amortization |
(295 | ) | (267 | ) | (28 | ) | (10.5%) | (874 | ) | (793 | ) | (81 | ) | (10.2%) | ||||||||||||||||||
| Finance costs |
||||||||||||||||||||||||||||||||
| Interest expense |
(373 | ) | (298 | ) | (75 | ) | (25.2%) | (1,076 | ) | (827 | ) | (249 | ) | (30.1%) | ||||||||||||||||||
| Net return on post-employment benefit plans |
27 | 13 | 14 | n.m. | 81 | 38 | 43 | n.m. | ||||||||||||||||||||||||
| Impairment of assets |
– | (21 | ) | 21 | 100.0% | (34 | ) | (129 | ) | 95 | 73.6% | |||||||||||||||||||||
| Other expense |
(129 | ) | (130 | ) | 1 | 0.8% | (319 | ) | (134 | ) | (185 | ) | n.m. | |||||||||||||||||||
| Income taxes |
(243 | ) | (178 | ) | (65 | ) | (36.5%) | (786 | ) | (745 | ) | (41 | ) | (5.5%) | ||||||||||||||||||
| Net earnings |
707 | 771 | (64 | ) | (8.3%) | 1,892 | 2,359 | (467 | ) | (19.8%) | ||||||||||||||||||||||
| Net earnings attributable to: |
||||||||||||||||||||||||||||||||
| Common shareholders |
640 | 715 | (75 | ) | (10.5%) | 1,694 | 2,188 | (494 | ) | (22.6%) | ||||||||||||||||||||||
| Preferred shareholders |
47 | 39 | 8 | 20.5% | 139 | 108 | 31 | 28.7% | ||||||||||||||||||||||||
|
Non-controlling interest |
20 | 17 | 3 | 17.6% | 59 | 63 | (4 | ) | (6.3%) | |||||||||||||||||||||||
| Net earnings |
707 | 771 | (64 | ) | (8.3%) | 1,892 | 2,359 | (467 | ) | (19.8%) | ||||||||||||||||||||||
| Adjusted net earnings |
741 | 801 | (60 | ) | (7.5%) | 2,235 | 2,403 | (168 | ) | (7.0%) | ||||||||||||||||||||||
| EPS |
0.70 | 0.78 | (0.08 | ) | (10.3%) | 1.86 | 2.40 | (0.54 | ) | (22.5%) | ||||||||||||||||||||||
| Adjusted EPS |
0.81 | 0.88 | (0.07 | ) | (8.0%) | 2.45 | 2.64 | (0.19 | ) | (7.2%) | ||||||||||||||||||||||
n.m.: not meaningful
| 10 | BCE INC. 2023 THIRD QUARTER SHAREHOLDER REPORT |
2 MD&A Consolidated financial analysis
| 2.2 | Customer connections |
BCE net activations (losses)
| Q3 2023 | Q3 2022 | % change | YTD 2023 | YTD 2022 | % change | |||||||||||||||||||
| Mobile phone net subscriber activations |
166,930 | 224,343 | (25.6% | ) | 319,104 | 367,280 | (13.1% | ) | ||||||||||||||||
| Postpaid |
142,886 | 167,798 | (14.8% | ) | 297,457 | 285,225 | 4.3% | |||||||||||||||||
| Prepaid |
24,044 | 56,545 | (57.5% | ) | 21,647 | 82,055 | (73.6% | ) | ||||||||||||||||
| Mobile connected devices net subscriber activations | 64,282 | 49,044 | 31.1% | 214,561 | 97,577 | n.m. | ||||||||||||||||||
| Retail high-speed Internet net subscriber activations | 79,327 | 89,652 | (11.5% | ) | 131,535 | 138,296 | (4.9% | ) | ||||||||||||||||
| Retail TV net subscriber activations (losses) |
4,222 | 10,853 | (61.1% | ) | (24,131 | ) | (9,035 | ) | n.m. | |||||||||||||||
| IPTV |
35,976 | 38,093 | (5.6% | ) | 58,381 | 54,191 | 7.7% | |||||||||||||||||
| Satellite |
(31,754 | ) | (27,240 | ) | (16.6% | ) | (82,512 | ) | (63,226 | ) | (30.5% | ) | ||||||||||||
| Retail residential NAS lines net losses |
(41,776 | ) | (42,853 | ) | 2.5% | (138,265 | ) | (137,910 | ) | (0.3% | ) | |||||||||||||
| Total services net activations |
272,985 | 331,039 | (17.5% | ) | 502,804 | 456,208 | 10.2% | |||||||||||||||||
n.m.: not meaningful
Total BCE customer connections
| Q3 2023 | Q3 2022 | % change | ||||||||||
| Mobile phone subscribers (2) |
10,194,961 | 9,826,465 | 3.8% | |||||||||
| Postpaid (2) |
9,294,115 | 8,915,270 | 4.2% | |||||||||
| Prepaid |
900,846 | 911,195 | (1.1% | ) | ||||||||
| Mobile connected devices subscribers (2) |
2,653,802 | 2,347,371 | 13.1% | |||||||||
| Retail high-speed Internet subscribers (1) (3) (4) |
4,417,838 | 4,067,039 | 8.6% | |||||||||
| Retail TV subscribers (1) (4) |
2,727,610 | 2,735,000 | (0.3% | ) | ||||||||
| IPTV (1) (4) |
2,046,805 | 1,945,657 | 5.2% | |||||||||
| Satellite |
680,805 | 789,343 | (13.8% | ) | ||||||||
| Retail residential NAS lines (1) (4) |
2,059,964 | 2,164,151 | (4.8% | ) | ||||||||
| Total services subscribers |
22,054,175 | 21,140,026 | 4.3% | |||||||||
| (1) | In Q2 2023, our retail high-speed Internet, retail IPTV and retail residential NAS lines subscriber bases increased by 35,080, 243 and 7,458 subscribers, respectively, as a result of small acquisitions. |
| (2) | In Q1 2023, we adjusted our mobile phone postpaid and mobile connected device subscriber bases to remove older non-revenue generating business subscribers of 73,229 and 12,577, respectively. |
| (3) | In Q1 2023, subsequent to a review of customer account records, our retail high-speed Internet subscriber base was reduced by 7,347 subscribers. |
| (4) | In Q4 2022, as a result of the acquisition of Distributel, our retail high-speed Internet, retail IPTV and retail residential NAS lines subscriber bases increased by 128,065, 2,315 and 64,498 subscribers, respectively. |
BCE added 272,985 net retail subscriber activations in Q3 2023, down 17.5% compared to the same period last year. The net retail subscriber activations in Q3 2023 consisted of:
| • | 166,930 mobile phone net subscriber activations, along with 64,282 mobile connected device net subscriber activations |
| • | 79,327 retail high-speed Internet net subscriber activations |
| • | 4,222 retail TV net subscriber activations comprised of 35,976 retail IPTV net subscriber activations, partly offset by 31,754 retail satellite TV net subscriber losses |
| • | 41,776 retail residential NAS lines net losses |
In the first nine months of the year, BCE added 502,804 net retail subscriber activations, up 10.2% compared to the same period in 2022. The net retail subscriber activations in the first nine months of 2023 consisted of:
| • | 319,104 mobile phone net subscriber activations, along with 214,561 mobile connected device net subscriber activations |
| • | 131,535 retail high-speed Internet net subscriber activations |
| • | 24,131 retail TV net subscriber losses comprised of 82,512 retail satellite TV net subscriber losses, partly offset by 58,381 retail IPTV net subscriber activations |
| • | 138,265 retail residential NAS lines net losses |
At September 30, 2023, BCE’s retail subscriber connections totaled 22,054,175, up 4.3% year over year, and consisted of:
| • | 10,194,961 mobile phone subscribers, up 3.8% year over year, and 2,653,802 mobile connected device subscribers, up 13.1% year over year |
| • | 4,417,838 retail high-speed Internet subscribers, 8.6% higher year over year |
| • | 2,727,610 total retail TV subscribers, comprised of 2,046,805 retail IPTV subscribers, up 5.2% year over year, and 680,805 retail satellite TV subscribers, down 13.8% year over year |
| • | 2,059,964 retail residential NAS lines, down 4.8% year over year |
11
2 MD&A Consolidated financial analysis
| 2.3 | Operating revenues |
| Q3 2023 | Q3 2022 | $ change | % change | YTD 2023 | YTD 2022 | $ change | % change | |||||||||||||||||||||||||
| Bell CTS |
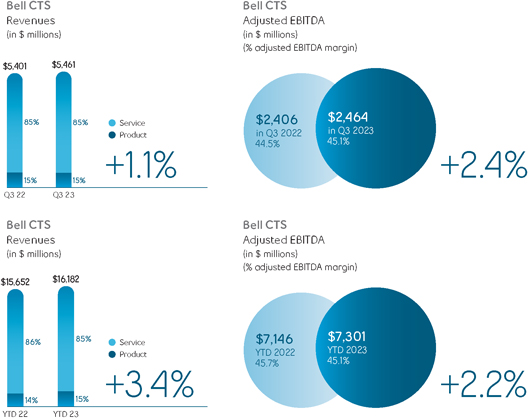
5,461 | 5,401 | 60 | 1.1% | 16,182 | 15,652 | 530 | 3.4% | ||||||||||||||||||||||||
| Bell Media |
710 | 719 | (9 | ) | (1.3% | ) | 2,295 | 2,365 | (70 | ) | (3.0% | ) | ||||||||||||||||||||
| Inter-segment eliminations |
(91 | ) | (96 | ) | 5 | 5.2% | (277 | ) | (282 | ) | 5 | 1.8% | ||||||||||||||||||||
| Total BCE operating revenues |
6,080 | 6,024 | 56 | 0.9% | 18,200 | 17,735 | 465 | 2.6% | ||||||||||||||||||||||||
BCE
BCE operating revenues increased by 0.9% in Q3 2023 compared to Q3 2022, due to higher service revenues, moderated by a decline in product revenues. During the first nine months of the year, operating revenues increased by 2.6% year over year, driven by both higher service and product revenues. Service revenues of $5,281 million in Q3 2023 and $15,806 million year to date, increased 1.7% and 1.3%, respectively. Product revenues of $799 million in Q3 2023, decreased by 3.9% year over year, while year-to-date product revenues of $2,394 million, increased by 12.3% year over year. The growth in operating revenues in Q3 2023 and in the first nine months of the year, reflected higher revenues from our Bell CTS segment, partly offset by a decline in our Bell Media segment. Bell CTS operating revenues grew by 1.1% year over year in Q3 2023, due to higher service revenues of 2.0%, partly offset by lower product revenues of 3.9%, while year-to date revenues increased by 3.4% year over year, attributable to both higher service and product revenues of 2.0% and 12.3%, respectively. The higher service revenues resulted from continued growth in wireless and wireline data revenues, moderated by ongoing erosion in wireline voice revenues. Bell Media operating revenues declined by 1.3% in Q3 2023 and by 3.0% during the first nine months of the year, compared to the same periods last year, due to lower advertising revenues, partly offset by subscriber revenue growth.
| 12 | BCE INC. 2023 THIRD QUARTER SHAREHOLDER REPORT |
2 MD&A Consolidated financial analysis
| 2.4 | Operating costs |
| Q3 2023 | Q3 2022 | $ change | % change | YTD 2023 | YTD 2022 | $ change | % change | |||||||||||||||||||||||||
| Bell CTS |
(2,997 | ) | (2,995 | ) | (2 | ) | (0.1% | ) | (8,881 | ) | (8,506 | ) | (375 | ) | (4.4% | ) | ||||||||||||||||
| Bell Media |
(507 | ) | (537 | ) | 30 | 5.6% | (1,746 | ) | (1,749 | ) | 3 | 0.2% | ||||||||||||||||||||
| Inter-segment eliminations |
91 | 96 | (5 | ) | (5.2% | ) | 277 | 282 | (5 | ) | (1.8% | ) | ||||||||||||||||||||
| Total BCE operating costs |
(3,413 | ) | (3,436 | ) | 23 | 0.7% | (10,350 | ) | (9,973 | ) | (377 | ) | (3.8% | ) | ||||||||||||||||||
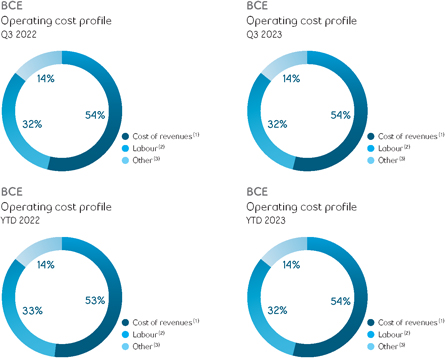
| (1) | Cost of revenues includes costs of wireless devices and other equipment sold, network and content costs, and payments to other carriers. |
| (2) | Labour costs (net of capitalized costs) include wages, salaries and related taxes and benefits, post-employment benefit plans service cost, and other labour costs, including contractor and outsourcing costs. |
| (3) | Other operating costs include marketing, advertising and sales commission costs, bad debt expense, taxes other than income taxes, IT costs, professional service fees and rent. |
BCE
BCE operating costs decreased by 0.7% in Q3 2023, compared to Q3 2022, due to lower expenses in Bell Media of 5.6%, whereas Bell CTS operating expenses remained essentially stable year over year, increasing by 0.1%. During the first nine months of the year, BCE operating costs increased by 3.8% driven by higher expenses in Bell CTS of 4.4%, while Bell Media expenses were relatively stable, decreasing by 0.2%.
13
2 MD&A Consolidated financial analysis
| 2.5 | Net earnings |
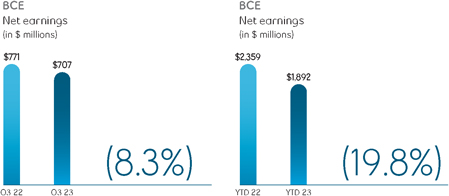
Net earnings in the third quarter of 2023 decreased by $64 million, compared to the same period last year, mainly due to higher interest expense, higher income taxes and higher depreciation and amortization, partly offset by higher adjusted EBITDA.
Net earnings on a year-to-date basis in 2023 decreased by $467 million, compared to the same period last year, mainly due to higher interest expense, higher other expense, higher depreciation and amortization and higher severance, acquisition and other costs, partly offset by higher adjusted EBITDA, lower impairment of assets and higher net return on post-employment benefit plans.
| 2.6 | Adjusted EBITDA |
| Q3 2023 | Q3 2022 | $ change | % change | YTD 2023 | YTD 2022 | $ change | % change | |||||||||||||||||||||||||
| Bell CTS |
2,464 | 2,406 | 58 | 2.4% | 7,301 | 7,146 | 155 | 2.2% | ||||||||||||||||||||||||
| Adjusted EBITDA margin |
45.1% | 44.5% | 0.6 pts | 45.1% | 45.7% | (0.6) pts | ||||||||||||||||||||||||||
| Bell Media |
203 | 182 | 21 | 11.5% | 549 | 616 | (67 | ) | (10.9% | ) | ||||||||||||||||||||||
| Adjusted EBITDA margin |
28.6% | 25.3% | 3.3 pts | 23.9% | 26.0% | (2.1) pts | ||||||||||||||||||||||||||
| Total BCE adjusted EBITDA |
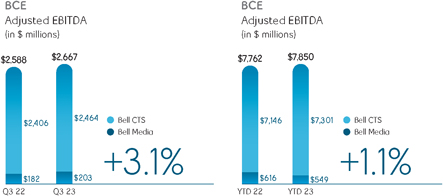
2,667 | 2,588 | 79 | 3.1% | 7,850 | 7,762 | 88 | 1.1% | ||||||||||||||||||||||||
| Adjusted EBITDA margin |
43.9% | 43.0% | 0.9 pts | 43.1% | 43.8% | (0.7) pts | ||||||||||||||||||||||||||
BCE
BCE’s adjusted EBITDA grew by 3.1% in Q3 2023, compared to Q3 2022, driven by higher year-over-year contribution from both Bell CTS of 2.4% and Bell Media of 11.5%. During the first nine months of the year, adjusted EBITDA increased by 1.1% year over year, due to growth in Bell CTS of 2.2%, moderated by a decline in Bell Media of 10.9%. The increase in BCE’s adjusted EBITDA in Q3 2023 was driven by higher operating revenues and lower operating expenses, while the year-to-date increase in adjusted EBITDA was due to greater operating revenues, partly offset by higher operating expenses. Adjusted EBITDA margin of 43.9% in Q3 2023, increased by 0.9 pts over the same period last year, mainly due to a reduced proportion of low-margin product sales in our total revenue base, lower operating costs and higher service revenue flow-through. During the first nine months of the year, adjusted EBITDA margin of 43.1% decreased by 0.7 pts compared to the same period in 2022, attributable to a greater proportion of low-margin product sales in our total revenue base, coupled with higher operating costs, partly offset by service revenue flow-through.
| 14 | BCE INC. 2023 THIRD QUARTER SHAREHOLDER REPORT |
2 MD&A Consolidated financial analysis
| 2.7 | Severance, acquisition and other costs |
2023
Severance, acquisition and other costs of $10 million in the third quarter of 2023 and $159 million on a year-to-date basis included:
| • | Severance costs of $12 million in Q3 2023 and $121 million on a year-to-date basis related to involuntary and voluntary employee terminations |
| • | Acquisition and other costs recovery of $2 million in Q3 2023 and acquisition and other costs of $38 million on a year-to-date basis |
2022
Severance, acquisition and other costs of $22 million in the third quarter of 2022 and $75 million on a year-to-date basis included:
| • | Severance costs of $9 million in Q3 2022 and $65 million on a year-to-date basis related to involuntary and voluntary employee terminations |
| • | Acquisition and other costs of $13 million in Q3 2022 and $10 million on a year-to-date basis |
| 2.8 | Depreciation and amortization |
Depreciation
Depreciation in the third quarter and on a year-to-date basis in 2023 increased by $23 million and $53 million, respectively, compared to the same periods in 2022, mainly due to a higher asset base as we continued to invest in our broadband and wireless networks.
Amortization
Amortization in the third quarter and on a year-to-date basis in 2023 increased by $28 million and $81 million, respectively, compared to the same periods in 2022, mainly due to a higher asset base.
| 2.9 | Finance costs |
Interest expense
Interest expense in the third quarter of 2023 and on a year-to-date basis in 2023 increased by $75 million and $249 million, respectively, compared to the same periods last year, mainly due to higher average debt balances and higher interest rates.
Net return on post-employment benefit plans
Net return on our post-employment benefit plans is based on market conditions that existed at the beginning of the year as well as the net post-employment benefit plan asset (liability). On January 1, 2023, the discount rate was 5.3% compared to 3.2% on January 1, 2022.
In the third quarter and on a year-to-date basis in 2023, net return on post-employment benefit increased by $14 million and $43 million, respectively, compared to the same periods last year, as a result of a higher discount rate in 2023 and a higher net asset position.
The impacts of changes in market conditions during the year are recognized in other comprehensive income (loss) (OCI).
| 2.10 | Impairment of assets |
Impairment charges for the third quarter and on a year-to-date basis in 2023 decreased by $21 million and $95 million, respectively, compared to the same periods last year, and relate mainly to lower right-of-use asset impairments for certain office spaces we ceased using as part of our real estate optimization strategy as a result of our hybrid work policy.
15
2 MD&A Consolidated financial analysis
| 2.11 | Other expense |
2023
Other expense of $129 million in the third quarter of 2023 mainly included net mark-to-market losses on derivatives used to economically hedge equity settled share-based compensation plans.
Other expense of $319 million on a year-to-date basis in 2023 related mainly to losses on our equity investments in associates and joint ventures, which included a loss on BCE’s share of an obligation to repurchase at fair value the minority interest in one of BCE’s joint ventures, and net mark-to-market losses on derivatives used to economically hedge equity settled share-based compensation plans, partly offset by gains on our investments as a result of the sale of our 63% ownership in certain production studios and higher interest income.
2022
Other expense of $130 million in the third quarter of 2022 mainly included net mark-to-market losses on derivatives used to economically hedge equity settled share-based compensation plans and losses on operations from our equity investments.
Other expense of $134 million on a year-to-date basis in 2022 mainly included net mark-to-market losses on derivatives used to economically hedge equity settled share-based compensation plans, losses on our equity investments which included a loss on BCE’s share of an obligation to repurchase at fair value the minority interest in one of BCE’s joint ventures, and early debt redemption costs, partly offset by gains on investments mainly related to the sale of our wholly-owned subsidiary, 6362222 Canada Inc. (Createch), and an obligation to repurchase at fair value the minority interest in one of our subsidiaries.
| 2.12 | Income taxes |
Income taxes in the third quarter of 2023 and on a year-to-date basis in 2023 increased by $65 million and $41 million, respectively, compared to the same periods in 2022, mainly due to a higher value of uncertain tax positions favourably resolved in 2022 compared to 2023, partly offset by lower taxable income.
| 2.13 | Net earnings attributable to common shareholders and EPS |
Net earnings attributable to common shareholders in the third quarter of 2023 of $640 million, decreased by $75 million, compared to the same period last year, mainly due to higher interest expense, higher income taxes and higher depreciation and amortization, partly offset by higher adjusted EBITDA.
Net earnings attributable to common shareholders on a year-to-date basis in 2023 of $1,694 million, decreased by $494 million, compared to the same period last year, mainly due to higher interest expense, higher other expense, higher depreciation and amortization and higher severance, acquisition and other costs, partly offset by higher adjusted EBITDA, lower impairment of assets and higher net return on post-employment benefit plans.
BCE’s EPS of $0.70 in Q3 2023 decreased by $0.08 compared to the same period last year. BCE’s EPS of $1.86 on a year-to-date basis in 2023 decreased by $0.54 compared to the same period last year.
In the third quarter of 2023, adjusted net earnings, which excludes the impact of severance, acquisition and other costs, net mark-to-market gains (losses) on derivatives used to economically hedge equity settled share-based compensation plans, net equity gains (losses) on investments in associates and joint ventures, net gains (losses) on investments, early debt redemption costs and impairment of assets, net of tax and NCI, was $741 million, or $0.81 per common share, compared to $801 million, or $0.88 per common share, for the same period last year. Adjusted net earnings in the first nine months of 2023 was $2,235 million, or $2.45 per common share, compared to $2,403 million, or $2.64 per common share, for the first nine months of 2022.
| 16 | BCE INC. 2023 THIRD QUARTER SHAREHOLDER REPORT |
3 MD&A Business segment analysis
| 3 | Business segment analysis |
| 3.1 | Bell CTS |
Key business developments
Bell named the Best Major & All Around ISP in Canada
Bell was named the Best Major & All Around ISP in PCMag’s Best ISPs 2023 Canada report (1), which includes data on speed, along with several new metrics this year, including price, coverage and customer satisfaction, providing a more comprehensive look at broadband service across the country. Bell ranked above all other major ISPs with the PCMag report stating, “Bell offers an almost perfect mix of speed, coverage, price, and user satisfaction.” Bell also ranked #1 in more provinces than any other major provider, including in Ontario, Québec, New Brunswick, Newfoundland and Labrador, Nova Scotia, and Prince Edward Island.
Introduction of 3-gigabit Internet Service in Manitoba
Bell launched 3-gigabit Internet service in Manitoba with symmetrical download and upload speeds of three gigabits per second (Gbps), the fastest Internet in the province. The service includes the Bell Giga Hub and Wi-Fi 6E pods, which work together to create a seamless, powerful Wi-Fi network with wall-to-wall coverage and gigabit speeds. Unlimited pure fibre 3 Gbps is now available in eligible areas of Manitoba.
First 5G transatlantic collaborative meeting
Bell Canada, Verizon, Vodafone and independent software vendor Matsuko successfully conducted the first live transatlantic collaborative meeting connecting multiple holographic people in Canada, the US and the UK using 5G and multi-access edge computing (MEC) technology and Matsuko’s real-time software. Interacting with holograms of humans rather than avatars can provide a more personal experience for many applications such as remote healthcare, collaborative working, and education. The call was enabled by the speed of 5G combined with the quick response times of MEC, which moves the necessary computing closer to the edge of the network. This ensures a more reliable and consistent hologram by removing delays resulting from multiple hops between different locations and across the internet.
Through its active participation in the 5G Future Forum industry body, Bell continues to support the developer community to access 5G MEC technologies and for their solutions to take full advantage of Bell’s 5G network in Canada, and to interoperate globally. This holographic video meeting demo illustrates how Bell – with partners Verizon and Vodafone – is making it easier for developers to leverage 5G capabilities to innovate and achieve their application goals.
| (1) | PCMag delivers labs-based, independent reviews of the latest technology products and services. Bell was named the Best Major & All Around ISP in PCMag’s Best ISPs 2023 Canada report based on ratings for speed, coverage, price and overall satisfaction. The results are based on 331,078 PCMag Speed test results from Canadian ISP users received between June 1, 2022 and June 27, 2023. |
17
3 MD&A Business segment analysis
Financial performance analysis
Q3 2023 performance highlights
| Total mobile phone | Mobile phone | Mobile phone prepaid | Mobile phone | Mobile phone blended | ||||
| subscriber growth (2) | postpaid net | net subscriber | postpaid churn | average revenue per | ||||
| subscriber | activations |
in Q3 2023 |
user (ARPU) (3) | |||||
| activations |
per month | |||||||
| +3.8% | 142,886 | 24,044 | 1.10% | (0.2%) | ||||
| Q3 2023 vs. Q3 2022 | Decreased 14.8% | Decreased 57.5% | Increased 0.20 pts | Q3 2023: $60.28 | ||||
| vs. Q3 2022 | vs. Q3 2022 | vs. Q3 2022 | Q3 2022: $60.39 | |||||
| Retail high-speed Internet subscriber | Retail high-speed Internet net | Retail TV subscriber growth (1) (5) | ||
| growth (1) (4) (5) | subscriber activations in Q3 2023 | |||
| +8.6% | 79,327 | (0.3%) | ||
| Q3 2023 vs. Q3 2022 | Decreased 11.5% vs. Q3 2022 | Q3 2023 vs. Q3 2022 | ||
| Retail IPTV net subscriber activations in Q3 2023 | Retail residential NAS lines subscriber decline (1) (5) | |
| 35,976 | (4.8%) | |
| Decreased 5.6% vs. Q3 2022 | Q3 2023 vs. Q3 2022 | |
| (1) | In Q2 2023, our retail high-speed Internet, retail IPTV and retail residential NAS lines subscriber bases increased by 35,080, 243 and 7,458 subscribers, respectively, as a result of small acquisitions. |
| (2) | In Q1 2023, we adjusted our mobile phone postpaid subscriber base to remove older non-revenue generating business subscribers of 73,229. |
| (3) | Effective Q1 2023, as a result of the segment reporting changes impacting intersegment eliminations, ARPU has been updated and is defined as Bell CTS wireless external services revenues (previously wireless operating service revenues) divided by the average mobile phone subscriber base for the specified period, expressed as a dollar unit per month. |
| (4) | In Q1 2023, subsequent to a review of customer account records, our retail high-speed Internet subscriber base was reduced by 7,347 subscribers. |
| (5) | In Q4 2022, as a result of the acquisition of Distributel, our retail high-speed Internet, retail IPTV and retail residential NAS lines subscriber bases increased by 128,065, 2,315 and 64,498 subscribers, respectively. |
| 18 | BCE INC. 2023 THIRD QUARTER SHAREHOLDER REPORT |
3 MD&A Business segment analysis
Bell CTS results
Revenues
| Q3 2023 | Q3 2022 | $ change | % change | YTD 2023 | YTD 2022 | $ change | % change | |||||||||||||||||||||||||
| Wireless |
1,828 | 1,759 | 69 | 3.9% | 5,317 | 5,086 | 231 | 4.5% | ||||||||||||||||||||||||
| Wireline data |
2,032 | 1,987 | 45 | 2.3% | 6,054 | 5,914 | 140 | 2.4% | ||||||||||||||||||||||||
| Wireline voice |
717 | 739 | (22 | ) | (3.0% | ) | 2,165 | 2,266 | (101 | ) | (4.5% | ) | ||||||||||||||||||||
| Other wireline services |
78 | 77 | 1 | 1.3% | 231 | 232 | (1 | ) | (0.4% | ) | ||||||||||||||||||||||
| External service revenues |
4,655 | 4,562 | 93 | 2.0% | 13,767 | 13,498 | 269 | 2.0% | ||||||||||||||||||||||||
| Inter-segment service revenues |
7 | 8 | (1 | ) | (12.5% | ) | 21 | 22 | (1 | ) | (4.5% | ) | ||||||||||||||||||||
| Operating service revenues |
4,662 | 4,570 | 92 | 2.0% | 13,788 | 13,520 | 268 | 2.0% | ||||||||||||||||||||||||
| Wireless |
672 | 692 | (20 | ) | (2.9% | ) | 1,924 | 1,797 | 127 | 7.1% | ||||||||||||||||||||||
| Wireline |
127 | 139 | (12 | ) | (8.6% | ) | 470 | 335 | 135 | 40.3% | ||||||||||||||||||||||
| External/Operating product revenues |
799 | 831 | (32 | ) | (3.9% | ) | 2,394 | 2,132 | 262 | 12.3% | ||||||||||||||||||||||
| Total external revenues |
5,454 | 5,393 | 61 | 1.1% | 16,161 | 15,630 | 531 | 3.4% | ||||||||||||||||||||||||
| Total operating revenues |
5,461 | 5,401 | 60 | 1.1% | 16,182 | 15,652 | 530 | 3.4% | ||||||||||||||||||||||||
Bell CTS operating revenues grew by 1.1% in Q3 2023 and by 3.4% year to date, compared to the same periods last year. The year-over-year growth in Q3 was driven by higher service revenues, moderated by lower product revenues, whereas year-to-date growth reflected both higher service and product revenues. The increase in service revenues was primarily due to higher wireless and wireline data revenues, partly offset by ongoing erosion in wireline voice revenues.
Bell CTS operating service revenues increased by 2.0% in both the quarter and in the first nine months of the year, compared to the same periods in 2022.
| • | Wireless revenues increased by 3.9% in Q3 2023 and by 4.5% in the first nine months of the year, compared to the same periods last year, driven by: |
| • | Continued growth in our mobile phone and connected device subscriber bases |
| • | Flow-through of rate increases |
| • | Higher roaming revenues due to increased international travel |
| These factors were partly offset by: |
| • | Unfavourable impact of competitive pricing pressures |
| • | Lower data overages driven by greater customer adoption of monthly plans with higher data thresholds, including unlimited plans |
| • | Wireline data revenues grew by 2.3% and by 2.4%, respectively, in Q3 2023 and the first nine months of the year, compared to the same periods last year, driven by: |
| • | The acquisitions of Distributel in December 2022, FX Innovation in June 2023, and other small acquisitions made during the year |
| • | Higher retail Internet and IPTV subscriber bases, coupled with the flow-through of residential rate increases |
| • | Greater sales of maintenance contracts and software subscriptions to business customers |
| These factors were partly offset by: |
| • | Greater acquisition, retention and bundle discounts on residential services |
| • | Ongoing decline in our satellite TV subscriber base |
| • | Wireline voice revenues declined by 3.0% in Q3 2023 and by 4.5% in the first nine months of the year, compared to the same periods last year, driven by: |
| • | Ongoing retail residential NAS line erosion, combined with business voice declines, driven by technological substitution to wireless and Internet-based services |
| These factors were partly offset by: |
| • | Flow-through of residential rate increases |
| • | The acquisition of Distributel in December 2022 and other small acquisitions made during the year |
The year-to-date decline in voice revenues was also unfavourably impacted by reduced sales of international wholesale long distance minutes.
Bell CTS operating product revenues declined by 3.9% in Q3 2023 compared to Q3 2022. Conversely, during the first nine months of the year, product revenues grew by 12.3% over the same period last year.
| • | Wireless operating product revenues decreased by 2.9% in Q3 2023, compared to the same period last year, due to lower contracted sales volumes, timing of sales to large business customers and lower consumer electronic sales at The Source (Bell) Electronics Inc. (The Source), partly offset by a greater sales mix of premium mobile phones and more disciplined handset pricing. In the first nine months of the year, wireless operating product revenues increased by 7.1%, compared to the same period last year, as the greater sales mix of premium mobile phones and disciplined handset pricing more than offset the lower contracted sales volumes and reduced consumer electronic sales at The Source. |
| • | Wireline operating product revenues declined by 8.6% in Q3 2023, compared to the same period last year, mainly due to timing of mobile device and land mobile radio systems sales to large business customers in the government sector. Conversely, during the first nine months of the year, product revenue increased by 40.3% year over year, from strong sales to large business customers in the first half of the year mainly due to alleviating year-over-year impact from global supply chain challenges. |
19
3 MD&A Business segment analysis
Operating costs and adjusted EBITDA
| Q3 2023 | Q3 2022 | $ change | % change | YTD 2023 | YTD 2022 | $ change | % change | |||||||||||||||||||||||||
| Operating costs |
(2,997 | ) | (2,995 | ) | (2 | ) | (0.1% | ) | (8,881 | ) | (8,506 | ) | (375 | ) | (4.4% | ) | ||||||||||||||||
| Adjusted EBITDA |
2,464 | 2,406 | 58 | 2.4% | 7,301 | 7,146 | 155 | 2.2% | ||||||||||||||||||||||||
| Adjusted EBITDA margin |
45.1% | 44.5% | 0.6 pts | 45.1% | 45.7% | (0.6) pts | ||||||||||||||||||||||||||
Bell CTS operating costs were essentially stable in Q3 2023, increasing by 0.1% compared to the same period in 2022, due to:
| • | Higher costs from the acquisitions of Distributel in December 2022, FX Innovation in June 2023 and other small acquisitions made during the year |
| • | Increased costs associated with the revenue growth in maintenance and software subscriptions |
These factors were partly offset by:
| • | Lower year-over-year cost of goods sold attributable to lower product revenues |
| • | The favourable impact of various cost reduction initiatives and other operating efficiencies |
| • | Higher repairs expense incurred in Q3 2022 related to storm damages, primarily Hurricane Fiona |
| • | Pension savings, driven by a lower DB expense due to a higher year-over-year discount rate |
Operating costs increased by 4.4% in the first nine months of the year, compared to the same period last year, as higher year-over-year cost of goods sold associated with greater product revenues in the first half of the year and higher TV programming and content costs, more than offset the other factors listed above.
Bell CTS adjusted EBITDA increased by 2.4% in Q3 2023, compared to Q3 2022, due to higher operating revenues. In the first nine months of the year, adjusted EBITDA increased by 2.2% year over year, driven by higher operating revenues, partly offset by greater operating costs. Adjusted EBITDA margin of 45.1% in Q3 2023, increased by 0.6 pts over Q3 2022, due to a lower proportion of low-margin product sales in our total revenue base, coupled with service revenue flow-through. Conversely, during the first nine months of the year, adjusted EBITDA margin of 45.1%, decreased by 0.6 pts over the same period in 2022, resulting from an increased proportion of low-margin product sales in our total revenue base, along with higher operating costs, partly offset by service revenue flow-through.
Bell CTS operating metrics
Wireless
| Q3 2023 | Q3 2022 | Change | % change | YTD 2023 | YTD 2022 | Change | % change | |||||||||||||||||||||||||
| Mobile phones |
||||||||||||||||||||||||||||||||
| Blended ARPU ($/month) |
60.28 | 60.39 | (0.11 | ) | (0.2% | ) | 59.21 | 59.07 | 0.14 | 0.2% | ||||||||||||||||||||||
| Gross subscriber activations |
603,770 | 583,700 | 20,070 | 3.4% | 1,512,245 | 1,348,878 | 163,367 | 12.1% | ||||||||||||||||||||||||
| Postpaid |
423,364 | 391,165 | 32,199 | 8.2% | 1,043,719 | 888,478 | 155,241 | 17.5% | ||||||||||||||||||||||||
| Prepaid |
180,406 | 192,535 | (12,129 | ) | (6.3% | ) | 468,526 | 460,400 | 8,126 | 1.8% | ||||||||||||||||||||||
| Net subscriber activations |
166,930 | 224,343 | (57,413 | ) | (25.6% | ) | 319,104 | 367,280 | (48,176 | ) | (13.1% | ) | ||||||||||||||||||||
| Postpaid |
142,886 | 167,798 | (24,912 | ) | (14.8% | ) | 297,457 | 285,225 | 12,232 | 4.3% | ||||||||||||||||||||||
| Prepaid |
24,044 | 56,545 | (32,501 | ) | (57.5% | ) | 21,647 | 82,055 | (60,408 | ) | (73.6% | ) | ||||||||||||||||||||
| Blended churn % (average per month) |
1.45% | 1.24% | (0.21) pts | 1.34% | 1.15% | (0.19) pts | ||||||||||||||||||||||||||
| Postpaid |
1.10% | 0.90% | (0.20) pts | 0.98% | 0.82% | (0.16) pts | ||||||||||||||||||||||||||
| Prepaid |
5.10% | 4.58% | (0.52) pts | 5.02% | 4.53% | (0.49) pts | ||||||||||||||||||||||||||
| Subscribers (1) |
10,194,961 | 9,826,465 | 368,496 | 3.8% | 10,194,961 | 9,826,465 | 368,496 | 3.8% | ||||||||||||||||||||||||
| Postpaid (1) |
9,294,115 | 8,915,270 | 378,845 | 4.2% | 9,294,115 | 8,915,270 | 378,845 | 4.2% | ||||||||||||||||||||||||
| Prepaid |
900,846 | 911,195 | (10,349 | ) | (1.1% | ) | 900,846 | 911,195 | (10,349 | ) | (1.1% | ) | ||||||||||||||||||||
| Mobile connected devices |
||||||||||||||||||||||||||||||||
| Net subscriber activations |
64,282 | 49,044 | 15,238 | 31.1% | 214,561 | 97,577 | 116,984 | n.m. | ||||||||||||||||||||||||
| Subscribers (1) |
2,653,802 | 2,347,371 | 306,431 | 13.1% | 2,653,802 | 2,347,371 | 306,431 | 13.1% | ||||||||||||||||||||||||
n.m.: not meaningful
| (1) | In Q1 2023, we adjusted our mobile phone postpaid and mobile connected device subscriber bases to remove older non-revenue generating business subscribers of 73,229 and 12,577, respectively. |
Mobile phone blended ARPU of $60.28 decreased by 0.2% in Q3 2023, compared to the same period last year, driven by:
| • | Unfavourable impact of competitive pricing pressures |
| • | Lower data overages due to greater customer adoption of monthly plans with higher data thresholds, including unlimited plans |
These factors were partly offset by:
| • | Flow-through of rate increases |
| • | Higher roaming revenues due to increased international travel |
In the first nine months of the year, mobile phone blended ARPU of $59.21 increased by 0.2%, compared to the same period last year, as the rate increases and higher roaming revenues more than offset the competitive pricing pressures and lower data overages.
Mobile phone gross subscriber activations grew by 3.4% in Q3 2023, compared to the same period last year, due to higher postpaid gross subscriber activations, partly offset by lower prepaid gross subscriber activations. In the first nine months of the year, mobile phone gross subscriber activations grew by 12.1% year over year, due to both higher postpaid and prepaid gross subscriber activations.
| • | Mobile phone postpaid gross subscriber activations increased by 8.2% in Q3 2023 and by 17.5% year to date, compared to the same periods last year, driven by market growth primarily due to increased immigration, as well as reflecting continued 5G momentum and successful bundled service offerings. |
| 20 | BCE INC. 2023 THIRD QUARTER SHAREHOLDER REPORT |
3 MD&A Business segment analysis
| • | Mobile phone prepaid gross subscriber activations decreased by 6.3% in Q3 2023, compared to Q3 2022, due to strong performance in Q3 2022 and more attractive promotional offers in the market on postpaid discount brands in this quarter. In the first nine months of the year, mobile phone prepaid gross subscriber activations increased by 1.8%, compared to the same period last year, driven by higher immigration and travel to Canada, partly offset by more attractive promotional offers in the market on postpaid discount brands. |
Mobile phone net subscriber activations decreased by 25.6% in Q3 2023, compared to the same period last year, due to lower postpaid and prepaid net subscriber activations. Mobile phone net subscriber activations decreased by 13.1% year to date, compared to the same period last year, due to lower prepaid net subscriber activations, partly offset by higher postpaid net subscriber activations.
| • | Mobile phone postpaid net subscriber activations decreased by 14.8% in Q3 2023, compared to the same period last year, due to higher subscriber deactivations, partly offset by higher gross activations and greater migrations from prepaid. In the first nine months of the year, mobile phone postpaid net subscriber activations increased by 4.3% year over year, driven by higher gross activations and greater migrations from prepaid, partly offset by higher subscriber deactivations. |
| • | Mobile phone prepaid net subscriber activations decreased by 57.5% in Q3 2023, compared to the same period last year, due to higher subscriber deactivations, lower gross activations and greater migrations to postpaid. In the first nine months of the year, mobile phone prepaid net subscriber activations decreased by 73.6% year over year, due to higher subscriber deactivations and greater migrations to postpaid, partly offset by higher gross activations. |
Mobile phone blended churn of 1.45% in Q3 2023 and 1.34% year to date, increased by 0.21 pts and 0.19 pts, respectively, compared to the same periods last year.
| • | Mobile phone postpaid churn of 1.10% in the quarter and 0.98% in the first nine months of the year, increased by 0.20 pts and 0.16 pts, respectively, compared to the same periods last year, due to higher subscriber deactivations driven by greater overall market activity and more promotional pricing offers in the market |
| • | Mobile phone prepaid churn of 5.10% in the quarter and 5.02% year to date, increased by 0.52 pts and 0.49 pts, respectively, compared to the same periods in 2022, due to higher subscriber deactivations driven by greater overall market activity and more attractive promotional offers in the market on postpaid discount brands |
Mobile phone subscribers at September 30, 2023 totaled 10,194,961, an increase of 3.8%, from 9,826,465 subscribers reported at the end of Q3 2022. This consisted of 9,294,115 postpaid subscribers, an increase of 4.2% from 8,915,270 subscribers at the end of Q3 2022, and 900,846 prepaid subscribers, a decrease of 1.1% from 911,195 subscribers at the end of Q3 2022.
Mobile connected device net subscriber activations increased by 15,238 in Q3 2023 and by 116,984 year to date, compared to the same periods last year, due to higher business Internet of Things (IoT) net activations, higher connected car subscriptions and lower net losses from data devices, primarily fewer tablet deactivations.
Mobile connected device subscribers at September 30, 2023 totaled 2,653,802, an increase of 13.1% from 2,347,371 subscribers reported at the end of Q3 2022.
Wireline data
Retail high-speed Internet
| Q3 2023 | Q3 2022 | Change | % change | YTD 2023 | YTD 2022 | Change | % change | |||||||||||||||||||||||||
| Retail net subscriber activations |
79,327 | 89,652 | (10,325 | ) | (11.5% | ) | 131,535 | 138,296 | (6,761 | ) | (4.9% | ) | ||||||||||||||||||||
| Retail subscribers (1) (2) (3) |
4,417,838 | 4,067,039 | 350,799 | 8.6% | 4,417,838 | 4,067,039 | 350,799 | 8.6% | ||||||||||||||||||||||||
| (1) | In Q2 2023, our retail high-speed Internet subscriber base increased by 35,080 as a result of small acquisitions. |
| (2) | In Q1 2023, subsequent to a review of customer account records, our retail high-speed Internet subscriber base was reduced by 7,347 subscribers. |
| (3) | In Q4 2022, as a result of the acquisition of Distributel, our retail high-speed Internet subscriber base increased by 128,065. |
Retail high-speed Internet net subscriber activations decreased by 11.5% in Q3 2023 and by 4.9% in the first nine months of the year, compared to the same periods in 2022, due to a particularly strong Q3 2022, as well as higher deactivations in our non-fibre-to-the-premise (FTTP) service footprint due to aggressive promotional offers by competitors. This was partly offset by continued growth in gross activations in our FTTP footprint, increased promotional offers including bundled service offerings, the success of our multi-brand strategy and the contribution from Distributel and other small acquisitions made during the year.
Retail high-speed Internet subscribers totaled 4,417,838 at September 30, 2023, up 8.6% from 4,067,039 subscribers reported at the end of Q3 2022.
Retail TV
| Q3 2023 | Q3 2022 | Change | % change | YTD 2023 | YTD 2022 | Change | % change | |||||||||||||||||||||||||
| Retail net subscriber activations (losses) |
4,222 | 10,853 | (6,631 | ) | (61.1% | ) | (24,131 | ) | (9,035 | ) | (15,096 | ) | n.m. | |||||||||||||||||||
| IPTV |
35,976 | 38,093 | (2,117 | ) | (5.6% | ) | 58,381 | 54,191 | 4,190 | 7.7% | ||||||||||||||||||||||
| Satellite |
(31,754 | ) | (27,240 | ) | (4,514 | ) | (16.6% | ) | (82,512 | ) | (63,226 | ) | (19,286 | ) | (30.5% | ) | ||||||||||||||||
| Total retail subscribers (1) (2) |
2,727,610 | 2,735,000 | (7,390 | ) | (0.3% | ) | 2,727,610 | 2,735,000 | (7,390 | ) | (0.3% | ) | ||||||||||||||||||||
| IPTV (1) (2) |
2,046,805 | 1,945,657 | 101,148 | 5.2% | 2,046,805 | 1,945,657 | 101,148 | 5.2% | ||||||||||||||||||||||||
| Satellite |
680,805 | 789,343 | (108,538 | ) | (13.8% | ) | 680,805 | 789,343 | (108,538 | ) | (13.8% | ) | ||||||||||||||||||||
n.m.: not meaningful
| (1) | In Q2 2023, our retail IPTV subscriber base increased by 243 as a result of small acquisitions. |
| (2) | In Q4 2022, as a result of the acquisition of Distributel, our retail IPTV base increased by 2,315 subscribers. |
21
3 MD&A Business segment analysis
Retail IPTV net subscriber activations decreased by 5.6% in Q3 2023, compared to Q3 2022, from greater deactivations, primarily on our app streaming service, attributable to a higher number of customers coming off of promotional offers, increased competitive intensity and greater substitution with OTT services. This was partly offset by increased activations from greater Internet pull-through, coupled with the success of our multi-brand strategy. Conversely, during the first nine months of the year, retail IPTV net subscriber activations increased by 7.7%, compared to the same period last year, as the higher activations more than offset the increased deactivations.
Retail satellite TV net subscriber losses increased by 16.6% in Q3 2023 and by 30.5% in the first nine months of the year, compared to the same periods in 2022, resulting from aggressive offers from cable competitors, particularly in rural areas, along with greater substitution with OTT services.
Total retail TV net subscriber activations (IPTV and satellite TV combined) decreased by 61.1% in Q3 2023 compared to Q3 2022, from higher satellite TV net losses and lower IPTV net activations. During the first nine months of the year, retail TV net subscriber losses increased by 15,096 year over year, due to higher satellite TV net losses, partly offset by greater IPTV net activations.
Retail IPTV subscribers at September 30, 2023 totaled 2,046,805, up 5.2% from 1,945,657 subscribers reported at the end of Q3 2022.
Retail satellite TV subscribers at September 30, 2023 totaled 680,805, down 13.8% from 789,343 subscribers at the end of Q3 2022.
Total retail TV subscribers (IPTV and satellite TV combined) at September 30, 2023 were 2,727,610 decreasing by 7,390 over the 2,735,000 subscribers at the end of Q3 2022.
Wireline voice
| Q3 2023 | Q3 2022 | Change | % change | YTD 2023 | YTD 2022 | Change | % change | |||||||||||||||||||||||||
| Retail residential NAS lines net losses |
(41,776) | (42,853) | 1,077 | 2.5% | (138,265) | (137,910) | (355) | (0.3%) | ||||||||||||||||||||||||
| Retail residential NAS lines (1) (2) |
2,059,964 | 2,164,151 | (104,187) | (4.8%) | 2,059,964 | 2,164,151 | (104,187) | (4.8%) | ||||||||||||||||||||||||
| (1) | In Q2 2023, our retail residential NAS lines subscriber base increased by 7,458 subscribers as a result of small acquisitions. |
| (2) | In Q4 2022, as a result of the acquisition of Distributel, our retail residential NAS lines subscriber base increased by 64,498 subscribers. |
Retail residential NAS lines net losses improved by 2.5% in Q3 2023, compared to Q3 2022, from greater activations, due to the success of our bundled services offerings, partly offset by the unfavourable impact of continued substitution to wireless and Internet-based technologies. Conversely, during the first nine months of the year, retail residential NAS lines net losses increased by 0.3%, compared to the same period in 2022, driven by greater year-over-year deactivations, mainly due to lower deactivations in Q1 2022 as a result of the COVID-19 pandemic, which more than offset the higher year-over-year gross activations.
Retail residential NAS lines at September 30, 2023 of 2,059,964 declined by 4.8% from 2,164,151 lines reported at the end of Q3 2022. This represented an improvement over the 7.5% rate of erosion experienced in Q3 2022, mainly from the impact of the acquisition of Distributel in Q4 2022, and other small acquisitions made during the year.
| 22 | BCE INC. 2023 THIRD QUARTER SHAREHOLDER REPORT |
3 MD&A Business segment analysis
Assumptions
As at the date of this MD&A, our forward-looking statements set out in the BCE 2022 Annual MD&A, as updated or supplemented in the BCE 2023 First Quarter MD&A, in the BCE 2023 Second Quarter MD&A and in this MD&A, are based on certain assumptions including, without limitation, the following assumptions, the assumptions referred to in the Bell Media business segment discussion set out in section 3.2, Bell Media, of this MD&A, the economic, market and other assumptions referred to in section 1.3, Assumptions of this MD&A, as well as the assumptions referred to in the section Caution regarding forward-looking statements at the beginning of this MD&A.
| • | Maintain our market share of national operators’ wireless postpaid mobile phone net additions and growth of our prepaid subscriber base |
| • | Increased competitive intensity and promotional activity across all regions and market segments |
| • | Ongoing expansion and deployment of 5G and 5G+ wireless networks, offering competitive coverage and quality |
| • | Continued diversification of our distribution strategy with a focus on expanding direct-to-consumer (DTC) and online transactions |
| • | Moderating growth in mobile phone blended ARPU, driven by growth in 5G subscriptions, and increased roaming revenue from the easing of travel restrictions implemented as a result of the COVID-19 pandemic, partly offset by reduced data overage revenue due, among others, to the continued adoption of unlimited plans |
| • | Accelerating business customer adoption of advanced 5G, 5G+ and IoT solutions |
| • | Improving wireless handset device availability in addition to stable device pricing and margins |
| • | Further deployment of direct fibre to more homes and businesses within our wireline footprint |
| • | Continued growth in retail Internet and IPTV subscribers |
| • | Increasing wireless and Internet-based technological substitution |
| • | Continued aggressive residential service bundle offers from cable TV competitors in our local wireline areas, moderated by growing our share of competitive residential service bundles |
| • | Continued large business customer migration to IP-based systems |
| • | Ongoing competitive repricing pressures in our business and wholesale markets |
| • | Continued competitive intensity in our small and medium-sized business markets as cable operators and other telecommunications competitors continue to intensify their focus on business customers |
| • | Traditional high-margin product categories challenged by large global cloud and OTT providers of business voice and data solutions expanding into Canada with on-demand services |
| • | Increasing customer adoption of OTT services resulting in downsizing of TV packages |
| • | Growing consumption of OTT TV services and on-demand video streaming, as well as the proliferation of devices, such as tablets, that consume large quantities of bandwidth, will require ongoing capital investment |
| • | Realization of cost savings related to operating efficiencies enabled by a growing direct fibre footprint, changes in consumer behaviour and product innovation, digital adoption, product and service enhancements, expanding self-serve capabilities, new call centre and digital investments, other improvements to the customer service experience, management workforce reductions including attrition and retirements, and lower contracted rates from our suppliers |
| • | No adverse material financial, operational or competitive consequences of changes in or implementation of regulations affecting our communication and technology services business |
23
3 MD&A Business segment analysis
| 3.2 | Bell Media |
Key business developments
Launch of Addressable TV Solution
On September 12, 2023, Bell Media launched Addressable TV (ATV), an innovation that delivers tailored ads to TV audiences, across its premium linear and Video on Demand (VOD) content on CTV, CTV2, and Noovo, as well as a selection of English and French specialty channels. ATV reaches viewers through the Bell Fibe TV app across Connected TV, mobile, and web platforms, and is set to launch on next generation set top boxes later this year. Addressable TV provides a personalized ad experience to specific households or devices, based on demographic and behavioural data across VOD, livestreams, and linear content and makes Bell Media the first Canadian broadcaster to offer the technology on linear channels through a Canadian broadcast distributor. Bell Media’s ATV solution leverages Bell’s premium first party data, for precise targeting to an advertiser’s core audience.
Launch of Addressable Audio
On October 12, 2023, Bell Media launched Addressable Audio, an innovative new format that dynamically inserts digital audio ads into live linear programming, and on-demand content on iHeartRadio.ca and the iHeartRadio Canada app. Addressable Audio, available through Bell DSP and directly through a Bell Media sales representative, allows brands to target listeners through AM/FM streaming, on-demand tracks, and podcasts. Advanced by Bell’s premium first party data, Addressable Audio gives brands the opportunity to customize the listener experience and yield higher conversion rates.
Licensing and Distribution Pact with FOX Entertainment Global and Neshama Entertainment
On October 27, 2023, Bell Media and FOX Entertainment Global forged a new licensing and distribution pact to support Canadian original productions for all Bell Media platforms, including CTV and Crave, and in the U.S. for FOX. Global distribution will be handled by FOX Entertainment Global. The pact further demonstrates the strength and success of Canadian original series at home and globally, and reinforces Bell Media’s ongoing focus on the creation of original Canadian content. The deal encompasses English-language scripted drama and comedies, unscripted competition, and docuseries. Initial projects are set to be produced in Canada by Neshama Entertainment, an award-winning Canadian production company based in Toronto.
Closure of Vrak
On October 1, 2023, Bell Media discontinued operations of specialty channel Vrak after 23 years on the air. The closure of Vrak followed Videotron’s decision to discontinue offering Vrak to its subscribers. The media industry in Canada is undergoing significant challenges in the wake of a rapidly-changing operating environment and the regulatory framework in which broadcasters like Bell Media operate is outdated and not responsive to these challenges. As a result, Bell Media is re-evaluating the breadth of programming that it offers customers as part of its continued drive to align its offerings with their revenue potential.
Financial performance analysis
Q3 2023 performance highlights
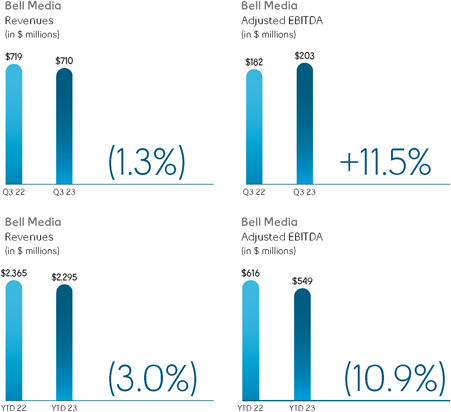
| 24 | BCE INC. 2023 THIRD QUARTER SHAREHOLDER REPORT |
3 MD&A Business segment analysis
Bell Media results
Revenues
| Q3 2023 | Q3 2022 | $ change | % change | YTD 2023 | YTD 2022 | $ change | % change | |||||||||||||||||||||||||
| External revenues |
626 | 631 | (5 | ) | (0.8% | ) | 2,039 | 2,105 | (66 | ) | (3.1% | ) | ||||||||||||||||||||
| Inter-segment revenues |
84 | 88 | (4 | ) | (4.5% | ) | 256 | 260 | (4 | ) | (1.5% | ) | ||||||||||||||||||||
| Bell Media operating revenues |
710 | 719 | (9 | ) | (1.3% | ) | 2,295 | 2,365 | (70 | ) | (3.0% | ) | ||||||||||||||||||||
Bell Media operating revenues decreased by 1.3% in Q3 2023 and by 3.0% in the first nine months of the year, compared to the same periods last year, due to lower advertising revenues, partly offset by higher subscriber revenues. Operating revenues included growth from digital revenues (1) of 26% in Q3 2023 and 16% in the first nine months of the year, compared to the same periods last year, which moderated the year-over-year decline in overall operating revenues.
| • | Advertising revenues declined by 5.2% in Q3 2023 and by 6.4% year to date, compared to the same periods last year, due to lower demand from advertisers as a result of the advertising recession, which unfavourably impacted revenues across our TV, radio and out-of-home (OOH) platforms. Additionally, TV advertising revenues were also unfavourably impacted by the Writers Guild of America (WGA) and the Screen Actors Guild and American Federation of Television and Radio Artists (SAG-AFTRA) strikes, affecting the start of the fall season. The decline in advertising revenues was partly offset by growth in digital TV advertising revenues, mainly driven by increased bookings from Bell Media’s strategic audience management (SAM) TV media sales tool and the favourable impact in Q3 2023 from the broadcast of the Fédération Internationale de Football Association (FIFA) Women’s World Cup on sports specialty TV. |
| • | Subscriber revenues grew by 2.9% in Q3 2023 and by 0.6% year to date, compared to the same periods last year, due to the continued growth in Crave and sports streaming DTC subscribers. The year-to-date growth in subscriber revenues was moderated by the benefit last year from a retroactive adjustment related to a contract with a Canadian TV distributor. |
Operating costs and adjusted EBITDA
| Q3 2023 | Q3 2022 | $ change | % change | YTD 2023 | YTD 2022 | $ change | % change | |||||||||||||||||||||||||
| Operating costs |
(507 | ) | (537 | ) | 30 | 5.6% | (1,746 | ) | (1,749 | ) | 3 | 0.2% | ||||||||||||||||||||
| Adjusted EBITDA |
203 | 182 | 21 | 11.5% | 549 | 616 | (67 | ) | (10.9% | ) | ||||||||||||||||||||||
| Adjusted EBITDA margin |
28.6% | 25.3% | 3.3 pts | 23.9% | 26.0% | (2.1) pts | ||||||||||||||||||||||||||
Bell Media operating costs decreased by 5.6% in Q3 2023 and by 0.2% in the first nine months of the year, compared to the same periods last year, due to:
| • | Lower content and programming costs in part due to the WGA and SAG-AFTRA strikes, partly offset by continued contractual increases in content costs |
| • | Restructuring initiatives undertaken in Q2 2023, as a result of the unfavourable economic and broadcasting regulatory environments |
| • | Cessation of the Canadian Radio-television and Telecommunications Commission (CRTC) Part II broadcasting license fee |
Bell Media adjusted EBITDA increased by 11.5% in Q3 2023, compared to the same period last year, due to lower operating costs, partly offset by lower operating revenues. Year-to-date adjusted EBITDA declined by 10.9%, compared to the same period last year, mainly driven by lower operating revenues.
Update to 2023 outlook
As of the date of the BCE 2022 Annual MD&A, we expected to generate positive Bell Media revenue growth in 2023. We now expect Bell Media’s 2023 revenue to be negatively impacted by economic uncertainty, including fears of a potential recession, and the slowdown being experienced in the Canadian advertising market, which is consistent with trends in the global advertising market, as well as due to the work stoppage of the WGA, which ended on October 9, 2023, and SAG-AFTRA, which remains ongoing. Improvement is expected in the medium term, although visibility to the specific timing and pace of recovery remains limited.
| (1) | Digital revenues are comprised of advertising revenue from digital platforms including web sites, mobile apps, connected TV apps and OOH digital assets/platforms, as well as advertising procured through Bell digital buying platforms and subscription revenue from DTC services and Video on Demand services. |
25
3 MD&A Business segment analysis
Assumptions
As at the date of this MD&A, our forward-looking statements set out in the BCE 2022 Annual MD&A, as updated or supplemented in the BCE 2023 First Quarter MD&A, in the BCE 2023 Second Quarter MD&A and in this MD&A, are based on certain assumptions including, without limitation, the following assumptions, the assumptions referred to in the Bell CTS business segment discussion set out in section 3.1, Bell CTS, of this MD&A, the economic, market and other assumptions referred to in section 1.3, Assumptions, of this MD&A, as well as the assumptions referred to in the section Caution regarding forward-looking statements at the beginning of this MD&A.
| • | Overall digital revenue expected to reflect continued scaling of our SAM Management TV and DSP buying platforms, as well as DTC subscriber growth contributing towards the advancement of our digital-first media strategy |
| • | Continued escalation of media content costs to secure quality programming |
| • | Continued scaling of Crave through broader content offering, user experience improvements and expanded distribution |
| • | Continued investment in Noovo original programming to better serve our French-language customers with a wider array of content on their preferred platforms |
| • | Leveraging of first-party data to improve targeting, advertisement delivery and attribution |
| • | Ability to successfully acquire and produce highly-rated programming and differentiated content |
| • | Building and maintaining strategic supply arrangements for content across all screens and platforms |
| • | No adverse material financial, operational or competitive consequences of changes in or implementation of regulations affecting our media business |
| 26 | BCE INC. 2023 THIRD QUARTER SHAREHOLDER REPORT |
4 MD&A Financial and capital management
| 4 | Financial and capital management |
This section tells you how we manage our cash and capital resources to carry out our strategy and deliver financial results. It provides an analysis of our financial condition, cash flows and liquidity on a consolidated basis.
| 4.1 | Net debt (1) |
| September 30, 2023 | December 31, 2022 | $ change | % change | |||||||||||||
| Long-term debt |
29,532 | 27,783 | 1,749 | 6.3% | ||||||||||||
| Debt due within one year |
5,171 | 4,137 | 1,034 | 25.0% | ||||||||||||
| 50% of preferred shares (2) |
1,871 | 1,935 | (64 | ) | (3.3% | ) | ||||||||||
| Cash |
(569 | ) | (99 | ) | (470 | ) | n.m. | |||||||||
| Cash equivalents |
(50 | ) | (50 | ) | – | – | ||||||||||
| Net debt |
35,955 | 33,706 | 2,249 | 6.7% | ||||||||||||
n.m. : not meaningful
| (1) | Net debt is a non-GAAP financial measure. See section 8.1, Non-GAAP financial measures in this MD&A for more information on this measure. |
| (2) | 50% of outstanding preferred shares of $3,742 million and $3,870 million at September 30, 2023 and December 31, 2022, respectively, are classified as debt consistent with the treatment by some credit rating agencies. |
The increase of $1,034 million in debt due within one year and the increase of $1,749 million in long-term debt were due to:
| • | the issuance by Bell Canada of Series M-58 MTN debentures, with a total principal amount of $1,050 million |
| • | the issuance by Bell Canada of Series M-59 MTN debentures, with a total principal amount of $450 million |
| • | the issuance by Bell Canada of Series M-60 MTN debentures, with a total principal amount of $600 million |
| • | the issuance by Bell Canada of Series M-61 MTN debentures, with a total principal amount of $400 million |
| • | the issuance by Bell Canada of Series US-8 Notes, with a total principal amount of $850 million in U.S. dollars ($1,138 million in Canadian dollars) |
| • | a net increase of $229 million due to higher lease liabilities and other debt |
Partly offset by:
| • | the repayment at maturity of Series M-29 MTN debentures, with a total principal amount of $600 million |
| • | a decrease in notes payable (net of issuances) of $484 million |
The increase in cash of $470 million was mainly due to:
| • | $5,573 million of cash flows from operating activities |
| • | $3,864 million of issuance of long-term debt |
| • | $209 million from business dispositions |
Partly offset by:
| • | $3,552 million of capital expenditures |
| • | $2,604 million of dividends paid on BCE common shares |
| • | $1,565 million repayment of long-term debt |
| • | $484 million decrease in notes payable (net of issuances) |
| • | $220 million for business acquisitions |
| • | $179 million paid for the purchase on the open market of BCE common shares for the settlement of share-based payments |
| • | $159 million for the purchase of spectrum licences |
| • | $149 million repurchase of a financial liability |
| • | $136 million of dividends paid on BCE preferred shares |
| • | $90 million paid for the repurchase of BCE preferred shares |
| 4.2 | Outstanding share data |
| Common shares outstanding |
Number of shares |
|||
| Outstanding, January 1, 2023 |
911,982,866 | |||
| Shares issued under deferred share plan |
562 | |||
| Shares issued under employee stock option plan |
306,139 | |||
| Unclaimed shares (1) |
(15,303 | ) | ||
| Outstanding, September 30, 2023 |
912,274,264 | |||
| (1) | Represents unclaimed shares following the expiry of former Manitoba Telecom Services Inc. (MTS) shareholders’ right to receive BCE common shares in connection with the acquisition of MTS. |
27
4 MD&A Financial and capital management
| Stock options outstanding |
Number of options |
Weighted average exercise price ($) |
||||||
| Outstanding, January 1, 2023 |
7,802,108 | 61 | ||||||
| Exercised (1) |
(306,139) | 60 | ||||||
| Forfeited or expired |
(11,408) | 63 | ||||||
| Outstanding and exercisable, September 30, 2023 |
7,484,561 | 61 | ||||||
| (1) | The weighted average market share price for options exercised during the nine months ended September 30, 2023 was $63. |
| 4.3 | Cash flows |
| Q3 2023 | Q3 2022 | $ change | % change | YTD 2023 | YTD 2022 | $ change | % change | |||||||||||||||||||||||||
| Cash flows from operating activities |
1,961 | 1,996 | (35 | ) | (1.8% | ) | 5,573 | 6,309 | (736 | ) | (11.7% | ) | ||||||||||||||||||||
| Capital expenditures |
(1,159 | ) | (1,317 | ) | 158 | 12.0% | (3,552 | ) | (3,495 | ) | (57 | ) | (1.6% | ) | ||||||||||||||||||
| Cash dividends paid on preferred shares |
(35 | ) | (27 | ) | (8 | ) | (29.6% | ) | (136 | ) | (94 | ) | (42 | ) | (44.7% | ) | ||||||||||||||||
| Cash dividends paid by subsidiaries to non-controlling interest |
(13 | ) | (11 | ) | (2 | ) | (18.2% | ) | (35 | ) | (36 | ) | 1 | 2.8% | ||||||||||||||||||
| Acquisition and other costs paid |
– | 1 | (1 | ) | (100.0% | ) | 5 | 7 | (2 | ) | (28.6% | ) | ||||||||||||||||||||
| Free cash flow |
754 | 642 | 112 | 17.4% | 1,855 | 2,691 | (836 | ) | (31.1% | ) | ||||||||||||||||||||||
| Business acquisitions |
1 | (3 | ) | 4 | n.m. | (220 | ) | (142 | ) | (78 | ) | (54.9% | ) | |||||||||||||||||||
| Business dispositions |
1 | (1 | ) | 2 | n.m. | 209 | 53 | 156 | n.m. | |||||||||||||||||||||||
| Acquisition and other costs paid |
– | (1 | ) | 1 | 100.0% | (5 | ) | (7 | ) | 2 | 28.6% | |||||||||||||||||||||
| Spectrum licences |
(3 | ) | (3 | ) | – | – | (159 | ) | (3 | ) | (156 | ) | n.m. | |||||||||||||||||||
| Other investing activities |
(16 | ) | (8 | ) | (8 | ) | (100.0% | ) | (1 | ) | 9 | (10 | ) | n.m. | ||||||||||||||||||
| (Decrease) increase in notes payable |
(300 | ) | (34 | ) | (266 | ) | n.m. | (484 | ) | 622 | (1,106 | ) | n.m. | |||||||||||||||||||
| Increase in securitized receivables |
– | 700 | (700 | ) | (100.0% | ) | – | 700 | (700 | ) | (100.0% | ) | ||||||||||||||||||||
| Issue of long-term debt |
1,161 | – | 1,161 | n.m. | 3,864 | 945 | 2,919 | n.m. | ||||||||||||||||||||||||
| Repayment of long-term debt |
(920 | ) | (270 | ) | (650 | ) | n.m. | (1,565 | ) | (1,773 | ) | 208 | 11.7% | |||||||||||||||||||
| Repurchase of a financial liability |
– | – | – | – | (149 | ) | – | (149 | ) | n.m. | ||||||||||||||||||||||
| Issue of common shares |
– | 1 | (1 | ) | (100.0% | ) | 18 | 169 | (151 | ) | (89.3% | ) | ||||||||||||||||||||
| Purchase of shares for settlement of share-based payments |
(44 | ) | (49 | ) | 5 | 10.2% | (179 | ) | (206 | ) | 27 | 13.1% | ||||||||||||||||||||
| Repurchase of preferred shares |
(27 | ) | – | (27 | ) | n.m. | (90 | ) | (115 | ) | 25 | 21.7% | ||||||||||||||||||||
| Cash dividends paid on common shares |
(883 | ) | (839 | ) | (44 | ) | (5.2% | ) | (2,604 | ) | (2,473 | ) | (131 | ) | (5.3% | ) | ||||||||||||||||
| Other financing activities |
(5 | ) | 2 | (7 | ) | n.m. | (20 | ) | (26 | ) | 6 | 23.1% | ||||||||||||||||||||
| Net increase (decrease) in cash |
119 | (13 | ) | 132 | n.m. | 470 | 294 | 176 | 59.9% | |||||||||||||||||||||||
| Net (decrease) increase in cash equivalents |
(400 | ) | 150 | (550 | ) | n.m. | – | 150 | (150 | ) | (100.0% | ) | ||||||||||||||||||||
n.m.: not meaningful
Cash flows from operating activities and free cash flow
Cash flows from operating activities in the third quarter of 2023 decreased by $35 million, compared to the same period last year, mainly due to lower cash from working capital, due in part to timing of supplier payments, and higher interest paid, partly offset by higher adjusted EBITDA.
Cash flows from operating activities in the first nine months of 2023 decreased by $736 million, compared to the same period last year, mainly due to lower cash from working capital from timing of supplier payments, higher interest paid and higher income taxes paid, partly offset by lower contributions to post-employment benefit plans and higher adjusted EBITDA.
Free cash flow in the third quarter increased by $112 million compared to the same period last year, due to lower capital expenditures, partly offset by lower cash flows from operating activities, excluding cash from acquisition and other costs paid.
Free cash flow in the first nine months of 2023 decreased by $836 million, compared to the same period last year, due to lower cash flows from operating activities, excluding cash from acquisition and other costs paid, and higher capital expenditures.
Capital expenditures
| Q3 2023 | Q3 2022 | $ change | % change | YTD 2023 | YTD 2022 | $ change | % change | |||||||||||||||||||||||||
| Bell CTS |
1,123 | 1,286 | 163 | 12.7% | 3,446 | 3,412 | (34 | ) | (1.0% | ) | ||||||||||||||||||||||
| Capital intensity (1) |
20.6% | 23.8% | 3.2 pts | 21.3% | 21.8% | 0.5 pts | ||||||||||||||||||||||||||
| Bell Media |
36 | 31 | (5 | ) | (16.1% | ) | 106 | 83 | (23 | ) | (27.7% | ) | ||||||||||||||||||||
| Capital intensity |
5.1% | 4.3% | (0.8) pts | 4.6% | 3.5% | (1.1) pts | ||||||||||||||||||||||||||
| BCE |
1,159 | 1,317 | 158 | 12.0% | 3,552 | 3,495 | (57 | ) | (1.6% | ) | ||||||||||||||||||||||
| Capital intensity |
19.1% | 21.9% | 2.8 pts | 19.5% | 19.7% | 0.2 pts | ||||||||||||||||||||||||||
| (1) | Capital intensity is defined as capital expenditures divided by operating revenues. |
| 28 | BCE INC. 2023 THIRD QUARTER SHAREHOLDER REPORT |
4 MD&A Financial and capital management
BCE capital expenditures of $1,159 million in Q3 2023, declined by 12.0% or $158 million, compared to the same period last year, whereas in the first nine months of the year, capital spending of $3,552 million increased by 1.6% or $57 million year over year. This corresponded to a capital intensity ratio of 19.1% in Q3 2023 and 19.5% year to date, down 2.8 pts and 0.2 pts, respectively, over the same periods last year. The year-over-year variances in capital expenditures reflected:
| • | Lower capital spending at Bell CTS of $163 million in Q3 2023 from an expected decline due to accelerated network investments in 2022. In the first nine months of the year, capital expenditures increased by $34 million, due to timing of capital spending. We continued to focus our investments on the further expansion of our FTTP network. |
| • | Higher capital expenditures at Bell Media of $5 million in Q3 2023 and $23 million year to date, compared to the same periods last year, mainly driven by investments to support digital growth. The year-over-year increase in the first nine months of the year also reflected higher spending on studio expansions. |
Business acquisitions
On June 1, 2023, Bell acquired FX Innovation, a Montréal-based provider of cloud-focused managed and professional services and workflow automation solutions for business clients, for cash consideration of $157 million, of which $12 million is payable within two years, and an estimated $6 million of additional cash consideration contingent on the achievement of certain performance objectives. This contingent consideration is expected to be settled by 2027 and the maximum amount payable is $7 million. The acquisition of FX Innovation aims to position Bell as a technology services leader for our enterprise customers. The results of FX Innovation are included in our Bell CTS segment.
In February 2022, Bell acquired EBOX and other related companies, which provide Internet, telephone and TV services to consumers and businesses in Québec and parts of Ontario for cash consideration of $153 million ($139 million net of cash acquired).
Business dispositions
On May 3, 2023, we completed the previously announced sale of our 63% ownership in certain production studios, which were included in our Bell Media segment, for net cash proceeds of $211 million.
On March 1, 2022, we completed the sale of our wholly-owned subsidiary, Createch, for cash proceeds of $54 million.
Spectrum licences
On May 19, 2023, after approval from Innovation, Science and Economic Development Canada (ISED), Bell Mobility Inc. obtained the right to use, through subordination, certain of Xplore Inc.’s 3500 megahertz spectrum licences in Québec, for $145 million.
Debt instruments
2023
In the third quarter of 2023, we issued debt, net of repayments. This included:
| • | $1,161 million issuance of long-term debt comprised of the issuance of Series M-60 MTN debentures with a total principal amount of $600 million, the issuance of Series M-61 MTN debentures with a total principal amount of $400 million and other debt of $162 million, partly offset by $1 million of discounts on our debt issuances |
Partly offset by:
| • | $600 million repayment of Series M-29 MTN debentures |
| • | $320 million repayment of long-term debt comprised of net payments of leases and other debt |
| • | $300 million repayment (net of issuances) of notes payable |
In the first nine months of 2023, we issued debt, net of repayments. This included:
| • | $3,864 million issuance of long-term debt comprised of the issuance of Series M-58 MTN debentures with a total principal amount of $1,050 million, the issuance of Series M-59 MTN debentures with a total principal amount of $450 million, the issuance of Series M-60 MTN debentures with a total principal amount of $600 million, the issuance of Series M-61 MTN debentures with a total principal amount of $400 million, the issuance of Series US-8 Notes, with a total principal amount of $850 million in U.S. dollars ($1,138 million in Canadian dollars) and the issuance of other debt of $232 million, partly offset by $6 million of discounts on our debt issuances |
Partly offset by:
| • | $965 million repayment of long-term debt comprised of net payments of leases and other debt |
| • | $600 million repayment of Series M-29 MTN debentures |
| • | $484 million repayment (net of issuances) of notes payable |
2022
In the third quarter of 2022, we issued debt, net of issuances. This included:
• $700 million increase in securitized receivables
Partly offset by:
| • | $270 million repayment of long-term debt comprised of net payments of leases and other debt |
| • | $34 million repayment (net of issuances) of notes payable |
29
4 MD&A Financial and capital management
In the first nine months of 2022, we issued debt, net of repayments. This included:
| • | $945 million issuance of long-term debt comprised of the issuance of Series US-7 Notes, with a total principal amount of $750 million in U.S. dollars ($954 million in Canadian dollars), partly offset by a $9 million discount on our debt issuance |
| • | $700 million increase in securitized receivables |
| • | $622 million issuance (net of repayments) of notes payable |
Partly offset by:
| • | $1,773 million repayment of long-term debt comprised of the early redemption of Series M-26 MTN debentures with a total principal amount of $1 billion in Canadian dollars, and net payments of leases and other debt of $773 million |
Consolidation of MLSE ownership under BCE (Repurchase of a financial liability)
In January 2023, BCE repurchased the 9% interest held by the BCE Master Trust Fund (Master Trust Fund), a trust fund that holds pension fund investments serving the pension obligations of the BCE group pension plan participants, in Maple Leaf Sports & Entertainment Ltd. (MLSE) for a cash consideration of $149 million, as a result of BCE’s obligation to repurchase the Master Trust Fund’s interest in MLSE at that price.
Issuance of common shares
The issuance of common shares in the third quarter and on a year-to-date basis in 2023 decreased by $1 million and $151 million, respectively, compared to the same periods in 2022, due to a lower number of exercised stock options.
Repurchase of preferred shares
2023
For the three and nine months ended September 30, 2023, BCE repurchased and canceled 1,574,700 and 5,135,650 First Preferred Shares with a stated capital of $39 million and $128 million for a total cost of $27 million and $90 million, respectively. The remaining $12 million and $38 million were recorded to contributed surplus for the three and nine months ended September 30, 2023, respectively.
Subsequent to quarter end, BCE repurchased and canceled 1,010,586 First Preferred Shares with a stated capital of $26 million for a total cost of $16 million. The remaining $10 million was recorded to contributed surplus.
2022
In Q1 2022, BCE redeemed its 4,600,000 issued and outstanding Cumulative Redeemable First Preferred Shares, Series AO for a total cost of $115 million.
Cash dividends paid on common shares
In the third quarter of 2023, cash dividends paid on common shares increased by $44 million compared to Q3 2022, due to a higher dividend paid in Q3 2023 of $0.9675 per common share compared to $0.9200 per common share in Q3 2022.
In the first nine months of 2023, cash dividends paid on common shares increased by $131 million compared to 2022, due to a higher dividend paid in the first nine months of 2023 of $2.855 per common share compared to $2.715 per common share for the same period last year.
| 4.4 | Post-employment benefit plans |
For the three months ended September 30, 2023, we recorded an increase in our post-employment benefit plans and a gain, before taxes, in OCI of $217 million, due to a higher actual discount rate of 5.7% at September 30, 2023, compared to 5.0% at June 30, 2023 and a decrease in the effect of the asset limit, partly offset by a loss on plan assets.
For the nine months ended September 30, 2023, we recorded a decrease in our post-employment benefit plans and a loss, before taxes, in OCI of $144 million, due to a loss on plan assets, partly offset by a higher actual discount rate of 5.7% at September 30, 2023, as compared to 5.3% at December 31, 2022 and a decrease in the effect of the asset limit.
For the three months ended September 30, 2022, we recorded a decrease in our post-employment benefit plans and a loss, before taxes, in OCI of $563 million, due to a lower actual discount rate of 5.1% at September 30, 2022, compared to 5.3% at June 30, 2022, lower-than-expected return on plan assets and experience losses, partly offset by a decrease in the effect of the asset limit.
For the nine months ended September 30, 2022, we recorded an increase in our post-employment benefit plans and a gain, before taxes, in OCI of $670 million, due to a higher actual discount rate of 5.1% at September 30, 2022, compared to 3.2% at December 31, 2021, partly offset by a loss on plan assets, an increase in the effect of the asset limit and experience losses.
| 30 | BCE INC. 2023 THIRD QUARTER SHAREHOLDER REPORT |
4 MD&A Financial and capital management
| 4.5 | Financial risk management |
Fair value
The following table provides the fair value details of financial instruments measured at amortized cost in the consolidated statements of financial position.
| September 30, 2023 | December 31, 2022 | |||||||||||||||||||
| Classification | Fair value methodology |
Carrying value |
Fair value |
Carrying value |
Fair value |
|||||||||||||||
| Debt securities and other debt | Debt due within one year and long-term debt | Quoted market price of debt | 28,180 | 25,142 | 25,061 | 23,026 | ||||||||||||||
The following table provides the fair value details of financial instruments measured at fair value in the consolidated statements of financial position.
| Fair value | ||||||||||||||||||||
| Classification | |
Carrying value of asset (liability) |
|
|
Quoted prices in active markets for identical assets (level 1) |
|
|
Observable market data |
|
|
Non-observable market inputs (level 3) |
(2) | ||||||||
| September 30, 2023 |
||||||||||||||||||||
| Publicly-traded and privately-held investments (3) | Other non-current assets |
227 | 8 | – | 219 | |||||||||||||||
| Derivative financial instruments | Other current assets, trade payables and other |
(205 | ) | – | (205 | ) | – | |||||||||||||
| Other |
Other non-current assets and liabilities |
121 | – | 197 | (76 | ) | ||||||||||||||
| December 31, 2022 | ||||||||||||||||||||
| Publicly-traded and privately-held investments (3) | Other non-current assets |
215 | 9 | – | 206 | |||||||||||||||
| Derivative financial instruments | Other current assets, trade payables and other |
72 | – | 72 | – | |||||||||||||||
| MLSE financial liability (4) | Trade payables and other liabilities |
(149 | ) | – | – | (149 | ) | |||||||||||||
| Other | Other non-current assets and liabilities |
108 | – | 184 | (76 | ) | ||||||||||||||
| (1) | Observable market data such as equity prices, interest rates, swap rate curves and foreign currency exchange rates. |
| (2) | Non-observable market inputs such as discounted cash flows and earnings multiples. A reasonable change in our assumptions would not result in a significant increase (decrease) to our level 3 financial instruments. |
| (3) | Unrealized gains and losses are recorded in Other comprehensive income (loss) in the statements of comprehensive income and are reclassified from Accumulated other comprehensive loss to Deficit in the statements of financial position when realized. |
| (4) | Represented BCE’s obligation to repurchase the BCE Master Trust Fund’s (Master Trust Fund) 9% interest in MLSE at a price not less than an agreed minimum price. In January 2023, BCE repurchased the interest held by the Master Trust Fund, a trust fund that holds pension fund investments serving the pension obligations of the BCE group pension plan participants, in MLSE for a cash consideration of $149 million. |
Market risk
Currency exposures
In Q3 2023, we entered into cross currency interest rate swaps with a notional amount of $120 million in U.S. dollars ($162 million in Canadian dollars) to hedge the U.S. currency exposure of outstanding loans under our uncommitted trade loan agreement maturing in 2025. The fair value of these cross currency swaps at September 30, 2023 was nil.
In Q2 2023, we entered into cross currency interest rate swaps with a notional amount of $850 million in U.S. dollars ($1,138 million in Canadian dollars) to hedge the U.S. currency exposure of our US-8 Notes maturing in 2033. The fair value of these cross currency interest rate swaps at September 30, 2023 was a net asset of $18 million recognized in Other current assets, Other non-current assets and Trade payables and other liabilities in the statements of financial position.
A 10% depreciation (appreciation) in the value of the Canadian dollar relative to the U.S. dollar would result in a gain of $11 million (loss of $63 million) recognized in net earnings at September 30, 2023 and a gain (loss) of $104 million recognized in Other comprehensive income (loss) at September 30, 2023, with all other variables held constant.
A 10% depreciation (appreciation) in the value of the Canadian dollar relative to the Philippine peso would result in a gain (loss) of $6 million recognized in Other comprehensive income (loss) at September 30, 2023, with all other variables held constant.
31
4 MD&A Financial and capital management
The following table provides further details on our outstanding foreign currency forward contracts and options at September 30, 2023.
| Type of hedge | Buy currency |
Amount to receive |
Sell currency |
Amount to pay |
Maturity | Hedged item | ||||||||||||||||||
| Cash flow (1) |
USD | 1,192 | CAD | 1,608 | 2023 | Loans | ||||||||||||||||||
| Cash flow |
USD | 270 | CAD | 367 | 2023 | Commercial paper | ||||||||||||||||||
| Cash flow |
USD | 232 | CAD | 288 | 2023 | Anticipated purchases | ||||||||||||||||||
| Cash flow |
PHP | 778 | CAD | 18 | 2023 | Anticipated purchases | ||||||||||||||||||
| Cash flow |
USD | 824 | CAD | 1,046 | 2024 | Anticipated purchases | ||||||||||||||||||
| Cash flow |
PHP | 2,885 | CAD | 69 | 2024 | Anticipated purchases | ||||||||||||||||||
| Cash flow |
USD | 88 | CAD | 115 | 2025 | Anticipated purchases | ||||||||||||||||||
| Economic |
USD | 39 | CAD | 49 | 2023 | Anticipated purchases | ||||||||||||||||||
| Economic – call options |
CAD | 56 | USD | 39 | 2023 | Anticipated purchases | ||||||||||||||||||
| Economic – put options |
USD | 84 | CAD | 109 | 2023 | Anticipated purchases | ||||||||||||||||||
| Economic – call options |
USD | 60 | CAD | 80 | 2023 | Anticipated purchases | ||||||||||||||||||
| Economic |
USD | 130 | CAD | 171 | 2024 | Anticipated purchases | ||||||||||||||||||
| Economic – options (2) |
USD | 120 | CAD | 153 | 2024 | Anticipated purchases | ||||||||||||||||||
| Economic – call options |
USD | 244 | CAD | 327 | 2024 | Anticipated purchases | ||||||||||||||||||
| Economic – call options |
CAD | 225 | USD | 156 | 2024 | Anticipated purchases | ||||||||||||||||||
| Economic – put options |
USD | 519 | CAD | 675 | 2024 | Anticipated purchases | ||||||||||||||||||
| Economic – options (2) |
USD | 60 | CAD | 78 | 2025 | Anticipated purchases | ||||||||||||||||||
| Economic – call options |
USD | 540 | CAD | 694 | 2025 | Anticipated purchases | ||||||||||||||||||
| Economic – put options |
USD | 360 | CAD | 461 | 2025 | Anticipated purchases | ||||||||||||||||||
| (1) | Forward contracts to hedge loans secured by receivables under our securitization program. |
| (2) | Foreign currency options with a leverage provision and a profit cap limitation. |
Interest rate exposures
In 2023, we sold interest rate swaptions with a notional amount of $125 million maturing in Q4 2023, for $1 million, to hedge economically the fair value of our Series M-57 MTN debentures. The fair value of these swaptions at September 30, 2023 was a liability of $4 million recognized in Trade payables and other liabilities in the statements of financial position. A loss of $3 million for the three and nine months ended September 30, 2023 relating to these interest rate swaptions is recognized in Other expense in the income statements.
In 2023, we entered into interest rate swaps with a notional amount of $250 million to hedge the fair value of our Series M-57 MTN debentures maturing in 2032. The fair value of these interest rate swaps at September 30, 2023 was a liability of $11 million recognized in Trade payables and other liabilities and Other non-current liabilities in the statements of financial position.
In Q3 2023, we entered into forward starting interest rate swaps with a notional amount of $400 million to hedge the fair value of our series M-61 MTN debentures maturing in 2053. The fair value of these interest rate swaps at September 30, 2023 was a liability of $16 million recognized in Other non-current liabilities in the statements of financial position.
In Q3 2023, we entered into an amortizing interest rate swap with an initial notional amount of $197 million, to hedge the interest rate exposure on other debt maturing in 2028. The fair value of the amortizing interest rate swap at September 30, 2023 was a net asset of $1 million recognized in Other current assets and Other non-current liabilities in the statements of financial position.
In Q2 2023, we sold interest rate swaptions with a notional amount of $375 million, for $3 million, to hedge economically the fair value of our Series M-52 MTN debentures. These swaptions were exercised in Q2 2023, giving rise to a loss of $1 million recognized in Other expense in the income statements. The resulting interest rate swaps with a notional amount of $375 million hedge the fair value of our Series M-52 MTN debentures maturing in 2030. The fair value of these interest rate swaps at September 30, 2023 was a liability of $20 million recognized in Trade payables and other liabilities and Other non-current liabilities in the statements of financial position.
In Q1 2023, we sold interest rate swaptions with a notional amount of $250 million, for $2 million, to hedge economically the fair value of our Series M-53 MTN debentures maturing in 2027. In Q1 2023, we also sold interest rate swaptions with a notional amount of $425 million, for $2 million, to hedge economically the floating interest rate exposure relating to our Series M-53 MTN debentures. These swaptions matured unexercised in Q2 2023. A gain of nil and $4 million for the three and nine months ended September 30, 2023, respectively, relating to these interest rate swaptions is recognized in Other expense in the income statements.
In 2022, we entered into interest rate swaps with a notional amount of $500 million to hedge the fair value of our Series M-53 MTN debentures maturing in 2027. The fair value of these interest rate swaps at September 30, 2023 and December 31, 2022 is a liability of $30 million and $14 million, respectively, recognized in Trade payables and other liabilities and Other non-current liabilities in the statements of financial position.
In 2022, we entered into cross currency basis rate swaps maturing in 2023 with a notional amount of $638 million Canadian dollars to hedge economically the basis rate exposure on future debt issuances. In 2023, the maturity date of $445 million of these cross currency basis rate swaps was extended to 2024 resulting in an increase in their notional amount to $644 million at September 30, 2023. The fair value of these cross currency basis rate swaps at September 30, 2023 and December 31, 2022 was a liability of $20 million and $33 million, respectively, recognized in Trade payables and other liabilities and Other non-current liabilities in the statements of financial position. A gain of $7 million and a gain of $13 million for the three and nine months ended September 30, 2023, respectively, relating to these basis rate swaps is recognized in Other expense in the income statements.
We use leveraged interest rate options to hedge economically the dividend rate resets on $582 million of our preferred shares which had varying reset dates in 2021 for the periods ending in 2026. The fair value of these leveraged interest rate options at September 30, 2023 and December 31, 2022 was nil and a liability of $1 million, respectively, recognized in Trade payables and other liabilities and Other non-current liabilities in the statements of
| 32 | BCE INC. 2023 THIRD QUARTER SHAREHOLDER REPORT |
4 MD&A Financial and capital management
financial position. A gain of nil and $1 million for the three and nine months ended September 30, 2023, respectively, relating to these leveraged interest rate options is recognized in Other expense in the income statements.
A 1% increase (decrease) in interest rates would result in a loss of $30 million (gain of $27 million) recognized in net earnings at September 30, 2023, with all other variables held constant.
A 0.1% increase (decrease) in cross currency basis swap rates would result in a gain (loss) of $10 million recognized in net earnings at September 30, 2023, with all other variables held constant.
Equity price exposures
We use equity forward contracts on BCE’s common shares to hedge economically the cash flow exposure related to the settlement of equity settled share-based compensation plans. The fair value of our equity forward contracts at September 30, 2023 and December 31, 2022 was a net liability of $167 million and $48 million, respectively, recognized in Other current assets, Trade payables and other liabilities, Other non-current assets and Other non-current liabilities in the statements of financial position. A loss of $128 million and $109 million for the three and nine months ended September 30, 2023, respectively, relating to these equity forward contracts is recognized in Other expense in the income statements.
A 5% increase (decrease) in the market price of BCE’s common shares would result in a gain (loss) of $28 million recognized in net earnings at September 30, 2023, with all other variables held constant.
| 4.6 | Credit ratings |
BCE’s and Bell Canada’s key credit ratings remain unchanged from those described in the BCE 2022 Annual MD&A.
| 4.7 | Liquidity |
This section contains forward-looking statements, including relating to the expectation that our available liquidity, 2023 estimated cash flows from operations and capital markets financing will permit us to meet our cash requirements in 2023. Refer to the section Caution regarding forward-looking statements at the beginning of this MD&A.
Available liquidity
Total available liquidity (1) at September 30, 2023 was $4.5 billion, comprised of $569 million in cash, $50 million in cash equivalents, $700 million available under our securitized receivables program and $3.137 billion available under our $3.5 billion committed revolving and expansion credit facilities (given $363 million of commercial paper outstanding).
We expect that our available liquidity, 2023 estimated cash flows from operations and capital markets financing will permit us to meet our cash requirements in 2023 for capital expenditures, post-employment benefit plans funding, dividend payments, the payment of contractual obligations, maturing debt, ongoing operations and other cash requirements.
We continuously monitor our operations, capital markets and the Canadian economy with the objective of maintaining adequate liquidity.
Securitization program
In Q3 2023, Bell Canada amended its existing $2.3 billion securitization program to add sustainability-linked pricing. The amendment introduces a financing cost that varies based on Bell’s performance of certain sustainability performance targets.
Credit facilities
In Q3 2023, Bell Mobility Inc. entered into a $600 million U.S. dollars uncommitted trade loan agreement to finance certain purchase obligations. Loan requests may be made until April 30, 2024, with each loan having a term of up to 24 months. As at September 30, 2023, $120 million U.S. dollars ($162 million in Canadian dollars) had been drawn under this loan agreement. The loan agreement has been hedged for foreign currency fluctuations.
| 4.8 | Litigation |
Recent developments in legal proceedings
The following is an update to the legal proceedings described in the BCE 2022 AIF under section 8, Legal proceedings, as updated in the BCE 2023 Second Quarter MD&A.
Class action concerning neighbourhood marketing practices
On July 4, 2023, the Québec Superior Court delivered its decision authorizing the class action for which an application for authorization to institute a class action was filed on November 24, 2021. On August 7, 2023, Bell Canada filed a motion for leave to appeal certain parts of that decision. On September 22, 2023, the Québec Court of Appeal denied Bell Canada’s motion for leave to appeal.
| (1) | Available liquidity is a non-GAAP financial measure. Refer to section 8.1, Non-GAAP financial measures in this MD&A for more information on this measure. |
33
5 MD&A Quarterly financial information
| 5 | Quarterly financial information |
BCE’s Q3 2023 Financial Statements were prepared in accordance with International Financial Reporting Standards (IFRS), as issued by the International Accounting Standards Board (IASB), under International Accounting Standard (IAS) 34, Interim Financial Reporting and were approved by BCE’s board of directors on November 1, 2023.
The following table, which was also prepared in accordance with IFRS, shows selected consolidated financial data of BCE for the eight most recent completed quarters.
| 2023 | 2022 | 2021 | ||||||||||||||||||||||||||||||
| Q3 | Q2 | Q1 | Q4 | Q3 | Q2 | Q1 | Q4 | |||||||||||||||||||||||||
| Operating revenues |
||||||||||||||||||||||||||||||||
| Service |
5,281 | 5,303 | 5,222 | 5,353 | 5,193 | 5,233 | 5,177 | 5,243 | ||||||||||||||||||||||||
| Product |
799 | 763 | 832 | 1,086 | 831 | 628 | 673 | 966 | ||||||||||||||||||||||||
| Total operating revenues |
6,080 | 6,066 | 6,054 | 6,439 | 6,024 | 5,861 | 5,850 | 6,209 | ||||||||||||||||||||||||
| Adjusted EBITDA |
2,667 | 2,645 | 2,538 | 2,437 | 2,588 | 2,590 | 2,584 | 2,430 | ||||||||||||||||||||||||
| Severance, acquisition and other costs |
(10 | ) | (100 | ) | (49 | ) | (19 | ) | (22 | ) | (40 | ) | (13 | ) | (63 | ) | ||||||||||||||||
| Depreciation |
(937 | ) | (936 | ) | (918 | ) | (922 | ) | (914 | ) | (933 | ) | (891 | ) | (925 | ) | ||||||||||||||||
| Amortization |
(295 | ) | (296 | ) | (283 | ) | (270 | ) | (267 | ) | (266 | ) | (260 | ) | (251 | ) | ||||||||||||||||
| Net earnings |
707 | 397 | 788 | 567 | 771 | 654 | 934 | 658 | ||||||||||||||||||||||||
| Net earnings attributable to common shareholders |
640 | 329 | 725 | 528 | 715 | 596 | 877 | 625 | ||||||||||||||||||||||||
| EPS – basic and diluted |
0.70 | 0.37 | 0.79 | 0.58 | 0.78 | 0.66 | 0.96 | 0.69 | ||||||||||||||||||||||||
| Weighted average number of common shares outstanding – basic (millions) |
912.3 | 912.2 | 912.1 | 912.0 | 911.9 | 911.9 | 910.1 | 908.8 | ||||||||||||||||||||||||
| 34 | BCE INC. 2023 THIRD QUARTER SHAREHOLDER REPORT |
6 MD&A Regulatory environment
| 6 | Regulatory environment |
The following is an update to the regulatory initiatives and proceedings described in the BCE 2022 Annual MD&A under section 3.3, Principal business risks and section 8, Regulatory environment, as updated in the BCE 2023 First Quarter MD&A and in the BCE 2023 Second Quarter MD&A.
Telecommunications Act
Review of mobile wireless services
In Q3 2023, we began providing mobile virtual network operator (MVNO) access service on Bell Mobility Inc. (Bell Mobility)’s network in certain regions and expect that use of the service on our network by our wholesale customers will continue to expand in the future.
On July 13, 2023, the CRTC accepted a request from Quebecor Media Inc. (Quebecor) to initiate Final Offer Arbitration (FOA) in respect of rates for MVNO access service from Bell Mobility. Following the parties’ submissions in August, the CRTC issued a decision on October 10, 2023, selecting the rate proposed by Bell Mobility.
The CRTC previously accepted a joint request for FOA from Rogers Communications Canada Inc. (Rogers) and Quebecor. On July 24, 2023, the CRTC issued its decision in that arbitration, selecting the rate proposed by Quebecor. In the decision, the CRTC made a number of findings or determinations that indicate a continued trend toward downplaying the importance of incentives for investment in telecommunications networks in Canada. While the CRTC’s determination in Bell Mobility’s FOA with Quebecor appears to have moderated this approach by highlighting the importance of providing a return on investment to facilities-based carriers, adverse regulatory decisions such as the Rogers and Quebecor FOA decision are expected to impact the specific nature, magnitude, location and timing of our future wireless and wireline investment decisions. On August 23, 2023, Rogers sought leave to appeal the CRTC’s arbitration decision with the Federal Court of Appeal.
Teksavvy’s application regarding undue preference in wholesale high-speed access rates and services
On September 15, 2023, the CRTC issued a decision denying an application from TekSavvy that had alleged that Bell Canada engaged in undue preference in contravention of the Telecommunications Act. Specifically, the CRTC found that there was no undue preference with respect to the relationship between Bell Canada and EBOX.
35
7 MD&A Accounting policies
| 7 | Accounting policies |
BCE’s Q3 2023 Financial Statements were prepared in accordance with IFRS, as issued by the IASB, under IAS 34 – Interim Financial Reporting and were approved by BCE’s board of directors on November 1, 2023. These financial statements were prepared using the same basis of presentation, accounting policies and methods of computation as outlined in Note 2, Significant accounting policies in BCE’s consolidated financial statements for the year ended December 31, 2022, except as noted below. BCE’s Q3 2023 Financial Statements do not include all of the notes required in the annual financial statements.
Adoption of amendments to accounting standards
As required, we adopted the following amendments to accounting standards issued by the IASB in May 2023.
| Standard | Description | Impact | ||||
| International Tax Reform – Pillar Two Model Rules – Amendments to IAS 12 – Income Taxes | These amendments require that entities apply IAS 12 to income taxes arising from tax law enacted or substantively enacted to implement the Pillar Two model rules published by the Organisation for Economic Co-operation and Development, including tax law that implements qualified domestic minimum top-up taxes described in those rules (Pillar Two). As an exception to the requirements in IAS 12, entities do not recognize or disclose information about deferred tax assets and liabilities related to Pillar Two. | In May 2023, we adopted the amendments to IAS 12 retrospectively. As required, we applied the exception and do not recognize or disclose information about deferred tax assets and liabilities related to Pillar Two.
The adoption of these amendments did not have a significant impact on our financial statements. | ||||
Future changes to accounting standards
The following amendments to accounting standards issued by the IASB have not yet been adopted by BCE.
| Standard | Description | Impact | Effective date | |||
| Disclosure of Accounting Policies – Amendments to IAS 1 – Presentation of Financial Statements | These amendments require that entities disclose material accounting policies, as defined, instead of significant accounting policies. | We are currently assessing the impact of these amendments on the disclosure of our accounting policies. |
Effective for annual reporting periods beginning on or after January 1, 2023 and any changes will be reflected in our financial statements for the year ended December 31, 2023. | |||
| 36 | BCE INC. 2023 THIRD QUARTER SHAREHOLDER REPORT |
8 MD&A Non-GAAP financial measures, other financial measures and key performance indicators (KPIs)
| 8 | Non-GAAP financial measures, other financial |
| measures and key performance indicators (KPIs) |
BCE uses various financial measures to assess its business performance. Certain of these measures are calculated in accordance with International Financial Reporting Standards (IFRS or GAAP) while certain other measures do not have a standardized meaning under GAAP. We believe that our GAAP financial measures, read together with adjusted non-GAAP and other financial measures, provide readers with a better understanding of how management assesses BCE’s performance.
National Instrument 52-112, Non-GAAP and Other Financial Measures Disclosure (NI 52-112), prescribes disclosure requirements that apply to the following specified financial measures:
| • | Non-GAAP financial measures; |
| • | Non-GAAP ratios; |
| • | Total of segments measures; |
| • | Capital management measures; and |
| • | Supplementary financial measures. |
This section provides a description and classification of the specified financial measures contemplated by NI 52-112 that we use to explain our financial results except that, for supplementary financial measures, an explanation of such measures is provided where they are first referred to if the supplementary financial measures’ labelling is not sufficiently descriptive.
| 8.1 | Non-GAAP financial measures |
A non-GAAP financial measure is a financial measure used to depict our historical or expected future financial performance, financial position or cash flow and, with respect to its composition, either excludes an amount that is included in, or includes an amount that is excluded from, the composition of the most directly comparable financial measure disclosed in BCE’s consolidated primary financial statements. We believe that non-GAAP financial measures are reflective of our on-going operating results and provide readers with an understanding of management’s perspective on and analysis of our performance.
Below are descriptions of the non-GAAP financial measures that we use to explain our results as well as reconciliations to the most directly comparable IFRS financial measures.
Adjusted net earnings
The term adjusted net earnings does not have any standardized meaning under IFRS. Therefore, it is unlikely to be comparable to similar measures presented by other issuers.
We define adjusted net earnings as net earnings attributable to common shareholders before severance, acquisition and other costs, net mark-to-market losses (gains) on derivatives used to economically hedge equity settled share-based compensation plans, net equity losses (gains) on investments in associates and joint ventures, net losses (gains) on investments, early debt redemption costs, impairment of assets and discontinued operations, net of tax and NCI.
We use adjusted net earnings and we believe that certain investors and analysts use this measure, among other ones, to assess the performance of our businesses without the effects of severance, acquisition and other costs, net mark-to-market losses (gains) on derivatives used to economically hedge equity settled share-based compensation plans, net equity losses (gains) on investments in associates and joint ventures, net losses (gains) on investments, early debt redemption costs, impairment of assets and discontinued operations, net of tax and NCI. We exclude these items because they affect the comparability of our financial results and could potentially distort the analysis of trends in business performance. Excluding these items does not imply they are non-recurring.
The most directly comparable IFRS financial measure is net earnings attributable to common shareholders.
The following table is a reconciliation of net earnings attributable to common shareholders to adjusted net earnings on a consolidated basis.
| Q3 2023 | Q3 2022 | YTD 2023 | YTD 2022 | |||||||||||||
| Net earnings attributable to common shareholders |
640 | 715 | 1,694 | 2,188 | ||||||||||||
| Reconciling items: |
||||||||||||||||
| Severance, acquisition and other costs |
10 | 22 | 159 | 75 | ||||||||||||
| Net mark-to-market losses on derivatives used to economically hedge equity settled share-based compensation plans |
128 | 74 | 109 | 80 | ||||||||||||
| Net equity losses on investments in associates and joint ventures |
– | – | 377 | 42 | ||||||||||||
| Net losses (gains) on investments |
1 | – | (78 | ) | (53 | ) | ||||||||||
| Early debt redemption costs |
– | – | 1 | 18 | ||||||||||||
| Impairment of assets |
– | 21 | 34 | 129 | ||||||||||||
| Income taxes for the above reconciling items |
(38 | ) | (31 | ) | (61 | ) | (80 | ) | ||||||||
| NCI for the above reconciling items |
– | – | – | 4 | ||||||||||||
| Adjusted net earnings |
741 | 801 | 2,235 | 2,403 | ||||||||||||
37
8 MD&A Non-GAAP financial measures, other financial measures and key performance indicators (KPIs)
Adjusted net interest expense
The term adjusted net interest expense does not have any standardized meaning under IFRS. Therefore, it is unlikely to be comparable to similar measures presented by other issuers.
We define adjusted net interest expense as twelve-month trailing net interest expense as shown in our consolidated statements of cash flows, plus 50% of twelve-month trailing net earnings attributable to preferred shareholders as shown in our consolidated income statements.
We use adjusted net interest expense as a component in the calculation of the adjusted EBITDA to adjusted net interest expense ratio, which is a capital management measure. For further details on the adjusted EBITDA to adjusted net interest expense ratio, see section 8.4, Capital management measures. We use, and believe that certain investors and analysts use, the adjusted EBITDA to adjusted net interest expense ratio, among other measures, to evaluate the financial health of the company.
The most directly comparable IFRS financial measure is net interest expense. The following table is a reconciliation of net interest expense to adjusted net interest expense on a consolidated basis.
| Q3 2023 | Q3 2022 | |||||||
| Net interest expense (nine months ended September 30, 2023 and 2022, respectively) |
1,034 | 805 | ||||||
| Net interest expense (year ended December 31, 2022 and 2021, respectively) |
1,124 | 1,063 | ||||||
| Net interest expense (nine months ended September 30, 2022 and 2021, respectively) |
(805 | ) | (794 | ) | ||||
|
12-month trailing net interest expense (ended September 30, 2023 and 2022, respectively) |
1,353 | 1,074 | ||||||
| 50% of net earnings attributable to preferred shareholders (nine months ended September 30, 2023 and 2022, respectively) |
70 | 54 | ||||||
| 50% of net earnings attributable to preferred shareholders (year ended December 31, 2022 and 2021, respectively) |
76 | 66 | ||||||
| 50% of net earnings attributable to preferred shareholders (nine months ended September 30, 2022 and 2021, respectively) |
(54 | ) | (49 | ) | ||||
| 50% of 12-month trailing net earnings attributable to preferred shareholders (ended September 30, 2023 and 2022, respectively) |
92 | 71 | ||||||
| Adjusted net interest expense for the twelve months ended September 30, 2023 and 2022, respectively |
1,445 | 1,145 | ||||||
Available liquidity
The term available liquidity does not have any standardized meaning under IFRS. Therefore, it is unlikely to be comparable to similar measures presented by other issuers.
We define available liquidity as cash, cash equivalents and amounts available under our securitized receivables program and our committed bank credit facilities, excluding credit facilities that are available exclusively for a pre-determined purpose.
We consider available liquidity to be an important indicator of the financial strength and performance of our businesses because it shows the funds available to meet our cash requirements, including for, but not limited to, capital expenditures, post-employment benefit plans funding, dividend payments, the payment of contractual obligations, maturing debt, on-going operations, the acquisition of spectrum, and other cash requirements. We believe that certain investors and analysts use available liquidity to evaluate the financial strength and performance of our businesses. The most directly comparable IFRS financial measure is cash.
The following table is a reconciliation of cash to available liquidity on a consolidated basis.
| September 30, 2023 | December 31, 2022 | |||||||
| Cash |
569 | 99 | ||||||
| Cash equivalents |
50 | 50 | ||||||
| Amounts available under our securitized receivables program (1) |
700 | 700 | ||||||
| Amounts available under our committed bank credit facilities (2) |
3,137 | 2,651 | ||||||
| Available liquidity |
4,456 | 3,500 | ||||||
| (1) | At September 30, 2023 and December 31, 2022, $700 million were available under our securitized receivables program, under which we borrowed $1,185 million in U.S. dollars ($1,603 million in Canadian dollars) and $1,173 million in U.S. dollars ($1,588 million in Canadian dollars) as at September 30, 2023 and December 31, 2022, respectively. Loans secured by receivables are included in Debt due within one year in our consolidated financial statements. |
| (2) | At September 30, 2023 and December 31, 2022, respectively, $3,137 million and $2,651 million were available under our committed bank credit facilities, given outstanding commercial paper of $269 million in U.S. dollars ($363 million in Canadian dollars) and $627 million in U.S. dollars ($849 million in Canadian dollars) at September 30, 2023 and December 31, 2022, respectively. Commercial paper outstanding is included in Debt due within one year in our consolidated financial statements. |
| 38 | BCE INC. 2023 THIRD QUARTER SHAREHOLDER REPORT |
8 MD&A Non-GAAP financial measures, other financial measures and key performance indicators (KPIs)
Free cash flow and excess free cash flow
The terms free cash flow and excess free cash flow do not have any standardized meaning under IFRS. Therefore, they are unlikely to be comparable to similar measures presented by other issuers.
We define free cash flow as cash flows from operating activities, excluding cash from discontinued operations, acquisition and other costs paid (which include significant litigation costs) and voluntary pension funding, less capital expenditures, preferred share dividends and dividends paid by subsidiaries to NCI. We exclude cash from discontinued operations, acquisition and other costs paid and voluntary pension funding because they affect the comparability of our financial results and could potentially distort the analysis of trends in business performance. Excluding these items does not imply they are non-recurring.
We define excess free cash flow as free cash flow less dividends paid on common shares.
We consider free cash flow and excess free cash flow to be important indicators of the financial strength and performance of our businesses. Free cash flow shows how much cash is available to pay dividends on common shares, repay debt and reinvest in our company. Excess free cash flow shows how much cash is available to repay debt and reinvest in our company, after the payment of dividends on common shares. We believe that certain investors and analysts use free cash flow and excess free cash flow to value a business and its underlying assets and to evaluate the financial strength and performance of our businesses. The most directly comparable IFRS financial measure is cash flows from operating activities.
The following table is a reconciliation of cash flows from operating activities to free cash flow and excess free cash flow on a consolidated basis.
| Q3 2023 | Q3 2022 | YTD 2023 | YTD 2022 | |||||||||||||
| Cash flows from operating activities |
1,961 | 1,996 | 5,573 | 6,309 | ||||||||||||
| Capital expenditures |
(1,159 | ) | (1,317 | ) | (3,552 | ) | (3,495 | ) | ||||||||
| Cash dividends paid on preferred shares |
(35 | ) | (27 | ) | (136 | ) | (94 | ) | ||||||||
| Cash dividends paid by subsidiaries to NCI |
(13 | ) | (11 | ) | (35 | ) | (36 | ) | ||||||||
| Acquisition and other costs paid |
– | 1 | 5 | 7 | ||||||||||||
| Free cash flow |
754 | 642 | 1,855 | 2,691 | ||||||||||||
| Dividends paid on common shares |
(883 | ) | (839 | ) | (2,604 | ) | (2,473 | ) | ||||||||
| Excess free cash flow |
(129 | ) | (197 | ) | (749 | ) | 218 | |||||||||
Net debt
The term net debt does not have any standardized meaning under IFRS. Therefore, it is unlikely to be comparable to similar measures presented by other issuers.
We define net debt as debt due within one year plus long-term debt and 50% of preferred shares, less cash and cash equivalents, as shown in BCE’s consolidated statements of financial position. We include 50% of outstanding preferred shares in our net debt as it is consistent with the treatment by certain credit rating agencies.
We consider net debt to be an important indicator of the company’s financial leverage because it represents the amount of debt that is not covered by available cash and cash equivalents. We believe that certain investors and analysts use net debt to determine a company’s financial leverage.
Net debt is calculated using several asset and liability categories from the statements of financial position. The most directly comparable IFRS financial measure is long-term debt. The following table is a reconciliation of long-term debt to net debt on a consolidated basis.
| September 30, 2023 | December 31, 2022 | |||||||
| Long-term debt |
29,532 | 27,783 | ||||||
| Debt due within one year |
5,171 | 4,137 | ||||||
| 50% of preferred shares |
1,871 | 1,935 | ||||||
| Cash |
(569 | ) | (99 | ) | ||||
| Cash equivalents |
(50 | ) | (50 | ) | ||||
| Net debt |
35,955 | 33,706 | ||||||
39
8 MD&A Non-GAAP financial measures, other financial measures and key performance indicators (KPIs)
| 8.2 | Non-GAAP ratios |
A non-GAAP ratio is a financial measure disclosed in the form of a ratio, fraction, percentage or similar representation and that has a non-GAAP financial measure as one or more of its components.
Adjusted EPS
The term adjusted EPS does not have any standardized meaning under IFRS. Therefore, it is unlikely to be comparable to similar measures presented by other issuers.
We define adjusted EPS as adjusted net earnings per BCE common share. Adjusted net earnings is a non-GAAP financial measure. For further details on adjusted net earnings, see section 8.1, Non-GAAP financial measures.
We use adjusted EPS, and we believe that certain investors and analysts use this measure, among other ones, to assess the performance of our businesses without the effects of severance, acquisition and other costs, net mark-to-market losses (gains) on derivatives used to economically hedge equity settled share-based compensation plans, net equity losses (gains) on investments in associates and joint ventures, net losses (gains) on investments, early debt redemption costs, impairment of assets and discontinued operations, net of tax and NCI. We exclude these items because they affect the comparability of our financial results and could potentially distort the analysis of trends in business performance. Excluding these items does not imply they are non-recurring.
Dividend payout ratio
The term dividend payout ratio does not have any standardized meaning under IFRS. Therefore, it is unlikely to be comparable to similar measures presented by other issuers.
We define dividend payout ratio as dividends paid on common shares divided by free cash flow. Free cash flow is a non-GAAP financial measure. For further details on free cash flow, see section 8.1, Non-GAAP financial measures.
We consider dividend payout ratio to be an important indicator of the financial strength and performance of our businesses because it shows the sustainability of the company’s dividend payments.
| 8.3 | Total of segments measures |
A total of segments measure is a financial measure that is a subtotal or total of 2 or more reportable segments and is disclosed within the Notes to BCE’s consolidated primary financial statements.
Adjusted EBITDA
We define adjusted EBITDA as operating revenues less operating costs as shown in BCE’s consolidated income statements.
The most directly comparable IFRS financial measure is net earnings. The following tables provide a reconciliation of net earnings to adjusted EBITDA on a consolidated basis.
| YTD 2023 | Q3 2023 | Q2 2023 | Q1 2023 | |||||||||||||
| Net earnings |
1,892 | 707 | 397 | 788 | ||||||||||||
| Severance, acquisition and other costs |
159 | 10 | 100 | 49 | ||||||||||||
| Depreciation |
2,791 | 937 | 936 | 918 | ||||||||||||
| Amortization |
874 | 295 | 296 | 283 | ||||||||||||
| Finance costs |
||||||||||||||||
| Interest expense |
1,076 | 373 | 359 | 344 | ||||||||||||
| Net return on post-employment benefit plans |
(81 | ) | (27 | ) | (27 | ) | (27 | ) | ||||||||
| Impairment of assets |
34 | – | – | 34 | ||||||||||||
| Other expense (income) |
319 | 129 | 311 | (121 | ) | |||||||||||
| Income taxes |
786 | 243 | 273 | 270 | ||||||||||||
| Adjusted EBITDA |
7,850 | 2,667 | 2,645 | 2,538 | ||||||||||||
| 40 | BCE INC. 2023 THIRD QUARTER SHAREHOLDER REPORT |
8 MD&A Non-GAAP financial measures, other financial measures and key performance indicators (KPIs)
| Q4 2022 | YTD 2022 | Q3 2022 | Q2 2022 | Q1 2022 | Q4 2021 | |||||||||||||||||||
| Net earnings |
567 | 2,359 | 771 | 654 | 934 | 658 | ||||||||||||||||||
| Severance, acquisition and other costs |
19 | 75 | 22 | 40 | 13 | 63 | ||||||||||||||||||
| Depreciation |
922 | 2,738 | 914 | 933 | 891 | 925 | ||||||||||||||||||
| Amortization |
270 | 793 | 267 | 266 | 260 | 251 | ||||||||||||||||||
| Finance costs |
||||||||||||||||||||||||
| Interest expense |
319 | 827 | 298 | 269 | 260 | 275 | ||||||||||||||||||
| Net (return) interest on post-employment benefit plans |
(13 | ) | (38 | ) | (13 | ) | (7 | ) | (18 | ) | 5 | |||||||||||||
| Impairment of assets |
150 | 129 | 21 | 106 | 2 | 30 | ||||||||||||||||||
| Other (income) expense |
(19 | ) | 134 | 130 | 97 | (93 | ) | (26 | ) | |||||||||||||||
| Income taxes |
222 | 745 | 178 | 232 | 335 | 249 | ||||||||||||||||||
| Adjusted EBITDA |
2,437 | 7,762 | 2,588 | 2,590 | 2,584 | 2,430 | ||||||||||||||||||
| 8.4 | Capital management measures |
A capital management measure is a financial measure that is intended to enable a reader to evaluate our objectives, policies and processes for managing our capital and is disclosed within the Notes to BCE’s consolidated financial statements.
The financial reporting framework used to prepare the financial statements requires disclosure that helps readers assess the company’s capital management objectives, policies, and processes, as set out in IFRS in IAS 1 – Presentation of Financial Statements. BCE has its own methods for managing capital and liquidity, and IFRS does not prescribe any particular calculation method.
Adjusted EBITDA to adjusted net interest expense ratio
The adjusted EBITDA to adjusted net interest expense ratio represents adjusted EBITDA divided by adjusted net interest expense. For the purposes of calculating our adjusted EBITDA to adjusted net interest expense ratio, adjusted EBITDA is twelve-month trailing adjusted EBITDA. Adjusted net interest expense used in the calculation of the adjusted EBITDA to adjusted net interest expense ratio is a non-GAAP financial measure defined as twelve-month trailing net interest expense as shown in our consolidated statements of cash flows, plus 50% of twelve-month trailing net earnings attributable to preferred shareholders as shown in our consolidated income statements. For further details on adjusted net interest expense, see section 8.1, Non-GAAP financial measures.
We use, and believe that certain investors and analysts use, the adjusted EBITDA to adjusted net interest expense ratio, among other measures, to evaluate the financial health of the company.
Net debt leverage ratio
The net debt leverage ratio represents net debt divided by adjusted EBITDA. Net debt used in the calculation of the net debt leverage ratio is a non-GAAP financial measure. For further details on net debt, see section 8.1, Non-GAAP financial measures. For the purposes of calculating our net debt leverage ratio, adjusted EBITDA is twelve-month trailing adjusted EBITDA.
We use, and believe that certain investors and analysts use, the net debt leverage ratio as a measure of financial leverage.
| 8.5 | Supplementary financial measures |
A supplementary financial measure is a financial measure that is not reported in BCE’s consolidated financial statements, and is, or is intended to be, reported periodically to represent historical or expected future financial performance, financial position, or cash flows.
An explanation of such measures is provided where they are first referred to in this MD&A if the supplementary financial measures’ labelling is not sufficiently descriptive.
41
8 MD&A Non-GAAP financial measures, other financial measures and key performance indicators (KPIs)
| 8.6 | KPIs |
In addition to the non-GAAP financial measures and other financial measures described previously, we use the following KPIs to measure the success of our strategic imperatives. These KPIs are not accounting measures and may not be comparable to similar measures presented by other issuers.
|
KPI |
Definition | |
| Adjusted EBITDA margin | Adjusted EBITDA margin is defined as adjusted EBITDA divided by operating revenues. | |
| ARPU | Effective Q1 2023, as a result of the segment reporting changes impacting intersegment eliminations, ARPU has been updated and is defined as Bell CTS wireless external services revenues (previously wireless operating service revenues) divided by the average mobile phone subscriber base for the specified period, expressed as a dollar unit per month. | |
| Capital intensity | Capital intensity is defined as capital expenditures divided by operating revenues. | |
| Churn | Mobile phone churn is the rate at which existing mobile phone subscribers cancel their services. It is a measure of our ability to retain our customers. Mobile phone churn is calculated by dividing the number of mobile phone deactivations during a given period by the average number of mobile phone subscribers in the base for the specified period and is expressed as a percentage per month. | |
| Subscriber unit | Mobile phone subscriber unit is comprised of a recurring revenue generating portable unit (e.g. smartphones and feature phones) on an active service plan, that has access to our wireless networks and includes voice, text and/or data connectivity. We report mobile phone subscriber units in two categories: postpaid and prepaid. Prepaid mobile phone subscriber units are considered active for a period of 90 days following the expiry of the subscriber’s prepaid balance.
Mobile connected device subscriber unit is comprised of a recurring revenue generating portable unit (e.g. tablets, wearables, mobile Internet devices and IoT) on an active service plan, that has access to our wireless networks and is intended for limited or no cellular voice capability.
Wireline subscriber unit consists of an active revenue-generating unit with access to our services, including retail Internet, satellite TV, IPTV, and/or residential NAS. A subscriber is included in our subscriber base when the service has been installed and is operational at the customer premise and a billing relationship has been established.
• Retail Internet, IPTV and satellite TV subscribers have access to stand-alone services, and are primarily represented by a dwelling unit
• Retail residential NAS subscribers are based on a line count and are represented by a unique telephone number | |
| 42 | BCE INC. 2023 THIRD QUARTER SHAREHOLDER REPORT |
9 MD&A Controls and procedures
| 9 | Controls and procedures |
Changes in internal control over financial reporting
No changes were made in our internal control over financial reporting during the quarter ended September 30, 2023 that have materially affected, or are reasonably likely to materially affect, our internal control over financial reporting.
43
Exhibit 99.2
Consolidated financial statements
Table of contents
| Consolidated income statements |
45 | |||||
| Consolidated statements of comprehensive income |
46 | |||||
| Consolidated statements of financial position |
47 | |||||
| Consolidated statements of changes in equity |
48 | |||||
| Consolidated statements of cash flows |
49 | |||||
| Notes to consolidated financial statements |
50 | |||||
| Note 1 |
Corporate information |
50 | ||||
| Note 2 |
Basis of presentation and significant accounting policies |
50 | ||||
| Note 3 |
Segmented information |
51 | ||||
| Note 4 |
Business acquisitions and disposition |
54 | ||||
| Note 5 |
Operating costs |
56 | ||||
| Note 6 |
Severance, acquisition and other costs |
56 | ||||
| Note 7 |
Impairment of assets |
56 | ||||
| Note 8 |
Other expense |
57 | ||||
| Note 9 |
Income taxes |
57 | ||||
| Note 10 |
Earnings per share |
57 | ||||
| Note 11 |
Debt |
58 | ||||
| Note 12 |
Post-employment benefit plans |
58 | ||||
| Note 13 |
Financial assets and liabilities |
59 | ||||
| Note 14 |
Share capital |
61 | ||||
| Note 15 |
Share-based payments |
62 | ||||
| 44 | BCE INC. 2023 THIRD QUARTER SHAREHOLDER REPORT |
Consolidated financial statements
Consolidated income statements
| For the period ended September 30 (in millions of Canadian dollars, except share amounts) (unaudited) |
Three months |
Nine months |
||||||||||||||||||
|
Note |
2023 |
2022 |
2023 |
2022 |
||||||||||||||||
| Operating revenues |
3 | 6,080 | 6,024 | 18,200 | 17,735 | |||||||||||||||
| Operating costs |
3, 5 | (3,413 | ) | (3,436 | ) | (10,350 | ) | (9,973 | ) | |||||||||||
| Severance, acquisition and other costs |
6 | (10 | ) | (22 | ) | (159 | ) | (75 | ) | |||||||||||
| Depreciation |
(937 | ) | (914 | ) | (2,791 | ) | (2,738 | ) | ||||||||||||
| Amortization |
(295 | ) | (267 | ) | (874 | ) | (793 | ) | ||||||||||||
| Finance costs |
||||||||||||||||||||
| Interest expense |
(373 | ) | (298 | ) | (1,076 | ) | (827 | ) | ||||||||||||
| Net return on post-employment benefit plans |
12 | 27 | 13 | 81 | 38 | |||||||||||||||
| Impairment of assets |
7 | – | (21 | ) | (34 | ) | (129 | ) | ||||||||||||
| Other expense |
8 | (129 | ) | (130 | ) | (319 | ) | (134 | ) | |||||||||||
| Income taxes |
9 | (243 | ) | (178 | ) | (786 | ) | (745 | ) | |||||||||||
| Net earnings |
707 | 771 | 1,892 | 2,359 | ||||||||||||||||
| Net earnings attributable to: |
||||||||||||||||||||
| Common shareholders |
640 | 715 | 1,694 | 2,188 | ||||||||||||||||
| Preferred shareholders |
47 | 39 | 139 | 108 | ||||||||||||||||
|
Non-controlling interest |
20 | 17 | 59 | 63 | ||||||||||||||||
| Net earnings |
707 | 771 | 1,892 | 2,359 | ||||||||||||||||
| Net earnings per common share – basic and diluted |
10 | 0.70 | 0.78 | 1.86 | 2.40 | |||||||||||||||
| Weighted average number of common shares outstanding – basic (millions) |
912.3 | 911.9 | 912.2 | 911.3 | ||||||||||||||||
45
Consolidated financial statements
Consolidated statements of comprehensive income
|
For the period ended September 30 (in millions of Canadian dollars) (unaudited) |
Three months |
Nine months | ||||||||||||||||||
|
Note |
2023 |
2022 |
2023 |
2022 |
||||||||||||||||
| Net earnings |
707 | 771 | 1,892 | 2,359 | ||||||||||||||||
| Other comprehensive income (loss), net of income taxes |
||||||||||||||||||||
| Items that will be subsequently reclassified to net earnings |
||||||||||||||||||||
| Net change in value of derivatives designated as cash flow hedges, net of income taxes of $17 million and $115 million for the three months ended September 30, 2023 and 2022, respectively, and $25 million and $89 million for the nine months ended September 30, 2023 and 2022, respectively |
(46 | ) | (314 | ) | (68 | ) | (243 | ) | ||||||||||||
| Items that will not be reclassified to net earnings |
||||||||||||||||||||
| Actuarial gains (losses) on post-employment benefit plans, net of income taxes of ($59) million and $151 million for the three months ended September 30, 2023 and 2022, respectively, and $39 million and ($179) million for the nine months ended September 30, 2023 and 2022, respectively (1) |
12 | 158 | (412 | ) | (105 | ) | 491 | |||||||||||||
| Net change in value of publicly-traded and privately-held investments, net of income taxes of nil for the three months ended September 30, 2023 and 2022, and ($3) million and ($14) million for the nine months ended September 30, 2023 and 2022, respectively |
(1 | ) | 2 | 15 | (2 | ) | ||||||||||||||
| Net change in value of derivatives designated as cash flow hedges, net of income taxes of ($6) million and ($21) million for the three months ended September 30, 2023 and 2022, respectively and nil and ($25) million for the nine months ended September 30, 2023 and 2022, respectively |
16 | 56 | (1 | ) | 67 | |||||||||||||||
| Other comprehensive income (loss) |
127 | (668 | ) | (159 | ) | 313 | ||||||||||||||
| Total comprehensive income |
834 | 103 | 1,733 | 2,672 | ||||||||||||||||
| Total comprehensive income attributable to: |
||||||||||||||||||||
| Common shareholders |
765 | 41 | 1,536 | 2,494 | ||||||||||||||||
| Preferred shareholders |
47 | 39 | 139 | 108 | ||||||||||||||||
|
Non-controlling interest |
22 | 23 | 58 | 70 | ||||||||||||||||
| Total comprehensive income |
834 | 103 | 1,733 | 2,672 | ||||||||||||||||
| (1) | The discount rate used to value our post-employment benefit obligations at September 30, 2023 was 5.7% compared to 5.0% at June 30, 2023 and 5.3% at December 31, 2022. The discount rate used to value our post-employment benefit obligations at September 30, 2022 was 5.1% compared to 5.3% at June 30, 2022 and 3.2% at December 31, 2021. |
| 46 | BCE INC. 2023 THIRD QUARTER SHAREHOLDER REPORT |
Consolidated financial statements
Consolidated statements of financial position
| (in millions of Canadian dollars) (unaudited) | Note | September 30, 2023 | December 31, 2022 | |||||||||
| ASSETS |
||||||||||||
| Current assets |
||||||||||||
| Cash |
569 | 99 | ||||||||||
| Cash equivalents |
50 | 50 | ||||||||||
| Trade and other receivables |
3,838 | 4,138 | ||||||||||
| Inventory |
636 | 656 | ||||||||||
| Contract assets |
404 | 436 | ||||||||||
| Contract costs |
590 | 540 | ||||||||||
| Prepaid expenses |
338 | 244 | ||||||||||
| Other current assets |
312 | 324 | ||||||||||
| Total current assets |
6,737 | 6,487 | ||||||||||
| Non-current assets |
||||||||||||
| Contract assets |
251 | 288 | ||||||||||
| Contract costs |
732 | 603 | ||||||||||
| Property, plant and equipment |
30,158 | 29,256 | ||||||||||
| Intangible assets |
16,491 | 16,183 | ||||||||||
| Deferred tax assets |
114 | 84 | ||||||||||
| Investments in associates and joint ventures |
8 | 326 | 608 | |||||||||
| Post-employment benefit assets |
12 | 3,299 | 3,559 | |||||||||
| Other non-current assets |
1,241 | 1,355 | ||||||||||
| Goodwill |
4 | 11,023 | 10,906 | |||||||||
| Total non-current assets |
63,635 | 62,842 | ||||||||||
| Total assets |
70,372 | 69,329 | ||||||||||
| LIABILITIES |
||||||||||||
| Current liabilities |
||||||||||||
| Trade payables and other liabilities |
4,354 | 5,221 | ||||||||||
| Contract liabilities |
798 | 857 | ||||||||||
| Interest payable |
258 | 281 | ||||||||||
| Dividends payable |
910 | 867 | ||||||||||
| Current tax liabilities |
279 | 106 | ||||||||||
| Debt due within one year |
11 | 5,171 | 4,137 | |||||||||
| Total current liabilities |
11,770 | 11,469 | ||||||||||
| Non-current liabilities |
||||||||||||
| Contract liabilities |
271 | 228 | ||||||||||
| Long-term debt |
11 | 29,532 | 27,783 | |||||||||
| Deferred tax liabilities |
4,954 | 4,953 | ||||||||||
| Post-employment benefit obligations |
12 | 1,225 | 1,311 | |||||||||
| Other non-current liabilities |
1,313 | 1,070 | ||||||||||
| Total non-current liabilities |
37,295 | 35,345 | ||||||||||
| Total liabilities |
49,065 | 46,814 | ||||||||||
| EQUITY |
||||||||||||
| Equity attributable to BCE shareholders |
||||||||||||
| Preferred shares |
14 | 3,742 | 3,870 | |||||||||
| Common shares |
20,859 | 20,840 | ||||||||||
| Contributed surplus |
14 | 1,230 | 1,172 | |||||||||
| Accumulated other comprehensive loss |
(145 | ) | (55 | ) | ||||||||
| Deficit |
(4,716 | ) | (3,649 | ) | ||||||||
| Total equity attributable to BCE shareholders |
20,970 | 22,178 | ||||||||||
|
Non-controlling interest |
4 | 337 | 337 | |||||||||
| Total equity |
21,307 | 22,515 | ||||||||||
| Total liabilities and equity |
70,372 | 69,329 | ||||||||||
47
Consolidated financial statements
Consolidated statements of changes in equity
| Attributable to BCE shareholders | ||||||||||||||||||||||||||||||||||||
| For the period ended September 30, 2023 (in millions of Canadian dollars) (unaudited) |
Note | Preferred shares |
Common shares |
Contributed surplus |
Accumulated other comprehensive loss |
Deficit | Total | Non- controlling interest |
Total equity | |||||||||||||||||||||||||||
| Balance at December 31, 2022 |
3,870 | 20,840 | 1,172 | (55 | ) | (3,649 | ) | 22,178 | 337 | 22,515 | ||||||||||||||||||||||||||
| Net earnings |
– | – | – | – | 1,833 | 1,833 | 59 | 1,892 | ||||||||||||||||||||||||||||
| Other comprehensive loss |
– | – | – | (53 | ) | (105 | ) | (158 | ) | (1 | ) | (159 | ) | |||||||||||||||||||||||
| Total comprehensive (loss) income |
– | – | – | (53 | ) | 1,728 | 1,675 | 58 | 1,733 | |||||||||||||||||||||||||||
| Common shares issued under employee stock option plan |
– | 19 | (1 | ) | – | – | 18 | – | 18 | |||||||||||||||||||||||||||
| Other share-based compensation |
– | – | 21 | – | (25 | ) | (4 | ) | – | (4 | ) | |||||||||||||||||||||||||
| Repurchase of preferred shares |
14 | (128 | ) | – | 38 | – | – | (90 | ) | – | (90 | ) | ||||||||||||||||||||||||
| Dividends declared on BCE common and preferred shares |
– | – | – | – | (2,787 | ) | (2,787 | ) | – | (2,787 | ) | |||||||||||||||||||||||||
| Dividends declared by subsidiaries to non-controlling interest |
– | – | – | – | – | – | (35 | ) | (35 | ) | ||||||||||||||||||||||||||
| Settlement of cash flow hedges transferred to the cost basis of hedged items |
– | – | – | (20 | ) | – | (20 | ) | – | (20 | ) | |||||||||||||||||||||||||
| Disposition of production studios |
4 | – | – | – | – | – | – | (23 | ) | (23 | ) | |||||||||||||||||||||||||
| Other |
– | – | – | (17 | ) | 17 | – | – | – | |||||||||||||||||||||||||||
| Balance at September 30, 2023 |
3,742 | 20,859 | 1,230 | (145 | ) | (4,716 | ) | 20,970 | 337 | 21,307 | ||||||||||||||||||||||||||
| Attributable to BCE shareholders | ||||||||||||||||||||||||||||||||||||
| For the period ended September 30, 2022 (in millions of Canadian dollars) (unaudited) |
Note | Preferred shares |
Common shares |
Contributed surplus |
Accumulated other comprehensive income |
Deficit | Total | Non- controlling interest |
Total equity | |||||||||||||||||||||||||||
| Balance at December 31, 2021 |
4,003 | 20,662 | 1,157 | 213 | (3,400 | ) | 22,635 | 306 | 22,941 | |||||||||||||||||||||||||||
| Net earnings |
– | – | – | – | 2,296 | 2,296 | 63 | 2,359 | ||||||||||||||||||||||||||||
| Other comprehensive (loss) income |
– | – | – | (183 | ) | 489 | 306 | 7 | 313 | |||||||||||||||||||||||||||
| Total comprehensive (loss) income |
– | – | – | (183 | ) | 2,785 | 2,602 | 70 | 2,672 | |||||||||||||||||||||||||||
| Common shares issued under employee stock option plan |
– | 176 | (7 | ) | – | – | 169 | – | 169 | |||||||||||||||||||||||||||
| Other share-based compensation |
– | – | 9 | – | (33 | ) | (24 | ) | – | (24 | ) | |||||||||||||||||||||||||
| Repurchase of preferred shares |
14 | (118 | ) | – | 3 | – | – | (115 | ) | – | (115 | ) | ||||||||||||||||||||||||
| Dividends declared on BCE common and preferred shares |
– | – | – | – | (2,625 | ) | (2,625 | ) | – | (2,625 | ) | |||||||||||||||||||||||||
| Dividends declared by subsidiaries to non-controlling interest |
– | – | – | – | – | – | (36 | ) | (36 | ) | ||||||||||||||||||||||||||
| Settlement of cash flow hedges transferred to the cost basis of hedged items |
– | – | – | (1 | ) | – | (1 | ) | – | (1 | ) | |||||||||||||||||||||||||
| Other |
– | – | – | (19 | ) | 19 | – | – | – | |||||||||||||||||||||||||||
| Balance at September 30, 2022 |
3,885 | 20,838 | 1,162 | 10 | (3,254 | ) | 22,641 | 340 | 22,981 | |||||||||||||||||||||||||||
| 48 | BCE INC. 2023 THIRD QUARTER SHAREHOLDER REPORT |
Consolidated financial statements
Consolidated statements of cash flows
|
For the period ended September 30 (in millions of Canadian dollars) (unaudited) |
Three months | Nine months | ||||||||||||||||||
|
Note |
2023 |
2022 |
2023 |
2022 |
||||||||||||||||
| Cash flows from operating activities |
||||||||||||||||||||
| Net earnings |
707 | 771 | 1,892 | 2,359 | ||||||||||||||||
| Adjustments to reconcile net earnings to cash flows from operating activities |
||||||||||||||||||||
| Severance, acquisition and other costs |
6 | 10 | 22 | 159 | 75 | |||||||||||||||
| Depreciation and amortization |
1,232 | 1,181 | 3,665 | 3,531 | ||||||||||||||||
| Post-employment benefit plans cost |
12 | 23 | 48 | 75 | 151 | |||||||||||||||
| Net interest expense |
358 | 282 | 1,034 | 805 | ||||||||||||||||
| Impairment of assets |
7 | – | 21 | 34 | 129 | |||||||||||||||
| Losses (gains) on investments |
8 | 1 | – | (78 | ) | (53 | ) | |||||||||||||
| Net equity losses from investments in associates and joint ventures |
8 | – | – | 377 | 42 | |||||||||||||||
| Income taxes |
9 | 243 | 178 | 786 | 745 | |||||||||||||||
| Contributions to post-employment benefit plans |
(12 | ) | (14 | ) | (40 | ) | (128 | ) | ||||||||||||
| Payments under other post-employment benefit plans |
(16 | ) | (17 | ) | (48 | ) | (47 | ) | ||||||||||||
| Severance and other costs paid |
(55 | ) | (44 | ) | (119 | ) | (102 | ) | ||||||||||||
| Interest paid |
(451 | ) | (385 | ) | (1,160 | ) | (954 | ) | ||||||||||||
| Income taxes paid (net of refunds) |
(167 | ) | (150 | ) | (531 | ) | (409 | ) | ||||||||||||
| Acquisition and other costs paid |
– | (1 | ) | (5 | ) | (7 | ) | |||||||||||||
| Change in contract assets |
(8 | ) | (20 | ) | 70 | 35 | ||||||||||||||
| Change in wireless device financing plan receivables |
16 | (6 | ) | 81 | 121 | |||||||||||||||
| Net change in operating assets and liabilities |
80 | 130 | (619 | ) | 16 | |||||||||||||||
| Cash flows from operating activities |
1,961 | 1,996 | 5,573 | 6,309 | ||||||||||||||||
| Cash flows used in investing activities |
||||||||||||||||||||
| Capital expenditures |
(1,159 | ) | (1,317 | ) | (3,552 | ) | (3,495 | ) | ||||||||||||
| Business acquisitions |
4 | 1 | (3 | ) | (220 | ) | (142 | ) | ||||||||||||
| Business dispositions |
4 | 1 | (1 | ) | 209 | 53 | ||||||||||||||
| Spectrum licences |
(3 | ) | (3 | ) | (159 | ) | (3 | ) | ||||||||||||
| Other investing activities |
(16 | ) | (8 | ) | (1 | ) | 9 | |||||||||||||
| Cash flows used in investing activities |
(1,176 | ) | (1,332 | ) | (3,723 | ) | (3,578 | ) | ||||||||||||
| Cash flows used in financing activities |
||||||||||||||||||||
| (Decrease) increase in notes payable |
(300 | ) | (34 | ) | (484 | ) | 622 | |||||||||||||
| Increase in securitized receivables |
– | 700 | – | 700 | ||||||||||||||||
| Issue of long-term debt |
11 | 1,161 | – | 3,864 | 945 | |||||||||||||||
| Repayment of long-term debt |
(920 | ) | (270 | ) | (1,565 | ) | (1,773 | ) | ||||||||||||
| Repurchase of a financial liability |
13 | – | – | (149 | ) | – | ||||||||||||||
| Issue of common shares |
– | 1 | 18 | 169 | ||||||||||||||||
| Purchase of shares for settlement of share-based payments |
(44 | ) | (49 | ) | (179 | ) | (206 | ) | ||||||||||||
| Repurchase of preferred shares |
14 | (27 | ) | – | (90 | ) | (115 | ) | ||||||||||||
| Cash dividends paid on common shares |
(883 | ) | (839 | ) | (2,604 | ) | (2,473 | ) | ||||||||||||
| Cash dividends paid on preferred shares |
(35 | ) | (27 | ) | (136 | ) | (94 | ) | ||||||||||||
| Cash dividends paid by subsidiaries to non-controlling interest |
(13 | ) | (11 | ) | (35 | ) | (36 | ) | ||||||||||||
| Other financing activities |
(5 | ) | 2 | (20 | ) | (26 | ) | |||||||||||||
| Cash flows used in financing activities |
(1,066 | ) | (527 | ) | (1,380 | ) | (2,287 | ) | ||||||||||||
| Net increase (decrease) in cash |
119 | (13 | ) | 470 | 294 | |||||||||||||||
| Cash at beginning of period |
450 | 596 | 99 | 289 | ||||||||||||||||
| Cash at end of period |
569 | 583 | 569 | 583 | ||||||||||||||||
| Net (decrease) increase in cash equivalents |
(400 | ) | 150 | – | 150 | |||||||||||||||
| Cash equivalents at beginning of period |
450 | – | 50 | – | ||||||||||||||||
| Cash equivalents at end of period |
50 | 150 | 50 | 150 | ||||||||||||||||
49
Notes to consolidated financial statements
Notes to consolidated financial statements
These consolidated interim financial statements (financial statements) should be read in conjunction with BCE’s 2022 annual consolidated financial statements, approved by BCE’s board of directors on March 2, 2023.
These notes are unaudited.
We, us, our, BCE and the company mean, as the context may require, either BCE Inc. or, collectively, BCE Inc., Bell Canada, their subsidiaries, joint arrangements and associates.
| NOTE 1 |
Corporate information | |
BCE is incorporated and domiciled in Canada. BCE’s head office is located at 1, Carrefour Alexander-Graham-Bell, Verdun, Québec, Canada. BCE is a communications company providing wireless, wireline, Internet and television (TV) services to residential, business and wholesale customers in Canada. Our Bell Media segment provides conventional TV, specialty TV, pay TV, streaming services, digital media services, radio broadcasting services and out-of-home (OOH) advertising services to customers in Canada.
| NOTE 2 |
Basis of presentation and significant accounting policies | |
These financial statements were prepared in accordance with International Financial Reporting Standards (IFRS), as issued by the International Accounting Standards Board (IASB), under International Accounting Standard (IAS) 34 – Interim Financial Reporting and were approved by BCE’s board of directors on November 1, 2023. These financial statements were prepared using the same basis of presentation, accounting policies and methods of computation as outlined in Note 2, Significant accounting policies in our consolidated financial statements for the year ended December 31, 2022, except as noted below.
These financial statements do not include all of the notes required in annual financial statements.
All amounts are in millions of Canadian dollars, except where noted.
Adoption of amendments to accounting standards
As required, we adopted the following amendments to accounting standards issued by the IASB in May 2023.
| Standard | Description | Impact | ||||
| International Tax Reform – Pillar Two Model Rules – Amendments to IAS 12 – Income Taxes | These amendments require that entities apply IAS 12 to income taxes arising from tax law enacted or substantively enacted to implement the Pillar Two model rules published by the Organisation for Economic Co-operation and Development, including tax law that implements qualified domestic minimum top-up taxes described in those rules (Pillar Two). As an exception to the requirements in IAS 12, entities do not recognize or disclose information about deferred tax assets and liabilities related to Pillar Two. | In May 2023, we adopted the amendments to IAS 12 retrospectively. As required, we applied the exception and do not recognize or disclose information about deferred tax assets and liabilities related to Pillar Two.
The adoption of these amendments did not have a significant impact on our financial statements. | ||||
Future changes to accounting standards
The following amendments to accounting standards issued by the IASB have not yet been adopted by BCE.
| Standard | Description | Impact | Effective date | |||
| Disclosure of Accounting Policies – Amendments to IAS 1 – Presentation of Financial Statements | These amendments require that entities disclose material accounting policies, as defined, instead of significant accounting policies. | We are currently assessing the impact of these amendments on the disclosure of our accounting policies. |
Effective for annual reporting periods beginning on or after January 1, 2023 and any changes will be reflected in our financial statements for the year ended December 31, 2023. | |||
| 50 | BCE INC. 2023 THIRD QUARTER SHAREHOLDER REPORT |
Notes to consolidated financial statements
| NOTE 3 |
Segmented information | |
In 2022, we began modifying our internal and external reporting processes to align with organizational changes that were made to reflect an increasing strategic focus on multiproduct sales, the continually increasing technological convergence of our wireless and wireline telecommunications infrastructure and operations driven by the deployment of our Fifth Generation (5G) and fibre networks, and our digital transformation. These factors have made it increasingly difficult to distinguish between our wireless and wireline operations and resulted in changes in Q1 2023 to the financial information that is regularly provided to our chief operating decision maker to measure performance and allocate resources.
Effective with our Q1 2023 results, our previous Bell Wireless and Bell Wireline operating segments were combined to form a single reporting segment called Bell Communication and Technology Services (Bell CTS). Bell Media remains a distinct reportable segment and is unaffected. Our results are therefore reported in two segments: Bell CTS and Bell Media. As a result of our reporting changes, prior periods have been restated for comparative purposes.
Our Bell CTS segment provides a wide range of communication products and services to consumers, businesses and government customers across Canada. Wireless products and services include mobile data and voice plans and devices and are available nationally. Wireline products and services comprise data (including Internet access, IPTV, cloud-based services and business solutions), voice, and other communication services and products, which are available to our residential, small and medium-sized business and large enterprise customers primarily in Ontario, Québec, the Atlantic provinces and Manitoba, while satellite TV service and connectivity to business customers are available nationally across Canada. In addition, this segment includes our wholesale business, which buys and sells local telephone, long distance, data and other services from or to resellers and other carriers, as well as the results of operations of our national consumer electronics retailer, The Source (Bell) Electronics Inc. (The Source).
Our Bell Media segment provides conventional TV, specialty TV, pay TV, streaming services, digital media services, radio broadcasting services and OOH and advanced advertising services to customers nationally across Canada.
Our segments reflect how we manage our business and how we classify our operations for planning and measuring performance.
The following tables present financial information by segment for the three month periods ended September 30, 2023 and 2022.
| For the three month period ended September 30, 2023 | Note | Bell CTS |
Bell Media |
Intersegment eliminations |
BCE | |||||||||||||||
| Operating revenues |
||||||||||||||||||||
| External service revenues |
4,655 | 626 | – | 5,281 | ||||||||||||||||
| Inter-segment service revenues |
7 | 84 | (91 | ) | – | |||||||||||||||
| Operating service revenues |
4,662 | 710 | (91 | ) | 5,281 | |||||||||||||||
| External/Operating product revenues |
799 | – | – | 799 | ||||||||||||||||
| Total external revenues |
5,454 | 626 | – | 6,080 | ||||||||||||||||
| Total inter-segment revenues |
7 | 84 | (91 | ) | – | |||||||||||||||
| Total operating revenues |
5,461 | 710 | (91 | ) | 6,080 | |||||||||||||||
| Operating costs |
5 | (2,997 | ) | (507 | ) | 91 | (3,413 | ) | ||||||||||||
| Adjusted EBITDA (1) |
2,464 | 203 | – | 2,667 | ||||||||||||||||
| Severance, acquisition and other costs |
6 | (10 | ) | |||||||||||||||||
| Depreciation and amortization |
(1,232 | ) | ||||||||||||||||||
| Finance costs |
||||||||||||||||||||
| Interest expense |
(373 | ) | ||||||||||||||||||
| Net return on post-employment benefit plans |
12 | 27 | ||||||||||||||||||
| Impairment of assets |
7 | – | ||||||||||||||||||
| Other expense |
8 | (129 | ) | |||||||||||||||||
| Income taxes |
9 | (243 | ) | |||||||||||||||||
| Net earnings |
707 | |||||||||||||||||||
| (1) | The chief operating decision maker uses primarily one measure of profit to make decisions and assess performance, being operating revenues less operating costs. |
51
Notes to consolidated financial statements
| For the three month period ended September 30, 2022 | Note |
Bell CTS |
Bell Media |
Intersegment eliminations |
BCE | |||||||||||||||
| Operating revenues |
||||||||||||||||||||
| External service revenues |
4,562 | 631 | – | 5,193 | ||||||||||||||||
| Inter-segment service revenues |
8 | 88 | (96 | ) | – | |||||||||||||||
| Operating service revenues |
4,570 | 719 | (96 | ) | 5,193 | |||||||||||||||
| External/Operating product revenues |
831 | – | – | 831 | ||||||||||||||||
| Total external revenues |
5,393 | 631 | – | 6,024 | ||||||||||||||||
| Total inter-segment revenues |
8 | 88 | (96 | ) | – | |||||||||||||||
| Total operating revenues |
5,401 | 719 | (96 | ) | 6,024 | |||||||||||||||
| Operating costs |
5 | (2,995 | ) | (537 | ) | 96 | (3,436 | ) | ||||||||||||
| Adjusted EBITDA (1) |
2,406 | 182 | – | 2,588 | ||||||||||||||||
| Severance, acquisition and other costs |
6 | (22 | ) | |||||||||||||||||
| Depreciation and amortization |
(1,181 | ) | ||||||||||||||||||
| Finance costs |
||||||||||||||||||||
| Interest expense |
(298 | ) | ||||||||||||||||||
| Net return on post-employment benefit plans |
12 | 13 | ||||||||||||||||||
| Impairment of assets |
7 | (21 | ) | |||||||||||||||||
| Other expense |
8 | (130 | ) | |||||||||||||||||
| Income taxes |
9 | (178 | ) | |||||||||||||||||
| Net earnings |
771 | |||||||||||||||||||
| (1) | The chief operating decision maker uses primarily one measure of profit to make decisions and assess performance, being operating revenues less operating costs. |
The following tables present financial information by segment for the nine month periods ended September 30, 2023 and 2022.
| For the nine month period ended September 30, 2023 | Note |
Bell CTS |
Bell Media |
Intersegment eliminations |
BCE | |||||||||||||||
| Operating revenues |
||||||||||||||||||||
| External service revenues |
13,767 | 2,039 | – | 15,806 | ||||||||||||||||
| Inter-segment service revenues |
21 | 256 | (277 | ) | – | |||||||||||||||
| Operating service revenues |
13,788 | 2,295 | (277 | ) | 15,806 | |||||||||||||||
| External/Operating product revenues |
2,394 | – | – | 2,394 | ||||||||||||||||
| Total external revenues |
16,161 | 2,039 | – | 18,200 | ||||||||||||||||
| Total inter-segment revenues |
21 | 256 | (277 | ) | – | |||||||||||||||
| Total operating revenues |
16,182 | 2,295 | (277 | ) | 18,200 | |||||||||||||||
| Operating costs |
5 | (8,881 | ) | (1,746 | ) | 277 | (10,350 | ) | ||||||||||||
| Adjusted EBITDA (1) |
7,301 | 549 | – | 7,850 | ||||||||||||||||
| Severance, acquisition and other costs |
6 | (159 | ) | |||||||||||||||||
| Depreciation and amortization |
(3,665 | ) | ||||||||||||||||||
| Finance costs |
||||||||||||||||||||
| Interest expense |
(1,076 | ) | ||||||||||||||||||
| Net return on post-employment benefit plans |
12 | 81 | ||||||||||||||||||
| Impairment of assets |
7 | (34 | ) | |||||||||||||||||
| Other expense |
8 | (319 | ) | |||||||||||||||||
| Income taxes |
9 | (786 | ) | |||||||||||||||||
| Net earnings |
1,892 | |||||||||||||||||||
| (1) | The chief operating decision maker uses primarily one measure of profit to make decisions and assess performance, being operating revenues less operating costs. |
| 52 | BCE INC. 2023 THIRD QUARTER SHAREHOLDER REPORT |
Notes to consolidated financial statements
| For the nine month period ended September 30, 2022 | Note |
Bell CTS |
Bell Media |
Intersegment eliminations |
BCE | |||||||||||||||
| Operating revenues |
||||||||||||||||||||
| External service revenues |
13,498 | 2,105 | – | 15,603 | ||||||||||||||||
| Inter-segment service revenues |
22 | 260 | (282 | ) | – | |||||||||||||||
| Operating service revenues |
13,520 | 2,365 | (282 | ) | 15,603 | |||||||||||||||
| External/Operating product revenues |
2,132 | – | – | 2,132 | ||||||||||||||||
| Total external revenues |
15,630 | 2,105 | – | 17,735 | ||||||||||||||||
| Total inter-segment revenues |
22 | 260 | (282 | ) | – | |||||||||||||||
| Total operating revenues |
15,652 | 2,365 | (282 | ) | 17,735 | |||||||||||||||
| Operating costs |
5 | (8,506 | ) | (1,749 | ) | 282 | (9,973 | ) | ||||||||||||
| Adjusted EBITDA (1) |
7,146 | 616 | – | 7,762 | ||||||||||||||||
| Severance, acquisition and other costs |
6 | (75 | ) | |||||||||||||||||
| Depreciation and amortization |
(3,531 | ) | ||||||||||||||||||
| Finance costs |
||||||||||||||||||||
| Interest expense |
(827 | ) | ||||||||||||||||||
| Net return on post-employment benefit plans |
12 | 38 | ||||||||||||||||||
| Impairment of assets |
7 | (129 | ) | |||||||||||||||||
| Other expense |
8 | (134 | ) | |||||||||||||||||
| Income taxes |
9 | (745 | ) | |||||||||||||||||
| Net earnings |
2,359 | |||||||||||||||||||
| (1) | The chief operating decision maker uses primarily one measure of profit to make decisions and assess performance, being operating revenues less operating costs. |
Revenues by services and products
| Three months | Nine months | |||||||||||||||
| For the period ended September 30 | 2023 | 2022 | 2023 | 2022 | ||||||||||||
| Services (1) |
||||||||||||||||
| Wireless |
1,828 | 1,759 | 5,317 | 5,086 | ||||||||||||
| Wireline data |
2,032 | 1,987 | 6,054 | 5,914 | ||||||||||||
| Wireline voice |
717 | 739 | 2,165 | 2,266 | ||||||||||||
| Media |
626 | 631 | 2,039 | 2,105 | ||||||||||||
| Other wireline services |
78 | 77 | 231 | 232 | ||||||||||||
| Total services |
5,281 | 5,193 | 15,806 | 15,603 | ||||||||||||
| Products (2) |
||||||||||||||||
| Wireless |
672 | 692 | 1,924 | 1,797 | ||||||||||||
| Wireline |
127 | 139 | 470 | 335 | ||||||||||||
| Total products |
799 | 831 | 2,394 | 2,132 | ||||||||||||
| Total operating revenues |
6,080 | 6,024 | 18,200 | 17,735 | ||||||||||||
| (1) | Our service revenues are generally recognized over time. |
| (2) | Our product revenues are generally recognized at a point in time. |
53
Notes to consolidated financial statements
| NOTE 4 |
Business acquisitions and disposition | |
Acquisition of FX Innovation
On June 1, 2023, Bell acquired FX Innovation, a Montréal-based provider of cloud-focused managed and professional services and workflow automation solutions for business clients, for cash consideration of $157 million ($156 million net of cash acquired), of which $12 million is payable within two years, and an estimated $6 million of additional cash consideration contingent on the achievement of certain performance objectives. This contingent consideration is expected to be settled by 2027 and the maximum amount payable is $7 million. The acquisition of FX Innovation aims to position Bell as a technology services leader for our enterprise customers. The results of FX Innovation are included in our Bell CTS segment.
The allocation of the purchase price includes provisional estimates and has been primarily allocated to goodwill.
The following table summarizes the fair value of the consideration paid and the fair value assigned to each major class of assets and liabilities.
| 2023 | ||||
| Cash consideration paid |
145 | |||
| Cash consideration payable |
12 | |||
| Contingent consideration |
6 | |||
| Total cost to be allocated |
163 | |||
| Trade and other receivables |
23 | |||
| Prepaid expenses |
4 | |||
| Finite-life intangibles |
4 | |||
| Other non-current assets |
3 | |||
| Trade payables and other liabilities |
(15 | ) | ||
| Contract liabilities |
(3 | ) | ||
| Debt due within one year |
(5 | ) | ||
| 11 | ||||
| Cash and cash equivalents |
1 | |||
| Fair value of net assets acquired |
12 | |||
| Goodwill (1) |
151 | |||
| (1) | Goodwill arises principally from expected synergies and future growth and is not deductible for tax purposes. Goodwill was allocated to our Bell CTS group of cash-generating units (CGUs). |
Operating revenues of $29 million from FX Innovation are included in the income statements from the date of acquisition. BCE’s consolidated operating revenues for the nine months ended September 30, 2023 would have been $18,243 million had the acquisition of FX Innovation occurred on January 1, 2023. The transaction did not have a significant impact on our net earnings for the nine months ended September 30, 2023.
Proposed acquisition of the Canadian out-of-home media business
of OUTFRONT Media Inc.
On October 23, 2023, Bell Media announced it plans to acquire the Canadian out-of-home media business of OUTFRONT Media Inc. The transaction is valued at $410 million, subject to certain adjustments, and is expected to close in the first half of 2024, subject to regulatory approval and other closing conditions. The acquisition of the Canadian out-of-home media business of OUTFRONT Media Inc. is expected to support Bell Media’s digital media strategy and to deliver impactful, multi-channel marketing solutions coast-to-coast. The results of the Canadian out-of-home media business of OUTFRONT Media Inc. will be included in our Bell Media segment.
Acquisition of EBOX and other related companies
In February 2022, Bell acquired EBOX and other related companies, which provide Internet, telephone and TV services to consumers and businesses in Québec and parts of Ontario, for cash consideration of $153 million ($139 million net of cash acquired). The acquisition of EBOX and other related companies is expected to accelerate growth in Bell’s residential and small business customers. The results of the acquired companies are included in our Bell CTS segment.
| 54 | BCE INC. 2023 THIRD QUARTER SHAREHOLDER REPORT |
Notes to consolidated financial statements
The following table summarizes the fair value of the consideration paid and the fair value assigned to each major class of assets and liabilities.
| Total | ||||
| Cash consideration |
153 | |||
| Total cost to be allocated |
153 | |||
| Other non-cash working capital |
5 | |||
| Property, plant and equipment |
5 | |||
| Indefinite-life intangible assets (1) |
17 | |||
| Finite-life intangible and other assets (2) |
15 | |||
| Trade payables and other liabilities |
(17 | ) | ||
| Contract liabilities |
(5 | ) | ||
| Deferred tax liabilities |
(9 | ) | ||
| 11 | ||||
| Cash and cash equivalents |
14 | |||
| Fair value of net assets acquired |
25 | |||
| Goodwill (3) |
128 | |||
| (1) | Consists of brand and digital assets. |
| (2) | Consists mainly of customer relationships. |
| (3) | Goodwill arises principally from expected synergies and future growth and is not deductible for tax purposes. Goodwill was allocated to our Bell CTS group of cash-generating units. |
Operating revenues of $29 million from EBOX are included in the income statements for the nine months ended September 30, 2022. The transaction did not have a significant impact on our net earnings for the nine months ended September 30, 2022.
Disposition of production studios
On May 3, 2023, we completed the previously announced sale of our 63% ownership in certain production studios, which were included in our Bell Media segment. We received net cash proceeds of $211 million and recorded a gain on investment of $79 million (before tax expense of $17 million). See Note 8, Other expense for additional details.
The results of operations of the production studios up to the date of disposition on May 3, 2023 did not have a significant impact on our revenue or net earnings in 2023.
The following table summarizes the carrying value of the assets and liabilities sold, which were previously classified as held for sale at March 31, 2023.
| 2023 | ||||
| Trade and other receivables |
1 | |||
| Prepaid expenses |
1 | |||
| Property, plant and equipment |
179 | |||
| Intangible assets |
4 | |||
| Goodwill |
76 | |||
| Total assets |
261 | |||
| Trade payables and other liabilities |
10 | |||
| Contract liabilities |
3 | |||
| Debt due within one year |
11 | |||
| Long-term debt |
82 | |||
| Deferred tax liabilities |
3 | |||
| Total liabilities |
109 | |||
|
Non-controlling interest |
23 | |||
| Net assets sold |
129 | |||
55
Notes to consolidated financial statements
| NOTE 5 |
Operating costs | |
| Three months | Nine months | |||||||||||||||||||
| For the period ended September 30 | Note | 2023 | 2022 | 2023 | 2022 | |||||||||||||||
| Labour costs |
||||||||||||||||||||
| Wages, salaries and related taxes and benefits |
(1,066 | ) | (1,067 | ) | (3,284 | ) | (3,192 | ) | ||||||||||||
| Post-employment benefit plans service cost (net of capitalized amounts) |
12 | (50 | ) | (61 | ) | (156 | ) | (189 | ) | |||||||||||
| Other labour costs (1) |
(264 | ) | (268 | ) | (788 | ) | (752 | ) | ||||||||||||
| Less: |
||||||||||||||||||||
| Capitalized labour |
299 | 296 | 926 | 839 | ||||||||||||||||
| Total labour costs |
(1,081 | ) | (1,100 | ) | (3,302 | ) | (3,294 | ) | ||||||||||||
| Cost of revenues (2) |
(1,842 | ) | (1,862 | ) | (5,632 | ) | (5,284 | ) | ||||||||||||
| Other operating costs (3) |
(490 | ) | (474 | ) | (1,416 | ) | (1,395 | ) | ||||||||||||
| Total operating costs |
(3,413 | ) | (3,436 | ) | (10,350 | ) | (9,973 | ) | ||||||||||||
| (1) | Other labour costs include contractor and outsourcing costs. |
| (2) | Cost of revenues includes costs of wireless devices and other equipment sold, network and content costs, and payments to other carriers. |
| (3) | Other operating costs include marketing, advertising and sales commission costs, bad debt expense, taxes other than income taxes, information technology costs, professional service fees and rent. |
| NOTE 6 |
Severance, acquisition and other costs | |
| Three months | Nine months | |||||||||||||||||||
| For the period ended September 30 | 2023 | 2022 | 2023 | 2022 | ||||||||||||||||
| Severance |
(12 | ) | (9 | ) | (121 | ) | (65 | ) | ||||||||||||
| Acquisition and other |
2 | (13 | ) | (38 | ) | (10 | ) | |||||||||||||
| Total severance, acquisition and other costs |
(10 | ) | (22 | ) | (159 | ) | (75 | ) | ||||||||||||
Severance costs
Severance costs consist of charges related to involuntary and voluntary employee terminations.
Acquisition and other costs
Acquisition and other costs consist of transaction costs, such as legal and financial advisory fees, related to completed or potential acquisitions, employee severance costs related to the purchase of a business, the costs to integrate acquired companies into our operations, costs relating to litigation and regulatory decisions, when they are significant, and other costs.
| NOTE 7 |
Impairment of assets | |
2023
Impairment charges for the nine months ended September 30, 2023 of $34 million relate mainly to right-of-use assets for certain office spaces we ceased using as part of our real estate optimization strategy as a result of our hybrid work policy.
2022
Impairment charges for the three and nine months ended September 30, 2022 of $21 million and $129 million, respectively, relate mainly to right-of-use assets for certain office spaces we ceased using as part of our real estate optimization strategy as a result of our hybrid work policy.
| 56 | BCE INC. 2023 THIRD QUARTER SHAREHOLDER REPORT |
Notes to consolidated financial statements
| NOTE 8 |
Other expense | |
| Three months | Nine months | |||||||||||||||||||
| For the period ended September 30 | 2023 | 2022 | 2023 | 2022 | ||||||||||||||||
| Net mark-to-market losses on derivatives used to economically hedge equity settled share-based compensation plans |
(128 | ) | (74 | ) | (109 | ) | (80 | ) | ||||||||||||
| (Losses) gains on retirements and disposals of property, plant and equipment and intangible assets |
(21 | ) | (5 | ) | 7 | (9 | ) | |||||||||||||
| Equity (losses) income from investments in associates and joint ventures |
||||||||||||||||||||
| Loss on investment |
– | – | (377 | ) | (42 | ) | ||||||||||||||
| Operations |
(14 | ) | (38 | ) | 12 | (35 | ) | |||||||||||||
| (Losses) gains on investments |
(1 | ) | – | 78 | 53 | |||||||||||||||
| Early debt redemption costs |
– | – | (1 | ) | (18 | ) | ||||||||||||||
| Interest income |
15 | 7 | 42 | 13 | ||||||||||||||||
| Other |
20 | (20 | ) | 29 | (16 | ) | ||||||||||||||
| Total other expense |
(129 | ) | (130 | ) | (319 | ) | (134 | ) | ||||||||||||
Equity (losses) income from investments in associates and joint ventures
In Q2 2023, we recorded a loss on investment of $377 million, related to equity losses on our share of an obligation to repurchase at fair value the minority interest in one of BCE’s joint ventures. The obligation is marked to market each reporting period and the gain or loss on investment is recorded as equity income or losses from investments in associates and joint ventures.
We recorded a loss on investment of $42 million for the nine months ended September 30, 2022, related to equity losses on our share of an obligation to repurchase at fair value the minority interest in one of BCE’s joint ventures. The obligation is marked to market each reporting period and the gain or loss on investment is recorded as equity income or losses from investments in associates and joint ventures.
(Losses) gains on investments
On May 3, 2023, we completed the previously announced sale of our 63% ownership in certain production studios. We recorded net cash proceeds of $211 million and a gain on investment of $79 million. See Note 4, Business acquisitions and disposition for additional details.
In Q2 2022, we recorded a gain on investment of $14 million related to an obligation to repurchase at fair value the minority interest in one of our subsidiaries.
On March 1, 2022, we completed the sale of our wholly-owned subsidiary 6362222 Canada Inc. (Createch), a consulting business that specializes in the optimization of business processes and implementation of technological solutions, which was included in our Bell CTS segment. We recorded cash proceeds of $54 million and a gain on sale of $39 million (before tax expense of $2 million).
Gains on disposals of property, plant and equipment
In Q1 2023, we sold land for total proceeds of $54 million and recorded a gain of $53 million as part of our real estate optimization strategy.
| NOTE 9 |
Income taxes | |
During Q3 2022, various uncertain tax positions were favourably resolved, which resulted in the reversal of tax liabilities.
| NOTE 10 |
Earnings per share | |
The following table shows the components used in the calculation of basic and diluted net earnings per common share for earnings attributable to common shareholders.
| Three months | Nine months | |||||||||||||||||||
| For the period ended September 30 | 2023 | 2022 | 2023 | 2022 | ||||||||||||||||
| Net earnings attributable to common shareholders – basic |
640 | 715 | 1,694 | 2,188 | ||||||||||||||||
| Dividends declared per common share (in dollars) |
0.9675 | 0.9200 | 2.9025 | 2.7600 | ||||||||||||||||
| Weighted average number of common shares outstanding (in millions) |
||||||||||||||||||||
| Weighted average number of common shares outstanding – basic |
912.3 | 911.9 | 912.2 | 911.3 | ||||||||||||||||
| Assumed exercise of stock options (1) |
– | 0.4 | 0.1 | 0.6 | ||||||||||||||||
| Weighted average number of common shares outstanding – diluted (in millions) |
912.3 | 912.3 | 912.3 | 911.9 | ||||||||||||||||
| (1) | The calculation of the assumed exercise of stock options includes the effect of the average unrecognized future compensation cost of dilutive options. It excludes options for which the exercise price is higher than the average market value of a BCE common share. The number of excluded options was 7,429,588 for the third quarter of 2023 and 3,165,118 for the first nine months of 2023, compared to 3,244,990 for the third quarter of 2022 and nil for the first nine months of 2022. |
57
Notes to consolidated financial statements
| NOTE 11 |
Debt | |
On August 11, 2023, Bell Canada issued, under its 1997 trust indenture, 5.15% Series M-60 medium-term note (MTN) debentures, with a principal amount of $600 million, which mature on November 14, 2028. Additionally, on the same date, Bell Canada issued under its 1997 trust indenture, 5.60% Series M-61 MTN debentures, with a principal amount of $400 million, which mature on August 11, 2053.
On May 11, 2023, Bell Canada issued, under its 2016 trust indenture, 5.100% Series US-8 Notes, with a principal amount of $850 million in U.S. dollars ($1,138 million in Canadian dollars), which mature on May 11, 2033. The Series US-8 Notes have been hedged for foreign currency fluctuations with cross currency interest rate swaps. See Note 13, Financial assets and liabilities, for additional details.
On February 9, 2023, Bell Canada issued, under its 1997 trust indenture, 4.55% Series M-58 MTN debentures, with a principal amount of $1,050 million, which mature on February 9, 2030. Additionally, on the same date, Bell Canada issued, under its 1997 trust indenture, 5.15% Series M-59 MTN debentures, with a principal amount of $450 million, which mature on February 9, 2053.
The Series M-58, M-59, M-60 and M-61 MTN debentures and the Series US-8 Notes are fully and unconditionally guaranteed by BCE.
In Q2 2023, Bell Canada reclassified its 4.00% Series 10 debentures with a principal amount of $225 million, which mature on May 27, 2024, from long-term debt to debt due within one year.
In Q1 2023, Bell Canada reclassified its 2.70% Series M-44 MTN debentures with a total principal amount of $1 billion and its 0.75% US-3 Notes with a principal amount of $600 million in U.S. dollars ($777 million in Canadian dollars), which mature on February 27, 2024 and March 17, 2024, respectively, from long-term debt to debt due within one year.
Credit facilities
In Q3 2023, Bell Mobility Inc. entered into a $600 million U.S. dollars uncommitted trade loan agreement to finance certain purchase obligations. Loan requests may be made until April 30, 2024, with each loan having a term of up to 24 months. As at September 30, 2023, $120 million U.S. dollars ($162 million in Canadian dollars) had been drawn under this loan agreement. The loan agreement has been hedged for foreign currency fluctuations. See Note 13, Financial assets and liabilities, for additional details.
| NOTE 12 |
Post-employment benefit plans | |
Post-employment benefit plans cost
We provide pension and other benefits for most of our employees. These include defined benefit (DB) pension plans, defined contribution (DC) pension plans and other post-employment benefits (OPEBs).
Components of post-employment benefit plans service cost
| Three months | Nine months | |||||||||||||||
| For the period ended September 30 | 2023 | 2022 | 2023 | 2022 | ||||||||||||
| DB pension |
(32 | ) | (48 | ) | (96 | ) | (145 | ) | ||||||||
| DC pension |
(33 | ) | (27 | ) | (101 | ) | (91 | ) | ||||||||
| OPEBs |
(1 | ) | (1 | ) | (1 | ) | (1 | ) | ||||||||
| Less: |
||||||||||||||||
| Capitalized benefit plans cost |
16 | 15 | 42 | 48 | ||||||||||||
| Total post-employment benefit plans service cost |
(50 | ) | (61 | ) | (156 | ) | (189 | ) | ||||||||
Components of post-employment benefit plans financing income
| Three months | Nine months | |||||||||||||||
| For the period ended September 30 | 2023 | 2022 | 2023 | 2022 | ||||||||||||
| DB pension |
38 | 21 | 112 | 63 | ||||||||||||
| OPEBs |
(11 | ) | (8 | ) | (31 | ) | (25 | ) | ||||||||
| Total net return on post-employment benefit plans |
27 | 13 | 81 | 38 | ||||||||||||
| 58 | BCE INC. 2023 THIRD QUARTER SHAREHOLDER REPORT |
Notes to consolidated financial statements
| NOTE 13 |
Financial assets and liabilities | |
Fair value
The following table provides the fair value details of financial instruments measured at amortized cost in the consolidated statements of financial position.
| September 30, 2023 | December 31, 2022 | |||||||||||||||||||
| Classification | Fair value methodology |
Carrying value |
Fair value |
Carrying value |
Fair value |
|||||||||||||||
| Debt securities and other debt | Debt due within one year and long-term debt | Quoted market price of debt | 28,180 | 25,142 | 25,061 | 23,026 | ||||||||||||||
The following table provides the fair value details of financial instruments measured at fair value in the consolidated statements of financial position.
| Fair value | ||||||||||||||||||
| Classification | |
Carrying value of asset (liability) |
|
|
Quoted prices in active markets for identical assets (level 1) |
|
|
Observable market data (level 2) |
(1) |
|
Non-observable market inputs (level 3) |
(2) | ||||||
| September 30, 2023 |
||||||||||||||||||
| Publicly-traded and privately-held investments (3) | Other non-current assets | 227 | 8 | – | 219 | |||||||||||||
| Derivative financial instruments |
Other current assets, trade payables and other liabilities, other non-current assets and liabilities | (205 | ) | – | (205 | ) | – | |||||||||||
| Other |
Other non-current assets and liabilities | 121 | – | 197 | (76 | ) | ||||||||||||
| December 31, 2022 |
||||||||||||||||||
| Publicly-traded and privately-held investments (3) | Other non-current assets | 215 | 9 | – | 206 | |||||||||||||
| Derivative financial instruments |
Other current assets, trade payables and other liabilities, other non-current assets and liabilities | 72 | – | 72 | – | |||||||||||||
| Maple Leaf Sports & Entertainment Ltd. (MLSE) financial liability (4) | Trade payables and other liabilities | (149 | ) | – | – | (149 | ) | |||||||||||
| Other |
Other non-current assets and liabilities | 108 | – | 184 | (76 | ) | ||||||||||||
| (1) | Observable market data such as equity prices, interest rates, swap rate curves and foreign currency exchange rates. |
| (2) | Non-observable market inputs such as discounted cash flows and earnings multiples. A reasonable change in our assumptions would not result in a significant increase (decrease) to our level 3 financial instruments. |
| (3) | Unrealized gains and losses are recorded in Other comprehensive income (loss) in the statements of comprehensive income and are reclassified from Accumulated other comprehensive loss to Deficit in the statements of financial position when realized. |
| (4) | Represented BCE’s obligation to repurchase the BCE Master Trust Fund’s (Master Trust Fund) 9% interest in MLSE at a price not less than an agreed minimum price. In January 2023, BCE repurchased the interest held by the Master Trust Fund, a trust fund that holds pension fund investments serving the pension obligations of the BCE group pension plan participants, in MLSE for a cash consideration of $149 million. |
Market risk
Currency exposures
In Q3 2023, we entered into cross currency interest rate swaps with a notional amount of $120 million in U.S. dollars ($162 million in Canadian dollars) to hedge the U.S. currency exposure of outstanding loans under our uncommitted trade loan agreement maturing in 2025. The fair value of these cross currency swaps at September 30, 2023 was nil. See Note 11, Debt, for additional details.
In Q2 2023, we entered into cross currency interest rate swaps with a notional amount of $850 million in U.S. dollars ($1,138 million in Canadian dollars) to hedge the U.S. currency exposure of our US-8 Notes maturing in 2033. The fair value of these cross currency interest rate swaps at September 30, 2023 was a net asset of $18 million recognized in Other current assets, Other non-current assets and Trade payables and other liabilities in the statements of financial position. See Note 11, Debt, for additional details.
A 10% depreciation (appreciation) in the value of the Canadian dollar relative to the U.S. dollar would result in a gain of $11 million (loss of $63 million) recognized in net earnings at September 30, 2023 and a gain (loss) of $104 million recognized in Other comprehensive income (loss) at September 30, 2023, with all other variables held constant.
A 10% depreciation (appreciation) in the value of the Canadian dollar relative to the Philippine peso would result in a gain (loss) of $6 million recognized in Other comprehensive income (loss) at September 30, 2023, with all other variables held constant.
59
Notes to consolidated financial statements
The following table provides further details on our outstanding foreign currency forward contracts and options at September 30, 2023.
| Type of hedge |
Buy currency |
Amount to receive |
Sell currency |
Amount to pay |
Maturity | Hedged item | ||||||||||||||||||
| Cash flow (1) |
USD | 1,192 | CAD | 1,608 | 2023 | Loans | ||||||||||||||||||
| Cash flow |
USD | 270 | CAD | 367 | 2023 | Commercial paper | ||||||||||||||||||
| Cash flow |
USD | 232 | CAD | 288 | 2023 | Anticipated purchases | ||||||||||||||||||
| Cash flow |
PHP | 778 | CAD | 18 | 2023 | Anticipated purchases | ||||||||||||||||||
| Cash flow |
USD | 824 | CAD | 1,046 | 2024 | Anticipated purchases | ||||||||||||||||||
| Cash flow |
PHP | 2,885 | CAD | 69 | 2024 | Anticipated purchases | ||||||||||||||||||
| Cash flow |
USD | 88 | CAD | 115 | 2025 | Anticipated purchases | ||||||||||||||||||
| Economic |
USD | 39 | CAD | 49 | 2023 | Anticipated purchases | ||||||||||||||||||
| Economic – call options |
CAD | 56 | USD | 39 | 2023 | Anticipated purchases | ||||||||||||||||||
| Economic – put options |
USD | 84 | CAD | 109 | 2023 | Anticipated purchases | ||||||||||||||||||
| Economic – call options |
USD | 60 | CAD | 80 | 2023 | Anticipated purchases | ||||||||||||||||||
| Economic |
USD | 130 | CAD | 171 | 2024 | Anticipated purchases | ||||||||||||||||||
| Economic – options (2) |
USD | 120 | CAD | 153 | 2024 | Anticipated purchases | ||||||||||||||||||
| Economic – call options |
USD | 244 | CAD | 327 | 2024 | Anticipated purchases | ||||||||||||||||||
| Economic – call options |
CAD | 225 | USD | 156 | 2024 | Anticipated purchases | ||||||||||||||||||
| Economic – put options |
USD | 519 | CAD | 675 | 2024 | Anticipated purchases | ||||||||||||||||||
| Economic – options (2) |
USD | 60 | CAD | 78 | 2025 | Anticipated purchases | ||||||||||||||||||
| Economic – call options |
USD | 540 | CAD | 694 | 2025 | Anticipated purchases | ||||||||||||||||||
| Economic – put options |
USD | 360 | CAD | 461 | 2025 | Anticipated purchases | ||||||||||||||||||
| (1) | Forward contracts to hedge loans secured by receivables under our securitization program. |
| (2) | Foreign currency options with a leverage provision and a profit cap limitation. |
Interest rate exposures
In 2023, we sold interest rate swaptions with a notional amount of $125 million maturing in Q4 2023, for $1 million, to hedge economically the fair value of our Series M-57 MTN debentures. The fair value of these swaptions at September 30, 2023 was a liability of $4 million recognized in Trade payables and other liabilities in the statements of financial position. A loss of $3 million for the three and nine months ended September 30, 2023 relating to these interest rate swaptions is recognized in Other expense in the income statements.
In 2023, we entered into interest rate swaps with a notional amount of $250 million to hedge the fair value of our Series M-57 MTN debentures maturing in 2032. The fair value of these interest rate swaps at September 30, 2023 was a liability of $11 million recognized in Trade payables and other liabilities and Other non-current liabilities in the statements of financial position.
In Q3 2023, we entered into forward starting interest rate swaps with a notional amount of $400 million to hedge the fair value of our series M-61 MTN debentures maturing in 2053. The fair value of these interest rate swaps at September 30, 2023 was a liability of $16 million recognized in Other non-current liabilities in the statements of financial position. See Note 11, Debt, for additional details.
In Q3 2023, we entered into an amortizing interest rate swap with an initial notional amount of $197 million, to hedge the interest rate exposure on other debt maturing in 2028. The fair value of the amortizing interest rate swap at September 30, 2023 was a net asset of $1 million recognized in Other current assets and Other non-current liabilities in the statements of financial position.
In Q2 2023, we sold interest rate swaptions with a notional amount of $375 million, for $3 million, to hedge economically the fair value of our Series M-52 MTN debentures. These swaptions were exercised in Q2 2023, giving rise to a loss of $1 million recognized in Other expense in the income statements. The resulting interest rate swaps with a notional amount of $375 million hedge the fair value of our Series M-52 MTN debentures maturing in 2030. The fair value of these interest rate swaps at September 30, 2023 was a liability of $20 million recognized in Trade payables and other liabilities and Other non-current liabilities in the statements of financial position.
In Q1 2023, we sold interest rate swaptions with a notional amount of $250 million, for $2 million, to hedge economically the fair value of our Series M-53 MTN debentures maturing in 2027. In Q1 2023, we also sold interest rate swaptions with a notional amount of $425 million, for $2 million, to hedge economically the floating interest rate exposure relating to our Series M-53 MTN debentures. These swaptions matured unexercised in Q2 2023. A gain of nil and $4 million for the three and nine months ended September 30, 2023, respectively, relating to these interest rate swaptions is recognized in Other expense in the income statements.
In 2022, we entered into interest rate swaps with a notional amount of $500 million to hedge the fair value of our Series M-53 MTN debentures maturing in 2027. The fair value of these interest rate swaps at September 30, 2023 and December 31, 2022 is a liability of $30 million and $14 million, respectively, recognized in Trade payables and other liabilities and Other non-current liabilities in the statements of financial position.
In 2022, we entered into cross currency basis rate swaps maturing in 2023 with a notional amount of $638 million Canadian dollars to hedge economically the basis rate exposure on future debt issuances. In 2023, the maturity date of $445 million of these cross currency basis rate swaps was extended to 2024 resulting in an increase in their notional amount to $644 million at September 30, 2023. The fair value of these cross currency basis rate swaps at September 30, 2023 and December 31, 2022 was a liability of $20 million and $33 million, respectively, recognized in Trade payables and other liabilities and Other non-current liabilities in the statements of financial position. A gain of $7 million and a gain of $13 million for the three and nine months ended September 30, 2023, respectively, relating to these basis rate swaps is recognized in Other expense in the income statements.
We use leveraged interest rate options to hedge economically the dividend rate resets on $582 million of our preferred shares which had varying reset dates in 2021 for the periods ending in 2026. The fair value of these leveraged interest rate options at September 30, 2023 and December 31, 2022 was nil and a liability of $1 million, respectively, recognized in Trade payables and other liabilities and Other non-current liabilities in the statements of
| 60 | BCE INC. 2023 THIRD QUARTER SHAREHOLDER REPORT |
Notes to consolidated financial statements
financial position. A gain of nil and $1 million for the three and nine months ended September 30, 2023, respectively, relating to these leveraged interest rate options is recognized in Other expense in the income statements.
A 1% increase (decrease) in interest rates would result in a loss of $30 million (gain of $27 million) recognized in net earnings at September 30, 2023, with all other variables held constant.
A 0.1% increase (decrease) in cross currency basis swap rates would result in a gain (loss) of $10 million recognized in net earnings at September 30, 2023, with all other variables held constant.
Equity price exposures
We use equity forward contracts on BCE’s common shares to hedge economically the cash flow exposure related to the settlement of equity settled share-based compensation plans. The fair value of our equity forward contracts at September 30, 2023 and December 31, 2022 was a net liability of $167 million and $48 million, respectively, recognized in Other current assets, Trade payables and other liabilities, Other non-current assets and Other non-current liabilities in the statements of financial position. A loss of $128 million and $109 million for the three and nine months ended September 30, 2023, respectively, relating to these equity forward contracts is recognized in Other expense in the income statements.
A 5% increase (decrease) in the market price of BCE’s common shares would result in a gain (loss) of $28 million recognized in net earnings at September 30, 2023, with all other variables held constant.
| NOTE 14 |
Share capital | |
Conversion and dividend rate reset of BCE First Preferred Shares
Effective on September 30, 2023, the annual fixed dividend rate on BCE’s Cumulative Redeemable First Preferred Shares, Series AQ, was reset for the next five years at 6.538% from 4.812%.
On March 1, 2023, 3,635,351 of BCE’s fixed rate Cumulative Redeemable First Preferred Shares, Series AC (Series AC Preferred Shares) were converted, on a one-for-one basis, into floating-rate Cumulative Redeemable First Preferred Shares, Series AD (Series AD Preferred Shares). In addition, on March 1, 2023, 351,634 of BCE’s Series AD Preferred Shares were converted, on a one-for-one basis, into Series AC Preferred Shares.
The annual fixed dividend rate on BCE’s Series AC Preferred Shares was reset for the next five years, effective March 1, 2023, at 5.08%. The Series AD Preferred Shares will continue to pay a monthly cash dividend.
Dividends are paid as and when declared by the board of directors of BCE.
Normal course issuer bid for BCE First Preferred Shares
For the three and nine months ended September 30, 2023, BCE repurchased and canceled 1,574,700 and 5,135,650 First Preferred Shares with a stated capital of $39 million and $128 million for a total cost of $27 million and $90 million, respectively. The remaining $12 million and $38 million were recorded to contributed surplus for the three and nine months ended September 30, 2023, respectively.
Subsequent to quarter end, BCE repurchased and canceled 1,010,586 First Preferred Shares with a stated capital of $26 million for a total cost of $16 million. The remaining $10 million was recorded to contributed surplus.
On November 1, 2023, BCE’s Board of Directors authorized the company to renew its normal course issuer bid (NCIB) to purchase for cancellation up to 10% of the public float of each series of BCE’s outstanding First Preferred Shares that are listed on the Toronto Stock Exchange. The NCIB will extend from November 9, 2023 to November 8, 2024, or an earlier date should BCE complete its purchases under the NCIB.
Redemption of BCE’s Series AO First Preferred Shares
In Q1 2022, BCE redeemed its 4,600,000 issued and outstanding Cumulative Redeemable First Preferred Shares, Series AO (Series AO Preferred Shares) with a stated capital of $118 million for a total cost of $115 million. The remaining $3 million was recorded to contributed surplus.
61
Notes to consolidated financial statements
| NOTE 15 |
Share-based payments | |
The following share-based payment amounts are included in the income statements as operating costs.
| Three months | Nine months | |||||||||||||||
| For the period ended September 30 | 2023 | 2022 | 2023 | 2022 | ||||||||||||
| Employee savings plan |
(7 | ) | (8 | ) | (22 | ) | (22 | ) | ||||||||
| Restricted share units (RSUs) and performance share units (PSUs) |
(10 | ) | (13 | ) | (54 | ) | (59 | ) | ||||||||
| Other (1) |
(1 | ) | – | (3 | ) | (3 | ) | |||||||||
| Total share-based payments |
(18 | ) | (21 | ) | (79 | ) | (84 | ) | ||||||||
| (1) | Includes deferred share units and stock options. |
The following tables summarize the change in outstanding RSUs/PSUs and stock options for the period ended September 30, 2023.
RSUs/PSUs
|
Number of RSUs/PSUs |
||||
| Outstanding, January 1, 2023 |
3,124,187 | |||
| Granted |
1,067,017 | |||
| Dividends credited |
151,201 | |||
| Settled |
(940,968 | ) | ||
| Forfeited |
(78,882 | ) | ||
| Outstanding, September 30, 2023 |
3,322,555 | |||
Stock options
| Number of options |
Weighted average exercise price ($) |
|||||||
| Outstanding, January 1, 2023 |
7,802,108 | 61 | ||||||
| Exercised (1) |
(306,139 | ) | 60 | |||||
| Forfeited or expired |
(11,408 | ) | 63 | |||||
| Outstanding and exercisable, September 30, 2023 |
7,484,561 | 61 | ||||||
| (1) | The weighted average market share price for options exercised during the nine months ended September 30, 2023 was $63. |
| 62 | BCE INC. 2023 THIRD QUARTER SHAREHOLDER REPORT |
Exhibit 99.3

| ||
| Q3 | Supplementary Financial Information
Third Quarter 2023 | |
| BCE Investor Relations |
| |
| Thane Fotopoulos
514-870-4619 thane.fotopoulos@bell.ca |
BCE (1)
Consolidated Operational Data
| (In millions of Canadian dollars, except share amounts) (unaudited) | Q3 2023 |
Q3 2022 |
$ change | % change | YTD 2023 |
YTD 2022 |
$ change | % change | ||||||||||||||||||||||||||||
| Operating revenues |
||||||||||||||||||||||||||||||||||||
| Service |
5,281 | 5,193 | 88 | 1.7% | 15,806 | 15,603 | 203 | 1.3% | ||||||||||||||||||||||||||||
| Product |
799 | 831 | (32 | ) | (3.9%) | 2,394 | 2,132 | 262 | 12.3% | |||||||||||||||||||||||||||
| Total operating revenues |
6,080 | 6,024 | 56 | 0.9% | 18,200 | 17,735 | 465 | 2.6% | ||||||||||||||||||||||||||||
| Operating costs |
(3,413 | ) | (3,436 | ) | 23 | 0.7% | (10,350 | ) | (9,973 | ) | (377 | ) | (3.8%) | |||||||||||||||||||||||
| Adjusted EBITDA (A) |
2,667 | 2,588 | 79 | 3.1% | 7,850 | 7,762 | 88 | 1.1% | ||||||||||||||||||||||||||||
| Adjusted EBITDA margin (B)(3) |
43.9% | 43.0% | 0.9 pts | 43.1% | 43.8% | (0.7) pts | ||||||||||||||||||||||||||||||
| Severance, acquisition and other costs |
(10 | ) | (22 | ) | 12 | 54.5% | (159 | ) | (75 | ) | (84 | ) | n.m. | |||||||||||||||||||||||
| Depreciation |
(937 | ) | (914 | ) | (23 | ) | (2.5%) | (2,791 | ) | (2,738 | ) | (53 | ) | (1.9%) | ||||||||||||||||||||||
| Amortization |
(295 | ) | (267 | ) | (28 | ) | (10.5%) | (874 | ) | (793 | ) | (81 | ) | (10.2%) | ||||||||||||||||||||||
| Finance costs |
||||||||||||||||||||||||||||||||||||
| Interest expense |
(373 | ) | (298 | ) | (75 | ) | (25.2%) | (1,076 | ) | (827 | ) | (249 | ) | (30.1%) | ||||||||||||||||||||||
| Net return on post-employment benefit plans |
27 | 13 | 14 | n.m. | 81 | 38 | 43 | n.m. | ||||||||||||||||||||||||||||
| Impairment of assets |
- | (21 | ) | 21 | 100.0% | (34 | ) | (129 | ) | 95 | 73.6% | |||||||||||||||||||||||||
| Other expense |
(129 | ) | (130 | ) | 1 | 0.8% | (319 | ) | (134 | ) | (185 | ) | n.m. | |||||||||||||||||||||||
| Income taxes |
(243 | ) | (178 | ) | (65 | ) | (36.5%) | (786 | ) | (745 | ) | (41 | ) | (5.5%) | ||||||||||||||||||||||
| Net earnings |
707 | 771 | (64 | ) | (8.3%) | 1,892 | 2,359 | (467 | ) | (19.8%) | ||||||||||||||||||||||||||
| Net earnings attributable to: |
||||||||||||||||||||||||||||||||||||
| Common shareholders |
640 | 715 | (75 | ) | (10.5%) | 1,694 | 2,188 | (494 | ) | (22.6%) | ||||||||||||||||||||||||||
| Preferred shareholders |
47 | 39 | 8 | 20.5% | 139 | 108 | 31 | 28.7% | ||||||||||||||||||||||||||||
| Non-controlling interest |
20 | 17 | 3 | 17.6% | 59 | 63 | (4 | ) | (6.3%) | |||||||||||||||||||||||||||
| Net earnings |
707 | 771 | (64 | ) | (8.3%) | 1,892 | 2,359 | (467 | ) | (19.8%) | ||||||||||||||||||||||||||
| Net earnings per common share - basic and diluted |
$ | 0.70 | $ | 0.78 | $ | (0.08 | ) | (10.3%) | $ | 1.86 | $ | 2.40 | $ | (0.54 | ) | (22.5%) | ||||||||||||||||||||
| Dividends per common share |
$ | 0.9675 | $ | 0.9200 | $ | 0.0475 | 5.2% | $ | 2.9025 | $ | 2.7600 | $ | 0.1425 | 5.2% | ||||||||||||||||||||||
| Weighted average number of common shares outstanding - basic (millions) |
912.3 | 911.9 | 912.2 | 911.3 | ||||||||||||||||||||||||||||||||
| Weighted average number of common shares outstanding - diluted (millions) |
912.3 | 912.3 | 912.3 | 911.9 | ||||||||||||||||||||||||||||||||
| Number of common shares outstanding (millions) |
912.3 | 911.9 | 912.3 | 911.9 | ||||||||||||||||||||||||||||||||
| Adjusted net earnings and adjusted EPS |
||||||||||||||||||||||||||||||||||||
| Net earnings attributable to common shareholders |
640 | 715 | (75 | ) | (10.5%) | 1,694 | 2,188 | (494 | ) | (22.6%) | ||||||||||||||||||||||||||
| Reconciling items: |
||||||||||||||||||||||||||||||||||||
| Severance, acquisition and other costs |
10 | 22 | (12 | ) | (54.5%) | 159 | 75 | 84 | n.m. | |||||||||||||||||||||||||||
| Net mark-to-market losses on derivatives used to economically hedge equity settled share-based compensation plans |
128 | 74 | 54 | 73.0% | 109 | 80 | 29 | 36.3% | ||||||||||||||||||||||||||||
| Net equity losses on investment in associates and joint ventures |
- | - | - | - | 377 | 42 | 335 | n.m. | ||||||||||||||||||||||||||||
| Net losses (gains) on investments |
1 | - | 1 | n.m. | (78 | ) | (53 | ) | (25 | ) | (47.2%) | |||||||||||||||||||||||||
| Early debt redemption costs |
- | - | - | - | 1 | 18 | (17 | ) | (94.4%) | |||||||||||||||||||||||||||
| Impairment of assets |
- | 21 | (21 | ) | (100.0%) | 34 | 129 | (95 | ) | (73.6%) | ||||||||||||||||||||||||||
| Income taxes for the above reconciling items |
(38 | ) | (31 | ) | (7 | ) | (22.6%) | (61 | ) | (80 | ) | 19 | 23.8% | |||||||||||||||||||||||
| Non-controlling interest (NCI) for the above reconciling items |
- | - | - | - | - | 4 | (4 | ) | (100.0%) | |||||||||||||||||||||||||||
| Adjusted net earnings (A) |
741 | 801 | (60 | ) | (7.5%) | 2,235 | 2,403 | (168 | ) | (7.0%) | ||||||||||||||||||||||||||
| Adjusted EPS (A) |
$ | 0.81 | $ | 0.88 | $ | (0.07 | ) | (8.0%) | $ | 2.45 | $ | 2.64 | $ | (0.19 | ) | (7.2%) | ||||||||||||||||||||
n.m. : not meaningful
| (A) | Adjusted EBITDA is a total of segments measure, adjusted net earnings is a non-GAAP financial measure and adjusted EPS is a non-GAAP ratio. Refer to note 2.3, Total of segments measures, note 2.1, Non-GAAP financial measures and note 2.2, Non-GAAP ratios in the Accompanying Notes to this report for more information on these measures. |
| (B) | Adjusted EBITDA margin is defined as adjusted EBITDA divided by operating revenues. |
BCE Supplementary Financial Information - Third Quarter 2023 Page 2
BCE
Consolidated Operational Data - Historical Trend
| (In millions of Canadian dollars, except share amounts) (unaudited) | YTD 2023 |
Q3 23 | Q2 23 | Q1 23 | TOTAL 2022 |
Q4 22 | Q3 22 | Q2 22 | Q1 22 | |||||||||||||||||||||||||||||||||
| Operating revenues |
||||||||||||||||||||||||||||||||||||||||||
| Service |
15,806 | 5,281 | 5,303 | 5,222 | 20,956 | 5,353 | 5,193 | 5,233 | 5,177 | |||||||||||||||||||||||||||||||||
| Product |
2,394 | 799 | 763 | 832 | 3,218 | 1,086 | 831 | 628 | 673 | |||||||||||||||||||||||||||||||||
| Total operating revenues |
18,200 | 6,080 | 6,066 | 6,054 | 24,174 | 6,439 | 6,024 | 5,861 | 5,850 | |||||||||||||||||||||||||||||||||
| Operating costs |
(10,350 | ) | (3,413 | ) | (3,421 | ) | (3,516 | ) | (13,975 | ) | (4,002 | ) | (3,436 | ) | (3,271 | ) | (3,266 | ) | ||||||||||||||||||||||||
| Adjusted EBITDA |
7,850 | 2,667 | 2,645 | 2,538 | 10,199 | 2,437 | 2,588 | 2,590 | 2,584 | |||||||||||||||||||||||||||||||||
| Adjusted EBITDA margin |
43.1% | 43.9% | 43.6% | 41.9% | 42.2% | 37.8% | 43.0% | 44.2% | 44.2% | |||||||||||||||||||||||||||||||||
| Severance, acquisition and other costs |
(159 | ) | (10 | ) | (100 | ) | (49 | ) | (94 | ) | (19 | ) | (22 | ) | (40 | ) | (13 | ) | ||||||||||||||||||||||||
| Depreciation |
(2,791 | ) | (937 | ) | (936 | ) | (918 | ) | (3,660 | ) | (922 | ) | (914 | ) | (933 | ) | (891 | ) | ||||||||||||||||||||||||
| Amortization |
(874 | ) | (295 | ) | (296 | ) | (283 | ) | (1,063 | ) | (270 | ) | (267 | ) | (266 | ) | (260 | ) | ||||||||||||||||||||||||
| Finance costs |
||||||||||||||||||||||||||||||||||||||||||
| Interest expense |
(1,076 | ) | (373 | ) | (359 | ) | (344 | ) | (1,146 | ) | (319 | ) | (298 | ) | (269 | ) | (260 | ) | ||||||||||||||||||||||||
| Net return on post-employment benefit plans |
81 | 27 | 27 | 27 | 51 | 13 | 13 | 7 | 18 | |||||||||||||||||||||||||||||||||
| Impairment of assets |
(34 | ) | - | - | (34 | ) | (279 | ) | (150 | ) | (21 | ) | (106 | ) | (2 | ) | ||||||||||||||||||||||||||
| Other (expense) income |
(319 | ) | (129 | ) | (311 | ) | 121 | (115 | ) | 19 | (130 | ) | (97 | ) | 93 | |||||||||||||||||||||||||||
| Income taxes |
(786 | ) | (243 | ) | (273 | ) | (270 | ) | (967 | ) | (222 | ) | (178 | ) | (232 | ) | (335 | ) | ||||||||||||||||||||||||
| Net earnings |
1,892 | 707 | 397 | 788 | 2,926 | 567 | 771 | 654 | 934 | |||||||||||||||||||||||||||||||||
| Net earnings attributable to: |
||||||||||||||||||||||||||||||||||||||||||
| Common shareholders |
1,694 | 640 | 329 | 725 | 2,716 | 528 | 715 | 596 | 877 | |||||||||||||||||||||||||||||||||
| Preferred shareholders |
139 | 47 | 46 | 46 | 152 | 44 | 39 | 35 | 34 | |||||||||||||||||||||||||||||||||
| Non-controlling interest |
59 | 20 | 22 | 17 | 58 | (5 | ) | 17 | 23 | 23 | ||||||||||||||||||||||||||||||||
| Net earnings |
1,892 | 707 | 397 | 788 | 2,926 | 567 | 771 | 654 | 934 | |||||||||||||||||||||||||||||||||
| Net earnings per common share - basic and diluted |
$ | 1.86 | $ | 0.70 | $ | 0.37 | $ | 0.79 | $ | 2.98 | $ | 0.58 | $ | 0.78 | $ | 0.66 | $ | 0.96 | ||||||||||||||||||||||||
| Dividends per common share |
$ | 2.9025 | $ | 0.9675 | $ | 0.9675 | $ | 0.9675 | $ | 3.6800 | $ | 0.9200 | $ | 0.9200 | $ | 0.9200 | $ | 0.9200 | ||||||||||||||||||||||||
| Weighted average number of common shares outstanding - basic (millions) |
912.2 | 912.3 | 912.2 | 912.1 | 911.5 | 912.0 | 911.9 | 911.9 | 910.1 | |||||||||||||||||||||||||||||||||
| Weighted average number of common shares outstanding - diluted (millions) |
912.3 | 912.3 | 912.5 | 912.3 | 912.0 | 912.2 | 912.3 | 912.8 | 910.8 | |||||||||||||||||||||||||||||||||
| Number of common shares outstanding (millions) |
912.3 | 912.3 | 912.3 | 912.2 | 912.0 | 912.0 | 911.9 | 911.9 | 911.8 | |||||||||||||||||||||||||||||||||
| Adjusted net earnings and adjusted EPS |
||||||||||||||||||||||||||||||||||||||||||
| Net earnings attributable to common shareholders |
1,694 | 640 | 329 | 725 | 2,716 | 528 | 715 | 596 | 877 | |||||||||||||||||||||||||||||||||
| Reconciling items: |
||||||||||||||||||||||||||||||||||||||||||
| Severance, acquisition and other costs |
159 | 10 | 100 | 49 | 94 | 19 | 22 | 40 | 13 | |||||||||||||||||||||||||||||||||
| Net mark-to-market losses (gains) on derivatives used to economically hedge equity settled share-based compensation plans |
109 | 128 | (1 | ) | (18 | ) | 53 | (27 | ) | 74 | 81 | (75 | ) | |||||||||||||||||||||||||||||
| Net equity losses on investments in associates and joint ventures |
377 | - | 377 | - | 42 | - | - | 42 | - | |||||||||||||||||||||||||||||||||
| Net (gains) losses on investments |
(78 | ) | 1 | (79 | ) | - | (24 | ) | 29 | - | (16 | ) | (37 | ) | ||||||||||||||||||||||||||||
| Early debt redemption costs |
1 | - | 1 | - | 18 | - | - | - | 18 | |||||||||||||||||||||||||||||||||
| Impairment of assets |
34 | - | - | 34 | 279 | 150 | 21 | 106 | 2 | |||||||||||||||||||||||||||||||||
| Income taxes for the above reconciling items |
(61 | ) | (38 | ) | (5 | ) | (18 | ) | (117 | ) | (37 | ) | (31 | ) | (62 | ) | 13 | |||||||||||||||||||||||||
| NCI for the above reconciling items |
- | - | - | - | (4 | ) | (8 | ) | - | 4 | - | |||||||||||||||||||||||||||||||
| Adjusted net earnings |
2,235 | 741 | 722 | 772 | 3,057 | 654 | 801 | 791 | 811 | |||||||||||||||||||||||||||||||||
| Adjusted EPS |
$ | 2.45 | $ | 0.81 | $ | 0.79 | $ | 0.85 | $ | 3.35 | $ | 0.71 | $ | 0.88 | $ | 0.87 | $ | 0.89 | ||||||||||||||||||||||||
BCE Supplementary Financial Information - Third Quarter 2023 Page 3
BCE (1)
Segmented Data
| (In millions of Canadian dollars, except where otherwise indicated) (unaudited) | Q3 2023 |
Q3 2022 |
$ change | % change | YTD 2023 |
YTD 2022 |
$ change | % change | ||||||||||||||||||||||||||||
| Operating revenues |
||||||||||||||||||||||||||||||||||||
| Bell Communication and Technology Services (Bell CTS) |
5,461 | 5,401 | 60 | 1.1% | 16,182 | 15,652 | 530 | 3.4% | ||||||||||||||||||||||||||||
| Bell Media |
710 | 719 | (9 | ) | (1.3%) | 2,295 | 2,365 | (70 | ) | (3.0%) | ||||||||||||||||||||||||||
| Inter-segment eliminations |
(91 | ) | (96 | ) | 5 | 5.2% | (277 | ) | (282 | ) | 5 | 1.8% | ||||||||||||||||||||||||
| Total |
6,080 | 6,024 | 56 | 0.9% | 18,200 | 17,735 | 465 | 2.6% | ||||||||||||||||||||||||||||
| Operating costs |
||||||||||||||||||||||||||||||||||||
| Bell CTS |
(2,997 | ) | (2,995 | ) | (2 | ) | (0.1%) | (8,881 | ) | (8,506 | ) | (375 | ) | (4.4%) | ||||||||||||||||||||||
| Bell Media |
(507 | ) | (537 | ) | 30 | 5.6% | (1,746 | ) | (1,749 | ) | 3 | 0.2% | ||||||||||||||||||||||||
| Inter-segment eliminations |
91 | 96 | (5 | ) | (5.2%) | 277 | 282 | (5 | ) | (1.8%) | ||||||||||||||||||||||||||
| Total |
(3,413 | ) | (3,436 | ) | 23 | 0.7% | (10,350 | ) | (9,973 | ) | (377 | ) | (3.8%) | |||||||||||||||||||||||
| Adjusted EBITDA |
||||||||||||||||||||||||||||||||||||
| Bell CTS |
2,464 | 2,406 | 58 | 2.4% | 7,301 | 7,146 | 155 | 2.2% | ||||||||||||||||||||||||||||
| Margin |
45.1% | 44.5% | 0.6 pts | 45.1% | 45.7% | (0.6) pts | ||||||||||||||||||||||||||||||
| Bell Media |
203 | 182 | 21 | 11.5% | 549 | 616 | (67 | ) | (10.9%) | |||||||||||||||||||||||||||
| Margin |
28.6% | 25.3% | 3.3 pts | 23.9% | 26.0% | (2.1) pts | ||||||||||||||||||||||||||||||
| Total |
2,667 | 2,588 | 79 | 3.1% | 7,850 | 7,762 | 88 | 1.1% | ||||||||||||||||||||||||||||
| Margin |
43.9% | 43.0% | 0.9 pts | 43.1% | 43.8% | (0.7) pts | ||||||||||||||||||||||||||||||
| Capital expenditures |
||||||||||||||||||||||||||||||||||||
| Bell CTS |
1,123 | 1,286 | 163 | 12.7% | 3,446 | 3,412 | (34 | ) | (1.0%) | |||||||||||||||||||||||||||
| Capital intensity (A)(3) |
20.6% | 23.8% | 3.2 pts | 21.3% | 21.8% | 0.5 pts | ||||||||||||||||||||||||||||||
| Bell Media |
36 | 31 | (5 | ) | (16.1%) | 106 | 83 | (23 | ) | (27.7%) | ||||||||||||||||||||||||||
| Capital intensity |
5.1% | 4.3% | (0.8) pts | 4.6% | 3.5% | (1.1) pts | ||||||||||||||||||||||||||||||
| Total |
1,159 | 1,317 | 158 | 12.0% | 3,552 | 3,495 | (57 | ) | (1.6%) | |||||||||||||||||||||||||||
| Capital intensity |
19.1% | 21.9% | 2.8 pts | 19.5% | 19.7% | 0.2 pts | ||||||||||||||||||||||||||||||
(A) Capital intensity is defined as capital expenditures divided by operating revenues.
BCE Supplementary Financial Information - Third Quarter 2023 Page 4
BCE
Segmented Data - Historical Trend
| (In millions of Canadian dollars, except where otherwise indicated) (unaudited) | |
YTD 2023 |
|
Q3 23 | Q2 23 | Q1 23 | |
TOTAL 2022 |
|
Q4 22 | Q3 22 | Q2 22 | Q1 22 | |||||||||||||||||||||||||||||
| Operating revenues |
||||||||||||||||||||||||||||||||||||||||||
| Bell CTS |
16,182 | 5,461 | 5,354 | 5,367 | 21,301 | 5,649 | 5,401 | 5,135 | 5,116 | |||||||||||||||||||||||||||||||||
| Bell Media |
2,295 | 710 | 805 | 780 | 3,254 | 889 | 719 | 821 | 825 | |||||||||||||||||||||||||||||||||
| Inter-segment eliminations |
(277 | ) | (91 | ) | (93 | ) | (93 | ) | (381 | ) | (99 | ) | (96 | ) | (95 | ) | (91 | ) | ||||||||||||||||||||||||
| Total |
18,200 | 6,080 | 6,066 | 6,054 | 24,174 | 6,439 | 6,024 | 5,861 | 5,850 | |||||||||||||||||||||||||||||||||
| Operating costs |
||||||||||||||||||||||||||||||||||||||||||
| Bell CTS |
(8,881 | ) | (2,997 | ) | (2,923 | ) | (2,961 | ) | (11,847 | ) | (3,341 | ) | (2,995 | ) | (2,771 | ) | (2,740 | ) | ||||||||||||||||||||||||
| Bell Media |
(1,746 | ) | (507 | ) | (591 | ) | (648 | ) | (2,509 | ) | (760 | ) | (537 | ) | (595 | ) | (617 | ) | ||||||||||||||||||||||||
| Inter-segment eliminations |
277 | 91 | 93 | 93 | 381 | 99 | 96 | 95 | 91 | |||||||||||||||||||||||||||||||||
| Total |
(10,350 | ) | (3,413 | ) | (3,421 | ) | (3,516 | ) | (13,975 | ) | (4,002 | ) | (3,436 | ) | (3,271 | ) | (3,266 | ) | ||||||||||||||||||||||||
| Adjusted EBITDA |
||||||||||||||||||||||||||||||||||||||||||
| Bell CTS |
7,301 | 2,464 | 2,431 | 2,406 | 9,454 | 2,308 | 2,406 | 2,364 | 2,376 | |||||||||||||||||||||||||||||||||
| Margin |
45.1% | 45.1% | 45.4% | 44.8% | 44.4% | 40.9% | 44.5% | 46.0% | 46.4% | |||||||||||||||||||||||||||||||||
| Bell Media |
549 | 203 | 214 | 132 | 745 | 129 | 182 | 226 | 208 | |||||||||||||||||||||||||||||||||
| Margin |
23.9% | 28.6% | 26.6% | 16.9% | 22.9% | 14.5% | 25.3% | 27.5% | 25.2% | |||||||||||||||||||||||||||||||||
| Total |
7,850 | 2,667 | 2,645 | 2,538 | 10,199 | 2,437 | 2,588 | 2,590 | 2,584 | |||||||||||||||||||||||||||||||||
| Margin |
43.1% | 43.9% | 43.6% | 41.9% | 42.2% | 37.8% | 43.0% | 44.2% | 44.2% | |||||||||||||||||||||||||||||||||
| Capital expenditures |
||||||||||||||||||||||||||||||||||||||||||
| Bell CTS |
3,446 | 1,123 | 1,271 | 1,052 | 4,971 | 1,559 | 1,286 | 1,190 | 936 | |||||||||||||||||||||||||||||||||
| Capital intensity |
21.3% | 20.6% | 23.7% | 19.6% | 23.3% | 27.6% | 23.8% | 23.2% | 18.3% | |||||||||||||||||||||||||||||||||
| Bell Media |
106 | 36 | 36 | 34 | 162 | 79 | 31 | 29 | 23 | |||||||||||||||||||||||||||||||||
| Capital intensity |
4.6% | 5.1% | 4.5% | 4.4% | 5.0% | 8.9% | 4.3% | 3.5% | 2.8% | |||||||||||||||||||||||||||||||||
| Total |
3,552 | 1,159 | 1,307 | 1,086 | 5,133 | 1,638 | 1,317 | 1,219 | 959 | |||||||||||||||||||||||||||||||||
| Capital intensity |
19.5% | 19.1% | 21.5% | 17.9% | 21.2% | 25.4% | 21.9% | 20.8% | 16.4% |
BCE Supplementary Financial Information - Third Quarter 2023 Page 5
Bell CTS (1)
| (In millions of Canadian dollars, except where otherwise indicated) (unaudited) | Q3 2023 |
Q3 2022 |
% change | YTD 2023 |
YTD 2022 |
% change | ||||||||||||||||||
| Bell CTS |
||||||||||||||||||||||||
| Operating revenues |
||||||||||||||||||||||||
| Wireless |
1,828 | 1,759 | 3.9% | 5,317 | 5,086 | 4.5% | ||||||||||||||||||
| Wireline data |
2,032 | 1,987 | 2.3% | 6,054 | 5,914 | 2.4% | ||||||||||||||||||
| Wireline voice |
717 | 739 | (3.0%) | 2,165 | 2,266 | (4.5%) | ||||||||||||||||||
| Other wireline services |
78 | 77 | 1.3% | 231 | 232 | (0.4%) | ||||||||||||||||||
| External service revenues |
4,655 | 4,562 | 2.0% | 13,767 | 13,498 | 2.0% | ||||||||||||||||||
| Inter-segment service revenues |
7 | 8 | (12.5%) | 21 | 22 | (4.5%) | ||||||||||||||||||
| Operating service revenues |
4,662 | 4,570 | 2.0% | 13,788 | 13,520 | 2.0% | ||||||||||||||||||
| Wireless |
672 | 692 | (2.9%) | 1,924 | 1,797 | 7.1% | ||||||||||||||||||
| Wireline |
127 | 139 | (8.6%) | 470 | 335 | 40.3% | ||||||||||||||||||
| External/Operating product revenues |
799 | 831 | (3.9%) | 2,394 | 2,132 | 12.3% | ||||||||||||||||||
| Total external revenues |
5,454 | 5,393 | 1.1% | 16,161 | 15,630 | 3.4% | ||||||||||||||||||
| Total operating revenues |
5,461 | 5,401 | 1.1% | 16,182 | 15,652 | 3.4% | ||||||||||||||||||
| Operating costs |
(2,997 | ) | (2,995 | ) | (0.1%) | (8,881 | ) | (8,506 | ) | (4.4%) | ||||||||||||||
| Adjusted EBITDA |
2,464 | 2,406 | 2.4% | 7,301 | 7,146 | 2.2% | ||||||||||||||||||
| Adjusted EBITDA margin |
45.1% | 44.5% | 0.6 pts | 45.1% | 45.7% | (0.6) pts | ||||||||||||||||||
| Capital expenditures |
1,123 | 1,286 | 12.7% | 3,446 | 3,412 | (1.0%) | ||||||||||||||||||
| Capital intensity |
20.6% | 23.8% | 3.2 pts | 21.3% | 21.8% | 0.5 pts | ||||||||||||||||||
BCE Supplementary Financial Information - Third Quarter 2023 Page 6
Bell CTS - Historical Trend
| (In millions of Canadian dollars, except where otherwise indicated) (unaudited) | YTD 2023 |
Q3 23 | Q2 23 | Q1 23 | TOTAL 2022 |
Q4 22 | Q3 22 | Q2 22 | Q1 22 | |||||||||||||||||||||||||||||||||
| Bell CTS |
||||||||||||||||||||||||||||||||||||||||||
| Operating revenues |
||||||||||||||||||||||||||||||||||||||||||
| Wireless |
5,317 | 1,828 | 1,766 | 1,723 | 6,821 | 1,735 | 1,759 | 1,692 | 1,635 | |||||||||||||||||||||||||||||||||
| Wireline data |
6,054 | 2,032 | 2,021 | 2,001 | 7,920 | 2,006 | 1,987 | 1,974 | 1,953 | |||||||||||||||||||||||||||||||||
| Wireline voice |
2,165 | 717 | 722 | 726 | 3,002 | 736 | 739 | 756 | 771 | |||||||||||||||||||||||||||||||||
| Other wireline services |
231 | 78 | 75 | 78 | 309 | 77 | 77 | 78 | 77 | |||||||||||||||||||||||||||||||||
| External service revenues |
13,767 | 4,655 | 4,584 | 4,528 | 18,052 | 4,554 | 4,562 | 4,500 | 4,436 | |||||||||||||||||||||||||||||||||
| Inter-segment service revenues |
21 | 7 | 7 | 7 | 31 | 9 | 8 | 7 | 7 | |||||||||||||||||||||||||||||||||
| Operating service revenues |
13,788 | 4,662 | 4,591 | 4,535 | 18,083 | 4,563 | 4,570 | 4,507 | 4,443 | |||||||||||||||||||||||||||||||||
| Wireless |
1,924 | 672 | 626 | 626 | 2,714 | 917 | 692 | 542 | 563 | |||||||||||||||||||||||||||||||||
| Wireline |
470 | 127 | 137 | 206 | 504 | 169 | 139 | 86 | 110 | |||||||||||||||||||||||||||||||||
| External/Operating product revenues |
2,394 | 799 | 763 | 832 | 3,218 | 1,086 | 831 | 628 | 673 | |||||||||||||||||||||||||||||||||
| Total external revenues |
16,161 | 5,454 | 5,347 | 5,360 | 21,270 | 5,640 | 5,393 | 5,128 | 5,109 | |||||||||||||||||||||||||||||||||
| Total operating revenues |
16,182 | 5,461 | 5,354 | 5,367 | 21,301 | 5,649 | 5,401 | 5,135 | 5,116 | |||||||||||||||||||||||||||||||||
| Operating costs |
(8,881 | ) | (2,997 | ) | (2,923 | ) | (2,961 | ) | (11,847 | ) | (3,341 | ) | (2,995 | ) | (2,771 | ) | (2,740 | ) | ||||||||||||||||||||||||
| Adjusted EBITDA |
7,301 | 2,464 | 2,431 | 2,406 | 9,454 | 2,308 | 2,406 | 2,364 | 2,376 | |||||||||||||||||||||||||||||||||
| Adjusted EBITDA margin |
45.1% | 45.1% | 45.4% | 44.8% | 44.4% | 40.9% | 44.5% | 46.0% | 46.4% | |||||||||||||||||||||||||||||||||
| Capital expenditures |
3,446 | 1,123 | 1,271 | 1,052 | 4,971 | 1,559 | 1,286 | 1,190 | 936 | |||||||||||||||||||||||||||||||||
| Capital intensity |
21.3% | 20.6% | 23.7% | 19.6% | 23.3% | 27.6% | 23.8% | 23.2% | 18.3% | |||||||||||||||||||||||||||||||||
BCE Supplementary Financial Information - Third Quarter 2023 Page 7
Bell CTS Metrics (1)
| (In millions of Canadian dollars, except where otherwise indicated) (unaudited) | Q3 2023 |
Q3 2022 |
% change | YTD 2023 |
YTD 2022 |
% change | ||||||||||||||||||
| Mobile phone subscribers(3) |
||||||||||||||||||||||||
| Gross subscriber activations |
603,770 | 583,700 | 3.4% | 1,512,245 | 1,348,878 | 12.1% | ||||||||||||||||||
| Postpaid |
423,364 | 391,165 | 8.2% | 1,043,719 | 888,478 | 17.5% | ||||||||||||||||||
| Prepaid |
180,406 | 192,535 | (6.3%) | 468,526 | 460,400 | 1.8% | ||||||||||||||||||
| Net subscriber activations |
166,930 | 224,343 | (25.6%) | 319,104 | 367,280 | (13.1%) | ||||||||||||||||||
| Postpaid |
142,886 | 167,798 | (14.8%) | 297,457 | 285,225 | 4.3% | ||||||||||||||||||
| Prepaid |
24,044 | 56,545 | (57.5%) | 21,647 | 82,055 | (73.6%) | ||||||||||||||||||
| Subscribers end of period (EOP)(C) |
10,194,961 | 9,826,465 | 3.8% | 10,194,961 | 9,826,465 | 3.8% | ||||||||||||||||||
| Postpaid(C) |
9,294,115 | 8,915,270 | 4.2% | 9,294,115 | 8,915,270 | 4.2% | ||||||||||||||||||
| Prepaid |
900,846 | 911,195 | (1.1%) | 900,846 | 911,195 | (1.1%) | ||||||||||||||||||
| Blended average revenue per user (ARPU) ($/month)(B)(3) |
60.28 | 60.39 | (0.2%) | 59.21 | 59.07 | 0.2% | ||||||||||||||||||
| Blended churn (%) (average per month)(3) |
1.45% | 1.24% | (0.21) pts | 1.34% | 1.15% | (0.19) pts | ||||||||||||||||||
| Postpaid |
1.10% | 0.90% | (0.20) pts | 0.98% | 0.82% | (0.16) pts | ||||||||||||||||||
| Prepaid |
5.10% | 4.58% | (0.52) pts | 5.02% | 4.53% | (0.49) pts | ||||||||||||||||||
| Mobile connected device subscribers(3) |
||||||||||||||||||||||||
| Net subscriber activations |
64,282 | 49,044 | 31.1% | 214,561 | 97,577 | n.m. | ||||||||||||||||||
| Subscribers EOP(C) |
2,653,802 | 2,347,371 | 13.1% | 2,653,802 | 2,347,371 | 13.1% | ||||||||||||||||||
| Retail high-speed Internet subscribers(3) |
||||||||||||||||||||||||
| Retail net subscriber activations |
79,327 | 89,652 | (11.5%) | 131,535 | 138,296 | (4.9%) | ||||||||||||||||||
| Retail subscribers EOP(A)(D)(E) |
4,417,838 | 4,067,039 | 8.6% | 4,417,838 | 4,067,039 | 8.6% | ||||||||||||||||||
| Retail TV subscribers(3) |
||||||||||||||||||||||||
| Retail net subscriber activations (losses) |
4,222 | 10,853 | (61.1%) | (24,131 | ) | (9,035 | ) | n.m. | ||||||||||||||||
| Internet protocol television (IPTV) |
35,976 | 38,093 | (5.6%) | 58,381 | 54,191 | 7.7% | ||||||||||||||||||
| Satellite |
(31,754 | ) | (27,240 | ) | (16.6%) | (82,512 | ) | (63,226 | ) | (30.5%) | ||||||||||||||
| Total retail subscribers EOP(A)(E) |
2,727,610 | 2,735,000 | (0.3%) | 2,727,610 | 2,735,000 | (0.3%) | ||||||||||||||||||
| IPTV(A)(E) |
2,046,805 | 1,945,657 | 5.2% | 2,046,805 | 1,945,657 | 5.2% | ||||||||||||||||||
| Satellite |
680,805 | 789,343 | (13.8%) | 680,805 | 789,343 | (13.8%) | ||||||||||||||||||
| Retail residential network access services (NAS)(3) |
||||||||||||||||||||||||
| Retail residential NAS lines net losses |
(41,776 | ) | (42,853 | ) | 2.5% | (138,265 | ) | (137,910 | ) | (0.3%) | ||||||||||||||
| Retail residential NAS lines(A)(E) |
2,059,964 | 2,164,151 | (4.8%) | 2,059,964 | 2,164,151 | (4.8%) | ||||||||||||||||||
n.m. : not meaningful
| (A) | In Q2 2023, our retail high-speed Internet, retail IPTV and retail residential NAS lines subscriber bases increased by 35,080, 243 and 7,458 subscribers, respectively, as a result of small acquisitions. |
| (B) | Effective Q1 2023, as a result of the segment reporting changes impacting intersegment eliminations, ARPU has been updated and is defined as Bell CTS wireless external services revenues (previously wireless operating service revenues) divided by the average mobile phone subscriber base for the specified period, expressed as a dollar unit per month. |
| (C) | In Q1 2023, we adjusted our mobile phone postpaid and mobile connected device subscriber bases to remove older non-revenue generating business subscribers of 73,229 and 12,577, respectively. |
| (D) | In Q1 2023, subsequent to a review of customer account records, our retail high-speed Internet subscriber base was reduced by 7,347 subscribers. |
| (E) | In Q4 2022, as a result of the acquisition of Distributel Communications Limited (Distributel), our retail high-speed Internet, retail IPTV and retail residential NAS lines subscriber bases increased by 128,065, 2,315 and 64,498 subscribers, respectively. |
BCE Supplementary Financial Information - Third Quarter 2023 Page 8
Bell CTS Metrics - Historical Trend
| (In millions of Canadian dollars, except where otherwise indicated) (unaudited) | YTD 2023 |
Q3 23 | Q2 23 | Q1 23 | TOTAL 2022 |
Q4 22 | Q3 22 | Q2 22 | Q1 22 | |||||||||||||||||||||||||||||||||
| Mobile phone subscribers |
||||||||||||||||||||||||||||||||||||||||||
| Gross subscriber activations |
1,512,245 | 603,770 | 502,940 | 405,535 | 1,953,912 | 605,034 | 583,700 | 415,270 | 349,908 | |||||||||||||||||||||||||||||||||
| Postpaid |
1,043,719 | 423,364 | 347,746 | 272,609 | 1,355,772 | 467,294 | 391,165 | 266,600 | 230,713 | |||||||||||||||||||||||||||||||||
| Prepaid |
468,526 | 180,406 | 155,194 | 132,926 | 598,140 | 137,740 | 192,535 | 148,670 | 119,195 | |||||||||||||||||||||||||||||||||
| Net subscriber activations (losses) |
319,104 | 166,930 | 125,539 | 26,635 | 489,901 | 122,621 | 224,343 | 110,761 | 32,176 | |||||||||||||||||||||||||||||||||
| Postpaid |
297,457 | 142,886 | 111,282 | 43,289 | 439,842 | 154,617 | 167,798 | 83,197 | 34,230 | |||||||||||||||||||||||||||||||||
| Prepaid |
21,647 | 24,044 | 14,257 | (16,654 | ) | 50,059 | (31,996 | ) | 56,545 | 27,564 | (2,054 | ) | ||||||||||||||||||||||||||||||
| Subscribers end of period (EOP)(C) |
10,194,961 | 10,194,961 | 10,028,031 | 9,902,492 | 9,949,086 | 9,949,086 | 9,826,465 | 9,602,122 | 9,491,361 | |||||||||||||||||||||||||||||||||
| Postpaid(C) |
9,294,115 | 9,294,115 | 9,151,229 | 9,039,947 | 9,069,887 | 9,069,887 | 8,915,270 | 8,747,472 | 8,664,275 | |||||||||||||||||||||||||||||||||
| Prepaid |
900,846 | 900,846 | 876,802 | 862,545 | 879,199 | 879,199 | 911,195 | 854,650 | 827,086 | |||||||||||||||||||||||||||||||||
| Blended ARPU ($/month)(B) |
59.21 | 60.28 | 59.16 | 58.15 | 58.92 | 58.49 | 60.39 | 59.17 | 57.61 | |||||||||||||||||||||||||||||||||
| Blended churn (%) (average per month) |
1.34% | 1.45% | 1.27% | 1.29% | 1.27% | 1.63% | 1.24% | 1.07% | 1.12% | |||||||||||||||||||||||||||||||||
| Postpaid |
0.98% | 1.10% | 0.94% | 0.90% | 0.92% | 1.22% | 0.90% | 0.75% | 0.79% | |||||||||||||||||||||||||||||||||
| Prepaid |
5.02% | 5.10% | 4.68% | 5.28% | 4.85% | 5.74% | 4.58% | 4.41% | 4.61% | |||||||||||||||||||||||||||||||||
| Mobile connected device subscribers |
||||||||||||||||||||||||||||||||||||||||||
| Net subscriber activations |
214,561 | 64,282 | 79,537 | 70,742 | 202,024 | 104,447 | 49,044 | (344 | ) | 48,877 | ||||||||||||||||||||||||||||||||
| Subscribers EOP(C) |
2,653,802 | 2,653,802 | 2,589,520 | 2,509,983 | 2,451,818 | 2,451,818 | 2,347,371 | 2,298,327 | 2,298,671 | |||||||||||||||||||||||||||||||||
| Retail high-speed Internet subscribers |
||||||||||||||||||||||||||||||||||||||||||
| Retail net subscriber activations |
131,535 | 79,327 | 24,934 | 27,274 | 201,762 | 63,466 | 89,652 | 22,620 | 26,024 | |||||||||||||||||||||||||||||||||
| Retail subscribers EOP(A)(D)(E) |
4,417,838 | 4,417,838 | 4,338,511 | 4,278,497 | 4,258,570 | 4,258,570 | 4,067,039 | 3,977,387 | 3,954,767 | |||||||||||||||||||||||||||||||||
| Retail TV subscribers |
||||||||||||||||||||||||||||||||||||||||||
| Retail net subscriber activations (losses) |
(24,131 | ) | 4,222 | (14,404 | ) | (13,949 | ) | 5,148 | 14,183 | 10,853 | (11,527 | ) | (8,361 | ) | ||||||||||||||||||||||||||||
| IPTV |
58,381 | 35,976 | 11,506 | 10,899 | 94,400 | 40,209 | 38,093 | 3,838 | 12,260 | |||||||||||||||||||||||||||||||||
| Satellite |
(82,512 | ) | (31,754 | ) | (25,910 | ) | (24,848 | ) | (89,252 | ) | (26,026 | ) | (27,240 | ) | (15,365 | ) | (20,621 | ) | ||||||||||||||||||||||||
| Total retail subscribers EOP(A)(E) |
2,727,610 | 2,727,610 | 2,723,388 | 2,737,549 | 2,751,498 | 2,751,498 | 2,735,000 | 2,724,147 | 2,735,674 | |||||||||||||||||||||||||||||||||
| IPTV(A)(E) |
2,046,805 | 2,046,805 | 2,010,829 | 1,999,080 | 1,988,181 | 1,988,181 | 1,945,657 | 1,907,564 | 1,903,726 | |||||||||||||||||||||||||||||||||
| Satellite |
680,805 | 680,805 | 712,559 | 738,469 | 763,317 | 763,317 | 789,343 | 816,583 | 831,948 | |||||||||||||||||||||||||||||||||
| Retail residential NAS |
||||||||||||||||||||||||||||||||||||||||||
| Retail residential NAS lines net losses |
(138,265 | ) | (41,776 | ) | (49,608 | ) | (46,881 | ) | (175,788 | ) | (37,878 | ) | (42,853 | ) | (52,712 | ) | (42,345 | ) | ||||||||||||||||||||||||
| Retail residential NAS lines(A)(E) |
2,059,964 | 2,059,964 | 2,101,740 | 2,143,890 | 2,190,771 | 2,190,771 | 2,164,151 | 2,207,004 | 2,259,716 | |||||||||||||||||||||||||||||||||
| (A) | In Q2 2023, our retail high-speed Internet, retail IPTV and retail residential NAS lines subscriber bases increased by 35,080, 243 and 7,458 subscribers, respectively, as a result of small acquisitions. |
| (B) | Effective Q1 2023, as a result of the segment reporting changes impacting intersegment eliminations, ARPU has been updated and is defined as Bell CTS wireless external services revenues (previously wireless operating service revenues) divided by the average mobile phone subscriber base for the specified period, expressed as a dollar unit per month. |
| (C) | In Q1 2023, we adjusted our mobile phone postpaid and mobile connected device subscriber bases to remove older non-revenue generating business subscribers of 73,229 and 12,577, respectively. |
| (D) | In Q1 2023, subsequent to a review of customer account records, our retail high-speed Internet subscriber base was reduced by 7,347 subscribers. |
| (E) | In Q4 2022, as a result of the acquisition of Distributel, our retail high-speed Internet, retail IPTV and retail residential NAS lines subscriber bases increased by 128,065, 2,315 and 64,498 subscribers, respectively. |
BCE Supplementary Financial Information - Third Quarter 2023 Page 9
BCE
Net debt and other information
|
BCE - Net debt and preferred shares |
||||||||||||||||||||||||||||||||||||
| (In millions of Canadian dollars, except where otherwise indicated) (unaudited) |
||||||||||||||||||||||||||||||||||||
| September 30 | June 30 | March 31 | December 31 | |||||||||||||||||||||||||||||||||
| 2023 | 2023 | 2023 | 2022 | |||||||||||||||||||||||||||||||||
| Long-term debt |
29,532 | 28,314 | 27,456 | 27,783 | ||||||||||||||||||||||||||||||||
| Debt due within one year |
5,171 | 6,039 | 6,347 | 4,137 | ||||||||||||||||||||||||||||||||
| 50% of preferred shares |
1,871 | 1,891 | 1,914 | 1,935 | ||||||||||||||||||||||||||||||||
| Cash |
(569 | ) | (450 | ) | (651 | ) | (99) | |||||||||||||||||||||||||||||
| Cash equivalents |
(50 | ) | (450 | ) | (90 | ) | (50) | |||||||||||||||||||||||||||||
| Net debt (A) |
35,955 | 35,344 | 34,976 | 33,706 | ||||||||||||||||||||||||||||||||
| Net debt leverage ratio (A) |
3.50 | 3.46 | 3.44 | 3.30 | ||||||||||||||||||||||||||||||||
| Adjusted EBITDA /adjusted net interest expense ratio (A) |
7.12 | 7.48 | 7.94 | 8.50 | ||||||||||||||||||||||||||||||||
|
|
||||||||||||||||||||||||||||||||||||
| Cash flow information |
||||||||||||||||||||||||||||||||||||
| (In millions of Canadian dollars, except where otherwise indicated) (unaudited) |
Q3 | Q3 | YTD | YTD | ||||||||||||||||||||||||||||||||
| 2023 | 2022 | $ change | % change | 2023 | 2022 | $ change | % change | |||||||||||||||||||||||||||||
| Free cash flow (FCF) (A) |
||||||||||||||||||||||||||||||||||||
| Cash flows from operating activities |
1,961 | 1,996 | (35 | ) | (1.8%) | 5,573 | 6,309 | (736 | ) | (11.7%) | ||||||||||||||||||||||||||
| Capital expenditures |
(1,159 | ) | (1,317 | ) | 158 | 12.0% | (3,552 | ) | (3,495 | ) | (57 | ) | (1.6%) | |||||||||||||||||||||||
| Cash dividends paid on preferred shares |
(35 | ) | (27 | ) | (8 | ) | (29.6%) | (136 | ) | (94 | ) | (42 | ) | (44.7%) | ||||||||||||||||||||||
| Cash dividends paid by subsidiaries to non-controlling interest |
(13 | ) | (11 | ) | (2 | ) | (18.2%) | (35 | ) | (36 | ) | 1 | 2.8% | |||||||||||||||||||||||
| Acquisition and other costs paid |
- | 1 | (1 | ) | (100.0%) | 5 | 7 | (2 | ) | (28.6%) | ||||||||||||||||||||||||||
| FCF |
754 | 642 | 112 | 17.4% | 1,855 | 2,691 | (836 | ) | (31.1%) | |||||||||||||||||||||||||||
|
|
||||||||||||||||||||||||||||||||||||
| Cash flow information - Historical trend |
||||||||||||||||||||||||||||||||||||
| (In millions of Canadian dollars, except where otherwise indicated) (unaudited) |
YTD | Q3 | Q2 | Q1 | Total | Q4 | Q3 | Q2 | Q1 | |||||||||||||||||||||||||||
| 2023 | 2023 | 2023 | 2023 | 2022 | 2022 | 2022 | 2022 | 2022 | ||||||||||||||||||||||||||||
| FCF |
||||||||||||||||||||||||||||||||||||
| Cash flows from operating activities |
5,573 | 1,961 | 2,365 | 1,247 | 8,365 | 2,056 | 1,996 | 2,597 | 1,716 | |||||||||||||||||||||||||||
| Capital expenditures |
(3,552 | ) | (1,159 | ) | (1,307 | ) | (1,086 | ) | (5,133 | ) | (1,638 | ) | (1,317 | ) | (1,219 | ) | (959) | |||||||||||||||||||
| Cash dividends paid on preferred shares |
(136 | ) | (35 | ) | (46 | ) | (55 | ) | (136 | ) | (42 | ) | (27 | ) | (34 | ) | (33) | |||||||||||||||||||
| Cash dividends paid by subsidiaries to non-controlling interest |
(35 | ) | (13 | ) | (1 | ) | (21 | ) | (39 | ) | (3 | ) | (11 | ) | (14 | ) | (11) | |||||||||||||||||||
| Acquisition and other costs paid |
5 | - | 5 | - | 10 | 3 | 1 | 3 | 3 | |||||||||||||||||||||||||||
| FCF |
1,855 | 754 | 1,016 | 85 | 3,067 | 376 | 642 | 1,333 | 716 | |||||||||||||||||||||||||||
|
|
||||||||||||||||||||||||||||||||||||
| (A) | Net debt and free cash flow are non-GAAP financial measures and net debt leverage ratio and adjusted EBITDA to adjusted net interest expense ratio are capital management measures. Refer to note 2.1, Non-GAAP financial measures and note 2.4, Capital management measures in the Accompanying Notes to this report for more information on these measures. |
BCE Supplementary Financial Information - Third Quarter 2023 Page 10
BCE
Consolidated Statements of Financial Position
| (In millions of Canadian dollars, except where otherwise indicated) (unaudited) | September 30 2023 |
June 30 2023 |
March 31 2023 |
December 31 2022 |
||||||||||||||||||||
| ASSETS |
||||||||||||||||||||||||
| Current assets |
||||||||||||||||||||||||
| Cash |
569 | 450 | 651 | 99 | ||||||||||||||||||||
| Cash equivalents |
50 | 450 | 90 | 50 | ||||||||||||||||||||
| Trade and other receivables |
3,838 | 3,771 | 3,828 | 4,138 | ||||||||||||||||||||
| Inventory |
636 | 656 | 673 | 656 | ||||||||||||||||||||
| Contract assets |
404 | 403 | 419 | 436 | ||||||||||||||||||||
| Contract costs |
590 | 559 | 538 | 540 | ||||||||||||||||||||
| Prepaid expenses |
338 | 395 | 378 | 244 | ||||||||||||||||||||
| Other current assets |
312 | 282 | 330 | 324 | ||||||||||||||||||||
| Assets held for sale |
- | - | 260 | - | ||||||||||||||||||||
| Total current assets |
6,737 | 6,966 | 7,167 | 6,487 | ||||||||||||||||||||
| Non-current assets |
||||||||||||||||||||||||
| Contract assets |
251 | 243 | 260 | 288 | ||||||||||||||||||||
| Contract costs |
732 | 683 | 633 | 603 | ||||||||||||||||||||
| Property, plant and equipment |
30,158 | 29,909 | 29,233 | 29,256 | ||||||||||||||||||||
| Intangible assets |
16,491 | 16,395 | 16,338 | 16,183 | ||||||||||||||||||||
| Deferred tax assets |
114 | 108 | 102 | 84 | ||||||||||||||||||||
| Investments in associates and joint ventures |
326 | 322 | 664 | 608 | ||||||||||||||||||||
| Post-employment benefit assets |
3,299 | 3,207 | 3,407 | 3,559 | ||||||||||||||||||||
| Other non-current assets |
1,241 | 1,194 | 1,341 | 1,355 | ||||||||||||||||||||
| Goodwill |
11,023 | 11,022 | 10,830 | 10,906 | ||||||||||||||||||||
| Total non-current assets |
63,635 | 63,083 | 62,808 | 62,842 | ||||||||||||||||||||
| Total assets |
70,372 | 70,049 | 69,975 | 69,329 | ||||||||||||||||||||
| LIABILITIES |
||||||||||||||||||||||||
| Current liabilities |
||||||||||||||||||||||||
| Trade payables and other liabilities |
4,354 | 4,347 | 4,080 | 5,221 | ||||||||||||||||||||
| Contract liabilities |
798 | 793 | 851 | 857 | ||||||||||||||||||||
| Interest payable |
258 | 305 | 208 | 281 | ||||||||||||||||||||
| Dividends payable |
910 | 900 | 900 | 867 | ||||||||||||||||||||
| Current tax liabilities |
279 | 207 | 164 | 106 | ||||||||||||||||||||
| Debt due within one year |
5,171 | 6,039 | 6,347 | 4,137 | ||||||||||||||||||||
| Liabilities held for sale |
- | - | 109 | - | ||||||||||||||||||||
| Total current liabilities |
11,770 | 12,591 | 12,659 | 11,469 | ||||||||||||||||||||
| Non-current liabilities |
||||||||||||||||||||||||
| Contract liabilities |
271 | 257 | 244 | 228 | ||||||||||||||||||||
| Long-term debt |
29,532 | 28,314 | 27,456 | 27,783 | ||||||||||||||||||||
| Deferred tax liabilities |
4,954 | 4,898 | 4,969 | 4,953 | ||||||||||||||||||||
| Post-employment benefit obligations |
1,225 | 1,339 | 1,348 | 1,311 | ||||||||||||||||||||
| Other non-current liabilities |
1,313 | 1,201 | 1,032 | 1,070 | ||||||||||||||||||||
| Total non-current liabilities |
37,295 | 36,009 | 35,049 | 35,345 | ||||||||||||||||||||
| Total liabilities |
49,065 | 48,600 | 47,708 | 46,814 | ||||||||||||||||||||
| EQUITY |
||||||||||||||||||||||||
| Equity attributable to BCE shareholders |
||||||||||||||||||||||||
| Preferred shares |
3,742 | 3,781 | 3,827 | 3,870 | ||||||||||||||||||||
| Common shares |
20,859 | 20,859 | 20,851 | 20,840 | ||||||||||||||||||||
| Contributed surplus |
1,230 | 1,204 | 1,179 | 1,172 | ||||||||||||||||||||
| Accumulated other comprehensive (loss) income |
(145 | ) | (105 | ) | 3 | (55 | ) | |||||||||||||||||
| Deficit |
(4,716 | ) | (4,618 | ) | (3,926 | ) | (3,649 | ) | ||||||||||||||||
| Total equity attributable to BCE shareholders |
20,970 | 21,121 | 21,934 | 22,178 | ||||||||||||||||||||
| Non-controlling interest |
337 | 328 | 333 | 337 | ||||||||||||||||||||
| Total equity |
21,307 | 21,449 | 22,267 | 22,515 | ||||||||||||||||||||
| Total liabilities and equity |
70,372 | 70,049 | 69,975 | 69,329 | ||||||||||||||||||||
| Number of common shares outstanding (millions) |
912.3 | 912.3 | 912.2 | 912.0 | ||||||||||||||||||||
BCE Supplementary Financial Information - Third Quarter 2023 Page 11
BCE
Consolidated Cash Flow Data
| Q3 | Q3 | YTD | YTD | |||||||||||||||||||||||||||||
| (In millions of Canadian dollars, except where otherwise indicated) (unaudited) | 2023 | 2022 | $ change | 2023 | 2022 | $ change | ||||||||||||||||||||||||||
| Net earnings |
707 | 771 | (64 | ) | 1,892 | 2,359 | (467 | ) | ||||||||||||||||||||||||
| Adjustments to reconcile net earnings to cash flows from operating activities |
||||||||||||||||||||||||||||||||
| Severance, acquisition and other costs |
10 | 22 | (12 | ) | 159 | 75 | 84 | |||||||||||||||||||||||||
| Depreciation and amortization |
1,232 | 1,181 | 51 | 3,665 | 3,531 | 134 | ||||||||||||||||||||||||||
| Post-employment benefit plans cost |
23 | 48 | (25 | ) | 75 | 151 | (76 | ) | ||||||||||||||||||||||||
| Net interest expense |
358 | 282 | 76 | 1,034 | 805 | 229 | ||||||||||||||||||||||||||
| Impairment of assets |
- | 21 | (21 | ) | 34 | 129 | (95 | ) | ||||||||||||||||||||||||
| Losses (gains) on investments |
1 | - | 1 | (78 | ) | (53 | ) | (25 | ) | |||||||||||||||||||||||
| Net equity losses on investments in associates and joint ventures |
- | - | - | 377 | 42 | 335 | ||||||||||||||||||||||||||
| Income taxes |
243 | 178 | 65 | 786 | 745 | 41 | ||||||||||||||||||||||||||
| Contributions to post-employment benefit plans |
(12 | ) | (14 | ) | 2 | (40 | ) | (128 | ) | 88 | ||||||||||||||||||||||
| Payments under other post-employment benefit plans |
(16 | ) | (17 | ) | 1 | (48 | ) | (47 | ) | (1 | ) | |||||||||||||||||||||
| Severance and other costs paid |
(55 | ) | (44 | ) | (11 | ) | (119 | ) | (102 | ) | (17 | ) | ||||||||||||||||||||
| Interest paid |
(451 | ) | (385 | ) | (66 | ) | (1,160 | ) | (954 | ) | (206 | ) | ||||||||||||||||||||
| Income taxes paid (net of refunds) |
(167 | ) | (150 | ) | (17 | ) | (531 | ) | (409 | ) | (122 | ) | ||||||||||||||||||||
| Acquisition and other costs paid |
- | (1 | ) | 1 | (5 | ) | (7 | ) | 2 | |||||||||||||||||||||||
| Change in contract assets |
(8 | ) | (20 | ) | 12 | 70 | 35 | 35 | ||||||||||||||||||||||||
| Change in wireless device financing plan receivables |
16 | (6 | ) | 22 | 81 | 121 | (40 | ) | ||||||||||||||||||||||||
| Net change in operating assets and liabilities |
80 | 130 | (50 | ) | (619 | ) | 16 | (635 | ) | |||||||||||||||||||||||
| Cash flows from operating activities |
1,961 | 1,996 | (35 | ) | 5,573 | 6,309 | (736 | ) | ||||||||||||||||||||||||
| Capital expenditures |
(1,159 | ) | (1,317 | ) | 158 | (3,552 | ) | (3,495 | ) | (57 | ) | |||||||||||||||||||||
| Cash dividends paid on preferred shares |
(35 | ) | (27 | ) | (8 | ) | (136 | ) | (94 | ) | (42 | ) | ||||||||||||||||||||
| Cash dividends paid by subsidiaries to non-controlling interest |
(13 | ) | (11 | ) | (2 | ) | (35 | ) | (36 | ) | 1 | |||||||||||||||||||||
| Acquisition and other costs paid |
- | 1 | (1 | ) | 5 | 7 | (2 | ) | ||||||||||||||||||||||||
| Free cash flow |
754 | 642 | 112 | 1,855 | 2,691 | (836 | ) | |||||||||||||||||||||||||
| Business acquisitions |
1 | (3 | ) | 4 | (220 | ) | (142 | ) | (78 | ) | ||||||||||||||||||||||
| Business dispositions |
1 | (1 | ) | 2 | 209 | 53 | 156 | |||||||||||||||||||||||||
| Acquisition and other costs paid |
- | (1 | ) | 1 | (5 | ) | (7 | ) | 2 | |||||||||||||||||||||||
| Spectrum licences |
(3 | ) | (3 | ) | - | (159 | ) | (3 | ) | (156 | ) | |||||||||||||||||||||
| Other investing activities |
(16 | ) | (8 | ) | (8 | ) | (1 | ) | 9 | (10 | ) | |||||||||||||||||||||
| (Decrease) increase in notes payable |
(300 | ) | (34 | ) | (266 | ) | (484 | ) | 622 | (1,106 | ) | |||||||||||||||||||||
| Increase in securitized receivables |
- | 700 | (700 | ) | - | 700 | (700 | ) | ||||||||||||||||||||||||
| Issue of long-term debt |
1,161 | - | 1,161 | 3,864 | 945 | 2,919 | ||||||||||||||||||||||||||
| Repayment of long-term debt |
(920 | ) | (270 | ) | (650 | ) | (1,565 | ) | (1,773 | ) | 208 | |||||||||||||||||||||
| Repurchase of a financial liability |
- | - | - | (149 | ) | - | (149 | ) | ||||||||||||||||||||||||
| Issue of common shares |
- | 1 | (1 | ) | 18 | 169 | (151 | ) | ||||||||||||||||||||||||
| Purchase of shares for settlement of share-based payments |
(44 | ) | (49 | ) | 5 | (179 | ) | (206 | ) | 27 | ||||||||||||||||||||||
| Repurchase of preferred shares |
(27 | ) | - | (27 | ) | (90 | ) | (115 | ) | 25 | ||||||||||||||||||||||
| Cash dividends paid on common shares |
(883 | ) | (839 | ) | (44 | ) | (2,604 | ) | (2,473 | ) | (131 | ) | ||||||||||||||||||||
| Other financing activities |
(5 | ) | 2 | (7 | ) | (20 | ) | (26 | ) | 6 | ||||||||||||||||||||||
| (1,035 | ) | (505 | ) | (530 | ) | (1,385 | ) | (2,247 | ) | 862 | ||||||||||||||||||||||
| Net increase (decrease) in cash |
119 | (13 | ) | 132 | 470 | 294 | 176 | |||||||||||||||||||||||||
| Cash at beginning of period |
450 | 596 | (146 | ) | 99 | 289 | (190 | ) | ||||||||||||||||||||||||
| Cash at end of period |
569 | 583 | (14 | ) | 569 | 583 | (14 | ) | ||||||||||||||||||||||||
| Net (decrease) increase in cash equivalents |
(400 | ) | 150 | (550 | ) | - | 150 | (150 | ) | |||||||||||||||||||||||
| Cash equivalents at beginning of period |
450 | - | 450 | 50 | - | 50 | ||||||||||||||||||||||||||
| Cash equivalents at end of period |
50 | 150 | (100 | ) | 50 | 150 | (100 | ) | ||||||||||||||||||||||||
BCE Supplementary Financial Information - Third Quarter 2023 Page 12
BCE
Consolidated Cash Flow Data - Historical Trend
| (In millions of Canadian dollars, except where otherwise indicated) (unaudited) | YTD 2023 |
Q3 23 | Q2 23 | Q1 23 | TOTAL 2022 |
Q4 22 | Q3 22 | Q2 22 | Q1 22 | |||||||||||||||||||||||||||||||||||||||
| Net earnings |
1,892 | 707 | 397 | 788 | 2,926 | 567 | 771 | 654 | 934 | |||||||||||||||||||||||||||||||||||||||
| Adjustments to reconcile net earnings to cash flows from operating activities |
||||||||||||||||||||||||||||||||||||||||||||||||
| Severance, acquisition and other costs |
159 | 10 | 100 | 49 | 94 | 19 | 22 | 40 | 13 | |||||||||||||||||||||||||||||||||||||||
| Depreciation and amortization |
3,665 | 1,232 | 1,232 | 1,201 | 4,723 | 1,192 | 1,181 | 1,199 | 1,151 | |||||||||||||||||||||||||||||||||||||||
| Post-employment benefit plans cost |
75 | 23 | 21 | 31 | 198 | 47 | 48 | 52 | 51 | |||||||||||||||||||||||||||||||||||||||
| Net interest expense |
1,034 | 358 | 346 | 330 | 1,124 | 319 | 282 | 265 | 258 | |||||||||||||||||||||||||||||||||||||||
| Impairment of assets |
34 | - | - | 34 | 279 | 150 | 21 | 106 | 2 | |||||||||||||||||||||||||||||||||||||||
| (Gains) losses on investments |
(78 | ) | 1 | (79 | ) | - | (24 | ) | 29 | - | (16 | ) | (37 | ) | ||||||||||||||||||||||||||||||||||
| Net equity losses on investments in associates and joint ventures |
377 | - | 377 | - | 42 | - | - | 42 | - | |||||||||||||||||||||||||||||||||||||||
| Income taxes |
786 | 243 | 273 | 270 | 967 | 222 | 178 | 232 | 335 | |||||||||||||||||||||||||||||||||||||||
| Contributions to post-employment benefit plans |
(40 | ) | (12 | ) | (13 | ) | (15 | ) | (140 | ) | (12 | ) | (14 | ) | (35 | ) | (79 | ) | ||||||||||||||||||||||||||||||
| Payments under other post-employment benefit plans |
(48 | ) | (16 | ) | (17 | ) | (15 | ) | (64 | ) | (17 | ) | (17 | ) | (15 | ) | (15 | ) | ||||||||||||||||||||||||||||||
| Severance and other costs paid |
(119 | ) | (55 | ) | (39 | ) | (25 | ) | (129 | ) | (27 | ) | (44 | ) | (30 | ) | (28 | ) | ||||||||||||||||||||||||||||||
| Interest paid |
(1,160 | ) | (451 | ) | (270 | ) | (439 | ) | (1,197 | ) | (243 | ) | (385 | ) | (196 | ) | (373 | ) | ||||||||||||||||||||||||||||||
| Income taxes paid (net of refunds) |
(531 | ) | (167 | ) | (200 | ) | (164 | ) | (749 | ) | (340 | ) | (150 | ) | (143 | ) | (116 | ) | ||||||||||||||||||||||||||||||
| Acquisition and other costs paid |
(5 | ) | - | (5 | ) | - | (10 | ) | (3 | ) | (1 | ) | (3 | ) | (3 | ) | ||||||||||||||||||||||||||||||||
| Change in contract assets |
70 | (8 | ) | 33 | 45 | (59 | ) | (94 | ) | (20 | ) | 23 | 32 | |||||||||||||||||||||||||||||||||||
| Change in wireless device financing plan receivables |
81 | 16 | 24 | 41 | 22 | (99 | ) | (6 | ) | 68 | 59 | |||||||||||||||||||||||||||||||||||||
| Net change in operating assets and liabilities |
(619 | ) | 80 | 185 | (884 | ) | 362 | 346 | 130 | 354 | (468 | ) | ||||||||||||||||||||||||||||||||||||
| Cash flows from operating activities |
5,573 | 1,961 | 2,365 | 1,247 | 8,365 | 2,056 | 1,996 | 2,597 | 1,716 | |||||||||||||||||||||||||||||||||||||||
| Capital expenditures |
(3,552 | ) | (1,159 | ) | (1,307 | ) | (1,086 | ) | (5,133 | ) | (1,638 | ) | (1,317 | ) | (1,219 | ) | (959 | ) | ||||||||||||||||||||||||||||||
| Cash dividends paid on preferred shares |
(136 | ) | (35 | ) | (46 | ) | (55 | ) | (136 | ) | (42 | ) | (27 | ) | (34 | ) | (33 | ) | ||||||||||||||||||||||||||||||
| Cash dividends paid by subsidiaries to non-controlling interest |
(35 | ) | (13 | ) | (1 | ) | (21 | ) | (39 | ) | (3 | ) | (11 | ) | (14 | ) | (11 | ) | ||||||||||||||||||||||||||||||
| Acquisition and other costs paid |
5 | - | 5 | - | 10 | 3 | 1 | 3 | 3 | |||||||||||||||||||||||||||||||||||||||
| Free cash flow |
1,855 | 754 | 1,016 | 85 | 3,067 | 376 | 642 | 1,333 | 716 | |||||||||||||||||||||||||||||||||||||||
| Business acquisitions |
(220 | ) | 1 | (196 | ) | (25 | ) | (429 | ) | (287 | ) | (3 | ) | - | (139 | ) | ||||||||||||||||||||||||||||||||
| Business dispositions |
209 | 1 | 208 | - | 52 | (1 | ) | (1 | ) | 2 | 52 | |||||||||||||||||||||||||||||||||||||
| Acquisition and other costs paid |
(5 | ) | - | (5 | ) | - | (10 | ) | (3 | ) | (1 | ) | (3 | ) | (3 | ) | ||||||||||||||||||||||||||||||||
| Spectrum licences |
(159 | ) | (3 | ) | (145 | ) | (11 | ) | (3 | ) | - | (3 | ) | - | - | |||||||||||||||||||||||||||||||||
| Other investing activities |
(1 | ) | (16 | ) | (16 | ) | 31 | (4 | ) | (13 | ) | (8 | ) | 27 | (10 | ) | ||||||||||||||||||||||||||||||||
| (Decrease) increase in notes payable |
(484 | ) | (300 | ) | (101 | ) | (83 | ) | 111 | (511 | ) | (34 | ) | 187 | 469 | |||||||||||||||||||||||||||||||||
| (Decrease) increase in securitized receivables |
- | - | (500 | ) | 500 | 700 | - | 700 | - | - | ||||||||||||||||||||||||||||||||||||||
| Issue of long-term debt |
3,864 | 1,161 | 1,199 | 1,504 | 1,951 | 1,006 | - | - | 945 | |||||||||||||||||||||||||||||||||||||||
| Repayment of long-term debt |
(1,565 | ) | (920 | ) | (346 | ) | (299 | ) | (2,023 | ) | (250 | ) | (270 | ) | (245 | ) | (1,258 | ) | ||||||||||||||||||||||||||||||
| Repurchase of a financial liability |
(149 | ) | - | - | (149 | ) | - | - | - | - | - | |||||||||||||||||||||||||||||||||||||
| Issue of common shares |
18 | - | 8 | 10 | 171 | 2 | 1 | 7 | 161 | |||||||||||||||||||||||||||||||||||||||
| Purchase of shares for settlement of share-based payments |
(179 | ) | (44 | ) | (42 | ) | (93 | ) | (255 | ) | (49 | ) | (49 | ) | (51 | ) | (106 | ) | ||||||||||||||||||||||||||||||
| Repurchase of preferred shares |
(90 | ) | (27 | ) | (32 | ) | (31 | ) | (125 | ) | (10 | ) | - | - | (115 | ) | ||||||||||||||||||||||||||||||||
| Cash dividends paid on common shares |
(2,604 | ) | (883 | ) | (882 | ) | (839 | ) | (3,312 | ) | (839 | ) | (839 | ) | (839 | ) | (795 | ) | ||||||||||||||||||||||||||||||
| Other financing activities |
(20 | ) | (5 | ) | (7 | ) | (8 | ) | (31 | ) | (5 | ) | 2 | - | (28 | ) | ||||||||||||||||||||||||||||||||
| (1,385 | ) | (1,035 | ) | (857 | ) | 507 | (3,207 | ) | (960 | ) | (505 | ) | (915 | ) | (827 | ) | ||||||||||||||||||||||||||||||||
| Net increase (decrease) in cash |
470 | 119 | (201 | ) | 552 | (190 | ) | (484 | ) | (13 | ) | 418 | (111 | ) | ||||||||||||||||||||||||||||||||||
| Cash at beginning of period |
99 | 450 | 651 | 99 | 289 | 583 | 596 | 178 | 289 | |||||||||||||||||||||||||||||||||||||||
| Cash at end of period |
569 | 569 | 450 | 651 | 99 | 99 | 583 | 596 | 178 | |||||||||||||||||||||||||||||||||||||||
| Net (decrease) increase in cash equivalents |
- | (400 | ) | 360 | 40 | 50 | (100 | ) | 150 | - | - | |||||||||||||||||||||||||||||||||||||
| Cash equivalents at beginning of period |
50 | 450 | 90 | 50 | - | 150 | - | - | - | |||||||||||||||||||||||||||||||||||||||
| Cash equivalents at end of period |
50 | 50 | 450 | 90 | 50 | 50 | 150 | - | - | |||||||||||||||||||||||||||||||||||||||
BCE Supplementary Financial Information - Third Quarter 2023 Page 13
Accompanying Notes
| (1) | Effective Q1 2023, our results are now reported in two segments: Bell CTS and Bell Media. |
In 2022, we began modifying our internal and external reporting processes to align with organizational changes that were made to reflect an increasing strategic focus on multiproduct sales, the continually increasing technological convergence of our wireless and wireline telecommunications infrastructure and operations driven by the deployment of our Fifth Generation (5G) and fibre networks, and our digital transformation. These factors have made it increasingly difficult to distinguish between our wireless and wireline operations and resulted in changes in Q1 2023 to the financial information that is regularly provided to our chief operating decision maker to measure performance and allocate resources.
Effective with our Q1 2023 results, our previous Bell Wireless and Bell Wireline operating segments were combined to form a single reporting segment called Bell Communication and Technology Services (Bell CTS). Bell Media remains a distinct reportable segment and is unaffected. Our results are therefore reported in two segments: Bell CTS and Bell Media. As a result of our reporting changes, prior periods have been restated for comparative purposes.
Our Bell CTS segment provides a wide range of communication products and services to consumers, businesses and government customers across Canada. Wireless products and services include mobile data and voice plans and devices and are available nationally. Wireline products and services comprise data (including Internet access, IPTV, cloud-based services and business solutions), voice, and other communication services and products, which are available to our residential, small and medium-sized business and large enterprise customers primarily in Ontario, Québec, the Atlantic provinces and Manitoba, while satellite TV service and connectivity to business customers are available nationally across Canada. In addition, this segment includes our wholesale business, which buys and sells local telephone, long distance, data and other services from or to resellers and other carriers, as well as the results of operations of our national consumer electronics retailer, The Source (Bell) Electronics Inc. (The Source).
Our Bell Media segment provides conventional TV, specialty TV, pay TV, streaming services, digital media services, radio broadcasting services and OOH and advanced advertising services to customers nationally across Canada.
Furthermore, effective Q1 2023, as a result of the segment reporting changes impacting intersegment eliminations, ARPU has been updated and is defined as Bell CTS wireless external services revenues (previously wireless operating service revenues) divided by the average mobile phone subscriber base for the specified period, expressed as a dollar unit per month.
Throughout this report, we, us, our, BCE and the company mean, as the context may require, either BCE Inc. or, collectively, BCE Inc., Bell Canada, their subsidiaries, joint arrangements and associates. Bell means, as the context may require, either Bell Canada or, collectively, Bell Canada, its subsidiaries, joint arrangements and associates.
| (2) | Non-GAAP and other financial measures |
BCE uses various financial measures to assess its business performance. Certain of these measures are calculated in accordance with International Financial Reporting Standards (IFRS or GAAP) while certain other measures do not have a standardized meaning under GAAP. We believe that our GAAP financial measures, read together with adjusted non-GAAP and other financial measures, provide readers with a better understanding of how management assesses BCE’s performance.
National Instrument 52-112, Non-GAAP and Other Financial Measures Disclosure (NI 52-112), prescribes disclosure requirements that apply to the following specified financial measures:
| ● | Non-GAAP financial measures; |
| ● | Non-GAAP ratios; |
BCE Supplementary Financial Information – Third Quarter 2023 Page 14
| ● | Total of segments measures; |
| ● | Capital management measures; and |
| ● | Supplementary financial measures. |
This section provides a description and classification of the specified financial measures contemplated by NI 52-112 that we use in this report to explain our financial results except that, for supplementary financial measures, an explanation of such measures is provided where they are first referred to in this report if the supplementary financial measures’ labelling is not sufficiently descriptive.
| (2.1) | Non-GAAP financial measures |
A non-GAAP financial measure is a financial measure used to depict our historical or expected future financial performance, financial position or cash flow and, with respect to its composition, either excludes an amount that is included in, or includes an amount that is excluded from, the composition of the most directly comparable financial measure disclosed in BCE’s consolidated primary financial statements. We believe that non-GAAP financial measures are reflective of our on-going operating results and provide readers with an understanding of management’s perspective on and analysis of our performance.
Below are descriptions of the non-GAAP financial measures that we use in this report to explain our results. Except for adjusted net interest expense, for which a reconciliation is provided below, reconciliations to the most directly comparable IFRS financial measures on a consolidated basis are set out earlier in this report.
Adjusted net earnings
The term adjusted net earnings does not have any standardized meaning under IFRS. Therefore, it is unlikely to be comparable to similar measures presented by other issuers.
We define adjusted net earnings as net earnings attributable to common shareholders before severance, acquisition and other costs, net mark-to-market losses (gains) on derivatives used to economically hedge equity settled share-based compensation plans, net equity losses (gains) on investments in associates and joint ventures, net losses (gains) on investments, early debt redemption costs, impairment of assets and discontinued operations, net of tax and NCI.
We use adjusted net earnings and we believe that certain investors and analysts use this measure, among other ones, to assess the performance of our businesses without the effects of severance, acquisition and other costs, net mark-to-market losses (gains) on derivatives used to economically hedge equity settled share-based compensation plans, net equity losses (gains) on investments in associates and joint ventures, net losses (gains) on investments, early debt redemption costs, impairment of assets and discontinued operations, net of tax and NCI. We exclude these items because they affect the comparability of our financial results and could potentially distort the analysis of trends in business performance. Excluding these items does not imply they are non-recurring.
The most directly comparable IFRS financial measure is net earnings attributable to common shareholders. Refer to pages 2 and 3 of this report for a reconciliation of net earnings attributable to common shareholders to adjusted net earnings on a consolidated basis.
Adjusted net interest expense
The term adjusted net interest expense does not have any standardized meaning under IFRS. Therefore, it is unlikely to be comparable to similar measures presented by other issuers.
We define adjusted net interest expense as twelve-month trailing net interest expense as shown in our consolidated statements of cash flows, plus 50% of twelve-month trailing net earnings attributable to preferred shareholders as shown in our consolidated income statements.
BCE Supplementary Financial Information – Third Quarter 2023 Page 15
We use adjusted net interest expense as a component in the calculation of the adjusted EBITDA to adjusted net interest expense ratio, which is a capital management measure. For further details on the adjusted EBITDA to adjusted net interest expense ratio, see note 2.4, Capital management measures below. We use and believe that certain investors and analysts use the adjusted EBITDA to adjusted net interest expense ratio, among other measures, to evaluate the financial health of the company.
The most directly comparable IFRS financial measure is net interest expense. The following tables provide reconciliations of net interest expense to adjusted net interest expense on a consolidated basis.
| Q3 2023 | ||||
| Net interest expense (nine months ended September 30, 2023) | 1,034 | |||
| Net interest expense (year ended December 31, 2022) | 1,124 | |||
| Net interest expense (nine months ended September 30, 2022) | (805 | ) | ||
| 12-month trailing net interest expense (ended September 30, 2023) | 1,353 | |||
| 50% of net earnings attributable to preferred shareholders (nine months ended September 30, 2023) | 70 | |||
| 50% of net earnings attributable to preferred shareholders (year ended December 31, 2022) | 76 | |||
| 50% of net earnings attributable to preferred shareholders (nine months ended September 30, 2022) | (54 | ) | ||
| 50% of 12-month trailing net earnings attributable to preferred shareholders (ended September 30, 2023) | 92 | |||
| Adjusted net interest expense for the twelve months ended September 30, 2023 | 1,445 | |||
| Q2 2023 | ||||
| Net interest expense (six months ended June 30, 2023) | 676 | |||
| Net interest expense (year ended December 31, 2022) | 1,124 | |||
| Net interest expense (six months ended June 30, 2022) | (523 | ) | ||
| 12-month trailing net interest expense (ended June 30, 2023) | 1,277 | |||
| 50% of net earnings attributable to preferred shareholders (six months ended June 30, 2023) | 46 | |||
| 50% of net earnings attributable to preferred shareholders (year ended December 31, 2022) | 76 | |||
| 50% of net earnings attributable to preferred shareholders (six months ended June 30, 2022) | (35 | ) | ||
| 50% of 12-month trailing net earnings attributable to preferred shareholders (ended June 30, 2023) | 87 | |||
| Adjusted net interest expense for the twelve months ended June 30, 2023 | 1,364 | |||
BCE Supplementary Financial Information – Third Quarter 2023 Page 16
| Q1 2023 | ||||
| Net interest expense (three months ended March 31, 2023) | 330 | |||
| Net interest expense (year ended December 31, 2022) | 1,124 | |||
| Net interest expense (three months ended March 31, 2022) | (258 | ) | ||
| 12-month trailing net interest expense (ended March 31, 2023) | 1,196 | |||
| 50% of net earnings attributable to preferred shareholders (three months ended March 31, 2023) | 23 | |||
| 50% of net earnings attributable to preferred shareholders (year ended December 31, 2022) | 76 | |||
| 50% of net earnings attributable to preferred shareholders (three months ended March 31, 2022) | (17 | ) | ||
| 50% of 12-month trailing net earnings attributable to preferred shareholders (ended March 31, 2023) | 82 | |||
| Adjusted net interest expense for the twelve months ended March 31, 2023 | 1,278 | |||
| Q4 2022 | ||||
| Net interest expense | 1,124 | |||
| 50% of net earnings attributable to preferred shareholders | 76 | |||
| Adjusted net interest expense | 1,200 | |||
Free cash flow
The term free cash flow does not have any standardized meaning under IFRS. Therefore, it is unlikely to be comparable to similar measures presented by other issuers.
We define free cash flow as cash flows from operating activities, excluding cash from discontinued operations, acquisition and other costs paid (which include significant litigation costs) and voluntary pension funding, less capital expenditures, preferred share dividends and dividends paid by subsidiaries to NCI. We exclude cash from discontinued operations, acquisition and other costs paid and voluntary pension funding because they affect the comparability of our financial results and could potentially distort the analysis of trends in business performance. Excluding these items does not imply they are non-recurring.
We consider free cash flow to be an important indicator of the financial strength and performance of our businesses. Free cash flow shows how much cash is available to pay dividends on common shares, repay debt and reinvest in our company. We believe that certain investors and analysts use free cash flow to value a business and its underlying assets and to evaluate the financial strength and performance of our businesses. The most directly comparable IFRS financial measure is cash flows from operating activities. Refer to pages 10, 12 and 13 of this report for a reconciliation of cash flows from operating activities to free cash flow on a consolidated basis.
Net debt
The term net debt does not have any standardized meaning under IFRS. Therefore, it is unlikely to be comparable to similar measures presented by other issuers.
We define net debt as debt due within one year plus long-term debt and 50% of preferred shares, less cash and cash equivalents, as shown in BCE’s consolidated statements of financial position. We include 50% of outstanding preferred shares in our net debt as it is consistent with the treatment by certain credit rating agencies.
We consider net debt to be an important indicator of the company’s financial leverage because it represents the amount of debt that is not covered by available cash and cash equivalents. We believe that certain investors and analysts use net debt to determine a company’s financial leverage.
BCE Supplementary Financial Information – Third Quarter 2023 Page 17
Net debt is calculated using several asset and liability categories from the statements of financial position. The most directly comparable IFRS financial measure is long-term debt. Refer to page 10 of this report for a reconciliation of long-term debt to net debt on a consolidated basis.
| (2.2) | Non-GAAP ratios |
A non-GAAP ratio is a financial measure disclosed in the form of a ratio, fraction, percentage or similar representation and that has a non-GAAP financial measure as one or more of its components.
Adjusted EPS
The term adjusted EPS does not have any standardized meaning under IFRS. Therefore, it is unlikely to be comparable to similar measures presented by other issuers.
We define adjusted EPS as adjusted net earnings per BCE common share. Adjusted net earnings is a non-GAAP financial measure. For further details on adjusted net earnings, see note 2.1 – Non-GAAP financial measures above.
We use adjusted EPS, and we believe that certain investors and analysts use this measure, among other ones, to assess the performance of our businesses without the effects of severance, acquisition and other costs, net mark-to-market losses (gains) on derivatives used to economically hedge equity settled share-based compensation plans, net equity losses (gains) on investments in associates and joint ventures, net losses (gains) on investments, early debt redemption costs, impairment of assets and discontinued operations, net of tax and NCI. We exclude these items because they affect the comparability of our financial results and could potentially distort the analysis of trends in business performance. Excluding these items does not imply they are non-recurring.
| (2.3) | Total of segments measures |
A total of segments measure is a financial measure that is a subtotal or total of 2 or more reportable segments and is disclosed within the Notes to BCE’s consolidated primary financial statements.
Adjusted EBITDA
We define adjusted EBITDA as operating revenues less operating costs as shown in BCE’s consolidated income statements.
The most directly comparable IFRS financial measure is net earnings. The following table provides reconciliations of net earnings to adjusted EBITDA on a consolidated basis.
| YTD 2023 | Q3 2023 | Q2 2023 | Q1 2023 | Total 2022 | Q4 2022 | YTD 2022 | Q3 2022 | Q2 2022 | Q1 2022 | |||||||||||||||||||||||||||||||
| Net earnings | 1,892 | 707 | 397 | 788 | 2,926 | 567 | 2,359 | 771 | 654 | 934 | ||||||||||||||||||||||||||||||
| Severance, acquisition and other costs | 159 | 10 | 100 | 49 | 94 | 19 | 75 | 22 | 40 | 13 | ||||||||||||||||||||||||||||||
| Depreciation | 2,791 | 937 | 936 | 918 | 3,660 | 922 | 2,738 | 914 | 933 | 891 | ||||||||||||||||||||||||||||||
| Amortization | 874 | 295 | 296 | 283 | 1,063 | 270 | 793 | 267 | 266 | 260 | ||||||||||||||||||||||||||||||
| Finance costs | ||||||||||||||||||||||||||||||||||||||||
| Interest expense |
1,076 | 373 | 359 | 344 | 1,146 | 319 | 827 | 298 | 269 | 260 | ||||||||||||||||||||||||||||||
| Net return on post-employment benefit plans |
(81 | ) | (27 | ) | (27 | ) | (27 | ) | (51 | ) | (13 | ) | (38 | ) | (13 | ) | (7 | ) | (18 | ) | ||||||||||||||||||||
| Impairment of assets | 34 | - | - | 34 | 279 | 150 | 129 | 21 | 106 | 2 | ||||||||||||||||||||||||||||||
| Other expense (income) | 319 | 129 | 311 | (121 | ) | 115 | (19 | ) | 134 | 130 | 97 | (93 | ) | |||||||||||||||||||||||||||
| Income taxes | 786 | 243 | 273 | 270 | 967 | 222 | 745 | 178 | 232 | 335 | ||||||||||||||||||||||||||||||
| Adjusted EBITDA | 7,850 | 2,667 | 2,645 | 2,538 | 10,199 | 2,437 | 7,762 | 2,588 | 2,590 | 2,584 | ||||||||||||||||||||||||||||||
BCE Supplementary Financial Information – Third Quarter 2023 Page 18
| (2.4) | Capital management measures |
A capital management measure is a financial measure that is intended to enable a reader to evaluate our objectives, policies and processes for managing our capital and is disclosed within the Notes to BCE’s consolidated financial statements.
The financial reporting framework used to prepare the financial statements requires disclosure that helps readers assess the company’s capital management objectives, policies, and processes, as set out in IFRS in IAS 1 – Presentation of Financial Statements. BCE has its own methods for managing capital and liquidity, and IFRS does not prescribe any particular calculation method.
Adjusted EBITDA to adjusted net interest expense ratio
The adjusted EBITDA to adjusted net interest expense ratio represents adjusted EBITDA divided by adjusted net interest expense. For the purposes of calculating our adjusted EBITDA to adjusted net interest expense ratio, adjusted EBITDA is twelve-month trailing adjusted EBITDA. Adjusted net interest expense used in the calculation of the adjusted EBITDA to adjusted net interest expense ratio is a non-GAAP financial measure defined as twelve-month trailing net interest expense as shown in our consolidated statements of cash flows, plus 50% of twelve-month trailing net earnings attributable to preferred shareholders as shown in our consolidated income statements. For further details on adjusted net interest expense, see note 2.1, Non-GAAP financial measures above.
We use, and believe that certain investors and analysts use, the adjusted EBITDA to adjusted net interest expense ratio, among other measures, to evaluate the financial health of the company.
Net debt leverage ratio
The net debt leverage ratio represents net debt divided by adjusted EBITDA. Net debt used in the calculation of the net debt leverage ratio is a non-GAAP financial measure. For further details on net debt, see note 2.1, Non-GAAP financial measures above. For the purposes of calculating our net debt leverage ratio, adjusted EBITDA is twelve-month trailing adjusted EBITDA.
We use, and believe that certain investors and analysts use, the net debt leverage ratio as a measure of financial leverage.
| (2.5) | Supplementary financial measures |
A supplementary financial measure is a financial measure that is not reported in BCE’s consolidated financial statements, and is, or is intended to be, reported periodically to represent historical or expected future financial performance, financial position, or cash flows.
An explanation of such measures is provided where they are first referred to in this report if the supplementary financial measures’ labelling is not sufficiently descriptive.
| (3) | Key performance indicators (KPIs) |
In addition to the non-GAAP financial measures and other financial measures described previously, we use the following KPIs to measure the success of our strategic imperatives. These KPIs are not accounting measures and may not be comparable to similar measures presented by other issuers.
Adjusted EBITDA margin is defined as adjusted EBITDA divided by operating revenues.
Capital intensity is defined as capital expenditures divided by operating revenues.
Mobile phone blended ARPU is defined as Bell CTS wireless external services revenues divided by the average mobile phone subscriber base for the specified period, expressed as a dollar unit per month.
BCE Supplementary Financial Information – Third Quarter 2023 Page 19
Mobile phone churn is the rate at which existing mobile phone subscribers cancel their services. It is a measure of our ability to retain our customers. Mobile phone churn is calculated by dividing the number of mobile phone deactivations during a given period by the average number of mobile phone subscribers in the base for the specified period and is expressed as a percentage per month.
Mobile phone subscriber unit is comprised of a recurring revenue generating portable unit (e.g. smartphones and feature phones) on an active service plan, that has access to our wireless networks and includes voice, text and/or data connectivity. We report mobile phone subscriber units in two categories: postpaid and prepaid. Prepaid mobile phone subscriber units are considered active for a period of 90 days following the expiry of the subscriber’s prepaid balance.
Mobile connected device subscriber unit is comprised of a recurring revenue generating portable unit (e.g. tablets, wearables, mobile Internet devices and Internet of Things) on an active service plan, that has access to our wireless networks and is intended for limited or no cellular voice capability.
Wireline subscriber unit consists of an active revenue-generating unit with access to our services, including retail Internet, satellite TV, IPTV, and/or residential NAS. A subscriber is included in our subscriber base when the service has been installed and is operational at the customer premise and a billing relationship has been established.
| ● | Retail Internet, IPTV and satellite TV subscribers have access to stand-alone services, and are primarily represented by a dwelling unit |
| ● | Retail residential NAS subscribers are based on a line count and are represented by a unique telephone number |
BCE Supplementary Financial Information – Third Quarter 2023 Page 20
Exhibit 99.4

Form 52-109F2 – Certification of Interim Filings - Full Certificate
I, Mirko Bibic, President and Chief Executive Officer of BCE Inc., certify the following:
1. Review: I have reviewed the interim financial report and interim MD&A (together, the “interim filings”) of BCE Inc. (the “issuer”) for the interim period ended September 30, 2023.
2. No misrepresentations: Based on my knowledge, having exercised reasonable diligence, the interim filings do not contain any untrue statement of a material fact or omit to state a material fact required to be stated or that is necessary to make a statement not misleading in light of the circumstances under which it was made, with respect to the period covered by the interim filings.
3. Fair presentation: Based on my knowledge, having exercised reasonable diligence, the interim financial report together with the other financial information included in the interim filings fairly present in all material respects the financial condition, financial performance and cash flows of the issuer, as of the date of and for the periods presented in the interim filings.
4. Responsibility: The issuer’s other certifying officer(s) and I are responsible for establishing and maintaining disclosure controls and procedures (DC&P) and internal control over financial reporting (ICFR), as those terms are defined in National Instrument 52-109 Certification of Disclosure in Issuers’ Annual and Interim Filings, for the issuer.
5. Design: Subject to the limitations, if any, described in paragraphs 5.2 and 5.3, the issuer’s other certifying officer(s) and I have, as at the end of the period covered by the interim filings
| A. | designed DC&P, or caused it to be designed under our supervision, to provide reasonable assurance that |
| I. | material information relating to the issuer is made known to us by others, particularly during the period in which the interim filings are being prepared; and |
| II. | information required to be disclosed by the issuer in its annual filings, interim filings or other reports filed or submitted by it under securities legislation is recorded, processed, summarized and reported within the time periods specified in securities legislation; and |
| B. | designed ICFR, or caused it to be designed under our supervision, to provide reasonable assurance regarding the reliability of financial reporting and the preparation of financial statements for external purposes in accordance with the issuer’s GAAP. |
5.1 Control framework: The control framework the issuer’s other certifying officer(s) and I used to design the issuer’s ICFR is the Internal Control-Integrated Framework (2013) issued by the Committee of Sponsoring Organizations of the Treadway Commission (COSO).
5.2 N/A
5.3 N/A
6. Reporting changes in ICFR: The issuer has disclosed in its interim MD&A any change in the issuer’s ICFR that occurred during the period beginning on July 1, 2023 and ended on September 30, 2023 that has materially affected, or is reasonably likely to materially affect, the issuer’s ICFR.
Date: November 2, 2023
| (signed) Mirko Bibic | ||
| Mirko Bibic | ||
| President and Chief Executive Officer |
Form 52-109F2 – Certification of Interim Filings - Full Certificate
I, Curtis Millen, Executive Vice-President and Chief Financial Officer of BCE Inc., certify the following:
1. Review: I have reviewed the interim financial report and interim MD&A (together, the “interim filings”) of BCE Inc. (the “issuer”) for the interim period ended September 30, 2023.
2. No misrepresentations: Based on my knowledge, having exercised reasonable diligence, the interim filings do not contain any untrue statement of a material fact or omit to state a material fact required to be stated or that is necessary to make a statement not misleading in light of the circumstances under which it was made, with respect to the period covered by the interim filings.
3. Fair presentation: Based on my knowledge, having exercised reasonable diligence, the interim financial report together with the other financial information included in the interim filings fairly present in all material respects the financial condition, financial performance and cash flows of the issuer, as of the date of and for the periods presented in the interim filings.
4. Responsibility: The issuer’s other certifying officer(s) and I are responsible for establishing and maintaining disclosure controls and procedures (DC&P) and internal control over financial reporting (ICFR), as those terms are defined in National Instrument 52-109 Certification of Disclosure in Issuers’ Annual and Interim Filings, for the issuer.
5. Design: Subject to the limitations, if any, described in paragraphs 5.2 and 5.3, the issuer’s other certifying officer(s) and I have, as at the end of the period covered by the interim filings
| A. | designed DC&P, or caused it to be designed under our supervision, to provide reasonable assurance that |
| I. | material information relating to the issuer is made known to us by others, particularly during the period in which the interim filings are being prepared; and |
| II. | information required to be disclosed by the issuer in its annual filings, interim filings or other reports filed or submitted by it under securities legislation is recorded, processed, summarized and reported within the time periods specified in securities legislation; and |
| B. | designed ICFR, or caused it to be designed under our supervision, to provide reasonable assurance regarding the reliability of financial reporting and the preparation of financial statements for external purposes in accordance with the issuer’s GAAP. |
5.1 Control framework: The control framework the issuer’s other certifying officer(s) and I used to design the issuer’s ICFR is the Internal Control-Integrated Framework (2013) issued by the Committee of Sponsoring Organizations of the Treadway Commission (COSO).
5.2 N/A
5.3 N/A
6. Reporting changes in ICFR: The issuer has disclosed in its interim MD&A any change in the issuer’s ICFR that occurred during the period beginning on July 1, 2023 and ended on September 30, 2023 that has materially affected, or is reasonably likely to materially affect, the issuer’s ICFR.
Date: November 2, 2023
| (signed) Curtis Millen | ||
| Curtis Millen | ||
| Executive Vice-President and Chief Financial Officer |
Exhibit 99.5

|

|
This news release contains forward-looking statements. For a description of the related risk factors and assumptions, please see the section entitled “Caution Regarding Forward-Looking Statements” later in this news release. The information contained in this news release is unaudited.
BCE reports third quarter 2023 results
| ● | 3.1% consolidated adjusted EBITDA1 growth delivered 0.9 percentage-point increase in adjusted EBITDA margin2 to 43.9% — best quarterly result since Q2 2022 |
| ● | Net earnings of $707 million down 8.3% with net earnings attributable to common shareholders of $640 million, down 10.5% or $0.70 per common share; adjusted net earnings1 of $741 million yielded adjusted EPS1 of $0.81, down 8.0% reflecting higher interest expense, increased depreciation and amortization and higher income taxes |
| ● | Cash flows from operating activities down 1.8% to $1,961 million; stronger Q3 free cash flow1 growth trajectory as profiled in 2023 quarterly budget, increasing 17.4% to $754 million on strong adjusted EBITDA flow-through and lower capital expenditures |
| ● | Strong wireless performance with 231,212 total mobile phone and connected device net subscriber activations3 — second-best ever quarterly result; 3.9% wireless service revenue growth as blended average revenue per user remains essentially stable in a competitive market |
| ● | Record quarter for fibre Internet net activations of 104,159, up 7.9%, driving total retail Internet net activations of 79,327 and 6.1% residential Internet revenue growth; on track to achieve 85% planned broadband buildout target4 by year end |
| ● | Bell Media adjusted EBITDA up 11.5% on lower operating costs and restructuring initiatives as total revenue declined 1.3% due to ongoing advertising recession; digital revenue5 up 26% as digital platforms and advertising technology drive digital advertising market share growth |
| ● | Reconfirming all 2023 financial guidance targets |
MONTRÉAL, November 2, 2023 – BCE Inc. (TSX, NYSE: BCE) today reported results for the third quarter (Q3) of 2023.
“The Bell team has demonstrated continued operational excellence, delivering results that place us in a solid position as we look ahead to the end of the year,” said Mirko Bibic, President and CEO of BCE and Bell Canada.
“Bell’s Q3 results reflect the positive outcome of our significant investments in broadband networks and services, a clear preference by our customers for fibre, continued momentum in our core operations, and cost containment and discipline.
1 Adjusted EBITDA is a total of segments measure, adjusted net earnings and free cash flow are non-GAAP financial measures and adjusted EPS is a non-GAAP ratio. Refer to the Non-GAAP and Other Financial Measures section in this news release for more information on these measures.
2 Adjusted EBITDA margin is defined as adjusted EBITDA divided by operating revenues. Refer to the Key Performance Indicators (KPIs) section in this news release for more information on adjusted EBITDA margin.
3 Refer to the Key Performance Indicators (KPIs) section in this news release for more information on subscriber (or customer) units.
4 Baseline broadband buildout program based on planned coverage footprint of approximately 10 million residential and business locations.
5 Digital revenues are comprised of advertising revenue from digital platforms including web sites, mobile apps, connected TV apps and out-of-home (OOH) digital assets/platforms, as well as advertising procured through Bell digital buying platforms and subscription revenue from direct-to-consumer services and video-on-demand services.
1/17
Our continued investments in building high-quality networks and delivering the services that our customers want continues to pay off with a record quarter for fibre Internet net activations of 104,159, up 7.9% over last year. We are continuing to grow in wireless with 231,212 total mobile phone and connected device net subscriber activations, 142,886 of which are postpaid net subscriber activations, representing our second highest Q3 result since 2010.
I’m pleased with our overall progress this quarter. With healthy subscriber growth across the board, consistent results and disciplined execution, I’m confident in the Bell team’s ability to continue delivering on our strategic priorities in the months ahead.”
KEY BUSINESS DEVELOPMENTS
New BCE Director; BCE executive team update
BCE welcomes Johan Wibergh to the Board of Directors. Mr. Wibergh is the former Chief Technology and Information Officer of Vodafone, a global telecommunications provider, and former EVP & Head of Business Unit Networks for Ericsson. Sean Cohan joined BCE as President, Bell Media following the retirement of Wade Oosterman. Mr. Cohan will join BCE’s executive leadership team.
Building the best networks and providing greater access
PCMag recognized Bell as the Best Major and Best All-Around ISP in Canada in PCMag’s Best ISPs 2023 Canada report.6 This achievement is based on Internet speed as well as price, coverage and customer satisfaction. Bell expanded availability of its 3 gigabits per second symmetrical Internet service, Giga Hub and Wi-Fi 6E pods to Manitoba. As part of the Dibaajimowin Project, administered by the Grand Council Treaty #3, Bell will provide broadband fibre-optic Internet access to 23 Indigenous and 13 non-Indigenous communities in Northwestern Ontario. Bell, Virgin Plus and Lucky Mobile customers now have mobile service in Toronto’s TTC subway tunnels and stations with network access, with more coverage areas to come.
5G leadership and technology innovation
As a member of the 5G Future Forum, Bell partnered with Verizon, Vodafone and independent software vendor Matsuko to successfully conduct the first live transatlantic holographic collaborative meeting in Canada, the U.S. and the UK using 5G and multi-access edge computing (MEC) technology.
Delivering the most compelling content
Bell Media entered into a definitive agreement to purchase the Canadian business of OUTFRONT Media to bolster its out-of-home presence across the country. Bell Media and FOX Entertainment Global forged a new licensing and distribution pact to support Canadian original productions for all Bell Media platforms, including CTV and Crave, and in the U.S. for FOX.
Bell Media launched Addressable Audio and Addressable TV, delivering tailored ads to radio and TV audiences across linear programming and on-demand content. TSN+ announced subscription options with a full slate of content including NFL RedZone and PGA Tour Live. The 2023 NFL season is now available across TSN, TSN+, RDS and CTV. RDS, the official French-language broadcaster of the Montréal Canadiens, Ottawa Senators, and Laval Rocket, announced 17 brand partners for the 2023-2024 Hockey Season. Bell Media discontinued operations of specialty channel VRAK after 23 years on the air.
2/17
Bell for Better: Better World, Better Communities, Better Workplace
To underscore Bell’s continued focus on environmental, social and governance (ESG) priorities, it has amended its existing Cdn $2.3 billion securitization program to add sustainability-linked pricing. 75 electric vehicle chargers were added to workplaces across Québec, advancing Bell’s plans to electrify its fleet. Bell was recognized with a 2024 Clean50 Top Project Award7 for its halocarbon free, energy-efficient computer room cooling project. To mark Mental Illness Awareness Week, Bell Let’s Talk announced the 115 recipients of the 2023 Bell Let’s Talk Community Fund with a focus on organizations providing housing supports including Street Haven, an emergency shelter for women in Toronto. The Bell Let’s Talk fund also gifted $1 million to IWK Health in Halifax for a dedicated mental health space in the children’s hospital’s emergency department. Bell welcomed more than 120 new grads as part of its 2023 Graduate Leadership Program.
6 PCMag delivers labs-based, independent reviews of the latest technology products and services. Bell was named the Best Major and All Around ISP in PCMag’s Best ISPs 2023 Canada report based on ratings for speed, coverage price and overall satisfaction. The results are based on 331,078 PCMag speed test results from Canadian ISP users received between June 1, 2022 and June 27, 2023. Full methodology can be found at: https://www.pcmag.com/articles/best-isps-methodology.
7 The Clean50 Awards were founded by Delta Management Group, a sustainability, ESG and clean tech focused search firm in Canada, in June 2011 and have been awarded annually since. Selection is primarily by Delta Management, with significant assistance by third-party advisors and based on detailed submissions by nominees. Clean50 Top Projects annually recognize projects completed in the prior two years based on their innovation, ability to inform and inspire other Canadians.
BCE RESULTS
Financial Highlights
| ($ millions except per share amounts) (unaudited) | Q3 2023 | Q3 2022 | % change | |||||||||
|
BCE |
||||||||||||
| Operating revenues |
6,080 | 6,024 | 0.9% | |||||||||
| Net earnings |
707 | 771 | (8.3%) | |||||||||
| Net earnings attributable to common shareholders |
640 | 715 | (10.5%) | |||||||||
| Adjusted net earnings |
741 | 801 | (7.5%) | |||||||||
| Adjusted EBITDA |
2,667 | 2,588 | 3.1% | |||||||||
| Net earnings per common share (EPS) |
0.70 | 0.78 | (10.3%) | |||||||||
| Adjusted EPS |
0.81 | 0.88 | (8.0%) | |||||||||
| Cash flows from operating activities |
1,961 | 1,996 | (1.8%) | |||||||||
| Capital expenditures |
(1,159) | (1,317) | 12.0% | |||||||||
|
Free cash flow |
754 | 642 | 17.4% | |||||||||
“Our Q3 consolidated financial performance again highlights the Bell team’s consistent execution and disciplined focus on profitable subscriber growth and cost management. We delivered adjusted EBITDA growth of 3.1% — our highest growth since Q2 2022 – reflecting a well-rounded performance across our core business with strong 6.1% residential Internet revenue growth, 4.7% higher consumer wireless service revenue, digital media revenue up 26% over last year and a close to 1% improvement in total operating costs,” said Curtis Millen, Chief Financial Officer of BCE and Bell Canada.
3/17
“With year-to-date consolidated financial results in line with budget, we’re in a great position heading into the end of the year. We remain firmly on strategy, disciplined in our execution and focused on driving costs out of the business as required to align with the revenue profiles of each of our operating segments. I’m pleased to reconfirm all our 2023 financial guidance targets.”
| ● | BCE operating revenue increased 0.9% over Q3 2022 to $6,080 million. This was the result of 1.7% higher service revenue of $5,281 million, driven by wireless and residential Internet subscriber growth and the financial contribution from acquisitions made over the past year, including Distributel and FX Innovation, partly offset by a 3.9% decline in product revenue, driven mainly by timing-related reductions in sales to large business customers and lower consumer electronics sales at The Source, as well as lower media revenue due to the ongoing advertising recession. |
| ● | Net earnings decreased 8.3% to $707 million and net earnings attributable to common shareholders totalled $640 million, or $0.70 per share, down 10.5% and 10.3% respectively. The declines were due to higher interest expense, increased depreciation and amortization expense and higher income taxes, due mainly to the favourable resolution of uncertain tax positions in Q3 2022 related to our acquisition of MTS. These factors were partly offset by higher adjusted EBITDA, lower impairment of assets as we recorded a $21 million charge in Q3 2022 related to office spaces we ceased using as part of our real estate optimization strategy due to Bell’s hybrid work policy, a higher net return on post-employment benefit plans, and lower severance, acquisition and other costs. Adjusted net earnings were down 7.5% to $741 million, resulting in a 8.0% decrease in adjusted EPS to $0.81. |
| ● | Adjusted EBITDA grew 3.1% to $2,667 million, reflecting increases of 2.4% at Bell Communication and Technology Services (Bell CTS) and 11.5% at Bell Media. Due mainly to the flow-through of high-margin service revenue at Bell CTS, the favourable impact of various cost reduction initiatives and other operating efficiencies across the organization, and a year-over-year decrease in low-margin business wireline product sales, BCE’s consolidated adjusted EBITDA margin increased 0.9 percentage points to 43.9% from 43.0% in Q3 2022. |
| ● | BCE capital expenditures were $1,159 million, down 12.0% from $1,317 million last year, corresponding to a capital intensity8 of 19.1%, compared to 21.9% in Q3 2022. The year-over-year decrease in capital spending was due mainly to the timing of planned investment to further expand Bell’s pure fibre network and the realization of buildout efficiencies as we deploy broadband fibre and mobile standalone 5G network infrastructure more deeply. |
| ● | BCE cash flows from operating activities were $1,961 million, down 1.8% from Q3 2022, due mainly to higher interest paid and lower cash from working capital attributable partly to the timing of supplier payments, partly offset by higher adjusted EBITDA. |
| ● | Free cash flow increased 17.4% to $754 million from $642 million in Q3 2022, despite decreased cash flows from operating activities excluding acquisition and other costs paid, driven by lower capital expenditures as described above. |
8 Capital intensity is defined as capital expenditures divided by operating revenues. Refer to the Key Performance Indicators (KPIs) section in this news release for more information on capital intensity.
4/17
OPERATING RESULTS BY SEGMENT
Bell Communication and Technology Services (Bell CTS)
| ● | Total Bell CTS operating revenue increased 1.1% to $5,461 million. |
| ● | Service revenue was up 2.0% to $4,662 million, driven mainly by continued strong mobile phone, mobile connected device and retail Internet subscriber base growth, higher wireless roaming revenue, higher sales of security and cloud-focused managed and professional services to large enterprise customers, as well as the financial contribution from acquisitions made over the past year including Distributel and FX Innovation. This was partly offset by ongoing declines in legacy voice, data and satellite TV services, greater acquisition, retention and bundle discounts on residential home services compared to Q3 last year, and lower overage revenue as a result of more mobile phone customers subscribing to unlimited and larger capacity data rate plans. |
| ● | Product revenue decreased 3.9% to $799 million, due mainly to the timing of mobile device and land mobile radio systems sales to large enterprise customers in the government sector, the lapping of business wireline data equipment supply chain shortages that began to alleviate in Q3 2022, and lower consumer electronics sales at The Source. |
| ● | Bell CTS adjusted EBITDA grew 2.4% to $2,464 million, yielding a 0.6 percentage-point margin increase to 45.1% from 44.5% in Q3 2022. This was driven by the flow-through of higher year-over-year service revenue and a lower revenue mix of low-margin product sales as operating costs were essentially stable compared to last year, increasing by 0.1%. |
| ● | Postpaid mobile phone net subscriber9 activations totaled 142,886, representing our second-best Q3 result since 2010. This was down 14.8% from a record Q3 result in 2022 of 167,798, reflecting an increase in mobile phone postpaid customer churn9 to 1.1% from 0.9% in Q3 2022 as a result of greater overall competitive market activity and promotional offer intensity compared to last year. This was partly offset by 8.2% higher gross subscriber activations, driven by immigration growth, continued 5G and multi-product bundling momentum, effective promotions and stronger Virgin Plus performance following a repositioning of that brand, which included a fresh new look and new value proposition, centred around the pillars of affordability, member rewards, inclusiveness and network quality. |
| ● | Bell’s prepaid mobile phone customer9 net subscriber activations decreased to 24,044 from 56,545 in Q3 2022. This result was due to 6.3% lower gross activations and higher customer churn, which increased to 5.1% from 4.58% last year, reflecting attractive promotional offers and availability of mobile 5G service on postpaid discount brands. |
| ● | Bell’s mobile phone customer base totalled 10,194,961 at the end of Q3 2023, a 3.8% increase over last year, comprised of 9,294,115 postpaid subscribers, up 4.2%, and 900,846 prepaid customers, down 1.1%. |
| ● | Mobile phone blended ARPU10 was down 0.2% to $60.28 from $60.39 in Q3 2022, reflecting lower overage revenue from customers subscribing to unlimited and larger capacity data rate plans and competitive pressures on base rate plan pricing. |
| ● | Mobile connected device net activations totaled 64,282, up 31.1% from 49,044 in Q3 2022, driven by stronger customer demand for Bell IoT services, including business solutions and connected car subscriptions, and fewer data device deactivations. At the end of Q3 2023, mobile connected device subscribers9 totalled 2,653,802, a 13.1% increase over last year. |
| ● | Bell added 79,327 net new retail Internet subscribers,9 compared to 89,652 in Q3 last year. The year-over-year decrease partly reflects higher customer deactivations in our copper service areas attributable to aggressive promotional offers by competitors offering cable, fixed wireless and satellite Internet services. Within Bell’s all-fibre footprint, retail Internet net |
5/17
| activations were a quarterly record 104,159, up 7.9% over Q3 2022, driven by the ongoing expansion of Bell’s fibre footprint, increased customer penetration of tenured fibre footprint, and a focus on bundled offerings with mobile service. Retail Internet subscribers totalled 4,417,838 at the end of Q3, a 8.6% increase from last year. |
| ● | Bell TV added 35,976 net new retail IPTV subscribers,9 down from 38,093 in Q3 2022. Despite higher gross activations, the year-over-year decrease was due mainly to higher customer deactivations, primarily on our app streaming service, attributable to more customers with expired promotional offers. At the end of Q3, Bell served 2,046,805 retail IPTV subscribers, a 5.2% increase over last year. |
| ● | Retail satellite TV net subscriber9 losses were 31,754, up from 27,240 in Q3 2022, due to fewer gross activations and higher customer churn driven by increased competitor promotional offer intensity. Bell’s retail satellite TV customer base totalled 680,805 at the end of Q3, down 13.8% from last year. |
| ● | Retail residential NAS9 net losses improved by 2.5% to 41,776, reflecting our success in driving higher gross activations through bundled service offerings. Bell’s retail residential NAS customer base totalled 2,059,964 at the end of Q3, down 4.8% from last year. |
9 Refer to the Key Performance Indicators (KPIs) section in this news release for more information on churn and subscriber (or customer) units.
10 Effective Q1 2023, as a result of the segment reporting changes impacting intersegment eliminations, ARPU has been updated and is defined as Bell CTS wireless external services revenues (previously wireless operating service revenues) divided by the average mobile phone subscriber base for the specified period, expressed as a dollar unit per month. Refer to the Key Performance Indicators (KPIs) section in this news release for more information on blended ARPU.
Bell Media
| ● | Media operating revenue decreased 1.3% to $710 million as a result of lower year-over-year advertising revenue, partly offset by higher subscriber revenue. |
| ● | Advertising revenue was down 5.2%, as advertiser demand and spending, particularly for TV, continued to be impacted by ongoing unfavourable economic conditions as well as the Hollywood actors’ and writers’ strikes. This was moderated by growth in digital advertising as we further leverage our content and digital platforms together with targeted advertising capabilities and technology to grow digital market share. |
| ● | Total digital revenues grew 26%, the result of ongoing Crave and sports streaming direct-to-consumer growth and increased advertising bookings from Bell Media’s strategic audience management (SAM) TV media sales tool. Crave subscriptions totalled approximately 3.1 million customers, including direct-to-consumer streaming subscriber growth of 13% over last year. |
| ● | Subscriber revenue increased 2.9% on continued strong Crave and sports direct-to-consumer streaming growth. |
| ● | Adjusted EBITDA was up 11.5% to $203 million, delivering a 3.3 percentage-point increase in margin to 28.6%. Notwithstanding lower year-over-year revenue, this result was driven by a 5.6% decline in operating costs, reflecting lower TV programming costs despite contractual increases for premium content, due to the Hollywood actors’ and writers’ strikes, restructuring initiatives undertaken in Q2 2023 in light of the unfavourable economic and broadcasting regulatory environments, and the cessation of CRTC Part II fees in April 2023. |
| ● | TSN was Canada’s number one sports network and was the top specialty channel overall in Q3 among adults aged 25-54. |
| ● | Bell Media was ranked number one in full-day viewership in the French-language entertainment and pay specialty market among adults aged 25-54 for the 2022-2023 broadcast year. RDS remained the top-ranked French-language non-news specialty channel. |
6/17
COMMON SHARE DIVIDEND
BCE’s Board of Directors has declared a quarterly dividend of $0.9675 per common share, payable on January 15, 2024 to shareholders of record at the close of business on December 15, 2023.
OUTLOOK FOR 2023
BCE confirmed its financial guidance targets for 2023, as provided on February 2, 2023, as follows:
| 2022 Results | 2023 Guidance | |||||
|
Revenue growth |
3.1% | 1% to 5% | ||||
|
Adjusted EBITDA growth |
3.1% | 2% to 5% | ||||
|
Capital intensity |
21.2% | 19% to 20% | ||||
|
Adjusted EPS growth |
5.0% | (3%) to (7%) | ||||
|
Free cash flow growth |
2.9% | 2% to 10% | ||||
|
Annualized common dividend per share |
$3.68 | $3.87 | ||||
For 2023, we expect lower tax adjustments, higher depreciation and amortization expense and increased interest expense to drive lower adjusted EPS compared to 2022. For 2023, we expect growth in adjusted EBITDA, a reduction in contributions to post-employment benefit plans and payments under other post-employment benefit plans, and lower capital expenditures will drive higher free cash flow.
Please see the section entitled “Caution Regarding Forward-Looking Statements” later in this news release for a description of the principal assumptions on which BCE’s 2023 financial guidance targets are based, as well as the principal related risk factors.
CALL WITH FINANCIAL ANALYSTS
BCE will hold a conference call with the financial community to discuss Q3 2023 results on Thursday, November 2 at 8:00 am eastern. Media are welcome to participate on a listen-only basis. To participate, please dial toll-free 1-844-933-2401 or 647-724-5455. A replay will be available until midnight on November 30, 2023 by dialing 1-844-933-2401 or 647-724-5455 and entering passcode 9522322#. A live audio webcast of the conference call will be available on BCE’s website at BCE Q3 2023 conference call.
NON-GAAP AND OTHER FINANCIAL MEASURES
BCE uses various financial measures to assess its business performance. Certain of these measures are calculated in accordance with International Financial Reporting Standards (IFRS or GAAP) while certain other measures do not have a standardized meaning under GAAP. We believe that our GAAP financial measures, read together with adjusted non-GAAP and other financial measures, provide readers with a better understanding of how management assesses BCE’s performance.
7/17
National Instrument 52-112, Non-GAAP and Other Financial Measures Disclosure (NI 52-112), prescribes disclosure requirements that apply to the following specified financial measures:
| ● | Non-GAAP financial measures; |
| ● | Non-GAAP ratios; |
| ● | Total of segments measures; |
| ● | Capital management measures; and |
| ● | Supplementary financial measures. |
This section provides a description and classification of the specified financial measures contemplated by NI 52-112 that we use in this news release to explain our financial results except that, for supplementary financial measures, an explanation of such measures is provided where they are first referred to in this news release if the supplementary financial measures’ labelling is not sufficiently descriptive.
Non-GAAP Financial Measures
A non-GAAP financial measure is a financial measure used to depict our historical or expected future financial performance, financial position or cash flow and, with respect to its composition, either excludes an amount that is included in, or includes an amount that is excluded from, the composition of the most directly comparable financial measure disclosed in BCE’s consolidated primary financial statements. We believe that non-GAAP financial measures are reflective of our on-going operating results and provide readers with an understanding of management’s perspective on and analysis of our performance.
Below are descriptions of the non-GAAP financial measures that we use in this news release to explain our results as well as reconciliations to the most directly comparable IFRS financial measures.
Adjusted net earnings – Adjusted net earnings is a non-GAAP financial measure and it does not have any standardized meaning under IFRS. Therefore, it is unlikely to be comparable to similar measures presented by other issuers.
We define adjusted net earnings as net earnings attributable to common shareholders before severance, acquisition and other costs, net mark-to-market losses (gains) on derivatives used to economically hedge equity settled share-based compensation plans, net equity losses (gains) on investments in associates and joint ventures, net losses (gains) on investments, early debt redemption costs, impairment of assets and discontinued operations, net of tax and NCI.
We use adjusted net earnings and we believe that certain investors and analysts use this measure, among other ones, to assess the performance of our businesses without the effects of severance, acquisition and other costs, net mark-to-market losses (gains) on derivatives used to economically hedge equity settled share-based compensation plans, net equity losses (gains) on investments in associates and joint ventures, net losses (gains) on investments, early debt redemption costs, impairment of assets and discontinued operations, net of tax and NCI. We exclude these items because they affect the comparability of our financial results and could potentially distort the analysis of trends in business performance. Excluding these items does not imply they are non-recurring.
The most directly comparable IFRS financial measure is net earnings attributable to common shareholders.
8/17
The following table is a reconciliation of net earnings attributable to common shareholders to adjusted net earnings on a consolidated basis.
| ($ millions) | ||||||||
| Q3 2023 | Q3 2022 | |||||||
| Net earnings attributable to common shareholders |
640 | 715 | ||||||
| Reconciling items: |
||||||||
| Severance, acquisition and other costs |
10 | 22 | ||||||
| Net mark-to-market losses on derivatives used to economically hedge equity settled share-based compensation plans |
128 | 74 | ||||||
| Net losses on investments |
1 | - | ||||||
| Impairment of assets |
- | 21 | ||||||
| Income taxes for above reconciling items |
(38) | (31) | ||||||
|
Adjusted net earnings |
741 | 801 | ||||||
Free cash flow – Free cash flow is a non-GAAP financial measure and it does not have any standardized meaning under IFRS. Therefore, it is unlikely to be comparable to similar measures presented by other issuers.
We define free cash flow as cash flows from operating activities, excluding cash from discontinued operations, acquisition and other costs paid (which include significant litigation costs) and voluntary pension funding, less capital expenditures, preferred share dividends and dividends paid by subsidiaries to NCI. We exclude cash from discontinued operations, acquisition and other costs paid and voluntary pension funding because they affect the comparability of our financial results and could potentially distort the analysis of trends in business performance. Excluding these items does not imply they are non-recurring.
We consider free cash flow to be an important indicator of the financial strength and performance of our businesses. Free cash flow shows how much cash is available to pay dividends on common shares, repay debt and reinvest in our company. We believe that certain investors and analysts use free cash flow to value a business and its underlying assets and to evaluate the financial strength and performance of our businesses. The most directly comparable IFRS financial measure is cash flows from operating activities.
9/17
The following table is a reconciliation of cash flows from operating activities to free cash flow on a consolidated basis.
| ($ millions) | ||||||||||
| Q3 2023 | Q3 2022 | |||||||||
| Cash flows from operating activities |
1,961 | 1,996 | ||||||||
|
Capital expenditures |
(1,159) | (1,317) | ||||||||
| Cash dividends paid on preferred shares |
(35) | (27) | ||||||||
| Cash dividends paid by subsidiaries to NCI |
(13) | (11) | ||||||||
|
Acquisition and other costs paid |
- | 1 | ||||||||
|
Free cash flow |
754 | 642 | ||||||||
Non-GAAP Ratios
A non-GAAP ratio is a financial measure disclosed in the form of a ratio, fraction, percentage or similar representation and that has a non-GAAP financial measure as one or more of its components.
Below is a description of the non-GAAP ratio that we use in this news release to explain our results.
Adjusted EPS – Adjusted EPS is a non-GAAP ratio and it does not have any standardized meaning under IFRS. Therefore, it is unlikely to be comparable to similar measures presented by other issuers.
We define adjusted EPS as adjusted net earnings per BCE common share. Adjusted net earnings is a non-GAAP financial measure. For further details on adjusted net earnings, refer to Non-GAAP Financial Measures above.
We use adjusted EPS, and we believe that certain investors and analysts use this measure, among other ones, to assess the performance of our businesses without the effects of severance, acquisition and other costs, net mark-to-market losses (gains) on derivatives used to economically hedge equity settled share-based compensation plans, net equity losses (gains) on investments in associates and joint ventures, net losses (gains) on investments, early debt redemption costs, impairment of assets and discontinued operations, net of tax and NCI. We exclude these items because they affect the comparability of our financial results and could potentially distort the analysis of trends in business performance. Excluding these items does not imply they are non-recurring.
Total of Segments Measures
A total of segments measure is a financial measure that is a subtotal or total of 2 or more reportable segments and is disclosed within the Notes to BCE’s consolidated primary financial statements.
Below is a description of the total of segments measure that we use in this news release to explain our results as well as a reconciliation to the most directly comparable IFRS financial measure.
10/17
Adjusted EBITDA – Adjusted EBITDA is a total of segments measure. We define adjusted EBITDA as operating revenues less operating costs as shown in BCE’s consolidated income statements.
The most directly comparable IFRS financial measure is net earnings. The following table is a reconciliation of net earnings to adjusted EBITDA on a consolidated basis.
| ($ millions) | ||||||||
| Q3 2023 | Q3 2022 | |||||||
| Net earnings |
707 | 771 | ||||||
| Severance, acquisition and other costs |
10 | 22 | ||||||
| Depreciation |
937 | 914 | ||||||
| Amortization |
295 | 267 | ||||||
| Finance costs |
||||||||
| Interest expense |
373 | 298 | ||||||
| Net return on post-employment benefit plans |
(27) | (13) | ||||||
| Impairment of assets |
- | 21 | ||||||
| Other expense |
129 | 130 | ||||||
|
Income taxes |
243 | 178 | ||||||
|
Adjusted EBITDA |
2,667 | 2,588 | ||||||
Supplementary Financial Measures
A supplementary financial measure is a financial measure that is not reported in BCE’s consolidated financial statements, and is, or is intended to be, reported periodically to represent historical or expected future financial performance, financial position, or cash flows.
An explanation of such measures is provided where they are first referred to in this news release if the supplementary financial measures’ labelling is not sufficiently descriptive.
KEY PERFORMANCE INDICATORS (KPIs)
We use adjusted EBITDA margin, blended ARPU, capital intensity, churn and subscriber (or customer or NAS) units to measure the success of our strategic imperatives. These key performance indicators are not accounting measures and may not be comparable to similar measures presented by other issuers.
CAUTION REGARDING FORWARD-LOOKING STATEMENTS
Certain statements made in this news release are forward-looking statements. These statements include, without limitation, statements relating to BCE’s financial guidance (including revenue, adjusted EBITDA, capital intensity, adjusted EPS and free cash flow), BCE’s 2023 annualized common share dividend, our network deployment plans and anticipated capital expenditures as well as the benefits expected to result therefrom, the expected completion of the proposed acquisition of the Canadian business of OUTFRONT Media and the benefits expected to result therefrom, our ESG objectives, BCE’s business outlook, objectives, plans and strategic priorities, and other statements that are not historical facts. Forward-looking statements are typically identified by the words assumption, goal, guidance, objective, outlook, project, strategy, target, commitment and other similar expressions or future or conditional verbs
11/17
such as aim, anticipate, believe, could, expect, intend, may, plan, seek, should, strive and will. All such forward-looking statements are made pursuant to the ‘safe harbour’ provisions of applicable Canadian securities laws and of the United States Private Securities Litigation Reform Act of 1995.
Forward-looking statements, by their very nature, are subject to inherent risks and uncertainties and are based on several assumptions, both general and specific, which give rise to the possibility that actual results or events could differ materially from our expectations expressed in or implied by such forward-looking statements and that our business outlook, objectives, plans and strategic priorities may not be achieved. These statements are not guarantees of future performance or events, and we caution you against relying on any of these forward-looking statements. The forward-looking statements contained in this news release describe our expectations as of November 2, 2023 and, accordingly, are subject to change after such date. Except as may be required by applicable securities laws, we do not undertake any obligation to update or revise any forward-looking statements contained in this news release, whether as a result of new information, future events or otherwise. We regularly consider potential acquisitions, dispositions, mergers, business combinations, investments, monetizations, joint ventures and other transactions, some of which may be significant. Except as otherwise indicated by us, forward-looking statements do not reflect the potential impact of any such transactions or of special items that may be announced or that may occur after November 2, 2023. The financial impact of these transactions and special items can be complex and depends on the facts particular to each of them. We therefore cannot describe the expected impact in a meaningful way or in the same way we present known risks affecting our business. Forward-looking statements are presented in this news release for the purpose of assisting investors and others in understanding certain key elements of our expected financial results, as well as our objectives, strategic priorities and business outlook, and in obtaining a better understanding of our anticipated operating environment. Readers are cautioned that such information may not be appropriate for other purposes.
Material Assumptions
A number of economic, market, operational and financial assumptions were made by BCE in preparing its forward-looking statements contained in this news release, including, but not limited to the following:
Canadian Economic Assumptions
Our forward-looking statements are based on certain assumptions concerning the Canadian economy. In particular, we have assumed:
| ● | Slowing economic growth, given the Bank of Canada’s most recent estimated growth in Canadian gross domestic product of 1.2% in 2023, representing a decrease from the earlier estimate of 1.8% |
| ● | Easing, but still elevated, consumer price index (CPI) inflation as the effects of past interest rate increases work through the economy |
| ● | Easing labour market pressures |
| ● | Muted growth in household spending due to the ongoing effects of higher interest rates and the rising cost of living |
| ● | Soft business investment growth due to elevated borrowing costs, tight credit conditions and the prospect of slowing economic activity |
| ● | Prevailing high interest rates expected to remain at or near current levels |
| ● | Population growth resulting from strong immigration |
12/17
| ● | Canadian dollar expected to remain near current levels. Further movements may be impacted by the degree of strength of the U.S. dollar, interest rates and changes in commodity prices |
Canadian Market Assumptions
Our forward-looking statements also reflect various Canadian market assumptions. In particular, we have made the following market assumptions:
| ● | A higher level of wireline and wireless competition in consumer, business and wholesale markets |
| ● | Higher, but slowing, wireless industry penetration |
| ● | A shrinking data and voice connectivity market as business customers migrate to lower-priced telecommunications solutions or alternative over-the-top (OTT) competitors |
| ● | The Canadian advertising market is experiencing a slowdown consistent with trends in the global advertising market, with improvement expected in the medium term, although visibility to the specific timing and pace of recovery remains limited |
| ● | Declines in broadcasting distribution undertaking (BDU) subscribers driven by increasing competition from the continued rollout of subscription video-on-demand (SVOD) streaming services together with further scaling of OTT aggregators |
Assumptions Concerning our Bell CTS Segment
Our forward-looking statements are also based on the following internal operational assumptions with respect to our Bell CTS segment:
| ● | Maintain our market share of national operators’ wireless postpaid mobile phone net additions and growth of our prepaid subscriber base |
| ● | Increased competitive intensity and promotional activity across all regions and market segments |
| ● | Ongoing expansion and deployment of Fifth Generation (5G) and 5G+ wireless networks, offering competitive coverage and quality |
| ● | Continued diversification of our distribution strategy with a focus on expanding direct-to-consumer (DTC) and online transactions |
| ● | Moderating growth in mobile phone blended ARPU, driven by growth in 5G subscriptions, and increased roaming revenue from the easing of travel restrictions implemented as a result of the COVID-19 pandemic, partly offset by reduced data overage revenue due, among others, to the continued adoption of unlimited plans |
| ● | Accelerating business customer adoption of advanced 5G, 5G+ and Internet of Things (IoT) solutions |
| ● | Improving wireless handset device availability in addition to stable device pricing and margins |
| ● | Further deployment of direct fibre to more homes and businesses within our wireline footprint |
| ● | Continued growth in retail Internet and IPTV subscribers |
| ● | Increasing wireless and Internet-based technological substitution |
| ● | Continued aggressive residential service bundle offers from cable TV competitors in our local wireline areas, moderated by growing our share of competitive residential service bundles |
| ● | Continued large business customer migration to IP-based systems |
| ● | Ongoing competitive repricing pressures in our business and wholesale markets |
| ● | Continued competitive intensity in our small and medium-sized business markets as cable operators and other telecommunications competitors continue to intensify their focus on business customers |
13/17
| ● | Traditional high-margin product categories challenged by large global cloud and OTT providers of business voice and data solutions expanding into Canada with on-demand services |
| ● | Increasing customer adoption of OTT services resulting in downsizing of TV packages |
| ● | Growing consumption of OTT TV services and on-demand video streaming, as well as the proliferation of devices, such as tablets, that consume large quantities of bandwidth, will require ongoing capital investment |
| ● | Realization of cost savings related to operating efficiencies enabled by a growing direct fibre footprint, changes in consumer behaviour and product innovation, digital adoption, product and service enhancements, expanding self-serve capabilities, new call centre and digital investments, other improvements to the customer service experience, management workforce reductions including attrition and retirements, and lower contracted rates from our suppliers |
| ● | No adverse material financial, operational or competitive consequences of changes in or implementation of regulations affecting our communication and technology services business |
Assumptions Concerning our Bell Media Segment
Our forward-looking statements are also based on the following internal operational assumptions with respect to our Bell Media segment:
| ● | Overall digital revenue expected to reflect continued scaling of our Strategic Audience Management (SAM) TV and demand-side platform (DSP) buying platforms, as well as DTC subscriber growth contributing towards the advancement of our digital-first media strategy |
| ● | Continued escalation of media content costs to secure quality programming |
| ● | Continued scaling of Crave through broader content offering, user experience improvements and expanded distribution |
| ● | Continued investment in Noovo original programming to better serve our French-language customers with a wider array of content on their preferred platforms |
| ● | Leveraging of first-party data to improve targeting, advertisement delivery and attribution |
| ● | Ability to successfully acquire and produce highly-rated programming and differentiated content |
| ● | Building and maintaining strategic supply arrangements for content across all screens and platforms |
| ● | No adverse material financial, operational or competitive consequences of changes in or implementation of regulations affecting our media business |
Financial Assumptions Concerning BCE
Our forward-looking statements are also based on the following internal financial assumptions with respect to BCE for 2023:
| ● | An estimated post-employment benefit plans service cost of approximately $210 million |
| ● | An estimated net return on post-employment benefit plans of approximately $100 million |
| ● | Depreciation and amortization expense of approximately $4,900 million to $4,950 million |
| ● | Interest expense of approximately $1,425 million to $1,475 million |
| ● | Interest paid of approximately $1,450 million to $1,500 million |
| ● | An average effective tax rate of approximately 26% |
| ● | Non-controlling interest of approximately $65 million |
| ● | Contributions to post-employment benefit plans of approximately $60 million |
| ● | Payments under other post-employment benefit plans of approximately $75 million |
14/17
| ● | Income taxes paid (net of refunds) of approximately $800 million to $900 million |
| ● | Weighted average number of BCE common shares outstanding of approximately 914 million |
| ● | An annual common share dividend of $3.87 per share |
Assumptions underlying expected reductions in 2023 annual contributions to our pension plans
Our forward-looking statements are also based on the following principal assumptions underlying expected reductions in 2023 annual contributions to our pension plans:
| ● | At the relevant time, our defined benefit (DB) pension plans will remain in funded positions with going concern surpluses and maintain solvency ratios that exceed the minimum legal requirements for a contribution holiday to be taken for applicable DB and defined contribution (DC) components |
| ● | No significant declines in our DB pension plans’ financial position due to declines in investment returns or interest rates |
| ● | No material experience losses from other events such as through litigation or changes in laws, regulations or actuarial standards |
The foregoing assumptions, although considered reasonable by BCE on November 2, 2023, may prove to be inaccurate. Accordingly, our actual results could differ materially from our expectations as set forth in this news release.
Material Risks
Important risk factors that could cause our assumptions and estimates to be inaccurate and actual results or events to differ materially from those expressed in, or implied by, our forward-looking statements, including our 2023 financial guidance, are listed below. The realization of our forward-looking statements, including our ability to meet our 2023 financial guidance targets, essentially depends on our business performance, which, in turn, is subject to many risks. Accordingly, readers are cautioned that any of the following risks could have a material adverse effect on our forward-looking statements. These risks include, but are not limited to: the negative effect of adverse economic conditions, including a potential recession, and related inflationary cost pressures, higher interest rates and financial and capital market volatility; the negative effect of adverse conditions associated with geopolitical events; a declining level of business and consumer spending, and the resulting negative impact on the demand for, and prices of, our products and services; regulatory initiatives, proceedings and decisions, government consultations and government positions that affect us and influence our business including, without limitation, concerning mandatory access to networks, spectrum auctions, the imposition of consumer-related codes of conduct, approval of acquisitions, broadcast and spectrum licensing, foreign ownership requirements, privacy and cybersecurity obligations and control of copyright piracy; the inability to implement enhanced compliance frameworks and to comply with legal and regulatory obligations; unfavourable resolution of legal proceedings; the intensity of competitive activity and the failure to effectively respond to evolving competitive dynamics; the combination of Rogers Communications Inc. and Shaw Communications Inc. creating a Canadian competitor with larger scale, and the acquisition of Freedom Mobile by Videotron Ltd. also increasing its scale with a change in competitive dynamics in several provinces; the level of technological substitution and the presence of alternative service providers contributing to disruptions and disintermediation in each of our business segments; changing customer behaviour and the expansion of cloud-based, OTT and other alternative solutions; advertising market pressures from economic conditions, fragmentation and non-traditional/global digital services; rising content costs and challenges in our ability to acquire or develop key content; higher Canadian smartphone penetration and reduced or slower
15/17
immigration flow; the inability to protect our physical and non-physical assets from events such as information security attacks, unauthorized access or entry, fire and natural disasters; the failure to implement effective data governance; the failure to evolve and transform our networks, systems and operations using next-generation technologies while lowering our cost structure; the inability to drive a positive customer experience; the failure to attract, develop and retain a diverse and talented team capable of furthering our strategic imperatives; the failure to adequately manage health and safety concerns; labour disruptions and shortages; the failure to maintain operational networks; the risk that we may need to incur significant capital expenditures to provide additional capacity and reduce network congestion; the inability to maintain service consistency due to network failures or slowdowns, the failure of other infrastructure, or disruptions in the delivery of services; service interruptions or outages due to legacy infrastructure and the possibility of instability as we transition towards converged wireline and wireless networks and newer technologies; the failure by us, or by other telecommunications carriers on which we rely to provide services, to complete planned and sufficient testing, maintenance, replacement or upgrade of our or their networks, equipment and other facilities, which could disrupt our operations including through network or other infrastructure failures; events affecting the functionality of, and our ability to protect, test, maintain, replace and upgrade, our networks, information technology (IT) systems, equipment and other facilities; the complexity of our operations; the failure to implement or maintain highly effective processes and IT systems; in-orbit and other operational risks to which the satellites used to provide our satellite TV services are subject; our dependence on third-party suppliers, outsourcers, and consultants to provide an uninterrupted supply of the products and services we need; the failure of our vendor selection, governance and oversight processes, including our management of supplier risk in the areas of security, data governance and responsible procurement; the quality of our products and services and the extent to which they may be subject to defects or fail to comply with applicable government regulations and standards; reputational risks and the inability to meaningfully integrate ESG considerations into our business strategy and operations; the failure to take appropriate actions to adapt to current and emerging environmental impacts, including climate change; pandemics, epidemics and other health risks, including health concerns about radio frequency emissions from wireless communications devices and equipment; the inability to adequately manage social issues; the failure to develop and implement strong corporate governance practices; various internal and external factors could challenge our ability to achieve our ESG targets including, without limitation, those related to greenhouse gas (GHG) emissions reduction and diversity, equity, inclusion and belonging; the inability to access adequate sources of capital and generate sufficient cash flows from operating activities to meet our cash requirements, fund capital expenditures and provide for planned growth; uncertainty as to whether dividends will be declared by BCE’s board of directors or whether the dividend on common shares will be increased; the inability to manage various credit, liquidity and market risks; the failure to reduce costs, as well as unexpected increases in costs; the failure to evolve practices to effectively monitor and control fraudulent activities; new or higher taxes due to new tax laws or changes thereto or in the interpretation thereof, and the inability to predict the outcome of government audits; the impact on our financial statements and estimates from a number of factors; pension obligation volatility and increased contributions to post-employment benefit plans; and the expected timing and completion of the proposed acquisition of the Canadian out-of-home media business of OUTFRONT Media Inc. is subject to closing conditions and other risks and uncertainties, and there can be no certainty that the anticipated benefits will be realized.
We caution that the foregoing list of risk factors is not exhaustive and other factors could also adversely affect our results. We encourage investors to also read BCE’s 2022 Annual MD&A dated March 2, 2023 and BCE’s 2023 First, Second and Third Quarter MD&As dated May 3,
16/17
2023, August 2, 2023 and November 1, 2023, respectively, for additional information with respect to certain of these and other assumptions and risks, filed by BCE with the Canadian provincial securities regulatory authorities (available at Sedarplus.ca) and with the U.S. Securities and Exchange Commission (available at SEC.gov). These documents are also available at BCE.ca.
About BCE
BCE is Canada’s largest communications company,11 providing advanced Bell broadband wireless, Internet, TV, media and business communications services. To learn more, please visit Bell.ca or BCE.ca.
Through Bell for Better, we are investing to create a better today and a better tomorrow by supporting the social and economic prosperity of our communities. This includes the Bell Let’s Talk initiative, which promotes Canadian mental health with national awareness and anti-stigma campaigns like Bell Let’s Talk Day and significant Bell funding of community care and access, research and workplace initiatives throughout the country. To learn more, please visit Bell.ca/LetsTalk.
11 Based on total revenue and total combined customer connections.
Media inquiries:
Ellen Murphy
media@bell.ca
Investor inquiries:
Thane Fotopoulos
514-870-4619
thane.fotopoulos@bell.ca
17/17
Exhibit 99.6
NOTICE OF RELIANCE
SECTION 13.4 OF NATIONAL INSTRUMENT 51-102
CONTINUOUS DISCLOSURE OBLIGATIONS
| To: | Alberta Securities Commission |
| British Columbia Securities Commission |
| Manitoba Securities Commission |
| Financial and Consumer Services Commission, New Brunswick |
| Office of the Superintendent of Securities, Newfoundland and Labrador |
| Nova Scotia Securities Commission |
| Ontario Securities Commission |
| Office of the Superintendent of Securities, Prince Edward Island |
| Autorité des marchés financiers |
| Financial and Consumer Affairs Authority of Saskatchewan |
| Toronto Stock Exchange |
Notice is hereby given that Bell Canada relies on the continuous disclosure documents filed by BCE Inc. pursuant to the exemption from the requirements of National Instrument 51-102 – Continuous Disclosure Obligations (“NI 51-102”) provided in Section 13.4 of NI 51-102.
The continuous disclosure documents of BCE Inc. can be found for viewing in electronic format at www.sedarplus.ca.
Attached to this notice and forming part thereof is the consolidating summary financial information for BCE Inc. as required by Section 13.4 of NI 51-102.
Dated: November 2, 2023
| BELL CANADA | ||
| By: |
(signed) Thierry Chaumont | |
| Name: |
Thierry Chaumont | |
| Title: |
Senior Vice-President, Controller and Tax | |

|
BELL CANADA
|
UNAUDITED SELECTED SUMMARY FINANCIAL INFORMATION (1)
For the periods ended September 30, 2023 and 2022
(in millions of Canadian dollars)
BCE Inc. fully and unconditionally guarantees the payment obligations of its 100% owned subsidiary Bell Canada under the public debt issued by Bell Canada. Accordingly, the following summary financial information is provided by Bell Canada in compliance with the requirements of section 13.4 of National Instrument 51-102 (Continuous Disclosure Obligations) providing for an exemption for certain credit support issuers. The tables below contain selected summary financial information for (i) BCE Inc. (as credit supporter), (ii) Bell Canada (as credit support issuer) on a consolidated basis, (iii) BCE Inc.’s subsidiaries, other than Bell Canada, on a combined basis, (iv) consolidating adjustments, and (v) BCE Inc. and all of its subsidiaries on a consolidated basis, in each case for the periods indicated. Such summary financial information for BCE Inc. and Bell Canada and all other subsidiaries is intended to provide investors with meaningful and comparable financial information about BCE Inc. and its subsidiaries. This summary financial information should be read in conjunction with BCE Inc.’s audited consolidated financial statements for the year ended December 31, 2022 and the unaudited consolidated interim financial report for the nine months ended September 30, 2023.
For the periods ended September 30:
| BCE INC. | BELL CANADA CONSOLIDATED | SUBSIDIARIES OF BCE INC. | CONSOLIDATING | BCE INC. | ||||||||||||||||||||||||||||||||||||||||||||||||||||||||||||||||||||||||||||
| (“CREDIT SUPPORTER”)(2) | (“CREDIT SUPPORT ISSUER”) | OTHER THAN BELL CANADA(3) | ADJUSTMENTS(4) | CONSOLIDATED | ||||||||||||||||||||||||||||||||||||||||||||||||||||||||||||||||||||||||||||
| 2023 | 2022 | 2023 | 2022 | 2023 | 2022 | 2023 | 2022 | 2023 | 2022 | 2023 | 2022 | 2023 | 2022 | 2023 | 2022 | 2023 | 2022 | 2023 | 2022 | |||||||||||||||||||||||||||||||||||||||||||||||||||||||||||||
| Three | Three | Nine | Nine | Three | Three | Nine | Nine | Three | Three | Nine | Nine | Three | Three | Nine | Nine | Three | Three | Nine | Nine | |||||||||||||||||||||||||||||||||||||||||||||||||||||||||||||
| months | months | months | months | months | months | months | months | months | months | months | months | months | months | months | months | months | months | months | months | |||||||||||||||||||||||||||||||||||||||||||||||||||||||||||||
| Operating revenues |
– | – | – | – | 6,080 | 6,025 | 18,200 | 17,737 | – | – | – | – | – | (1 | ) | – | (2 | ) | 6,080 | 6,024 | 18,200 | 17,735 | ||||||||||||||||||||||||||||||||||||||||||||||||||||||||||
| Net earnings from continuing operations attributable to owners |
687 | 754 | 1,833 | 2,296 | 709 | 789 | 2,215 | 2,388 | 37 | 45 | 127 | 137 | (746 | ) | (834 | ) | (2,342 | ) | (2,525 | ) | 687 | 754 | 1,833 | 2,296 | ||||||||||||||||||||||||||||||||||||||||||||||||||||||||
| Net earnings attributable to owners |
687 | 754 | 1,833 | 2,296 | 709 | 789 | 2,215 | 2,388 | 37 | 45 | 127 | 137 | (746 | ) | (834 | ) | (2,342 | ) | (2,525 | ) | 687 | 754 | 1,833 | 2,296 | ||||||||||||||||||||||||||||||||||||||||||||||||||||||||
As at September 30, 2023 and December 31, 2022, respectively:
| BCE INC. | BELL CANADA CONSOLIDATED | SUBSIDIARIES OF BCE INC. | CONSOLIDATING | BCE INC. | ||||||||||||||||||||||||||||||||||||||||||||||||
| (“CREDIT SUPPORTER”)(2) | (“CREDIT SUPPORT ISSUER”) | OTHER THAN BELL CANADA(3) | ADJUSTMENTS(4) | CONSOLIDATED | ||||||||||||||||||||||||||||||||||||||||||||||||
| Sept. 30, | Dec. 31, | Sept. 30, | Dec. 31, | Sept. 30, | Dec. 31, | Sept. 30, | Dec. 31, | Sept. 30, | Dec. 31, | |||||||||||||||||||||||||||||||||||||||||||
| 2023 | 2022 | 2023 | 2022 | 2023 | 2022 | 2023 | 2022 | 2023 | 2022 | |||||||||||||||||||||||||||||||||||||||||||
| Total Current Assets |
693 | 744 | 8,948 | 7,865 | 602 | 473 | (3,506 | ) | (2,595 | ) | 6,737 | 6,487 | ||||||||||||||||||||||||||||||||||||||||
| Total Non-current Assets |
23,507 | 23,856 | 57,596 | 56,461 | 38 | 38 | (17,506 | ) | (17,513 | ) | 63,635 | 62,842 | ||||||||||||||||||||||||||||||||||||||||
| Total Current Liabilities |
3,159 | 2,401 | 12,038 | 11,583 | 81 | 81 | (3,508 | ) | (2,596 | ) | 11,770 | 11,469 | ||||||||||||||||||||||||||||||||||||||||
| Total Non-current Liabilities |
72 | 21 | 36,649 | 34,746 | 2 | – | 572 | 578 | 37,295 | 35,345 | ||||||||||||||||||||||||||||||||||||||||||
| (1) | The summary financial information is prepared in accordance with International Financial Reporting Standards (IFRS) and is in accordance with generally accepted accounting principles issued by the Canadian Accounting Standards Board for publicly-accountable enterprises. |
| (2) | This column accounts for investments in all subsidiaries of BCE Inc. under the equity method. |
| (3) | This column accounts for investments in all subsidiaries of BCE Inc. (other than Bell Canada) on a consolidated basis. |
| (4) | This column includes the necessary amounts to eliminate the intercompany balances between BCE Inc., Bell Canada and other subsidiaries and other adjustments to arrive at the information for BCE Inc. on a consolidated basis. |
Exhibit 99.7
BCE Inc.
EXHIBIT TO 2023 THIRD QUARTER FINANCIAL STATEMENTS
EARNINGS COVERAGE
The following consolidated financial ratios are calculated for the twelve months ended September 30, 2023, give effect to the issuance and redemption of all long-term debt since October 1, 2022 as if these transactions occurred on October 1, 2022, and are based on unaudited financial information of BCE Inc.
| September 30, 2023 | ||
| Earnings coverage of interest on debt requirements based on net earnings attributable to owners of BCE Inc. before interest expense and income tax: | 3.0 times | |
| Earnings coverage of interest on debt requirements based on net earnings attributable to owners of BCE Inc. before interest expense, income tax and non-controlling interest: | 3.0 times | |
1 Year BCE Chart |
1 Month BCE Chart |

It looks like you are not logged in. Click the button below to log in and keep track of your recent history.
Support: +44 (0) 203 8794 460 | support@advfn.com
By accessing the services available at ADVFN you are agreeing to be bound by ADVFN's Terms & Conditions
 Hot Features