ADVFN Logo ADVFN

We could not find any results for:
Make sure your spelling is correct or try broadening your search.

Trending Now

Toplists

It looks like you aren't logged in.
Click the button below to log in and view your recent history.

Hot Features

Registration Strip Icon for default Register for Free to get streaming real-time quotes, interactive charts, live options flow, and more.

AVP Avon Products Inc

5.60
0.00 (0.00%)
After Hours
Last Updated: 01:00:00
Delayed by 15 minutes
Share Name Share Symbol Market Type
Avon Products Inc NYSE:AVP NYSE Common Stock
  Price Change % Change Share Price High Price Low Price Open Price Shares Traded Last Trade
  0.00 0.00% 5.60 0 01:00:00

Avon Reports Second-Quarter Earnings of $.69 Per Share, Including $.20 of Tax Benefits, on 6% Revenue Increase

19/07/2005 12:00pm

PR Newswire (US)


Avon Products (NYSE:AVP)
Historical Stock Chart


From Jul 2019 to Jul 2024
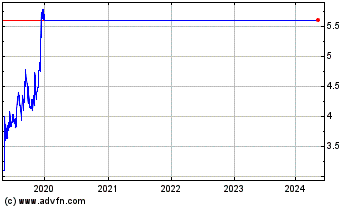
Click Here for more Avon Products Charts.
Avon Reports Second-Quarter Earnings of $.69 Per Share, Including $.20 of Tax Benefits, on 6% Revenue Increase Company Sees 7-8% Revenue Growth in Second Half; Full-Year Earnings Forecast in Range of $2.03-$2.08 per Share NEW YORK, July 19 /PRNewswire-FirstCall/ -- Avon Products, Inc. (NYSE:AVP) today reported that earnings in the second quarter 2005 increased to $.69 per share, including a $.20-per-share tax benefit ($.03 per share more than initially anticipated) primarily from settlements of prior-year audits that were completed in the second quarter. These earnings compare with guidance of $.66 per share. In the second quarter 2004, earnings were $.49 per share, including a tax benefit of $.05 per share. Avon said that revenue in the second quarter 2005 grew 6% (2% in local currencies) to $2.0 billion -- on top of 13% growth in the year-ago period. Revenue in the quarter was below expectations due to two factors which each impacted topline growth by approximately two points: an unexpected temporary decline in China as Beauty Boutique owners reacted with concern to the imminent resumption of direct selling in that country; and lower-than- anticipated revenue growth in Central and Eastern Europe resulting from underperformance of several key marketing offers as well as delayed expansion into new geographies within Russia. Total Beauty sales in the second quarter 2005 rose 7%, active Representatives grew 6% and units increased 2%, respectively, versus the prior year. Operating profit increased 6%, in line with revenue growth, and operating margin was 17.3%, including the impact of lower corporate expenses that resulted primarily from the reversal of accruals for 2005 performance- based compensation plans. Net income in the second quarter 2005 was $328.6 million, compared with $232.3 million a year ago. Second Quarter Regional Highlights U.S. second-quarter performance was in line with the company's expectations, with revenue and operating profit decreasing 6% and 14%, respectively. Beauty sales declined 11% due to continued weak customer purchase frequency in an environment of stepped-up competitive activity. Reflecting ongoing, planned category repositioning, Beauty Plus sales increased 5% and Beyond Beauty sales declined 3%. Units and active Representatives in the quarter were down 12% and 2%, respectively. U.S. operating margin was 18.6%. In Europe, revenue in the second quarter increased 12% on top of 28% revenue growth in the year-ago period. In local-currency terms, revenue was up 6%, with gains in units and active Representatives of 10% and 9%, respectively. Central and Eastern Europe grew 16% with revenue in Russia increasing 17%, continuing strong market outperformance but below the company's planned levels. Europe's second-quarter operating profit grew 10%, and operating margin was 22.4%. In Latin America, broad-based strength across most of the region contributed to second-quarter revenue growth of 17% (10% in local currencies) with strong results in Brazil and Venezuela, in particular, and a solid increase in Mexico's Beauty sales offsetting softness in several non-core categories in that market. Active Representatives and units in the region both grew 9%. Operating profit increased by 13%, and operating margin was 25.0%. In Asia Pacific, revenue was flat (down 2% in local currency) and units declined 7% as the region's performance was impacted by a 19% decline in China's revenue due to the direct-selling transition issues. Asia Pacific active Representatives in the quarter grew 4%. Operating profit declined 23%, versus the year-ago quarter primarily as a result of the China revenue decline. Operating margin in the region was 14.3%. In commenting on the company's second-quarter results, Andrea Jung, Avon's chairman and chief executive officer, said, "While the U.S. and Latin America performed in line with our expectations, the situation in China was clearly unexpected. We are moving rapidly to assure our Beauty Boutique owners that they will have an opportunity to earn as much or more with Avon in our future model, and believe this will be a transitional issue. We continue to feel privileged to have been chosen as the first company authorized to conduct a direct-selling test and our optimism about the long-term $1 billion opportunity in China remains unchanged. In Central and Eastern Europe, where our topline momentum continues to be strong and we remain confident in our beauty leadership position, we have significantly enhanced our marketing offering and implemented aggressive plans to accelerate order growth in the back half of the year." Revised Outlook On a consolidated basis for the third quarter, Avon expects revenue growth to accelerate to the high-single digits (mid-single digits in local currencies). Operating profit is forecast to be down slightly. EPS is expected to be in the range of $.34-$.36, compared with 2004's third quarter of $.37 per share. In terms of regional performance for the third quarter, the company said that the U.S. revenue trendline is improving, with revenue expected to be down slightly from the prior year. U.S. operating profit is forecast to decrease mid-to-high teens, with the majority of the decline due to reversal of 2004 bonus accruals in the prior year. Europe's revenue is projected to increase double digits and operating profit is forecast to rise in the mid-single digits. In Latin America, revenue is anticipated to grow in the high teens and operating profit is forecast to increase around 10%. Asia Pacific's revenue is expected to be up at least mid-single digits while operating profit for that region is projected to be down high-single digits, including a more than doubling of advertising in China. Looking ahead to the second half, the company said that it anticipates revenue growth of 7-8% (6-7% in local currency), double the first-half local- currency growth rate, but below the company's previous expectation. As a result, Avon expects full-year earnings to be in the range of $2.03-$2.08, up from 2004 earnings of $1.77 per share. This EPS guidance reflects the second- quarter tax benefit of $.20 per share, partially offset by an impact of $.02 per share from a revised higher effective tax rate in the second half. The company said that additional tax settlements are possible during 2005, which could result in further benefits. Additionally, cash flow from operations is projected to be approximately $900 million for the full year. Commenting on the company's revised outlook, Ms. Jung said: "We are encouraged by some recent trends in the U.S. In addition, we expect our current recovery actions to improve performances in China and Central and Eastern Europe as we move through the balance of the year. If all of these actions and trends play out in the back half of the year, we can achieve the top end of our earnings projection. However, given the volatility we've experienced in recent quarters on a number of fronts, we believe that it is prudent to allow for further risk, thus the breadth of our forecast." Ms. Jung added, "Looking ahead, the broad strength of Avon's global portfolio remains a significant competitive advantage and we remain confident in Avon's unique growth and transformation strategies. Over the long term, we expect to deliver high-single-digit local-currency revenue growth, enabled by a greater step-up in strategic spending support and thoughtful trade-off between our revenue growth and margin targets, including evaluation of our enterprise expense base. We remain confident that Avon's revenue growth will continue to well outpace the overall Beauty market, supported by appropriate levels of investment while also delivering margin expansion over the long term." The company said that it is reviewing its long-term targets and will provide additional detail at its annual investor update meeting to be scheduled for late fall. Avon will conduct a conference call at 8:00 A.M. today to discuss the quarter's results and the outlook for the full-year. The dial-in number for the call is (973) 528-0014 (entry code 2272). Additionally, the call will be webcast live and can be accessed at http://www.avoninvestor.com/. Avon is the world's leading direct seller of beauty and related products, with $7.7 billion in annual revenues. Avon markets to women around the world through 4.9 million independent sales Representatives. Avon product lines include such recognizable brand names as Avon Color, Anew, Skin-So-Soft, Avon Solutions, Advance Techniques Hair Care, Avon Naturals, Mark, and Avon Wellness. Avon also markets an extensive line of fashion jewelry and apparel. More information about Avon and its products can be found on the company's web site http://www.avoncompany.com/. CAUTIONARY STATEMENT FOR PURPOSES OF THE "SAFE HARBOR" STATEMENT UNDER THE PRIVATE SECURITIES LITIGATION REFORM ACT OF 1995 Statements in this report that are not historical facts or information are forward-looking statements within the meaning of the Private Securities Litigation Reform Act of 1995. Words such as "estimate," "project," "plan," "believe," "expect," "anticipate," "intend," "planned," "potential" and similar expressions may identify forward-looking statements. Such forward-looking statements are based on management's reasonable current assumptions and expectations. Such forward-looking statements involve risks, uncertainties and other factors, which may cause the actual results, levels of activity, performance or achievement of Avon to be materially different from any future results expressed or implied by such forward-looking statements, and there can be no assurance that actual results will not differ materially from management's expectations. Such factors include, among others, the following: general economic and business conditions in our markets, including social, economic and political uncertainties in Latin America, Asia Pacific, and Central and Eastern Europe and the Middle East; our ability to implement our business, cash management and tax strategies and our Business Transformation initiatives; our ability to achieve anticipated cost savings and our profitability and growth targets, particularly in our largest markets; our ability to implement appropriate product mix and pricing strategies; the impact of changes in consumer spending patterns and preferences, particularly given the global nature of our business; our ability to replace lost sales attributable to the repositioning of the U.S. Beyond Beauty business; the impact of substantial currency fluctuations on the results of our foreign operations and the cost of sourcing foreign products and the success of our foreign currency hedging and risk management strategies; our ability to implement our Sales Leadership program globally, to increase Representative productivity and recruit Representatives; our ability to implement our enterprise resource planning project; the impact of possible pension funding obligations and increased pension expense on our cash flow and results of operations; the impact of stock option expense pursuant to Statement of Financial Accounting Standards No. 123(R); the effect of legal, regulatory and tax proceedings, as well as restrictions imposed on us, our operations or our Representatives by foreign governments; our ability to successfully identify new business opportunities; our access to financing; and our ability to attract and retain key personnel and executives. Additional information identifying such factors is contained in our Annual Report on Form 10-K for the year ended December 31, 2004, filed with the U.S. Securities and Exchange Commission. We undertake no obligation to update any such forward-looking statements. AVON PRODUCTS, INC. CONSOLIDATED STATEMENTS OF INCOME (In millions, except per share data) Three months ended Percent Six months ended Percent June 30 Change June 30 Change 2005 2004 2005 2004 Net sales $1,963.9 $1,844.4 6% $3,824.8 $3,585.8 7% Other revenue 20.4 21.9 40.6 45.3 Total revenue 1,984.3 1,866.3 6% 3,865.4 3,631.1 6% Cost of sales (1) 730.4 673.8 1,428.6 1,340.0 Marketing, distribution and administrative expenses (1) 909.9 867.0 1,832.3 1,736.2 Operating profit 344.0 325.5 6% 604.5 554.9 9% Interest expense 10.5 9.8 20.6 15.9 Interest income (8.1) (3.9) (15.9) (8.4) Other expense, net (2) 0.8 4.1 5.3 7.3 Total other expenses 3.2 10.0 10.0 14.8 Income before taxes and minority interest 340.8 315.5 8% 594.5 540.1 10% Income taxes (3) 10.3 79.4 90.1 153.3 Income before minority interest 330.5 236.1 504.4 386.8 Minority interest (1.9) (3.8) (3.8) (6.4) Net income $328.6 $232.3 41% $500.6 $380.4 32% Earnings per share: Basic $.70 $.49 43% $1.06 $.81 31% Diluted $.69 $.49 41% $1.05 $.80 31% Average shares outstanding: Basic 471.45 472.27 471.70 472.03 Diluted 475.57 478.37 476.28 477.60 Notes: (1) For the three and six months ended June 30, 2004, certain U.S. expenses were reclassified from operating expenses to cost of sales. These reclassifications did not affect operating profit. (2) For the three months ended June 30, 2005 and 2004, Other expense, net includes foreign exchange losses of $3.9 and $2.7, respectively. For the six months ended June 30, 2005 and 2004, Other expense, net includes foreign exchange losses of $5.8 and $4.7, respectively. During the second quarter of 2005, the Company recorded a gain on the sale of marketable securities of $4.9. (3) For the three and six months ended June 30, 2005, earnings per share were impacted by a reduction in tax expense of $99.6, due to the completion of income tax examinations as well as the closure of a tax year by expiration of the statute of limitations, net of related adjustments. For the three and six months ended June 30, 2004, earnings per share were also impacted by a reduction in tax expense of $24.8 and $28.6 respectively, due to cash management and tax strategies, favorable audit settlements, and amended returns as well as tax and interest refunds. AVON PRODUCTS, INC. CONDENSED CONSOLIDATED BALANCE SHEETS (Unaudited) (In millions) June 30 December 31 2005 2004 Cash, including cash equivalents $880.1 $769.6 Accounts receivable, net 564.4 599.1 Inventories 841.5 740.5 Prepaid expenses and other 400.3 397.2 Total current assets 2,686.3 2,506.4 Property, plant and equipment, net 1,015.8 1,014.8 Other assets 624.0 626.9 Total assets 4,326.1 4,148.1 Debt maturing within one year 286.8 51.7 Accounts payable 474.5 490.1 Other current liabilities 834.3 983.7 Total current liabilities 1,595.6 1,525.5 Long-term debt 865.9 866.3 Other non-current liabilities 688.2 806.1 Total shareholders' equity 1,176.4 950.2 Total liabilities and shareholders' equity $4,326.1 $4,148.1 AVON PRODUCTS, INC. CONSOLIDATED STATEMENTS OF CASH FLOWS (Unaudited) (In millions) Six months ended June 30 2005 2004 Cash Flows from Operating Activities: Net income $500.6 $380.4 Depreciation and amortization 63.7 64.3 Provision for doubtful accounts 60.3 67.3 Provision for obsolescence 29.5 31.9 Deferred income taxes 3.0 (21.4) Other 10.8 9.5 Changes in assets and liabilities: Accounts receivable (28.2) (59.7) Inventories (147.4) (109.0) Prepaid expenses and other (10.3) (7.3) Accounts payable and accrued liabilities (47.9) 6.1 Income and other taxes (112.7) (57.3) Non-current assets and liabilities (87.8) (76.8) Net cash provided by operating activities 233.6 228.0 Cash Flows from Investing Activities: Capital expenditures (86.6) (81.2) Disposal of assets 7.3 4.8 Other investing activities (11.0) (48.1) Net cash used by investing activities (90.3) (124.5) Cash Flows from Financing Activities: Cash dividends (159.7) (135.2) Total debt, net change 234.8 (1.8) Repurchase of common stock (129.7) (90.8) Proceeds from exercise of stock options, net of taxes 55.2 82.0 Other financing activities (0.3) 1.4 Net cash provided (used) by financing activities 0.3 (144.4) Effect of exchange rate changes on cash and equivalents (33.1) (11.2) Net increase (decrease) in cash and equivalents $110.5 $(52.1) AVON PRODUCTS, INC. - SUPPLEMENTAL SCHEDULE SECOND QUARTER 2005 - THREE MONTHS ENDED 6/30/05 REGIONAL RESULTS Total Revenue in Local Operating $ in Millions Total Revenue US$ Currency Profit US$ % var. vs % var. vs % var. vs 2Q04 2Q04 2Q04 North America $617.8 -4% -5% $110.0 -12% US 527.6 -6 -6 98.3 -14 International 1,366.5 12 6 299.4 6 Latin America 560.3 17 10 140.0 13 Europe 543.8 12 6 121.8 10 Asia Pacific 262.4 0 -2 37.6 -23 Total from Operations 1,984.3 6 2 409.4 0 Global Expenses - - - (65.4) 21 Consolidated $1,984.3 6% 2% $344.0 6% Op. Margin Units Active Reps 2005 % var. vs % var. vs percent 2Q04 2Q04 North America 17.8% -10% -2% US 18.6 -12 -2 International 21.9 7 8 Latin America 25.0 9 9 Europe 22.4 10 9 Asia Pacific 14.3 -7 4 Total from Operations 20.6 2 6 Global Expenses - - - Consolidated 17.3% 2% 6% CATEGORY SALES (US$) Consolidated % var. vs 2Q04 Beauty (cosmetics/fragrances/toiletries) $1,389.2 7% Beauty Plus (fashion jewelry/watches/apparel/ accessories) 355.7 6 Beyond Beauty (home products/gift and decorative/candles) 219.0 4 Net Sales $1,963.9 6% Other Revenue 20.4 -7 Total Revenue $1,984.3 6% SECOND QUARTER 2005 - SIX MONTHS ENDED 6/30/05 REGIONAL RESULTS Total Revenue in Local Operating $ in Millions Total Revenue US$ Currency Profit US$ % var. vs % var. vs % var. vs 1H04 1H04 1H04 North America $1,212.4 -4% -5% $192.3 -13% US 1,044.1 -6 -6 175.0 -15 International 2,653.0 12 7 559.2 11 Latin America 1,037.5 14 9 238.3 13 Europe 1,073.9 14 8 231.6 17 Asia Pacific (1) 541.6 5 3 89.3 -3 Total from Operations 3,865.4 6 3 751.5 4 Global Expenses - - - (147.0) 12 Consolidated (1) $3,865.4 6% 3% $604.5 9% Op. Margin Units Active Reps 2005 % var. vs % var. vs percent 1H04 1H04 North America 15.9% -9% -2% US 16.8 -11 -2 International 21.1 7 10 Latin America 23.0 7 10 Europe 21.6 8 11 Asia Pacific (1) 16.5 4 8 Total from Operations 19.4 3 8 Global Expenses - - - Consolidated (1) 15.6% 3% 8% CATEGORY SALES (US$) Consolidated % var. vs 1H04 Beauty (cosmetics/fragrances/toiletries) $2,690.1 8% Beauty Plus (fashion jewelry/watches/apparel/accessories) 690.3 7 Beyond Beauty (home products/gift and decorative/candles) 444.4 2 Net Sales $3,824.8 7% Other Revenue 40.6 -10 Total Revenue $3,865.4 6% (1) Growth in Active Representatives was positively impacted by an increase in the number of sales campaigns in the Philippines in the second quarter of 2004, resulting in additional opportunities to order. This change positively impacted Active Representative growth in Asia Pacific and Consolidated Avon for the six months ended June 30, 2005 by 4 points and 1 point, respectively. DATASOURCE: Avon Products, Inc. CONTACT: MEDIA: Victor Beaudet, +1-212-282-5344, or Sharon Samuel, +1-212-282-5322, or INVESTOR: Renee Johansen or Rob Foresti, +1-212-282-5320, all for Avon Products, Inc. Web site: http://www.avoncompany.com/ http://www.avoninvestor.com/ Company News On-Call: http://www.prnewswire.com/comp/079575.html

Copyright

1 Year Avon Products Chart

1 Year Avon Products Chart

1 Month Avon Products Chart

1 Month Avon Products Chart