
We could not find any results for:
Make sure your spelling is correct or try broadening your search.
| Share Name | Share Symbol | Market | Type |
|---|---|---|---|
| Apollo Tactical Income Fund Inc | NYSE:AIF | NYSE | Common Stock |
| Price Change | % Change | Share Price | High Price | Low Price | Open Price | Shares Traded | Last Trade | |
|---|---|---|---|---|---|---|---|---|
| 0.08 | 0.55% | 14.67 | 14.67 | 14.53 | 14.61 | 105,830 | 22:42:38 |
| (a) | The Report to Shareholders is attached herewith. |

| Manager Commentary (unaudited) | 1 | |||
| Financial Data and Fund Performance | ||||
| 3 | ||||
| 5 | ||||
| Consolidated Schedules of Investments | ||||
| 7 | ||||
| 13 | ||||
| Consolidated Statements of Assets and Liabilities | 19 | |||
| Consolidated Statements of Operations | 20 | |||
| Consolidated Statements of Changes in Net Assets | ||||
| 21 | ||||
| 22 | ||||
| Consolidated Statements of Cash Flows | ||||
| 23 | ||||
| 24 | ||||
| Consolidated Financial Highlights | ||||
| 25 | ||||
| 27 | ||||
| Notes to Consolidated Financial Statements | 29 | |||
| Report of Independent Registered Public Accounting Firm | 47 | |||
| Fund Investment Objectives, Policies and Risks (unaudited) | 48 | |||
| Additional Information (unaudited) | 62 | |||
| Directors and Officers (unaudited) | 67 | |||
| Important Information About This Report | 69 |
1 |
JP Morgan High Yield Bond and Leveraged Loan Market Monitor, December 2023 |
2 |
PitchBook Data / LCD December Wrap |
Portfolio Composition (as % of Current Market Value of Investment Securities) | |||||
Loans |
90.4% | ||||
High Yield Bonds |
9.3% | ||||
Equity/Other |
0.3% | ||||
Portfolio Characteristics (a) | |||||
Weighted Average Floating-Rate Spread |
4.96% | ||||
Weighted Average Fixed-Rate Coupon |
7.53% | ||||
Weighted Average Maturity (in years) (floating assets) |
4.24 | ||||
Weighted Average Maturity (in years) (fixed assets) |
5.07 | ||||
Weighted Average Modified Duration (in years) (e) |
0.33 | ||||
Average Position Size by Issuer (f) |
$ | 3,807,597 | |||
Number of Issuers (f) |
93 | ||||
Floating Rate Exposure |
92.26% | ||||
Weighted Average S&P Rating (g) |
B | ||||
Weighted Average Rating Factor (Moody’s) (g) |
3,166 | ||||
Credit Quality (b) | |||||
BB |
4.4% | ||||
B |
54.8% | ||||
CCC+ or Lower |
9.6% | ||||
Not Rated |
31.2% | ||||
Top 5 Industries (as % of Current Market Value of Investment Securities) (c) | |||||
Services: Business |
18.3% | ||||
Healthcare & Pharmaceuticals |
15.1% | ||||
High Tech Industries |
15.0% | ||||
Banking, Finance, Insurance & Real Estate |
9.2% | ||||
Telecommunications |
6.0% | ||||
Total |
63.6% |
||||
Top 10 Issuers (as % of Current Market Value of Investment Securities) (d) | |||||
AOC |
2.9% | ||||
Gainwell Acquisition Corp. |
2.5% | ||||
Solera, LLC |
2.4% | ||||
DCert Buyer, Inc. |
2.4% | ||||
BDO USA, P.A. |
2.3% | ||||
Allied Universal Holdco, LLC |
2.2% | ||||
Garda World Security Corp. |
2.2% | ||||
Trident TPI Holdings, Inc. |
2.2% | ||||
McGraw-Hill Education, Inc. |
2.1% | ||||
Advarra Holdings, Inc. |
1.9% | ||||
Total |
23.1% |
||||
(a) |
Averages based on par value of investment securities, except for the percentage of floating rate exposure and the weighted average modified duration, which are based on market value. |
(b) |
Credit quality is calculated as a percentage of fair value of investment securities at December 31, 2023. The quality ratings reflected were issued by S&P Global Ratings (“S&P”), an internationally recognized statistical rating organization. Credit quality ratings reflect the rating agency’s opinion of the credit quality of the underlying positions in the Fund’s portfolio and not that of the Fund itself. Credit quality ratings are subject to change. |
(c) |
The industry classifications reported are from widely recognized market indexes or rating group indexes, and/or as defined by Fund management, with the primary source being Moody’s Investors Service (“Moody’s”), an internationally recognized statistical rating organization. |
(d) |
Holdings are subject to change and are provided for informational purposes only. |
(e) |
Excludes equity investments and includes fixed and floating rate assets. |
(f) |
Excludes equity investments. |
(g) |
Excludes securities with no rating or non-performing defaulted securities as of December 31, 2023. |
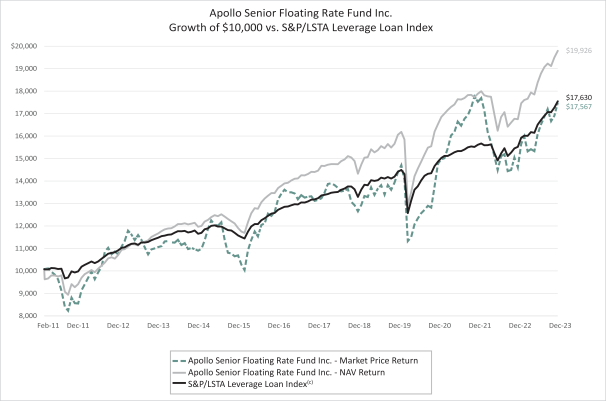
Performance Comparison |
||||||||||||||||||||||
YTD |
5 Yr |
10 Yr |
Since Inception (d) | |||||||||||||||||||
AFT - Market Price |
20.12% | (a) |
6.83% | (a)(b) |
4.79% | (a)(b) |
4.48% | (a)(b) | ||||||||||||||
AFT - NAV |
18.49% | (a) |
6.81% | (a)(b) |
5.54% | (a)(b) |
5.89% | (a)(b) | ||||||||||||||
S&P/LSTA Leveraged Loan Index (c) |
13.32% | 5.80% | (b) |
4.42% | (b) |
4.50% | (b) | |||||||||||||||
Distributions (e) | |||||
Current Monthly Distribution (per share) |
$0.137 | ||||
Current Distribution Rate at Market Price (f) |
12.41 | % | |||
Current Distribution Rate at NAV (f) |
10.94 | % | |||
(a) |
Performance reflects total return assuming all distributions were reinvested at the dividend reinvestment rate. Past performance does not necessarily indicate how the Fund will perform in the future. The performance information provided does not reflect the deduction of taxes that a shareholder would pay on distributions received from the Fund. |
(b) |
Annualized. |
(c) |
The S&P/LSTA Leveraged Loan Index is a broad index designed to reflect the performance of the U.S. dollar facilities in the leveraged loan market. |
(d) |
Inception date February 23, 2011. |
(e) |
All or a portion of the Fund’s distributions may be comprised of ordinary income, capital gains and/or return of capital. Refer to Note 7 in the Notes to the Consolidated Financial Statements. |
(f) |
Distribution rates represent the latest declared regular distribution, annualized, relative to the most recent month-end market price and NAV. Special distributions are not included in the calculation. |
Portfolio Composition (as % of Current Market Value of Investment Securities) | |||||
Loans |
74.9% | ||||
High Yield Bonds |
17.5% | ||||
Structured Products |
7.4% | ||||
Equity/Other |
0.2% | ||||
Portfolio Characteristics (a) | |||||
Weighted Average Floating-Rate Spread |
5.57% | ||||
Weighted Average Fixed-Rate Coupon |
6.73% | ||||
Weighted Average Maturity (in years) (floating assets) |
4.78 | ||||
Weighted Average Maturity (in years) (fixed assets) |
4.95 | ||||
Weighted Average Modified Duration (in years) (e) |
0.59 | ||||
Average Position Size by Issuer (f) |
$ | 3,362,592 | |||
Number of Issuers (f) |
100 | ||||
Floating Rate Exposure |
84.27% | ||||
Weighted Average S&P Rating (g) |
B | ||||
Weighted Average Rating Factor (Moody’s) (g) |
3,205 | ||||
Credit Quality (b) | |||||
BB |
10.2% | ||||
B |
37.7% | ||||
CCC+ or Lower |
11.0% | ||||
Not Rated |
41.1% | ||||
Top 5 Industries (as % of Current Market Value of Investment Securities) (c) | |||||
Healthcare & Pharmaceuticals |
16.6% | ||||
High Tech Industries |
14.2% | ||||
Services: Business |
9.6% | ||||
Banking, Finance, Insurance & Real Estate |
8.4% | ||||
Media: Advertising, Printing, & Publishing |
7.3% | ||||
Total |
56.1% |
||||
Top 10 Issuers (as % of Current Market Value of Investment Securities) (d) |
|||||
Churchill Middle Market CLO, Ltd. |
2.6% | ||||
Gainwell Acquisition Corp. |
2.6% | ||||
BDO USA, P.A. |
2.5% | ||||
Mavis Tire Express Services Corp. |
2.5% | ||||
DCert Buyer, Inc. |
2.4% | ||||
Fortress Credit CLO, Ltd. |
2.1% | ||||
Solera, LLC |
2.1% | ||||
Inovalon Holdings, Inc. |
2.1% | ||||
Advarra Holdings, Inc. |
2.0% | ||||
PetSmart, Inc. |
2.0% | ||||
Total |
22.9% |
||||
(a) |
Averages based on par value of investment securities, except for the percentage of floating rate exposure and the weighted average modified duration, which are based on market value. |
(b) |
Credit quality is calculated as a percentage of fair value of investment securities at December 31, 2023. The quality ratings reflected were issued by S&P, an internationally recognized statistical rating organization. Credit quality ratings reflect the rating agency’s opinion of the credit quality of the underlying positions in the Fund’s portfolio and not that of the Fund itself. Credit quality ratings are subject to change. |
(c) |
The industry classifications reported are from widely recognized market indexes or rating group indexes, and/or as defined by Fund management, with the primary source being Moody’s, an internationally recognized statistical rating organization. The Top 5 Industries table above excludes Structured Products which represents 7.4% of the portfolio as of December 31, 2023. |
(d) |
Holdings are subject to change and are provided for informational purposes only. |
(e) |
Excludes equity investments and includes fixed and floating rate assets. |
(f) |
Excludes equity investments. |
(g) |
Excludes securities with no rating or in default as of December 31, 2023. |
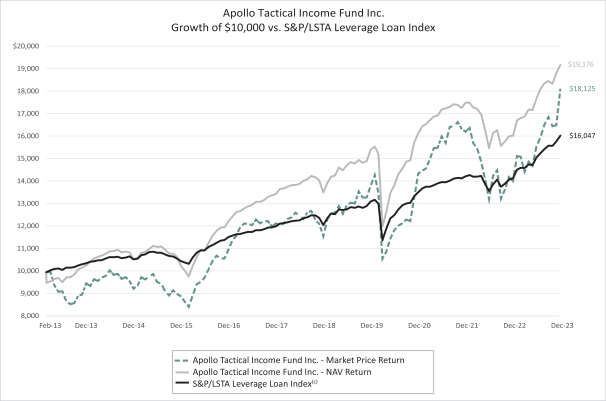
Performance Comparison | ||||||||||||||||||||||
YTD |
5 Yr |
10 Yr |
Since Inception (d) | |||||||||||||||||||
AIF - Market Price |
29.10 | % (a) |
9.35 | % (a)(b) |
6.66 | % (a)(b) |
5.64 | % (a)(b) | ||||||||||||||
AIF - NAV |
19.53 | % (a) |
7.23 | % (a)(b) |
6.40 | % (a)(b) |
6.64 | % (a)(b) | ||||||||||||||
S&P/LSTA Leveraged Loan Index (c) |
13.32 | % | 5.80 | % (b) |
4.42 | % (b) |
4.44 | % (b) | ||||||||||||||
Distributions (e) | |||||||||||||||
Current Monthly Distribution (per share) |
$0.133 | ||||||||||||||
Current Distribution Rate at Market Price (f) |
11.43 | % | |||||||||||||
Current Distribution Rate at NAV (f) |
10.81 | % | |||||||||||||
(a) |
Performance reflects total return assuming all distributions were reinvested at the dividend reinvestment rate. Past performance does not necessarily indicate how the Fund will perform in the future. The performance information provided does not reflect the deduction of taxes that a shareholder would pay on distributions received from the Fund. |
(b) |
Annualized. |
(c) |
The S&P/LSTA Leveraged Loan Index is a broad index designed to reflect the performance of the U.S. dollar facilities in the leveraged loan market. |
(d) |
Inception date February 25, 2013. |
(e) |
All or a portion of the Fund’s distributions may be comprised of ordinary income, capital gains and/or return of capital. Refer to Note 7 in the Notes to the Consolidated Financial Statements. |
(f) |
Distribution rates represent the latest declared regular distribution, annualized, relative to the most recent month-end market price and NAV. Special distributions are not included in the calculation. |
Principal Amount ($) |
Value ($) |
|||||||
Senior Loans - 129.8% (a) |
||||||||
AEROSPACE & DEFENSE - 2.3% |
||||||||
Peraton Corporation |
||||||||
First Lien Term Loan B, (1M SOFR + 3.75%, 0.75% Floor), 9.21%, 02/01/28 (c) |
5,431,514 | 5,451,882 | ||||||
BANKING, FINANCE, INSURANCE & REAL ESTATE - 13.0% |
||||||||
Apex Group Treasury, LLC |
||||||||
First Lien Term Loan, (3M SOFR + 3.75%, 0.50% Floor), 9.38%, 07/27/28 (c) |
2,911,835 | 2,904,556 | ||||||
First Lien Term Loan, (3M SOFR + 5.00%, 0.50% Floor), 10.40%, 07/27/28 (c) |
1,546,875 | 1,544,941 | ||||||
Asurion, LLC |
||||||||
First Lien Term Loan B9, (1M SOFR + 3.25%, 0.00% Floor), 8.72%, 07/31/27 (b) (c) |
997,436 | 991,591 | ||||||
Second Lien Term Loan B4, (1M SOFR + 5.25%, 0.00% Floor), 10.72%, 01/20/29 (c) |
3,866,174 | 3,658,058 | ||||||
Higginbotham Insurance Agency, Inc. |
||||||||
First Lien First AMD Delayed Draw Term Loan, (1M SOFR + 5.50%, 1.00% Floor), 10.96%, 11/25/26 (c)(d) |
249,550 | 249,550 | ||||||
First Lien Third AMD Delayed Draw Term Loan, (1M SOFR + 5.50%, 1.00% Floor), 10.96%, 11/24/28 (c)(d) |
590,520 | 590,520 | ||||||
First Lien Term Loan, (1M SOFR + 5.50%, 1.00% Floor), 10.96%, 11/24/28 (c)(d) |
855,932 | 855,933 | ||||||
Howden Group Holdings Ltd (United Kingdom) |
||||||||
First Lien Term Loan, (1M SOFR + 5.25%, 0.75% Floor), 10.61%, 11/12/27 (c)(d)(e) |
4,960,000 | 4,960,000 | ||||||
Insight XI Aggregator, L.P. (Cayman Islands) |
||||||||
First Lien Term Loan, (1M SOFR + 3.85%, 0.00% Floor), 9.21%, 08/28/24 (c)(d)(e) |
2,967,912 | 2,967,912 | ||||||
Redfin Corporation |
||||||||
First Lien Term Loan, (3M SOFR + 5.75%, 1.50% Floor), 11.24%, 10/20/28 (c)(d) |
1,745,625 | 1,693,256 | ||||||
SG Acquisition, Inc. |
||||||||
First Lien Incremental Term Loan, (3M SOFR + 6.00%, 0.50% Floor), 11.48%, 01/27/27 (c)(d) |
3,819,787 | 3,762,490 | ||||||
First Lien Term Loan, (3M SOFR + 6.00%, 0.50% Floor), 11.48%, 01/27/27 (c)(d) |
423,404 | 417,053 | ||||||
Stretto, Inc. |
||||||||
First Lien Term Loan, (3M SOFR + 6.00%, 1.00% Floor), 11.39%, 10/13/28 (c)(d) |
6,000,000 | 5,880,000 | ||||||
| 30,475,860 | ||||||||
Principal Amount ($) |
Value ($) |
|||||||
CAPITAL EQUIPMENT - 3.3% |
||||||||
Cube Industrials Buyer, Inc. |
||||||||
First Lien Term Loan, (3M SOFR + 6.00%, 1.00% Floor), 11.40%, 10/18/30 (c)(d) |
3,586,207 | 3,496,552 | ||||||
JPW Industries Holding Corporation |
||||||||
First Lien Term Loan, (3M SOFR + 5.88%, 2.00% Floor), 11.25%, 11/22/28 (c)(d) |
2,500,000 | 2,437,500 | ||||||
Safe Fleet Holdings, LLC |
||||||||
First Lien Term Loan, (1M SOFR + 5.00%, 0.50% Floor), 10.46%, 02/23/29 (c) |
394,000 | 397,448 | ||||||
Second Lien Term Loan, (1M SOFR + 6.75%, 1.00% Floor), 12.21%, 02/02/26 (c) |
1,403,846 | 1,372,961 | ||||||
| 7,704,461 | ||||||||
CHEMICALS, PLASTICS, & RUBBER - 7.9% |
||||||||
LSF11 A5 Holdco LLC |
||||||||
First Lien Term Loan, (1M SOFR + 3.50%, 0.50% Floor), 8.97%, 10/15/28 (c) |
3,714,745 | 3,728,694 | ||||||
First Lien Term Loan, (1M SOFR + 4.25%, 0.50% Floor), 9.71%, 10/15/28 (c) |
5,907,164 | 5,934,248 | ||||||
Luxembourg Investment Company 437 SARL (Luxembourg) |
||||||||
First Lien Term Loan, (2.00% PIK), (3M SOFR + 10.00%, 0.00% Floor), 15.65%, 04/30/24 (c)(d)(f) |
811,319 | 675,358 | ||||||
First Lien Term Loan B, (6M SOFR + 5.00%, 0.50% Floor), 0.00%, 01/03/29 (c)(e)(g) |
4,695,549 | 1,995,609 | ||||||
Olympus Water US Holding Corporation |
||||||||
First Lien Incremental Term Loan, (3M SOFR + 5.00%, 0.50% Floor), 10.35%, 11/09/28 (c) |
1,904,228 | 1,917,719 | ||||||
First Lien Term Loan, (3M SOFR + 4.50%, 0.50% Floor), 9.95%, 11/09/28 (c) |
2,762,176 | 2,769,647 | ||||||
W.R. Grace Holdings, LLC |
||||||||
First Lien Term Loan B, (3M SOFR + 3.75%, 0.50% Floor), 9.36%, 09/22/28 (c) |
1,421,231 | 1,427,961 | ||||||
| 18,449,236 | ||||||||
CONSUMER GOODS: DURABLE - 0.6% |
||||||||
Varsity Brands Holding Co., Inc. |
||||||||
First Lien Term Loan, (1M SOFR + 5.00%, 1.00% Floor), 10.47%, 12/15/26 (c) |
497,487 | 495,520 | ||||||
Weber-Stephen Products LLC |
||||||||
First Lien Term Loan, (1M SOFR + 3.25%, 0.75% Floor), 8.72%, 10/30/27 (c) |
1,074,905 | 946,685 | ||||||
| 1,442,205 | ||||||||
Principal Amount ($) |
Value ($) |
|||||||
Senior Loans (a) (continued) |
||||||||
CONSUMER GOODS: NON-DURABLE - 4.1% |
||||||||
ABG Intermediate Holdings 2 LLC |
||||||||
First Lien Term Loan, (1M SOFR + 3.50%, 0.50% Floor), 8.96%, 12/21/28 (c) |
4,227,690 | 4,252,633 | ||||||
| Iconix Brand Group | ||||||||
First Lien Term Loan, (3M SOFR + 6.00%, 1.00% Floor), 11.50%, 08/22/29 (c)(d) |
1,788,462 | 1,770,577 | ||||||
First Lien Term Loan, (3M SOFR + 6.00%, 1.00% Floor), 11.52%, 08/22/29 (c)(d) |
820,924 | 812,715 | ||||||
KDC/ONE Development Corporation, Inc. (Canada) |
||||||||
First Lien Term Loan, (1M SOFR + 5.00%, 0.00% Floor), 10.36%, 08/15/28 (c)(e ) |
2,827,596 | 2,808,510 | ||||||
| 9,644,435 | ||||||||
CONTAINERS, PACKAGING & GLASS - 6.2% |
||||||||
Anchor Glass Container Corporation |
||||||||
First Lien Term Loan, (3.75% PIK), (3M/6M SOFR + 5.00%, 1.00% Floor), 10.83%, 06/07/26 (c)(f) |
5,848,732 | 4,832,515 | ||||||
Berlin Packaging LLC |
||||||||
First Lien Term Loan B, (1M/3M SOFR + 3.75%, 0.50% Floor), 9.21%, 03/11/28 (c) |
2,292,017 | 2,297,358 | ||||||
Trident TPI Holdings, Inc. |
||||||||
First Lien Incremental Term Loan, (3M SOFR + 5.25%, 0.50% Floor), 10.60%, 09/15/28 (c) |
1,320,874 | 1,327,148 | ||||||
First Lien Term Loan B3, (3M SOFR + 4.00%, 0.50% Floor), 9.61%, 09/15/28 (c) |
5,950,448 | 5,941,790 | ||||||
| 14,398,811 | ||||||||
ENVIRONMENTAL INDUSTRIES - 3.5% |
||||||||
Dispatch Acquisition Holdings, LLC |
||||||||
First Lien Term Loan, (3M SOFR + 4.63%, 0.75% Floor), 10.12%, 03/27/28 (c) |
465,473 | 438,902 | ||||||
First Lien Term Loan B, (3M SOFR + 4.25%, 0.75% Floor), 9.75%, 03/27/28 (c) |
2,925,000 | 2,758,026 | ||||||
LTR Intermediate Holdings, Inc. |
||||||||
First Lien Term Loan, (1M SOFR + 4.50%, 1.00% Floor), 9.97%, 05/05/28 (c) |
5,238,195 | 4,878,069 | ||||||
| 8,074,997 | ||||||||
HEALTHCARE & PHARMACEUTICALS - 21.0% |
||||||||
Advarra Holdings, Inc. |
||||||||
First Lien Term Loan, (1M SOFR + 5.25%, 0.75% Floor), 10.61%, 08/24/29 (c)(d) |
6,355,651 | 6,323,872 | ||||||
Principal Amount ($) |
Value ($) |
|||||||
HEALTHCARE & PHARMACEUTICALS (continued) |
||||||||
Allied Benefit Systems Intermediate LLC |
||||||||
First Lien Term Loan, (3M SOFR + 5.25%, 0.75% Floor), 10.63%, 10/31/30 (c)(d) |
3,381,443 | 3,330,722 | ||||||
Athenahealth, Inc. |
||||||||
First Lien Term Loan B, (1M SOFR + 3.25%, 0.50% Floor), 8.61%, 02/15/29 (c) |
5,239,510 | 5,223,791 | ||||||
Azurity Pharmaceuticals, Inc. |
||||||||
First Lien Term Loan B, (1M SOFR + 6.62%, 0.75% Floor), 12.09%, 09/20/27 (c) |
2,661,805 | 2,578,623 | ||||||
Bausch Health Companies, Inc. |
||||||||
First Lien Term Loan B, (1M SOFR + 5.25%, 0.50% Floor), 10.71%, 02/01/27 (c) |
4,444,698 | 3,630,763 | ||||||
Gainwell Acquisition Corporation |
||||||||
First Lien Term Loan B, (3M SOFR + 4.00%, 0.75% Floor), 9.45%, 10/01/27 (c) |
8,476,495 | 8,264,582 | ||||||
Loire Finco Luxembourg SARL (United Kingdom) |
||||||||
First Lien Term Loan B, (1M SOFR + 3.75%, 0.75% Floor), 9.21%, 04/21/27 (c)(e) |
1,945,682 | 1,905,309 | ||||||
LSCS Holdings, Inc. |
||||||||
First Lien Term Loan, (1M SOFR + 4.50%, 0.50% Floor), 9.97%, 12/16/28 (c) |
2,001,046 | 1,975,533 | ||||||
Medical Solutions Holdings, Inc. |
||||||||
First Lien Term Loan, (1M SOFR + 3.25%, 0.50% Floor), 8.71%, 11/01/28 (c) |
3,926,632 | 3,697,591 | ||||||
OMH-Healthedge Holdings, Inc. |
||||||||
First Lien Term Loan, (3M SOFR + 6.00%, 1.00% Floor), 11.35%, 10/08/29 (c)(d) |
5,413,534 | 5,278,195 | ||||||
Resonetics, LLC |
||||||||
First Lien Term Loan, (3M SOFR + 4.00%, 0.75% Floor), 9.65%, 04/28/28 (c) |
3,910,000 | 3,918,152 | ||||||
Star Parent, Inc. |
||||||||
First Lien Term Loan B, (3M SOFR + 4.00%, 0.00% Floor), 9.35%, 09/27/30 (c) |
1,000,000 | 990,695 | ||||||
Zest Acquisition Corp. |
||||||||
First Lien Term Loan, (1M SOFR + 5.50%, 0.00% Floor), 10.86%, 02/08/28 (c) |
1,980,000 | 1,941,638 | ||||||
| 49,059,466 | ||||||||
Principal Amount ($) |
Value ($) |
|||||||
Senior Loans (a) (continued) |
||||||||
HIGH TECH INDUSTRIES - 19.0% |
||||||||
Anaplan, Inc. |
||||||||
First Lien Term Loan, (3M SOFR + 6.50%, 0.75% Floor), 11.85%, 06/21/29 (c)(d) |
5,650,529 | 5,678,782 | ||||||
Avalara, Inc. |
||||||||
First Lien Term Loan, (3M SOFR + 7.25%, 0.75% Floor), 12.60%, 10/19/28 (c)(d) |
4,545,455 | 4,568,182 | ||||||
Crewline Buyer, Inc. |
||||||||
First Lien Term Loan, (3M SOFR + 6.75%, 1.00% Floor), 12.10%, 11/08/30 (c)(d) |
1,811,321 | 1,766,038 | ||||||
DCert Buyer, Inc. |
||||||||
First Lien Term Loan, (1M SOFR + 4.00%, 0.00% Floor), 9.36%, 10/16/26 (c) |
4,568,577 | 4,537,694 | ||||||
Second Lien Term Loan, (1M SOFR + 7.00%, 0.00% Floor), 12.36%, 02/19/29 (c) |
3,927,401 | 3,593,572 | ||||||
Electronics for Imaging, Inc. |
||||||||
First Lien Term Loan, (3M SOFR + 5.00%, 0.00% Floor), 10.45%, 07/23/26 (c) |
4,862,745 | 2,969,314 | ||||||
Evergreen IX Borrower 2023, LLC |
||||||||
First Lien Term Loan, (3M SOFR + 6.00%, 0.75% Floor), 11.35%, 09/30/30 (c)(d) |
3,602,484 | 3,512,422 | ||||||
Flexera Software LLC |
||||||||
First Lien Term Loan B, (1M SOFR + 3.75%, 0.75% Floor), 9.22%, 03/03/28 (c) |
3,346,627 | 3,348,986 | ||||||
Imprivata, Inc. |
||||||||
Second Lien Term Loan, (3M SOFR + 6.25%, 0.50% Floor), 11.60%, 12/01/28 (c) |
2,205,882 | 2,117,647 | ||||||
Riverbed Technology, Inc. |
||||||||
First Lien Term Loan, (2.00% PIK), (3M SOFR + 4.50%, 1.00% Floor), 9.85%, 07/01/28 (c)(f) |
341,269 | 235,475 | ||||||
UKG, Inc. |
||||||||
First Lien Term Loan, (3M SOFR + 3.75%, 0.00% Floor), 9.23%, 05/04/26 (c) |
2,992,188 | 3,003,019 | ||||||
Second Lien Term Loan, (3M SOFR + 5.25%, 0.50% Floor), 10.68%, 05/03/27 (c) |
1,000,000 | 1,003,840 | ||||||
Virtusa Corporation |
||||||||
First Lien Term Loan, (1M SOFR + 3.75%, 0.75% Floor), 9.21%, 02/15/29 (c) |
3,711,414 | 3,721,621 | ||||||
Zendesk, Inc. |
||||||||
First Lien Term Loan, (3.25% PIK), (3M SOFR + 6.25%, 0.75% Floor), 11.61%, 11/22/28 (c)(d)(f) |
4,534,730 | 4,534,730 | ||||||
| 44,591,322 | ||||||||
Principal Amount ($) |
Value ($) |
|||||||
MEDIA: ADVERTISING, PRINTING & PUBLISHING - 7.5% |
||||||||
Associations Inc. |
||||||||
First Lien 4th Incremental Term Loan, (2.50% PIK), (3M SOFR + 6.50%, 1.00% Floor), 12.16%, 07/02/27 (c)(d)(f) |
359,999 | 359,999 | ||||||
First Lien Term Loan, (2.50% PIK), (3M SOFR + 6.50%, 1.00% Floor), 12.17%, 07/02/27 (c)(d)(f) |
3,115,992 | 3,115,992 | ||||||
Houghton Mifflin Harcourt Company |
||||||||
First Lien Term Loan B, (1M SOFR + 5.25%, 0.50% Floor), 10.71%, 04/09/29 (c) |
4,663,916 | 4,586,472 | ||||||
McGraw-Hill Education, Inc. |
||||||||
First Lien Term Loan, (1M SOFR + 4.75%, 0.50% Floor), 10.22%, 07/28/28 (c) |
6,183,468 | 6,185,416 | ||||||
R. R. Donnelley & Sons Company |
||||||||
First Lien Term Loan, (1M SOFR + 7.25%, 0.75% Floor), 12.71%, 03/17/28 (c) |
3,304,525 | 3,312,373 | ||||||
| 17,560,252 | ||||||||
MEDIA: BROADCASTING & SUBSCRIPTION - 2.9% |
||||||||
Anuvu Holdings 2, LLC |
||||||||
First Lien Delayed Draw Term Loan, (3M SOFR + 7.00%, 1.00% Floor), 12.46%, 03/25/24 (c)(d) |
73,747 | 72,088 | ||||||
First Lien Term Loan, (3M SOFR + 8.00%, 1.00% Floor), 13.46%, 03/24/25 (c) |
2,479,047 | 2,243,537 | ||||||
First Lien Term Loan, (8.25% PIK), (3M SOFR + 8.25%, 1.00% Floor), 13.71%, 03/23/26 (c)(d)(f) |
2,201,957 | 1,497,331 | ||||||
CSC Holdings, LLC |
||||||||
First Lien Term Loan B, (1M LIBOR + 2.25%, 0.00% Floor), 7.73%, 07/17/25 (c) |
2,977,444 | 2,936,519 | ||||||
| 6,749,475 | ||||||||
RETAIL - 3.6% |
||||||||
Claire’s Stores, Inc. |
||||||||
First Lien Term Loan B, (1M SOFR + 6.50%, 0.00% Floor), 11.95%, 12/18/26 (c) |
2,008,236 | 1,840,879 | ||||||
EG Group Limited (United Kingdom) |
||||||||
First Lien Term Loan, (SOFR + 5.50%, 0.00% Floor), 11.24%, 02/07/28 (c)(e) |
1,990,013 | 1,960,162 | ||||||
PetSmart, Inc. |
||||||||
First Lien Term Loan, (1M SOFR + 3.75%, 0.75% Floor), 9.21%, 02/11/28 (c) |
4,690,812 | 4,646,250 | ||||||
| 8,447,291 | ||||||||
Principal Amount ($) |
Value ($) |
|||||||
Senior Loans (a) (continued) |
||||||||
SERVICES: BUSINESS - 24.3% |
||||||||
Advantage Sales & Marketing Inc. |
||||||||
First Lien Term Loan B1, (3M SOFR + 4.50%, 0.75% Floor), 10.18%, 10/28/27 (c) |
2,951,662 | 2,937,362 | ||||||
Allied Universal Holdco LLC |
||||||||
First Lien Term Loan, (1M SOFR + 3.75%, 0.50% Floor), 9.21%, 05/12/28 (b)(c) |
6,517,227 | 6,500,348 | ||||||
BDO USA, P.A. |
||||||||
First Lien Term Loan, (1M SOFR + 6.00%, 2.00% Floor), 11.36%, 08/31/28 (c)(d) |
7,980,000 | 7,820,400 | ||||||
Carestream Health, Inc. |
||||||||
First Lien Term Loan, (3M SOFR + 7.50%, 1.00% Floor), 12.95%, 09/30/27 (c) |
116,773 | 91,266 | ||||||
Coretrust Purchasing Group LLC |
||||||||
First Lien Term Loan, (1M SOFR + 6.75%, 0.75% Floor), 12.11%, 10/01/29 (c)(d) |
2,300,075 | 2,231,073 | ||||||
Deerfield Dakota Holding, LLC |
||||||||
First Lien Term Loan, (3M SOFR + 3.75%, 1.00% Floor), 9.10%, 04/09/27 (c) |
6,205,790 | 6,159,246 | ||||||
eResearchTechnology, Inc. |
||||||||
First Lien Term Loan B, (1M SOFR + 4.50%, 1.00% Floor), 9.97%, 02/04/27 (c) |
6,310,879 | 6,312,362 | ||||||
Garda World Security Corporation (Canada) |
||||||||
First Lien Term Loan B, (3M SOFR + 4.25%, 0.00% Floor), 9.62%, 02/01/29 (c)(e) |
1,713,064 | 1,717,800 | ||||||
First Lien Term Loan B2, (3M SOFR + 4.25%, 0.00% Floor), 9.72%, 10/30/26 (c)(e) |
5,539,602 | 5,556,498 | ||||||
Ingenovis Health, Inc. |
||||||||
First Lien Term Loan, (1M SOFR + 4.25%, 0.50% Floor), 9.71%, 03/06/28 (c) |
990,000 | 962,775 | ||||||
First Lien Term Loan B, (1M SOFR + 3.75%, 0.75% Floor), 9.22%, 03/06/28 (c) |
3,913,477 | 3,810,748 | ||||||
Planet US Buyer LLC |
||||||||
First Lien Term Loan, (3M SOFR + 6.75%, 0.75% Floor), 12.13%, 02/01/30 (c)(d) |
2,756,944 | 2,688,021 | ||||||
Solera, LLC |
||||||||
First Lien Term Loan B, (1M SOFR + 4.00%, 0.50% Floor), 9.47%, 06/02/28 (c) |
3,982,781 | 3,934,490 | ||||||
Second Lien Term Loan, (3M SOFR + 9.00%, 1.00% Floor), 14.49%, 06/04/29 (c) |
4,266,509 | 4,202,511 | ||||||
Wellsky |
||||||||
First Lien Term Loan, (1M SOFR + 5.75%, 0.75% Floor), 11.22%, 03/10/28 (c)(d) |
1,975,000 | 1,975,000 | ||||||
| 56,899,900 | ||||||||
Principal Amount ($) |
Value ($) |
|||||||
SERVICES: CONSUMER - 1.9% |
||||||||
2U, Inc. |
||||||||
First Lien Term Loan B, (6M SOFR + 6.50%, 0.75% Floor), 11.95%, 12/28/26 (c) |
1,602,241 | 1,470,056 | ||||||
Mavis Tire Express Services Corporation |
||||||||
First Lien Term Loan B, (1M SOFR + 4.00%, 0.75% Floor), 9.47%, 05/04/28 (c) |
2,984,694 | 2,994,021 | ||||||
| 4,464,077 | ||||||||
TELECOMMUNICATIONS - 7.4% |
||||||||
CommScope, Inc. |
||||||||
First Lien Term Loan B, (1M SOFR + 3.25%, 0.00% Floor), 8.72%, 04/06/26 (c) |
3,722,098 | 3,338,257 | ||||||
Flight Bidco, Inc. |
||||||||
First Lien Term Loan, (1M SOFR + 3.50%, 0.00% Floor), 8.97%, 07/23/25 (c) |
2,577,408 | 2,541,505 | ||||||
MLN US Holdco LLC |
||||||||
First Lien Second Out Term Loan, (3M SOFR + 6.70%, 1.00% Floor), 12.20%, 10/18/27 (c)(d) |
3,807,495 | 2,874,658 | ||||||
First Lien Term Loan, (3M SOFR + 6.44%, 1.00% Floor), 11.94%, 10/18/27 (c)(d) |
638,138 | 611,017 | ||||||
Orbcomm, Inc. |
||||||||
First Lien Term Loan, (1M/3M SOFR + 4.25%, 0.75% Floor), 9.81%, 09/01/28 (c) |
1,029,007 | 980,129 | ||||||
U.S. TelePacific Corp. |
||||||||
First Lien Term Loan, (6.00% PIK), (3M SOFR + 7.00%, 1.00% Floor), 12.53%, 05/02/26 (c)(f) |
3,288,922 | 1,179,079 | ||||||
Third Lien Term Loan, 0.00%, 05/02/27 (c)(d)(j) |
319,086 | – | ||||||
Zacapa SARL (Luxembourg) |
||||||||
First Lien Term Loan, (3M SOFR + 4.00%, 0.50% Floor), 9.35%, 03/22/29 (c)(e) |
3,734,170 | 3,732,097 | ||||||
Zayo Group Holdings, Inc. |
||||||||
First Lien Term Loan, (1M SOFR + 4.33%, 0.50% Floor), 9.68%, 03/09/27 (c) |
2,391,956 | 2,062,320 | ||||||
| 17,319,062 | ||||||||
TRANSPORTATION: CARGO - 0.7% |
||||||||
Channelside AcquisitionCo, Inc. |
||||||||
First Lien Term Loan, (1M SOFR + 6.75%, 1.00% Floor), 12.11%, 06/30/28 (c)(d) |
1,773,714 | 1,747,109 | ||||||
WHOLESALE - 0.6% |
||||||||
LBM Acquisition, LLC |
||||||||
First Lien Term Loan B, (1M SOFR + 3.75%, 0.75% Floor), 9.21%, 12/17/27 (c) |
1,401,305 | 1,387,951 | ||||||
Total Senior Loans (Cost $313,490,289) |
303,867,792 |
|||||||
Principal Amount ($) |
Value ($) |
|||||||
Corporate Notes and Bonds - 13.4% |
||||||||
AUTOMOTIVE - 1.0% |
||||||||
Carvana Co. |
||||||||
(12.00% PIK),12.00%, 12/01/28 (f)(h)(i) |
989,000 | 842,208 | ||||||
(13.00% PIK),13.00%, 06/01/30 (f)(h)(i) |
852,000 | 719,408 | ||||||
(14.00% PIK),14.00%, 06/01/31 (f)(h)(i) |
995,000 | 852,466 | ||||||
| 2,414,082 | ||||||||
BANKING, FINANCE, INSURANCE & REAL ESTATE - 0.1% |
||||||||
KCF Puerto Rico, LLC (Puerto Rico) 0.00%, 06/28/28 (d)(e)(j) |
882,529 | 315,331 | ||||||
CHEMICALS, PLASTICS, & RUBBER - 0.3% |
||||||||
Cheever Escrow Issuer, LLC 7.13%, 10/01/27 (h)(i) |
750,000 | 750,128 | ||||||
CONSUMER GOODS: DURABLE - 1.5% |
||||||||
Varsity Brands Holding Co., Inc. (SOFR + 6.50%, 1.00% Floor), 11.83%, 12/15/26 (d)(i) |
3,500,000 | 3,447,500 | ||||||
ENERGY: OIL & GAS - 0.4% |
||||||||
Moss Creek Resources Holdings, Inc. 7.50%, 01/15/26 (h)(i) |
1,051,000 | 1,049,226 | ||||||
FOREST PRODUCTS & PAPER - 0.6% |
||||||||
Spa US Holdco, Inc. (Finland) 4.88%, 02/04/28 (e)(h)(i) |
1,500,000 | 1,319,531 | ||||||
HEALTHCARE & PHARMACEUTICALS - 0.7% |
||||||||
Bausch Health Companies, Inc. 5.50%, 11/01/25 (h)(i) |
750,000 | 686,528 | ||||||
Embecta Corp. 5.00%, 02/15/30 (h)(i) |
1,063,000 | 903,167 | ||||||
| 1,589,695 | ||||||||
HIGH TECH INDUSTRIES - 2.5% |
||||||||
Wolfspeed, Inc. 9.88%, 06/23/30 (d)(h)(i) |
6,000,000 | 5,797,800 | ||||||
HOTEL, GAMING & LEISURE - 0.5% |
||||||||
NCL Corporation Ltd. 9.75%, 02/22/28 (d)(h)(i) |
1,153,000 | 1,224,832 | ||||||
MEDIA: ADVERTISING, PRINTING & PUBLISHING - 0.4% |
||||||||
McGraw-Hill Education, Inc. 5.75%, 08/01/28 (h)(i) |
1,000,000 | 964,435 | ||||||
MEDIA: BROADCASTING & SUBSCRIPTION - 0.7% |
||||||||
CSC Holdings, LLC 4.13%, 12/01/30 (h)(i) |
2,000,000 | 1,512,750 | ||||||
METALS & MINING - 0.0% |
||||||||
ERP Iron Ore, LLC |
||||||||
LIBOR + 8.00%, 0.00%, 12/31/19 (d)(g)(j) |
18,879 | — | ||||||
Magnetation, LLC / Mag Finance Corp. 0.00%, 05/15/18 (d)(g)(h)(i)(j) |
639,000 | — | ||||||
| — | ||||||||
Principal Amount ($) |
Value ($) |
|||||||
RETAIL - 1.7% |
||||||||
EG Group Limited (United Kingdom) |
||||||||
(3.75% PIK), (SOFR + 7.50%, 0.50% Floor), 12.85%, 11/30/28 (d)(e)(f)(i) |
3,000,000 | 2,880,000 | ||||||
12.00%, 11/30/28 (e)(h)(i) |
976,000 | 1,040,057 | ||||||
| 3,920,057 | ||||||||
SERVICES: BUSINESS - 1.7% |
||||||||
Advantage Sales & Marketing Inc. 6.50%, 11/15/28 (h)(i) |
3,327,000 | 3,063,252 | ||||||
Allied Universal Holdco LLC 4.63%, 06/01/28 (h)(i) |
1,000,000 | 919,375 | ||||||
| 3,982,627 | ||||||||
TELECOMMUNICATIONS - 1.3% |
||||||||
Frontier Communications Holdings, LLC 5.00%, 05/01/28 (h)(i) |
3,239,000 | 3,001,973 | ||||||
Total Corporate Notes and Bonds (Cost $32,628,537) |
31,289,967 |
|||||||
Quantity |
Value ($) |
|||||||
Common Stocks - 0.4% |
||||||||
AUTOMOTIVE - 0.0% |
||||||||
APC Parent, Inc. (d)(j) |
241,972 | — | ||||||
ENERGY: OIL & GAS - 0.0% |
||||||||
RDV Resources, Inc. (d)(j) |
28,252 | 13,131 | ||||||
MEDIA: ADVERTISING, PRINTING & PUBLISHING - 0.0% |
||||||||
Acosta, Inc. (d)(j) |
3,133 | 34,938 | ||||||
MEDIA: BROADCASTING & SUBSCRIPTION - 0.0% |
||||||||
Anuvu Corp. (d)(j) |
108,418 | 41,199 | ||||||
SERVICES: BUSINESS - 0.4% |
||||||||
Carestream Health, Inc. (d)(j) |
118,564 | 750,510 | ||||||
Total Common Stocks (Cost $4,452,636) |
839,778 |
|||||||
Preferred Stock - 0.1% |
||||||||
MEDIA: ADVERTISING, PRINTING & PUBLISHING - 0.1% |
||||||||
Acosta, Inc., (14.50% PIK) (d)(f) |
4,439 | 230,144 | ||||||
Total Preferred Stock (Cost $170,424) |
230,144 |
|||||||
Partnership Interests - 0.0% |
||||||||
HIGH TECH INDUSTRIES - 0.0% |
||||||||
Vector Capitano Holdings, LP Class B-1 (Cayman Islands)(d)(e)(j) |
9,055 | — | ||||||
Vector Capitano Holdings, LP Class B-2 (Cayman Islands)(d)(e)(j) |
7,051 | — | ||||||
Total Partnership Interests (Cost $0) |
— |
|||||||
Total Investments - 143.6% |
336,227,681 |
|||||||
Other Assets & Liabilities, Net - 11.9% |
27,753,322 |
|||||||
Loan Outstanding - (55.5)% (k)(l) |
(129,900,531 |
) | ||||||
Net Assets (Applicable to Common Shares) - 100.0% |
234,080,472 |
|||||||
(a) |
“Senior Loans” are senior, secured loans made to companies whose debt is below investment grade as well as investments with similar economic characteristics. Senior Loans typically hold a first lien priority and, unless otherwise indicated, are required to pay interest at floating rates that are periodically reset by reference to a base lending rate plus a spread. In some instances, the rates shown represent the weighted average rate as of December 31, 2023. Senior Loans are generally not registered under the Securities Act of 1933 (the “1933 Act”) and often incorporate certain restrictions on resale and cannot be sold publicly. Senior Loans often require prepayments from excess cash flow or permit the borrower to repay at its election. The degree to which borrowers repay, whether as a contractual requirement or at their election, cannot be predicted with accuracy. As a result, the actual maturity may be substantially less than the stated maturity. |
(b) |
All or a portion of this Senior Loan position has not settled. Full contract rates do not take effect until settlement date and therefore are subject to change. |
(c) |
The interest rate on this Senior Loan is subject to a base lending rate plus a spread. These base lending rates are primarily the Secured Overnight Financing Rate (“SOFR”) and secondarily the synthetic London Interbank Offered Rate (“LIBOR”) or the prime rate offered by one or more major U.S. banks (“Prime”). The interest rate is subject to a minimum floor, which may be less than or greater than the prevailing period end LIBOR/SOFR/Prime rate. As of December 31, 2023, the 1, 3 and 6 month LIBOR rates were 5.47%, 5.59%, and 5.59%, respectively, the 1, 3 and 6 month SOFR rates were 5.35%, 5.33%, and 5.16%, respectively, and the Prime lending rate was 8.50%. Senior Loans may contain multiple contracts of the same issuer which may be subject to base lending rates of LIBOR, SOFR and Prime (“Variable”) in addition to the stated spread. |
(d) |
Fair Value Level 3 security. |
(e) |
Foreign issuer traded in U.S. dollars. |
(f) |
Represents a payment-in-kind |
(g) |
Issuer filed for bankruptcy and/or is in default of principal and/or interest payments. |
(h) |
Fixed rate asset. |
(i) |
Securities exempt from registration pursuant to Rule 144A under the 1933 Act. These securities may only be resold in transactions exempt from registration to qualified institutional buyers. At December 31, 2023, these securities amounted to $30,974,635, or 13.23% of net assets. |
(j) |
Non-income producing asset. |
(k) |
The Fund has granted a security interest in substantially all of its assets in the event of default under the credit facility. |
(l) |
Principal of $130,000,000 less unamortized deferred financing costs of $99,469. |
Principal Amount ($) |
Value ($) |
|||||||
Senior Loans - 111.0% (a) |
||||||||
AEROSPACE & DEFENSE - 2.6% |
||||||||
Peraton Corporation |
||||||||
First Lien Term Loan B, (1M SOFR + 3.75%, 0.75% Floor), 9.21%, 02/01/28 (c) |
5,431,514 | 5,451,882 | ||||||
BANKING, FINANCE, INSURANCE & REAL ESTATE - 10.8% |
||||||||
Asurion, LLC |
||||||||
Second Lien Term Loan B4, (1M SOFR + 5.25%, 0.00% Floor), 10.72%, 01/20/29 (c) |
2,885,398 | 2,730,077 | ||||||
Higginbotham Insurance Agency, Inc. |
||||||||
First Lien First AMD Delayed Draw Term Loan, (1M SOFR + 5.50%, 1.00% Floor), 10.96%, 11/25/26 (c)(d) |
249,550 | 249,550 | ||||||
First Lien Third AMD Delayed Draw Term Loan, (1M SOFR + 5.50%, 1.00% Floor), 10.96%, 11/24/28 (c)(d) |
590,520 | 590,520 | ||||||
First Lien Term Loan, (1M SOFR + 5.50%, 1.00% Floor), 10.96%, 11/24/28 (c)(d) |
855,932 | 855,933 | ||||||
Howden Group Holdings Ltd (United Kingdom) |
||||||||
First Lien Term Loan, (1M SOFR + 5.25%, 0.75% Floor), 10.61%, 11/12/27 (c)(d)(e) |
4,960,000 | 4,960,000 | ||||||
Insight XI Aggregator, L.P. (Cayman Islands) |
||||||||
First Lien Term Loan, (1M SOFR + 3.85%, 0.00% Floor), 9.21%, 08/28/24 (c)(d)(e) |
1,978,608 | 1,978,608 | ||||||
Redfin Corporation |
||||||||
First Lien Term Loan, (3M SOFR + 5.75%, 1.50% Floor), 11.24%, 10/20/28 (c)(d) |
1,745,625 | 1,693,256 | ||||||
SG Acquisition, Inc. |
||||||||
First Lien Incremental Term Loan, (3M SOFR + 6.00%, 0.50% Floor), 11.48%, 01/27/27 (c)(d) |
3,819,787 | 3,762,490 | ||||||
First Lien Term Loan, (3M SOFR + 6.00%, 0.50% Floor), 11.48%, 01/27/27 (c)(d) |
423,404 | 417,053 | ||||||
Stretto, Inc. |
||||||||
First Lien Term Loan, (3M SOFR + 6.00%, 1.00% Floor), 11.39%, 10/13/28 (c)(d) |
6,000,000 | 5,880,000 | ||||||
| 23,117,487 | ||||||||
BEVERAGE, FOOD & TOBACCO - 0.9% |
||||||||
Ultimate Baked Goods Midco LLC |
||||||||
First Lien Term Loan L, (1M SOFR + 6.25%, 1.00% Floor), 11.71%, 08/13/27 (c)(d) |
2,010,324 | 2,008,113 | ||||||
Principal Amount ($) |
Value ($) |
|||||||
CAPITAL EQUIPMENT - 3.4% |
||||||||
Cube Industrials Buyer, Inc. |
||||||||
First Lien Term Loan, (3M SOFR + 6.00%, 1.00% Floor), 11.40%, 10/18/30 (c)(d) |
3,586,207 | 3,496,552 | ||||||
JPW Industries Holding Corporation |
||||||||
First Lien Term Loan, (3M SOFR + 5.88%, 2.00% Floor), 11.25%, 11/22/28 (c)(d) |
2,500,000 | 2,437,500 | ||||||
Safe Fleet Holdings, LLC |
||||||||
Second Lien Term Loan, (1M SOFR + 6.75%, 1.00% Floor), 12.21%, 02/02/26 (c) |
1,403,846 | 1,372,961 | ||||||
| 7,307,013 | ||||||||
CHEMICALS, PLASTICS, & RUBBER - 5.6% |
||||||||
LSF11 A5 Holdco LLC |
||||||||
First Lien Term Loan, (1M SOFR + 4.25%, 0.50% Floor), 9.71%, 10/15/28 (c) |
5,907,164 | 5,934,248 | ||||||
Luxembourg Investment Company 437 SARL (Luxembourg) |
||||||||
First Lien Term Loan, (2.00% PIK), (3M SOFR + 10.00%, 0.00% Floor), 15.65%, 04/30/24 (c)(d)(f) |
811,319 | 675,358 | ||||||
First Lien Term Loan B, (6M SOFR + 5.00%, 0.50% Floor), 0.00%, 01/03/29 (c)(e)(g) |
4,695,549 | 1,995,609 | ||||||
Olympus Water US Holding Corporation |
||||||||
First Lien Incremental Term Loan, (3M SOFR + 5.00%, 0.50% Floor), 10.35%, 11/09/28 (c) |
1,904,228 | 1,917,719 | ||||||
W.R. Grace Holdings, LLC |
||||||||
First Lien Term Loan B, (3M SOFR + 3.75%, 0.50% Floor), 9.36%, 09/22/28 (c) |
1,421,231 | 1,427,961 | ||||||
| 11,950,895 | ||||||||
CONSUMER GOODS: DURABLE - 0.6% |
||||||||
Varsity Brands Holding Co., Inc. |
||||||||
First Lien Term Loan, (1M SOFR + 5.00%, 1.00% Floor), 10.47%, 12/15/26 (c) |
497,487 | 495,520 | ||||||
Weber-Stephen Products LLC |
||||||||
First Lien Term Loan, (1M SOFR + 3.25%, 0.75% Floor), 8.72%, 10/30/27 (c) |
972,493 | 856,489 | ||||||
| 1,352,009 | ||||||||
CONSUMER GOODS: NON-DURABLE - 3.2% |
||||||||
ABG Intermediate Holdings 2 LLC |
||||||||
First Lien Term Loan, (1M SOFR + 3.50%, 0.50% Floor), 8.96%, 12/21/28 (c) |
1,503,905 | 1,512,778 | ||||||
Principal Amount ($) |
Value ($) |
|||||||
Senior Loans (a) (continued) |
||||||||
CONSUMER GOODS: NON-DURABLE (continued) |
||||||||
Iconix Brand Group |
||||||||
First Lien Term Loan, (3M SOFR + 6.00%, 1.00% Floor), 11.50%, 08/22/29 (c)(d) |
1,788,462 | 1,770,577 | ||||||
First Lien Term Loan, (3M SOFR + 6.00%, 1.00% Floor), 11.52%, 08/22/29 (c)(d) |
820,924 | 812,715 | ||||||
KDC/ONE Development Corporation, Inc. (Canada) |
||||||||
First Lien Term Loan, (1M SOFR + 5.00%, 0.00% Floor), 10.36%, 08/15/28 (c)(e) |
2,827,596 | 2,808,510 | ||||||
| 6,904,580 | ||||||||
CONTAINERS, PACKAGING & GLASS - 4.0% |
||||||||
Anchor Glass Container Corporation |
||||||||
First Lien Term Loan, (3.75% PIK), (3M/6M SOFR + 5.00%, 1.00% Floor), 10.83%, 06/07/26 (c)(f) |
5,669,542 | 4,684,459 | ||||||
LABL, Inc. |
||||||||
First Lien Term Loan, (1M SOFR + 5.00%, 0.50% Floor), 10.46%, 10/29/28 (b)(c) |
1,994,911 | 1,918,735 | ||||||
Trident TPI Holdings, Inc. |
||||||||
First Lien Incremental Term Loan, (3M SOFR + 5.25%, 0.50% Floor), 10.60%, 09/15/28 (c) |
1,980,000 | 1,989,405 | ||||||
| 8,592,599 | ||||||||
ENVIRONMENTAL INDUSTRIES - 2.3% |
||||||||
LTR Intermediate Holdings, Inc. |
||||||||
First Lien Term Loan, (1M SOFR + 4.50%, 1.00% Floor), 9.97%, 05/05/28 (c) |
5,238,195 | 4,878,069 | ||||||
HEALTHCARE & PHARMACEUTICALS - 23.9% |
||||||||
Advarra Holdings, Inc. |
||||||||
First Lien Term Loan, (1M SOFR + 5.25%, 0.75% Floor), 10.61%, 08/24/29 (c)(d) |
6,355,651 | 6,323,872 | ||||||
Allied Benefit Systems Intermediate LLC |
||||||||
First Lien Term Loan, (3M SOFR + 5.25%, 0.75% Floor), 10.63%, 10/31/30 (c)(d) |
2,536,082 | 2,498,041 | ||||||
Athenahealth, Inc. |
||||||||
First Lien Term Loan B, (1M SOFR + 3.25%, 0.50% Floor), 8.61%, 02/15/29 (c) |
4,011,802 | 3,999,766 | ||||||
Azurity Pharmaceuticals, Inc. |
||||||||
First Lien Term Loan B, (1M SOFR + 6.62%, 0.75% Floor), 12.09%, 09/20/27 (c) |
3,371,619 | 3,266,256 | ||||||
Principal Amount ($) |
Value ($) |
|||||||
HEALTHCARE & PHARMACEUTICALS (continued) |
||||||||
Bausch Health Companies, Inc. |
||||||||
First Lien Term Loan B, (1M SOFR + 5.25%, 0.50% Floor), 10.71%, 02/01/27 (c) |
3,516,618 | 2,872,637 | ||||||
Gainwell Acquisition Corporation |
||||||||
First Lien Term Loan B, (3M SOFR + 4.00%, 0.75% Floor), 9.45%, 10/01/27 (c) |
8,476,495 | 8,264,582 | ||||||
Gateway US Holdings, Inc. |
||||||||
First Lien Delayed Draw Term Loan, (3M SOFR + 6.50%, 0.75% Floor), 12.00%, 09/22/26 (c)(d) |
145,499 | 144,772 | ||||||
First Lien Eighth AMD Delayed Draw, (3M SOFR + 6.50%, 0.75% Floor), 12.00%, 09/22/26 (c)(d) |
640,695 | 637,491 | ||||||
First Lien Term Loan, (3M SOFR + 6.50%, 0.75% Floor), 12.00%, 09/22/26 (c)(d) |
2,788,975 | 2,775,030 | ||||||
Inovalon Holdings, Inc. |
||||||||
First Lien Term Loan, (2.75% PIK), (1M SOFR + 6.25%, 0.75% Floor), 11.72%, 11/24/28 (c)(d)(f) |
6,532,807 | 6,451,147 | ||||||
Second Lien Term Loan, (15.97% PIK), (1M SOFR + 10.50%, 0.75% Floor), 15.97%, 11/25/33 (c)(d)(f) |
133,888 | 131,210 | ||||||
Medical Solutions Holdings, Inc. |
||||||||
First Lien Term Loan, (1M SOFR + 3.25%, 0.50% Floor), 8.71%, 11/01/28 (c) |
2,608,147 | 2,456,013 | ||||||
OMH-Healthedge Holdings, Inc. |
||||||||
First Lien Term Loan, (3M SOFR + 6.00%, 1.00% Floor), 11.35%, 10/08/29 (c)(d) |
4,511,278 | 4,398,496 | ||||||
Tivity Health, Inc. |
||||||||
First Lien Term Loan, (3M SOFR + 6.00%, 0.75% Floor), 11.35%, 06/28/29 (c)(d) |
4,937,500 | 4,875,781 | ||||||
Zest Acquisition Corp. |
||||||||
First Lien Term Loan, (1M SOFR + 5.50%, 0.00% Floor), 10.86%, 02/08/28 (c) |
1,980,000 | 1,941,637 | ||||||
| 51,036,731 | ||||||||
HIGH TECH INDUSTRIES - 18.0% |
||||||||
Anaplan, Inc. |
||||||||
First Lien Term Loan, (3M SOFR + 6.50%, 0.75% Floor), 11.85%, 06/21/29 (c)(d) |
5,650,529 | 5,678,782 | ||||||
Avalara, Inc. |
||||||||
First Lien Term Loan, (3M SOFR + 7.25%, 0.75% Floor), 12.60%, 10/19/28 (c)(d) |
4,545,455 | 4,568,182 | ||||||
Crewline Buyer, Inc. |
||||||||
First Lien Term Loan, (3M SOFR + 6.75%, 1.00% Floor), 12.10%, 11/08/30 (c)(d) |
1,811,321 | 1,766,038 | ||||||
Principal Amount ($) |
Value ($) |
|||||||
Senior Loans (a) (continued) |
||||||||
HIGH TECH INDUSTRIES (continued) |
||||||||
DCert Buyer, Inc. |
||||||||
First Lien Term Loan, (1M SOFR + 4.00%, 0.00% Floor), 9.36%, 10/16/26 (c) |
4,112,787 | 4,084,985 | ||||||
Second Lien Term Loan, (1M SOFR + 7.00%, 0.00% Floor), 12.36%, 02/19/29 (c) |
3,933,068 | 3,598,757 | ||||||
Electronics for Imaging, Inc. |
||||||||
First Lien Term Loan, (3M SOFR + 5.00%, 0.00% Floor), 10.45%, 07/23/26 (c) |
979,270 | 597,967 | ||||||
Evergreen IX Borrower 2023, LLC |
||||||||
First Lien Term Loan, (3M SOFR + 6.00%, 0.75% Floor), 11.35%, 09/30/30 (c)(d) |
3,602,484 | 3,512,422 | ||||||
Imprivata, Inc. |
||||||||
First Lien Term Loan, (1M SOFR + 3.75%, 0.50% Floor), 9.22%, 12/01/27 (c) |
489,924 | 492,286 | ||||||
Second Lien Term Loan, (3M SOFR + 6.25%, 0.50% Floor), 11.60%, 12/01/28 (c) |
2,205,882 | 2,117,647 | ||||||
IQN Holding Corp. |
||||||||
First Lien Term Loan, (3M SOFR + 5.25%, 0.75% Floor), 10.64%, 05/02/29 (c)(d) |
4,048,445 | 4,048,445 | ||||||
Riverbed Technology, Inc. |
||||||||
First Lien Term Loan, (2.00% PIK), (3M SOFR + 4.50%, 1.00% Floor), 9.85%, 07/01/28 (c)(f) |
304,704 | 210,246 | ||||||
UKG, Inc. |
||||||||
First Lien Term Loan, (3M SOFR + 3.75%, 0.00% Floor), 9.23%, 05/04/26 (c) |
1,994,792 | 2,002,013 | ||||||
Virtusa Corporation |
||||||||
First Lien Term Loan, (1M SOFR + 3.75%, 0.75% Floor), 9.21%, 02/15/29 (c) |
2,728,914 | 2,736,419 | ||||||
Zendesk, Inc. |
||||||||
First Lien Term Loan, (3.25% PIK), (3M SOFR + 6.25%, 0.75% Floor), 11.61%, 11/22/28 (c)(d)(f) |
3,033,537 | 3,033,537 | ||||||
| 38,447,726 | ||||||||
MEDIA: ADVERTISING, PRINTING & PUBLISHING - 9.8% |
||||||||
Accelerate360 Holdings, LLC |
||||||||
First Lien Revolving Term Loan, (3M SOFR + 6.00%, 0.00% Floor), 11.64%, 02/04/27 (c)(d) |
1,017,747 | 1,017,747 | ||||||
First Lien Term Loan, (3M SOFR + 6.00%, 0.00% Floor), 11.64%, 02/04/27 (c)(d) |
3,880,921 | 3,880,921 | ||||||
Associations Inc. |
||||||||
First Lien 4th Incremental Term Loan, (2.50% PIK), (3M SOFR + 6.50%, 1.00% Floor), 12.16%, 07/02/27 (c)(d)(f) |
359,999 | 359,999 | ||||||
First Lien Term Loan, (2.50% PIK), (3M SOFR + 6.50%, 1.00% Floor), 12.17%, 07/02/27 (c)(d)(f) |
3,115,992 | 3,115,992 | ||||||
Principal Amount ($) |
Value ($) |
|||||||
MEDIA: ADVERTISING, PRINTING & PUBLISHING (continued) |
||||||||
Houghton Mifflin Harcourt Company |
||||||||
First Lien Term Loan B, (1M SOFR + 5.25%, 0.50% Floor), 10.71%, 04/09/29 (c) |
4,128,324 | 4,059,773 | ||||||
McGraw-Hill Education, Inc. |
||||||||
First Lien Term Loan, (1M SOFR + 4.75%, 0.50% Floor), 10.22%, 07/28/28 (c) |
5,252,730 | 5,254,385 | ||||||
R. R. Donnelley & Sons Company |
||||||||
First Lien Term Loan, (1M SOFR + 7.25%, 0.75% Floor), 12.71%, 03/17/28 (c) |
3,304,525 | 3,312,373 | ||||||
| 21,001,190 | ||||||||
MEDIA: BROADCASTING & SUBSCRIPTION - 1.7% |
||||||||
Anuvu Holdings 2, LLC |
||||||||
First Lien Delayed Draw Term Loan, (3M SOFR + 7.00%, 1.00% Floor), 12.46%, 03/25/24 (c)(d) |
69,796 | 68,225 | ||||||
First Lien Term Loan, (3M SOFR + 8.00%, 1.00% Floor), 13.46%, 03/24/25 (c) |
2,346,207 | 2,123,317 | ||||||
First Lien Term Loan, (8.25% PIK), (3M SOFR + 8.25%, 1.00% Floor), 13.71%, 03/23/26 (c)(d)(f) |
2,083,965 | 1,417,096 | ||||||
| 3,608,638 | ||||||||
RETAIL - 2.9% |
||||||||
Claire’s Stores, Inc. |
||||||||
First Lien Term Loan B, (1M SOFR + 6.50%, 0.00% Floor), 11.95%, 12/18/26 (c) |
2,008,236 | 1,840,879 | ||||||
PetSmart, Inc. |
||||||||
First Lien Term Loan, (1M SOFR + 3.75%, 0.75% Floor), 9.21%, 02/11/28 (c) |
4,362,374 | 4,320,931 | ||||||
| 6,161,810 | ||||||||
SERVICES: BUSINESS - 12.0% |
||||||||
Advantage Sales & Marketing Inc. |
||||||||
First Lien Term Loan B1, (3M SOFR + 4.50%, 0.75% Floor), 10.18%, 10/28/27 (c) |
1,356,037 | 1,349,467 | ||||||
BDO USA, P.A. |
||||||||
First Lien Term Loan, (1M SOFR + 6.00%, 2.00% Floor), 11.36%, 08/31/28 (c)(d) |
7,980,000 | 7,820,400 | ||||||
Carestream Health, Inc. |
||||||||
First Lien Term Loan, (3M SOFR + 7.50%, 1.00% Floor), 12.95%, 09/30/27 (c) |
54,489 | 42,586 | ||||||
Coretrust Purchasing Group LLC |
||||||||
First Lien Term Loan, (1M SOFR + 6.75%, 0.75% Floor), 12.11%, 10/01/29 (c)(d) |
2,300,075 | 2,231,073 | ||||||
Principal Amount ($) |
Value ($) |
|||||||
Senior Loans (a) (continued) |
||||||||
SERVICES: BUSINESS (continued) |
||||||||
eResearchTechnology, Inc. |
||||||||
First Lien Term Loan B, (1M SOFR + 4.50%, 1.00% Floor), 9.97%, 02/04/27 (c) |
2,995,629 | 2,996,333 | ||||||
Planet US Buyer LLC |
||||||||
First Lien Term Loan, (3M SOFR + 6.75%, 0.75% Floor), 12.13%, 02/01/30 (c)(d) |
2,756,944 | 2,688,021 | ||||||
Solera, LLC |
||||||||
First Lien Term Loan B, (1M SOFR + 4.00%, 0.50% Floor), 9.47%, 06/02/28 (c) |
2,802,816 | 2,768,832 | ||||||
Second Lien Term Loan, (3M SOFR + 9.00%, 1.00% Floor), 14.49%, 06/04/29 (c) |
3,903,653 | 3,845,098 | ||||||
Wellsky |
||||||||
First Lien Term Loan, (1M SOFR + 5.75%, 0.75% Floor), 11.22%, 03/10/28 (c)(d) |
1,975,000 | 1,975,000 | ||||||
| 25,716,810 | ||||||||
SERVICES: CONSUMER - 2.6% |
||||||||
Mavis Tire Express Services Corporation |
||||||||
First Lien Term Loan B, (1M SOFR + 4.00%, 0.75% Floor), 9.47%, 05/04/28 (c) |
5,572,080 | 5,589,493 | ||||||
TELECOMMUNICATIONS - 5.3% |
||||||||
CommScope, Inc. |
||||||||
First Lien Term Loan B, (1M SOFR + 3.25%, 0.00% Floor), 8.72%, 04/06/26 (b)(c) |
2,637,893 | 2,365,861 | ||||||
Flight Bidco, Inc. |
||||||||
First Lien Term Loan, (1M SOFR + 3.50%, 0.00% Floor), 8.97%, 07/23/25 (c) |
2,359,252 | 2,326,388 | ||||||
MLN US Holdco LLC |
||||||||
First Lien Second Out Term Loan, (3M SOFR + 6.70%, 1.00% Floor), 12.20%, 10/18/27 (c)(d) |
2,284,497 | 1,724,795 | ||||||
First Lien Term Loan, (3M SOFR + 6.44%, 1.00% Floor), 11.94%, 10/18/27 (c)(d) |
382,882 | 366,610 | ||||||
U.S. TelePacific Corp. |
||||||||
First Lien Term Loan, (6.00% PIK), (3M SOFR + 7.00%, 1.00% Floor), 12.53%, 05/02/26 (c)(f) |
3,288,922 | 1,179,079 | ||||||
Third Lien Term Loan, 0.00%, 05/02/27 (c)(d)(j) |
319,086 | — | ||||||
Zacapa SARL (Luxembourg) |
||||||||
First Lien Term Loan, (3M SOFR + 4.00%, 0.50% Floor), 9.35%, 03/22/29 (c)(e) |
2,746,733 | 2,745,208 | ||||||
Zayo Group Holdings, Inc. |
||||||||
First Lien Term Loan, (1M SOFR + 4.33%, 0.50% Floor), 9.68%, 03/09/27 (c) |
610,505 | 526,371 | ||||||
| 11,234,312 | ||||||||
Principal Amount ($) |
Value ($) |
|||||||
TRANSPORTATION: CARGO - 0.8% |
||||||||
Channelside AcquisitionCo, Inc. |
||||||||
First Lien Term Loan, (1M SOFR + 6.75%, 1.00% Floor), 12.11%, 06/30/28 (c)(d) |
1,773,714 | 1,747,109 | ||||||
WHOLESALE - 0.5% |
||||||||
LBM Acquisition, LLC |
||||||||
First Lien Term Loan B, (1M SOFR + 3.75%, 0.75% Floor), 9.21%, 12/17/27 (c) |
990,896 | 981,453 | ||||||
Total Senior Loans (Cost $244,129,405) |
237,087,919 |
|||||||
Corporate Notes and Bonds - 24.9% |
||||||||
AEROSPACE & DEFENSE - 1.0% |
||||||||
Transdigm, Inc. |
||||||||
7.13%, 12/01/31 (h)(i) |
2,000,000 | 2,106,811 | ||||||
AUTOMOTIVE - 1.6% |
||||||||
Carvana Co. |
||||||||
(12.00% PIK), 12.00%, 12/01/28 (f)(h)(i) |
1,379,000 | 1,174,322 | ||||||
(13.00% PIK), 13.00%, 06/01/30 (f)(h)(i) |
1,188,000 | 1,003,118 | ||||||
(14.00% PIK), 14.00%, 06/01/31 (f)(h)(i) |
1,387,000 | 1,188,312 | ||||||
| 3,365,752 | ||||||||
BANKING, FINANCE, INSURANCE & REAL ESTATE - 1.6% |
||||||||
Alliant Holdings Intermediate, LLC |
||||||||
5.88%, 11/01/29 (h)(i) |
3,400,000 | 3,235,525 | ||||||
KCF Puerto Rico, LLC (Puerto Rico) |
||||||||
0.00%, 06/28/28 (d)(e)(j) |
814,642 | 291,075 | ||||||
| 3,526,600 | ||||||||
CHEMICALS, PLASTICS, & RUBBER - 0.9% |
||||||||
W.R. Grace Holdings, LLC |
||||||||
4.88%, 06/15/27 (h)(i) |
2,000,000 | 1,926,586 | ||||||
CONSUMER GOODS: DURABLE - 1.6% |
||||||||
Varsity Brands Holding Co., Inc. |
||||||||
(SOFR + 6.50%, 1.00% Floor), 11.83%, 12/15/26 (d)(i) |
3,500,000 | 3,447,500 | ||||||
ENERGY: OIL & GAS - 2.6% |
||||||||
Moss Creek Resources Holdings, Inc. |
||||||||
7.50%, 01/15/26 (h)(i) |
1,433,000 | 1,430,582 | ||||||
Sitio Royalties Operating Partnership LP |
||||||||
7.88%, 11/01/28 (h)(i) |
1,000,000 | 1,035,000 | ||||||
Venture Global LNG, Inc. |
||||||||
8.13%, 06/01/28 (h)(i) |
3,000,000 | 3,026,775 | ||||||
| 5,492,357 | ||||||||
Principal Amount ($) |
Value ($) |
|||||||
Corporate Notes and Bonds (continued) |
||||||||
ENVIRONMENTAL INDUSTRIES - 0.4% |
||||||||
GFL Environmental Inc. (Canada) |
||||||||
6.75%, 01/15/31 (e)(h)(i) |
776,000 | 799,376 | ||||||
FOREST PRODUCTS & PAPER - 0.6% |
||||||||
Spa US Holdco, Inc. (Finland) |
||||||||
4.88%, 02/04/28 (e)(h)(i) |
1,500,000 | 1,319,531 | ||||||
HEALTHCARE & PHARMACEUTICALS - 0.6% |
||||||||
Bausch Health Companies, Inc. |
||||||||
5.50%, 11/01/25 (h)(i) |
500,000 | 457,685 | ||||||
Embecta Corp. |
||||||||
5.00%, 02/15/30 (h)(i) |
1,063,000 | 903,167 | ||||||
| 1,360,852 | ||||||||
HIGH TECH INDUSTRIES - 3.1% |
||||||||
Austin BidCo Inc. |
||||||||
7.13%, 12/15/28 (h)(i) |
2,000,000 | 1,738,750 | ||||||
Wolfspeed, Inc. |
||||||||
9.88%, 06/23/30 (d)(h)(i) |
5,000,000 | 4,831,500 | ||||||
| 6,570,250 | ||||||||
HOTEL, GAMING & LEISURE - 2.7% |
||||||||
CDI Escrow Issuer, Inc. |
||||||||
5.75%, 04/01/30 (h)(i) |
2,000,000 | 1,952,044 | ||||||
6.75%, 05/01/31 (h)(i) |
2,500,000 | 2,543,750 | ||||||
NCL Corporation Ltd. |
||||||||
9.75%, 02/22/28 (d)(h)(i) |
1,153,000 | 1,224,832 | ||||||
| 5,720,626 | ||||||||
MEDIA: ADVERTISING, PRINTING & PUBLISHING - 0.9% |
||||||||
Outfront Media Capital, LLC |
||||||||
5.00%, 08/15/27 (h)(i) |
2,000,000 | 1,947,540 | ||||||
METALS & MINING - 0.0% |
||||||||
ERP Iron Ore, LLC |
||||||||
LIBOR + 8.00%, 0.00%, 12/31/19 (d)(g)(j) |
86,775 | — | ||||||
Magnetation, LLC / Mag Finance Corp. |
||||||||
0.00%, 05/15/18 (d)(g)(h)(i)(j) |
2,937,000 | — | ||||||
| — | ||||||||
RETAIL - 2.7% |
||||||||
EG Group Limited (United Kingdom) |
||||||||
(3.75% PIK), (SOFR + 7.50%, 0.50% Floor), 12.85%, 11/30/28 (d)(e)(f)(i) |
3,000,000 | 2,880,000 | ||||||
12.00%, 11/30/28 (e)(h)(i) |
976,000 | 1,040,057 | ||||||
PetSmart, Inc. |
||||||||
7.75%, 02/15/29 (h)(i) |
2,000,000 | 1,937,980 | ||||||
| 5,858,037 | ||||||||
SERVICES: BUSINESS - 2.0% |
||||||||
Advantage Sales & Marketing Inc. |
||||||||
6.50%, 11/15/28 (h)(i) |
2,683,000 | 2,470,305 | ||||||
Allied Universal Holdco LLC |
||||||||
4.63%, 06/01/28 (h)(i) |
2,000,000 | 1,838,750 | ||||||
| 4,309,055 | ||||||||
Principal Amount ($) |
Value ($) |
|||||||
SERVICES: CONSUMER - 1.0% |
||||||||
Mavis Tire Express Services Corporation |
||||||||
6.50%, 05/15/29 (h)(i) |
2,405,000 | 2,178,630 | ||||||
TELECOMMUNICATIONS - 1.0% |
||||||||
Frontier Communications Holdings, LLC |
||||||||
8.63%, 03/15/31 (h)(i) |
2,000,000 | 2,038,125 | ||||||
WHOLESALE - 0.6% |
||||||||
LBM Acquisition, LLC |
||||||||
6.25%, 01/15/29 (h)(i) |
1,344,000 | 1,197,840 | ||||||
Total Corporate Notes and Bonds (Cost $54,595,232) |
53,165,468 |
|||||||
Convertible Bonds - 1.1% |
||||||||
HOTEL, GAMING & LEISURE - 1.1% |
||||||||
Peloton Interactive, Inc. |
||||||||
0.00%, 02/15/26 (h)(j) |
3,000,000 | 2,307,532 | ||||||
Total Convertible Bonds (Cost $2,525,455) |
2,307,532 |
|||||||
Structured Products - 11.0% (m) |
||||||||
Basswood Park CLO Ltd (Cayman Islands) |
||||||||
2021-1, Class E 11.83%, 04/20/34(e)(i)(n) |
2,000,000 | 1,926,508 | ||||||
Churchill Middle Market CLO, Ltd. (Cayman Islands) |
||||||||
2021-1A E, Class E 13.82%, 10/24/33(e)(i)(n) |
4,000,000 | 3,632,792 | ||||||
Fortress Credit BSL CLO, Ltd. (Cayman Islands) |
||||||||
2021-3, Class E 12.74%, 07/20/34(e)(i)(n) |
3,000,000 | 2,999,664 | ||||||
Fortress Credit Opportunities CLO, Ltd. (Cayman Islands) |
||||||||
2018-11A, Class E 12.81%, 04/15/31(e)(i)(n) |
4,000,000 | 3,773,323 | ||||||
Franklin Park Place CLO, Ltd. (Cayman Islands) |
||||||||
2022-1A, Class E 12.89%, 04/14/35(e)(i)(n) |
2,000,000 | 1,913,574 | ||||||
Golub Capital Partners CLO, Ltd. (Cayman Islands) |
||||||||
2021-55A, Class E 12.24%, 07/20/34(e)(i)(n) |
2,000,000 | 1,952,194 | ||||||
KKR Financial CLO, Ltd. (Cayman Islands) |
||||||||
2017, Class ER 13.05%, 04/15/34 (e)(i)(n) |
2,750,000 | 2,615,616 | ||||||
TIAA Churchill Middle Market CLO, Ltd. (Cayman Islands) |
||||||||
2016-1A, Class ER 13.65%, 10/20/30(e)(i)(n) |
5,000,000 | 4,641,905 | ||||||
Total Structured Products (Cost $24,350,761) |
23,455,576 |
|||||||
Quantity |
Value ($) |
|||||||
Common Stocks - 0.2% |
||||||||
AUTOMOTIVE - 0.0% |
||||||||
APC Parent, Inc. (d)(j) |
241,972 | — | ||||||
ENERGY: OIL & GAS - 0.0% |
||||||||
RDV Resources, Inc. (d)(j) |
7,743 | 3,599 | ||||||
MEDIA: ADVERTISING, PRINTING & PUBLISHING - 0.0% |
||||||||
Acosta, Inc. (d)(j) |
3,133 | 34,938 | ||||||
MEDIA: BROADCASTING & SUBSCRIPTION - 0.0% |
||||||||
Anuvu Corp. (d)(j) |
102,608 | 38,991 | ||||||
SERVICES: BUSINESS - 0.2% |
||||||||
Carestream Health, Inc. (d)(j) |
55,323 | 350,194 | ||||||
Total Common Stocks (Cost $3,197,792) |
427,722 |
|||||||
Preferred Stock - 0.1% |
||||||||
MEDIA: ADVERTISING, PRINTING & PUBLISHING - 0.1% |
||||||||
Acosta, Inc., (14.50% PIK) (d)(f) |
4,439 | 230,144 | ||||||
Total Preferred Stock (Cost $170,424) |
230,144 |
|||||||
Quantity |
Value ($) |
|||||||
Partnership Interests - 0.0% |
||||||||
HIGH TECH INDUSTRIES - 0.0% |
||||||||
Vector Capitano Holdings, LP Class B-1 (Cayman Islands)(d)(e)(j) |
8,085 | — | ||||||
Vector Capitano Holdings, LP Class B-2 (Cayman Islands)(d)(e)(j) |
6,295 | — | ||||||
Total Partnership Interests (Cost $0) |
— | |||||||
Total Investments - 148.3% |
||||||||
(Cost of $328,969,069) |
316,674,361 |
|||||||
Other Assets & Liabilities, Net - 8.3% |
17,843,503 |
|||||||
Loan Outstanding - (56.6)% (k)(l) |
(120,948,185 |
) | ||||||
Net Assets (Applicable to Common Shares) - 100.0% |
213,569,679 |
|||||||
(a) |
“Senior Loans” are senior, secured loans made to companies whose debt is below investment grade as well as investments with similar economic characteristics. Senior Loans typically hold a first lien priority and, unless otherwise indicated, are required to pay interest at floating rates that are periodically reset by reference to a base lending rate plus a spread. In some instances, the rates shown represent the weighted average rate as of December 31, 2023. Senior Loans are generally not registered under the Securities Act of 1933 (the “1933 Act”) and often incorporate certain restrictions on resale and cannot be sold publicly. Senior Loans often require prepayments from excess cash flow or permit the borrower to repay at its election. The degree to which borrowers repay, whether as a contractual requirement or at their election, cannot be predicted with accuracy. As a result, the actual maturity may be substantially less than the stated maturity. |
(b) |
All or a portion of this Senior Loan position has not settled. Full contract rates do not take effect until settlement date and therefore are subject to change. |
(c) |
The interest rate on this Senior Loan is subject to a base lending rate plus a spread. These base lending rates are primarily the Secured Overnight Financing Rate (“SOFR”) and secondarily the synthetic London Interbank Offered Rate (“LIBOR”) or the prime rate offered by one or more major U.S. banks (“Prime”). The interest rate is subject to a minimum floor, which may be less than or greater than the prevailing period end LIBOR/SOFR/Prime rate. As of December 31, 2023, the 1, 3 and 6 month LIBOR rates were 5.47%, 5.59%, and 5.59%, respectively, the 1, 3 and 6 month SOFR rates were 5.35%, 5.33%, and 5.16%, respectively, and the Prime lending rate was 8.50%. Senior Loans may contain multiple contracts of the same issuer which may be subject to base lending rates of LIBOR, SOFR and Prime (“Variable”) in addition to the stated spread. |
(d) |
Fair Value Level 3 security. |
(e) |
Foreign issuer traded in U.S. dollars. |
(f) |
Represents a payment-in-kind |
(g) |
Issuer filed for bankruptcy and/or is in default of principal and/or interest payments. |
(h) |
Fixed rate asset. |
(i) |
Securities exempt from registration pursuant to Rule 144A under the 1933 Act. These securities may only be resold in transactions exempt from registration to qualified institutional buyers. At December 31, 2023, these securities amounted to $76,329,969, or 35.74% of net assets. |
(j) |
Non-income producing asset. |
(k) |
The Fund has granted a security interest in substantially all of its assets in the event of default under the credit facility. |
(l) |
Principal of $121,000,000 less unamortized deferred financing costs of $51,815. |
(m) |
Structured Products include collateralized loan obligations (“CLOs”). A CLO typically takes the form of a financing company (generally called a special purpose vehicle or “SPV”), created to reapportion the risk and return characteristics of a pool of assets. While the assets underlying CLOs are often Senior Loans or corporate notes and bonds, the assets may also include (i) subordinated loans; (ii) debt tranches of other CLOs; and (iii) equity securities incidental to investments in Senior Loans. The Fund may invest in lower tranches of CLOs, which typically experience a lower recovery, greater risk of loss, deferral or non-payment of interest than more senior tranches of the CLO. A key feature of the CLO structure is the prioritization of the cash flows from a pool of debt securities among the several classes of the CLO. The SPV is a company founded for the purpose of securitizing payment claims arising out of this asset pool. On this basis, marketable securities are issued by the SPV and the redemption of these securities typically takes place at maturity out of the cash flow generated by the collected claims. |
(n) |
Floating rate asset. The interest rate shown reflects the rate in effect at December 31, 2023. |
Apollo Senior Floating Rate Fund Inc. |
Apollo Tactical Income Fund Inc. |
|||||||
Assets: |
||||||||
Investment securities at fair value (cost $350,741,886 and $328,969,069, respectively) |
$ | 336,227,681 | $ | 316,674,361 | ||||
Cash and cash equivalents |
31,948,712 | 15,816,923 | ||||||
Interest receivable |
1,968,483 | 2,711,082 | ||||||
Receivable for investment securities sold |
71,632 | 2,317,422 | ||||||
Net unrealized appreciation on unfunded commitments (Note 9) |
44,723 | 60,612 | ||||||
Receivable from affiliate |
221,219 | 383,587 | ||||||
Prepaid expenses |
199,618 | 197,896 | ||||||
Total assets |
$ | 370,682,068 | $ | 338,161,883 | ||||
Liabilities: |
||||||||
Borrowings under credit facility (principal $130,000,000 and $121,000,000, respectively, less unamortized deferred financing costs of $99,469 and $51,815, respectively) (Note 8) |
$ | 129,900,531 | $ | 120,948,185 | ||||
Payable for investment securities purchased |
5,566,017 | 2,569,954 | ||||||
Interest payable |
91,822 | 85,130 | ||||||
Investment advisory fee payable |
309,335 | 283,938 | ||||||
Other payables and accrued expenses due to affiliates |
338,258 | 342,858 | ||||||
Other payables and accrued expenses |
395,633 | 362,139 | ||||||
Total liabilities |
$ | 136,601,596 | $ | 124,592,204 | ||||
Commitments and Contingencies (Note 9) |
||||||||
Net Assets (Applicable to Common Shareholders) |
$ |
234,080,472 |
$ |
213,569,679 |
||||
Net Assets Consist of: |
||||||||
Paid-in capital ($0.001 par value, 999,998,466 and |
$ | 295,425,527 | $ | 275,364,267 | ||||
Total accumulated loss |
(61,345,055 | ) | (61,794,588 | ) | ||||
Net Assets (Applicable to Common Shareholders) |
$ |
234,080,472 |
$ |
213,569,679 |
||||
Number of |
15,573,575 | |||||||
Net Asset Value, per Common Share |
$ | 15.03 | $ | 14.77 | ||||
Apollo Senior Floating Rate Fund Inc. |
Apollo Tactical Income Fund Inc. |
|||||||
Investment Income: |
||||||||
Interest |
$ | 38,673,051 | $ | 36,256,002 | ||||
Total investment income |
38,673,051 | 36,256,002 | ||||||
Expenses: |
||||||||
Investment advisory fee (Note 3) |
3,608,644 | 3,297,084 | ||||||
Interest and commitment fee expense (Note 8) |
7,943,732 | 7,387,905 | ||||||
Professional fees |
148,251 | 148,251 | ||||||
Legal fees |
340,832 | 348,639 | ||||||
Administrative services of the Adviser (Note 3) |
744,664 | 769,503 | ||||||
Fund administration and accounting services (Note 3) |
258,994 | 244,959 | ||||||
Insurance expense |
326,648 | 326,648 | ||||||
Board of Directors fees (Note 3) |
150,049 | 150,049 | ||||||
Amortization of deferred financing costs (Note 8) |
144,894 | 185,951 | ||||||
Other operating expenses |
266,124 | 287,908 | ||||||
Total expenses |
13,932,832 | 13,146,897 | ||||||
Less: Expense waiver (Note 3) |
(146,219 | ) | (308,587 | ) | ||||
Net expenses |
13,786,613 | 12,838,310 | ||||||
Net Investment Income |
24,886,438 |
23,417,692 |
||||||
Net Realized and Unrealized Gain/(Loss) on Investments |
||||||||
Net realized loss on investments |
(5,852,913 | ) | (8,083,932 | ) | ||||
Net change in unrealized appreciation on investments and unfunded commitments (Note 9) |
16,929,680 | 19,323,597 | ||||||
Net realized and unrealized gain on investments |
11,076,767 | 11,239,665 | ||||||
Net Increase in Net Assets, Applicable to Common Shareholders, Resulting From Operations |
$ | 35,963,205 | $ | 34,657,357 | ||||
For the Year Ended December 31, 2023 |
For the Year Ended December 31, 2022 |
|||||||
Increase/(Decrease) in Net Assets from: |
||||||||
Operations |
||||||||
Net investment income |
$ | 24,886,438 | $ | 17,051,351 | ||||
Net realized loss on investments |
(5,852,913 | ) | (9,097,630 | ) | ||||
Net change in unrealized appreciation/(depreciation) on investments and unfunded commitments |
16,929,680 | (26,091,075 | ) | |||||
Net increase/(decrease) in net assets from operations |
35,963,205 | (18,137,354 | ) | |||||
Distributions to Common Shareholders |
||||||||
Total distributions to common shareholders |
(22,908,728 | ) | (17,037,490 | ) | ||||
Total increase/(decrease) in net assets |
$ | 13,054,477 | $ | (35,174,844 | ) | |||
Net Assets Applicable to Common Shares |
||||||||
Beginning of year |
221,025,995 | 256,200,839 | ||||||
End of year |
$ | 234,080,472 | $ | 221,025,995 | ||||
For the Year Ended December 31, 2023 |
For the Year Ended December 31, 2022 |
|||||||
Increase/(Decrease) in Net Assets from: |
||||||||
Operations |
||||||||
Net investment income |
$ | 23,417,692 | $ | 17,236,013 | ||||
Net realized loss on investments |
(8,083,932 | ) | (11,050,299 | ) | ||||
Net change in unrealized appreciation/(depreciation) on investments and unfunded commitments |
19,323,597 | (28,069,497 | ) | |||||
Net increase/(decrease) in net assets from operations |
34,657,357 | (21,883,783 | ) | |||||
Distributions to Common Shareholders |
||||||||
Total distributions to common shareholders |
(21,421,221 | ) | (17,009,694 | ) | ||||
Total increase/(decrease) in net assets |
$ | 13,236,136 | $ | (38,893,477 | ) | |||
Net Assets Applicable to Common Shares |
||||||||
Beginning of year |
200,333,543 | 239,227,020 | ||||||
End of year |
$ | 213,569,679 | $ | 200,333,543 | ||||
Cash Flows from Operating Activities: |
||||
Net increase in net assets from operations |
$ | 35,963,205 | ||
Adjustments to Reconcile Net Increase in Net Assets from Operations to Net Cash Flows Provided by Operating Activities: |
||||
Net realized loss on investments |
5,852,913 | |||
Net change in unrealized appreciation on investments and unfunded commitments |
(16,929,680 | ) | ||
Net amortization/(accretion) of premium/(discount) |
(1,397,489 | ) | ||
Purchase of investment securities |
(174,891,530 | ) | ||
Proceeds from disposition of investment securities and principal paydowns |
179,470,513 | |||
Payment-in-kind |
(852,838 | ) | ||
Amortization of deferred financing costs |
144,894 | |||
Changes in Operating Assets and Liabilities: |
||||
Increase in interest receivable |
(84,814 | ) | ||
Increase in receivable from affiliate |
(221,219 | ) | ||
Decrease in prepaid expenses |
194,275 | |||
Decrease in interest payable |
(395,320 | ) | ||
Increase in investment advisory fee payable |
8,950 | |||
Increase in other payables and accrued expenses due to affiliates |
330,276 | |||
Increase in other payables and accrued expenses |
38,065 | |||
Net cash flows provided by operating activities |
27,230,201 | |||
Cash Flows from Financing Activities: |
||||
Deferred financing cost paid |
(4,768 | ) | ||
Distributions paid to common shareholders (net of change in distributions payable to common shareholders) |
(22,908,728 | ) | ||
Net cash flows used in financing activities |
(22,913,496 | ) | ||
Net Increase in Cash and Cash Equivalents |
4,316,705 | |||
Cash and cash equivalents, beginning of year |
27,632,007 | |||
Cash and cash equivalents, end of year |
$ | 31,948,712 | ||
Supplemental Disclosure of Cash Flow Information |
||||
Cash paid during the year for interest and commitment fee |
$ | 8,339,052 | ||
Cash Flows from Operating Activities: |
||||
Net increase in net assets from operations |
$ | 34,657,357 | ||
Adjustments to Reconcile Net Increase in Net Assets from Operations to Net Cash Flows Provided by Operating Activities: |
||||
Net realized loss on investments |
8,083,932 | |||
Net change in unrealized appreciation on investments and unfunded commitments |
(19,323,597 | ) | ||
Net amortization/(accretion) of premium/(discount) |
(1,371,208 | ) | ||
Purchase of investment securities |
(160,385,815 | ) | ||
Proceeds from disposition of investment securities and principal paydowns |
155,822,117 | |||
Payment-in-kind |
(994,608 | ) | ||
Amortization of deferred financing costs |
185,951 | |||
Changes in Operating Assets and Liabilities: |
||||
Increase in interest receivable |
(125,243 | ) | ||
Increase in receivable from affiliate |
(303,475 | ) | ||
Decrease in prepaid expenses |
196,465 | |||
Decrease in interest payable |
(365,718 | ) | ||
Increase in investment advisory fee payable |
8,922 | |||
Increase in other payables and accrued expenses due to affiliates |
329,671 | |||
Increase in other payables and accrued expenses |
73,177 | |||
Net cash flows provided by operating activities |
16,487,928 | |||
Cash Flows from Financing Activities: |
||||
Deferred financing cost paid |
(10,154 | ) | ||
Distributions paid to common shareholders (net of change in distributions payable to common shareholders) |
(21,421,221 | ) | ||
Net cash flows used in financing activities |
(21,431,375 |
) | ||
Net Decrease in Cash and Cash Equivalents |
(4,943,447 | ) | ||
Cash and cash equivalents, beginning of year |
20,760,370 | |||
Cash and cash equivalents, end of year |
$ | 15,816,923 | ||
Supplemental Disclosure of Cash Flow Information |
||||
Cash paid during the year for interest and commitment fee |
$ | 7,753,624 | ||
Per Common Share Operating Performance: |
For the Year Ended December 31, 2023 |
For the Year Ended December 31, 2022 |
For the Year Ended December 31, 2021 (d) |
For the Year Ended December 31, 2020 (d) |
For the Year Ended December 31, 2019 (d) |
|||||||||||||||
Net Asset Value, Beginning of Year |
$ | 14.19 | $ | 16.45 | $ | 16.15 | $ | 16.94 | $ | 16.34 | ||||||||||
Income from Investment Operations: |
||||||||||||||||||||
Net investment income (a) |
1.60 | 1.09 | 0.86 | 0.98 | 1.21 | |||||||||||||||
Net realized and unrealized gain/(loss) on investments and unfunded commitments |
0.71 | (2.26 | ) | 0.41 | (0.75 | ) | 0.59 | |||||||||||||
Total from investment operations |
2.31 | (1.17 | ) | 1.27 | 0.23 | 1.80 | ||||||||||||||
Less Distributions Paid to Common Shareholders from: |
||||||||||||||||||||
Net investment income |
(1.47 | ) | (1.09 | ) | (0.90 | ) | (1.02 | ) | (1.20 | ) | ||||||||||
Return of capital |
— | — | (0.07 | ) | — | — | ||||||||||||||
Total distributions paid to Common Shareholders |
(1.47 | ) | (1.09 | ) | (0.97 | ) | (1.02 | ) | (1.20 | ) | ||||||||||
Net Asset Value, End of Year |
$ | 15.03 | $ | 14.19 | $ | 16.45 | $ | 16.15 | $ | 16.94 | ||||||||||
Market Value, End of Year |
$ | 13.25 | $ | 12.34 | $ | 16.11 | $ | 14.40 | $ | 15.14 | ||||||||||
Total return based on net asset value (b) |
18.49 | % | (6.46 | )% | 8.38 | % | 2.99 | % | 12.35 | % | ||||||||||
Total return based on market value (b) |
20.12 | % | (16.94 | )% | 19.04 | % | 2.75 | % | 14.02 | % | ||||||||||
Ratios to Average Net Assets Applicable to Common Shareholders: |
||||||||||||||||||||
Ratios to Average Net Assets (including interest expense) |
||||||||||||||||||||
Ratio of expenses to average net assets excluding expense waivers |
6.06 | % | 3.87 | % | 2.91 | % | 3.12 | % | 4.01 | % | ||||||||||
Ratio of expenses to average net assets including expense waivers |
5.99 | % | 3.87 | % | 2.89 | % | 3.12 | % | 4.01 | % | ||||||||||
Ratio of net investment income to average net assets |
10.82 | % | 7.20 | % | 5.22 | % | 6.37 | % | 7.23 | % | ||||||||||
Ratios to Average Net Assets (excluding interest expense) |
||||||||||||||||||||
Ratio of expenses to average net assets excluding expense waivers |
2.54 | % | 2.38 | % | 2.39 | % | 2.24 | % | 2.21 | % | ||||||||||
Ratio of expenses to average net assets including expense waivers |
2.48 | % | 2.38 | % | 2.36 | % | 2.24 | % | 2.21 | % | ||||||||||
Supplemental Data: |
||||||||||||||||||||
Portfolio turnover rate |
47.2 | % | 75.2 | % | 123.3 | % | 93.6 | % | 101.2 | % | ||||||||||
Net assets at end of year (000’s) |
$ | 234,080 | $ | 221,026 | $ | 256,201 | $ | 251,534 | $ | 263,807 | ||||||||||
Senior Securities: |
||||||||||||||||||||
Principal loan outstanding (in 000’s) |
$ | 130,000 | $ | 130,000 | $ | 130,000 | $ | 121,000 | $ | 141,000 | ||||||||||
Asset coverage per $1,000 of loan outstanding (c) |
$ | 2,801 | $ | 2,700 | $ | 2,971 | $ | 3,079 | $ | 2,871 | ||||||||||
(a) |
Based on the weighted average outstanding shares. |
(b) |
Total return based on net asset value and total return based on market value assuming all distributions reinvested at reinvestment rate. |
(c) |
Calculated by subtracting the Fund’s total liabilities (not including the borrowings outstanding) from the Fund’s total assets, and dividing this by the amount of borrowings outstanding. |
(d) |
Presented on a non-consolidated basis. (Note 1) |
Per Common Share Operating Performance: |
For the Year Ended December 31, 2018 (d) |
For the Year Ended December 31, 2017 (d) |
For the Year Ended December 31, 2016 (d) |
For the Year Ended December 31, 2015 (d) |
For the Year Ended December 31, 2014 (d) |
|||||||||||||||
Net Asset Value, Beginning of Year |
$ | 17.86 | $ | 18.07 | $ | 16.92 | $ | 18.30 | $ | 19.12 | ||||||||||
Income from Investment Operations: |
||||||||||||||||||||
Net investment income (a) |
1.25 | 1.13 | 1.24 | 1.22 | 1.18 | |||||||||||||||
Net realized and unrealized gain/(loss) on investments and unfunded commitments |
(1.51 | ) | (0.18 | ) | 1.15 | (1.37 | ) | (0.75 | ) | |||||||||||
Distributions from net investment income to Series A Preferred Shareholders |
— | — | — | — | (0.02 | ) | ||||||||||||||
Total from investment operations |
(0.26 | ) | 0.95 | 2.39 | (0.15 | ) | 0.41 | |||||||||||||
Less Distributions Paid to Common Shareholders from: |
||||||||||||||||||||
Net investment income |
(1.26 | ) | (1.16 | ) | (1.24 | ) | (1.23 | ) | (1.23 | ) | ||||||||||
Total distributions paid to Common Shareholders |
(1.26 | ) | (1.16 | ) | (1.24 | ) | (1.23 | ) | (1.23 | ) | ||||||||||
Net Asset Value, End of Year |
$ | 16.34 | $ | 17.86 | $ | 18.07 | $ | 16.92 | $ | 18.30 | ||||||||||
Market Value, End of Year |
$ | 14.39 | $ | 16.22 | $ | 17.40 | $ | 15.15 | $ | 16.63 | ||||||||||
Total return based on net asset value (b) |
(0.98 | )% | 5.80 | % | 15.33 | % | (0.52 | )% | 2.63 | % | ||||||||||
Total return based on market value (b) |
(3.98 | )% | (0.22 | )% | 24.03 | % | (1.98 | )% | (1.48 | )% | ||||||||||
Ratios to Average Net Assets Applicable to Common Shareholders: |
||||||||||||||||||||
Ratios to Average Net Assets (including interest expense): |
||||||||||||||||||||
Ratio of expenses to average net assets excluding expense waivers |
3.84 | % | 3.33 | % | 3.21 | % | 3.01 | % | 3.07 | % | ||||||||||
Ratio of expenses to average net assets including expense waivers |
3.84 | % | 3.33 | % | 3.21 | % | 3.01 | % | 3.07 | % | ||||||||||
Ratio of net investment income to average net assets |
7.10 | % | 6.24 | % | 7.11 | % | 6.71 | % | 6.22 | % (e) | ||||||||||
Ratio of net investment income to average net assets net of distribtutions to Series A Preferred Shareholders |
— | — | — | — | 6.13 | % | ||||||||||||||
Ratio of Average Net Assets (excluding interest expense): |
||||||||||||||||||||
Ratio of expenses to average net assets excluding expense waivers |
2.18 | % | 2.16 | % | 2.17 | % | 2.18 | % | 2.18 | % | ||||||||||
Ratio of expenses to average net assets including expense waivers |
2.18 | % | 2.16 | % | 2.17 | % | 2.18 | % | 2.18 | % | ||||||||||
Supplemental Data: |
||||||||||||||||||||
Portfolio turnover rate |
122.4 | % | 102.2 | % | 109.5 | % | 66.1 | % | 80.0 | % | ||||||||||
Net assets at end of year (000’s) |
$ | 254,427 | $ | 278,070 | $ | 281,328 | $ | 263,438 | $ | 284,992 | ||||||||||
Senior Securities: |
||||||||||||||||||||
Principal loan outstanding (in 000’s) |
$ | 141,000 | $ | 141,000 | $ | 141,000 | $ | 149,269 | $ | 149,269 | ||||||||||
Asset coverage per $1,000 of loan outstanding (c) |
$ | 2,804 | $ | 2,972 | $ | 2,995 | $ | 2,765 | $ | 2,909 | ||||||||||
(a) |
Based on the weighted average outstanding shares. |
(b) |
Total return based on net asset value and total return based on market value assuming all distributions reinvested at reinvestment rate. |
(c) |
Calculated by subtracting the Fund’s total liabilities (not including the borrowings outstanding) from the Fund’s total assets, and dividing this by the amount of borrowings outstanding. |
(d) |
Presented on a non-consolidated basis. (Note 1) |
(e) |
Net investment income does not reflect payment to preferred shareholders. |
Per Common Share Operating Performance: |
For the Year Ended December 31, 2023 |
For the Year Ended December 31, 2022 |
For the Year Ended December 31, 2021 (d) |
For the Year Ended December 31, 2020 (d) |
For the Year Ended December 31, 2019 (d) |
|||||||||||||||
Net Asset Value, Beginning of Year |
$ | 13.85 | $ | 16.54 | $ | 16.27 | $ | 16.85 | $ | 16.07 | ||||||||||
Income from Investment Operations: |
||||||||||||||||||||
Net investment income (a) |
1.62 | 1.19 | 0.94 | 1.02 | 1.25 | |||||||||||||||
Net realized and unrealized gain/(loss) on investments and unfunded commitments |
0.78 | (2.70 | ) | 0.33 | (0.54 | ) | 0.77 | |||||||||||||
Total from investment operations |
2.40 | (1.51 | ) | 1.27 | 0.48 | 2.02 | ||||||||||||||
Less Distributions Paid to Common Shareholders from: |
||||||||||||||||||||
Net investment income |
(1.48) | (1.18 | ) | (0.99 | ) | (1.06 | ) | (1.24 | ) | |||||||||||
Return of capital |
— | — | (0.01 | ) | — | — | ||||||||||||||
Total distributions paid to Common Shareholders |
(1.48) | (1.18 | ) | (1.00 | ) | (1.06 | ) | (1.24 | ) | |||||||||||
Net Asset Value, End of Year |
$ | 14.77 | $ | 13.85 | $ | 16.54 | $ | 16.27 | $ | 16.85 | ||||||||||
Market Value, End of Year |
$ | 13.96 | $ | 12.12 | $ | 15.32 | $ | 14.48 | $ | 15.10 | ||||||||||
Total return based on net asset value (b) |
19.53 | % | (8.38 | )% | 8.44 | % | 4.71 | % | 13.97 | % | ||||||||||
Total return based on market value (b) |
29.10 | % | (13.44 | )% | 12.86 | % | 3.99 | % | 19.20 | % | ||||||||||
Ratios to Average Net Assets Applicable to Common Shareholders: |
||||||||||||||||||||
Ratios to Average Net Assets (including interest expense) |
||||||||||||||||||||
Ratio of expenses to average net assets excluding expense waivers |
6.31 | % | 4.03 | % | 3.01 | % | 3.16 | % | 4.03 | % | ||||||||||
Ratio of expenses to average net assets including expense waivers |
6.17 | % | 4.00 | % | 2.92 | % | 3.16 | % | 4.03 | % | ||||||||||
Ratio of net investment income to average net assets |
11.25 | % | 7.96 | % | 5.66 | % | 6.72 | % | 7.53 | % | ||||||||||
Ratios to Average Net Assets (excluding interest expense) |
||||||||||||||||||||
Ratio of expenses to average net assets excluding expense waivers |
2.68 | % | 2.45 | % | 2.45 | % | 2.29 | % | 2.25 | % | ||||||||||
Ratio of expenses to average net assets including expense waivers |
2.53 | % | 2.42 | % | 2.36 | % | 2.29 | % | 2.25 | % | ||||||||||
Supplemental Data: |
||||||||||||||||||||
Portfolio turnover rate |
48.4 | % | 90.9 | % | 137.5 | % | 96.4 | % | 112.3 | % | ||||||||||
Net assets at end of year (000’s) |
$ | 213,570 | $ | 200,334 | $ | 239,227 | $ | 235,278 | $ | 243,751 | ||||||||||
Senior Securities: |
||||||||||||||||||||
Principal loan outstanding (in 000’s) |
$ | 121,000 | $ | 121,000 | $ | 121,000 | $ | 110,000 | $ | 126,500 | ||||||||||
Asset coverage per $1,000 of loan outstanding (c) |
$ | 2,765 | $ | 2,656 | $ | 2,977 | $ | 3,139 | $ | 2,927 | ||||||||||
(a) |
Based on the weighted average outstanding shares. |
(b) |
Total return based on net asset value and total return based on market value assuming all distributions reinvested at reinvestment rate. |
(c) |
Calculated by subtracting the Fund’s total liabilities (not including the borrowings outstanding) from the Fund’s total assets, and dividing this by the amount of borrowings outstanding. |
(d) |
Presented on a non-consolidated basis. (Note 1) |
Per Common Share Operating Performance: |
For the Year Ended December 31, 2018 (d) |
For the Year Ended December 31, 2017 (d) |
For the Year Ended December 31, 2016 (d) |
For the Year Ended December 31, 2015 (d) |
For the Year Ended December 31, 2014 (d) |
|||||||||||||||
Net Asset Value, Beginning of Year |
$ | 17.44 | $ | 17.18 | $ | 15.97 | $ | 18.21 | $ | 19.51 | ||||||||||
Income from Investment Operations: |
||||||||||||||||||||
Net investment income (a) |
1.33 | 1.27 | 1.50 | 1.48 | 1.50 | |||||||||||||||
Net realized and unrealized gain/(loss) on investments and unfunded commitments |
(1.38 | ) | 0.28 | 1.23 | (2.16 | ) | (1.14 | ) | ||||||||||||
Total from investment operations |
(0.05 | ) | 1.55 | 2.73 | (0.68 | ) | 0.36 | |||||||||||||
Less Distributions Paid to Common Shareholders from: |
||||||||||||||||||||
Net investment income |
(1.32 | ) | (1.29 | ) | (1.52 | ) | (1.55 | ) | (1.50 | ) | ||||||||||
Net realized gain on investments |
— | — | — | (0.01 | ) | (0.16 | ) | |||||||||||||
Total distributions paid to Common Shareholders |
(1.32 | ) | (1.29 | ) | (1.52 | ) | (1.56 | ) | (1.66 | ) | ||||||||||
Net Asset Value, End of Year |
$ | 16.07 | $ | 17.44 | $ | 17.18 | $ | 15.97 | $ | 18.21 | ||||||||||
Market Value, End of Year |
$ | 13.77 | $ | 15.75 | $ | 15.43 | $ | 13.89 | $ | 15.96 | ||||||||||
Total return based on net asset value (b) |
0.47 | % | 9.87 | % | 19.34 | % | (2.91 | )% | 2.63 | % | ||||||||||
Total return based on market value (b) |
(4.67 | )% | 10.47 | % | 23.24 | % | (3.65 | )% | (2.51 | )% | ||||||||||
Ratios to Average Net Assets Applicable to Common Shareholders: |
||||||||||||||||||||
Ratios to Average Net Assets (including interest expense): |
||||||||||||||||||||
Ratio of expenses to average net assets excluding expense waivers |
3.85 | % | 3.53 | % | 3.36 | % | 2.97 | % | 2.90 | % | ||||||||||
Ratio of expenses to average net assets including expense waivers |
3.85 | % | 3.53 | % | 3.36 | % | 2.97 | % | 2.90 | % | ||||||||||
Ratio of net investment income to average net assets |
7.65 | % | 7.27 | % | 9.20 | % | 8.22 | % | 7.63 | % | ||||||||||
Ratio of Average Net Assets (excluding interest expense): |
||||||||||||||||||||
Ratio of expenses to average net assets excluding expense waivers |
2.25 | % | 2.26 | % | 2.33 | % | 2.22 | % | 2.15 | % | ||||||||||
Ratio of expenses to average net assets including expense waivers |
2.25 | % | 2.26 | % | 2.33 | % | 2.22 | % | 2.15 | % | ||||||||||
Supplemental Data: |
||||||||||||||||||||
Portfolio turnover rate |
130.9 | % | 111.8 | % | 111.6 | % | 67.6 | % | 78.7 | % | ||||||||||
Net assets at end of year (000’s) |
$ | 232,432 | $ | 252,265 | $ | 248,424 | $ | 230,995 | $ | 263,428 | ||||||||||
Senior Securities: |
||||||||||||||||||||
Principal loan outstanding (in 000’s) |
$ | 126,500 | $ | 138,000 | $ | 138,000 | $ | 138,000 | $ | 138,000 | ||||||||||
Asset coverage per $1,000 of loan outstanding (c) |
$ | 2,837 | $ | 2,828 | $ | 2,800 | $ | 2,674 | $ | 2,909 | ||||||||||
(a) |
Based on the weighted average outstanding shares. |
(b) |
Total return based on net asset value and total return based on market value assuming all distributions reinvested at reinvestment rate. |
(c) |
Calculated by subtracting the Fund’s total liabilities (not including the borrowings outstanding) from the Fund’s total assets, and dividing this by the amount of borrowings outstanding. |
(d) |
Presented on a non-consolidated basis. (Note 1) |
Apollo Senior Floating Rate Fund Inc. | ||||||||||||||||||||||
Total Fair Value at December 31, 2023 |
Level 1 Quoted Price |
Level 2 Significant Observable Inputs |
Level 3 Significant Unobservable Inputs | |||||||||||||||||||
Assets: |
||||||||||||||||||||||
Cash and Cash Equivalents |
$ | 31,948,712 | $ | 31,948,712 | $ | — | $ | — | ||||||||||||||
Senior Loans |
303,867,792 | — | 213,312,745 | 90,555,047 | ||||||||||||||||||
Corporate Notes and Bonds |
31,289,967 | — | 17,624,504 | 13,665,463 | ||||||||||||||||||
Common Stocks |
839,778 | — | — | 839,778 | ||||||||||||||||||
Preferred Stock |
230,144 | — | — | 230,144 | ||||||||||||||||||
Partnership Interests |
— | — | — | — | ||||||||||||||||||
Unrealized appreciation on Unfunded Commitments |
53,963 | — | — | 53,963 | ||||||||||||||||||
Total Assets |
$ | 368,230,356 | $ | 31,948,712 | $ | 230,937,249 | $ | 105,344,395 | ||||||||||||||
Liabilities: |
||||||||||||||||||||||
Unrealized depreciation on Unfunded Commitments |
(9,240 | ) | — | — | (9,240 | ) | ||||||||||||||||
Total Liabilities |
(9,240 | ) | — | — | (9,240 | ) | ||||||||||||||||
| $ | 368,221,116 | $ | 31,948,712 | $ | 230,937,249 | $ | 105,335,155 | |||||||||||||||
Apollo Senior Floating Rate Fund Inc. | ||||||||||||||||||||||||||||||||||||||||
Total |
Senior Loans |
Corporate Notes and Bonds |
Common Stocks |
Preferred Stocks |
Partnership Interests |
Unfunded Commitments | ||||||||||||||||||||||||||||||||||
Total Fair Value, beginning of year |
$ | 55,573,493 | $ | 52,192,218 | $ | 596,966 | $ | 2,599,549 | $ | 190,255 | $ | — | $ | (5,495 | ) | |||||||||||||||||||||||||
Purchases, including capitalized PIK |
68,563,300 | 55,334,330 | 13,228,970 | — | — | — | — | |||||||||||||||||||||||||||||||||
Sales/Paydowns |
(11,087,655 | ) | (10,800,298 | ) | (235,937 | ) | (51,420 | ) | — | — | — | |||||||||||||||||||||||||||||
Accretion/(amortization) of discounts/(premiums) |
167,721 | 164,554 | 3,167 | — | — | — | — | |||||||||||||||||||||||||||||||||
Net realized gain/(loss) |
(2,377,248 | ) | (2,117,761 | ) | 235,937 | 51,420 | (546,844 | ) | — | — | ||||||||||||||||||||||||||||||
Change in net unrealized appreciation/ (depreciation) |
2,480,008 | 3,766,468 | (163,640 | ) | (1,759,771 | ) | 586,733 | — | 50,218 | |||||||||||||||||||||||||||||||
Transfers into Level 3 |
— | — | — | — | — | — | — | |||||||||||||||||||||||||||||||||
Transfers out of Level 3 |
(7,984,464 | ) | (7,984,464 | ) | — | — | — | — | — | |||||||||||||||||||||||||||||||
Total Fair Value, end of year |
$ | 105,335,155 | $ | 90,555,047 | $ | 13,665,463 | $ | 839,778 | $ | 230,144 | $ | — | $ | 44,723 | ||||||||||||||||||||||||||
Apollo Senior Floating Rate Fund Inc. |
|||||||||||||||||||
Assets/ Liabilities |
Fair Value at December 31, 2023 |
Valuation Technique(s) (a) |
Unobservable Input(s) |
Range of Unobservable Input(s) Utilized |
Weighted Average Unobservable Input(s) | ||||||||||||||
Senior Loans |
$ | 58,177,026 | Discounted Cash Flow (b) |
Discount Rate (b) |
8.27% - 39.89% |
11.18% | |||||||||||||
| — | Recoverability (c) |
Estimated Proceeds (c) |
$— | $— | |||||||||||||||
| 7,820,400 | Transaction Approach (d) |
Recent Trade (d) |
98.00% | 98.00% | |||||||||||||||
| 24,557,621 | Transaction Approach (e) |
Cost (e) |
N/A | N/A | |||||||||||||||
Corporate |
7,022,632 | Discounted Cash Flow (b) |
Discount Rate (b) |
6.92% - 12.53% |
11.27% | ||||||||||||||
Notes and Bonds |
315,331 |
Discounted Cash Flow (b) Recoverability (c) |
Discount Rate (b) Estimated Proceeds (c) |
4.40% $33.7m |
4.40% $33.7m | ||||||||||||||
| — | Recoverability (c) |
Estimated Proceeds (c) |
$— | $— | |||||||||||||||
| 6,327,500 | Transaction Approach (e) |
Cost (e) |
N/A | N/A | |||||||||||||||
Common |
13,131 | Discounted Cash Flow (b) |
Discount Rate (b) |
5.25% | 5.25% | ||||||||||||||
Stocks |
Recoverability (c) |
Estimated Proceeds (c) |
$9.1m | $9.1m | |||||||||||||||
| — | Recoverability (c) |
Estimated Proceeds (c) |
$— | $— | |||||||||||||||
| 41,199 | Guideline Public Company (f) |
TEV / Revenue (f) |
0.73x - 0.90x |
0.82x | |||||||||||||||
| 785,448 | Guideline Public Company (g) |
TEV / EBITDA Multiple (g) |
2.50x - 7.00x |
3.18x | |||||||||||||||
Preferred Stock |
230,144 | Guideline Public Company (g) |
TEV / EBITDA Multiple (g) |
7.00x | 7.00x | ||||||||||||||
Partnership Interests |
— | Recoverability (c) |
Estimated Proceeds (c) |
$— | $— | ||||||||||||||
Unfunded Commitments |
45,975 | Discounted Cash Flow (b) |
Discount Rate (b) |
9.16% - 27.48% |
10.61% | ||||||||||||||
| (1,252 | ) | Transaction Approach (e) |
Cost (e) |
N/A | N/A | ||||||||||||||
Total Fair Value |
$ | 105,335,155 | |||||||||||||||||
(a) |
For the assets which have multiple valuation techniques, the Fund may rely on the techniques individually or in the aggregate based on a weight ranging from 0-100%. |
(b) |
The Fund utilized a discounted cash flow model to fair value this security. The significant unobservable input used in the valuation model was the discount rate, which was determined based on the market rates an investor would expect for a similar investment with similar risks. The discount rate was applied to present value the projected cash flows in the valuation model. Significant increases in the discount rate may significantly lower the fair value of an investment; conversely, significant decreases in the discount rate may significantly increase the fair value of an investment. |
(c) |
The Fund utilized a recoverability approach to fair value this security, specifically a liquidation analysis. There are various, company specific inputs used in the valuation analysis that relate to the liquidation value of a company’s assets. The significant unobservable input used in the valuation model was estimated proceeds. Significant increases or decreases in the input in isolation may result in a significantly higher or lower fair value measurement. |
(d) |
The Fund utilized a recent transaction, specifically a recent trade price, to fair value this security. |
(e) |
The Fund utilized a recent transaction, specifically purchase price, to fair value this security. |
(f) |
The Fund utilized a guideline public company method to fair value this security. The significant unobservable inputs used in the valuation model were total enterprise value (“TEV”) and revenue based on comparable multiples for a similar investment with similar risks. Significant increases or decreases in either of these inputs in isolation may result in a significantly higher or lower fair value measurement. |
(g) |
The Fund utilized a guideline public company method to fair value this security. The significant unobservable inputs used in the valuation model were total enterprise value (“TEV”) and earnings before interest, taxes, depreciation and amortization (“EBITDA”) based on comparable multiples for a similar investment with similar risks. Significant increases or decreases in either of these inputs in isolation may result in a significantly higher or lower fair value measurement. |
Apollo Tactical Income Fund Inc. | ||||||||||||||||||||||
Total Fair Value at December 31, 2023 |
Level 1 Quoted Price |
Level 2 Significant Observable Inputs |
Level 3 Significant Unobservable Inputs | |||||||||||||||||||
Assets: |
||||||||||||||||||||||
Cash and Cash Equivalents |
$ | 15,816,923 | $ | 15,816,923 | $ | — | $ | — | ||||||||||||||
Senior Loans |
237,087,919 | — | 126,243,460 | 110,844,459 | ||||||||||||||||||
Corporate Notes and Bonds |
53,165,468 | — | 40,490,561 | 12,674,907 | ||||||||||||||||||
Convertible Bonds |
2,307,532 | — | 2,307,532 | — | ||||||||||||||||||
Structured Products |
23,455,576 | — | 23,455,576 | — | ||||||||||||||||||
Common Stocks |
427,722 | — | — | 427,722 | ||||||||||||||||||
Preferred Stock |
230,144 | — | — | 230,144 | ||||||||||||||||||
Partnership Interests |
— | — | — | — | ||||||||||||||||||
Unrealized appreciation on Unfunded Commitments |
69,290 | — | — | 69,290 | ||||||||||||||||||
Total Assets |
$ | 332,560,574 | $ | 15,816,923 | $ | 192,497,129 | $ | 124,246,522 | ||||||||||||||
Liabilities: |
||||||||||||||||||||||
Unrealized depreciation on Unfunded Commitments |
(8,678 | ) | — | — | (8,678 | ) | ||||||||||||||||
Total Liabilities |
(8,678 | ) | — | — | (8,678 | ) | ||||||||||||||||
| $ | 332,551,896 | $ | 15,816,923 | $ | 192,497,129 | $ | 124,237,844 | |||||||||||||||
Apollo Tactical Income Fund Inc. | ||||||||||||||||||||||||||||||||||||||||
Total |
Senior Loans |
Corporate Notes and Bonds |
Common Stocks |
Preferred Stocks |
Partnership Interests |
Unfunded Commitments | ||||||||||||||||||||||||||||||||||
Total Fair Value, beginning of year |
$ | 75,631,009 | $ | 73,159,804 | $ | 551,046 | $ | 1,753,260 | $ | 188,448 | $ | — | $ | (21,549 | ) | |||||||||||||||||||||||||
Purchases, including capitalized PIK |
67,787,794 | 55,518,824 | 12,268,970 | — | — | — | — | |||||||||||||||||||||||||||||||||
Sales/Paydowns |
(14,823,486 | ) | (14,591,605 | ) | (217,788 | ) | (14,093 | ) | — | — | — | |||||||||||||||||||||||||||||
Accretion/(amortization) of discounts/(premiums) |
213,875 | 210,708 | 3,167 | — | — | — | — | |||||||||||||||||||||||||||||||||
Net realized gain/(loss) |
(2,287,999 | ) | (2,031,640 | ) | 217,789 | 14,093 | (488,241 | ) | — | — | ||||||||||||||||||||||||||||||
Change in net unrealized appreciation/(depreciation) |
3,143,140 | 4,004,857 | (148,277 | ) | (1,325,538 | ) | 529,937 | — | 82,161 | |||||||||||||||||||||||||||||||
Transfers into Level 3 |
— | — | — | — | — | — | — | |||||||||||||||||||||||||||||||||
Transfers out of Level 3 |
(5,426,489 | ) | (5,426,489 | ) | — | — | — | — | — | |||||||||||||||||||||||||||||||
Total Fair Value, end of year |
$ | 124,237,844 | $ | 110,844,459 | $ | 12,674,907 | $ | 427,722 | $ | 230,144 | $ | — | $ | 60,612 | ||||||||||||||||||||||||||
Apollo Tactical Income Fund Inc. |
|||||||||||||||||||
Assets/ Liabilities |
Fair Value at December 31, 2023 |
Valuation Technique(s) (a) |
Unobservable Input(s) |
Range of Unobservable Input(s) Utilized |
Weighted Average Unobservable Input(s) | ||||||||||||||
Senior Loans |
$ | 80,178,818 | Discounted Cash Flow (b) |
Discount Rate (b) |
8.27% - 39.89% |
10.95% | |||||||||||||
| — | Recoverability (c) |
Estimated Proceeds (c) |
$— | $— | |||||||||||||||
| 7,820,400 | Transaction Approach (d) |
Recent Trade (d) |
98.00% | 98.00% | |||||||||||||||
| 22,845,241 | Transacation Approach (e) |
Cost (e) |
N/A | N/A | |||||||||||||||
Corporate |
6,056,332 | Discounted Cash Flow (b) |
Discount Rate (b) |
6.92% - 12.53% |
11.12% | ||||||||||||||
Notes and Bonds |
291,075 |
Discounted Cash Flow (b) Recoverability (c) |
Discount Rate (b) Estimated Proceeds (c) |
4.40% $33.7m |
4.40% $33.7m | ||||||||||||||
| — | Recoverability (c) |
Estimated Proceeds (c) |
$— | $— | |||||||||||||||
| 6,327,500 | Transaction Approach (e) |
Cost (e) |
N/A | N/A | |||||||||||||||
Common |
3,599 | Discounted Cash Flow (b) |
Discount Rate (b) |
5.25% | 5.25% | ||||||||||||||
Stocks |
Recoverability (c) |
Estimated Proceeds (c) |
$9.1m | $9.1m | |||||||||||||||
| — | Recoverability (c) |
Estimated Proceeds (c) |
$— | $— | |||||||||||||||
| 38,991 | Guideline Public Company (f) |
TEV / Revenue (f) |
0.73x - 0.90x |
0.82x | |||||||||||||||
| 385,132 | Guideline Public Company (g) |
TEV / EBITDA Multiple (g) |
2.50x - 7.00x |
3.36x | |||||||||||||||
Preferred Stock |
230,144 | Guideline Public Company (g) |
TEV / EBITDA Multiple (g) |
7.00x | 7.00x | ||||||||||||||
Partnership Interests |
— | Recoverability (c) |
Estimated Proceeds (c) |
$— | $— | ||||||||||||||
Unfunded Commitments |
61,714 | Discounted Cash Flow (b) |
Discount Rate (b) |
9.16% - 27.48% |
10.55% | ||||||||||||||
| (1,102 | ) | Transaction Approach (e) |
Cost (e) |
N/A | N/A | ||||||||||||||
Total Fair Value |
$ | 124,237,844 | |||||||||||||||||
(a) |
For the assets which have multiple valuation techniques, the Fund may rely on the techniques individually or in the aggregate based on a weight ranging from 0-100%. |
(b) |
The Fund utilized a discounted cash flow model to fair value this security. The significant unobservable input used in the valuation model was the discount rate, which was determined based on the market rates an investor would expect for a similar investment with similar risks. The discount rate was applied to present value the projected cash flows in the valuation model. Significant increases in the discount rate may significantly lower the fair value of an investment; conversely, significant decreases in the discount rate may significantly increase the fair value of an investment. |
(c) |
The Fund utilized a recoverability approach to fair value this security, specifically a liquidation analysis. There are various, company specific inputs used in the valuation analysis that relate to the liquidation value of a company’s assets. The significant unobservable input used in the valuation model was estimated proceeds. Significant increases or decreases in the input in isolation may result in a significantly higher or lower fair value measurement. |
(d) |
The Fund utilized a recent transaction, specifically a recent trade price, to fair value this security. |
(e) |
The Fund utilized a recent transaction, specifically purchase price, to fair value this security. |
(f) |
The Fund utilized a guideline public company method to fair value this security. The significant unobservable inputs used in the valuation model were total enterprise value (“TEV”) and revenue based on comparable multiples for a similar investment with similar risks. Significant increases or decreases in either of these inputs in isolation may result in a significantly higher or lower fair value measurement. |
(g) |
The Fund utilized a guideline public company method to fair value this security. The significant unobservable inputs used in the valuation model were total enterprise value (“TEV”) and earnings before interest, taxes, depreciation and amortization (“EBITDA”) based on comparable multiples for a similar investment with similar risks. Significant increases or decreases in either of these inputs in isolation may result in a significantly higher or lower fair value measurement. |
Fund |
Purchases |
Sales | ||||||||
Apollo Senior Floating Rate Fund Inc. |
$ | 163,709,278 | $ | 177,041,578 | ||||||
Apollo Tactical Income Fund Inc. |
$ | 157,159,517 | $ |
151,320,505 |
||||||
Apollo Senior Floating Rate Fund Inc. |
||||||||||||||||||||||
Year Ended December 31, 2023 |
Year Ended December 31, 2022 | |||||||||||||||||||||
Shares |
Amount |
Shares |
Amount | |||||||||||||||||||
Common shares outstanding, beginning of the year |
15,573,575 | $ | 295,515,991 | 15,573,575 | $ | 295,515,991 | ||||||||||||||||
Common shares issued as reinvestment of dividends |
— | — | — | — | ||||||||||||||||||
Permanent difference reclassified (primarily non-deductible expenses) |
— | (90,464 | ) | — | — | |||||||||||||||||
Return of Capital |
— | — | — | — | ||||||||||||||||||
Common shares outstanding, end of the year |
15,573,575 | $ | 295,425,527 | 15,573,575 | $ | 295,515,991 | ||||||||||||||||
Apollo Tactical Income Fund |
||||||||||||||||||||||
Year Ended December 31, 2023 |
Year Ended December 31, 2022 | |||||||||||||||||||||
Shares |
Amount |
Shares |
Amount | |||||||||||||||||||
Common shares outstanding, beginning of the year |
14,464,026 | $ | 275,434,361 | 14,464,026 | $ | 275,434,361 | ||||||||||||||||
Common shares issued as reinvestment of dividends |
— | — | — | — | ||||||||||||||||||
Permanent difference reclassified (primarily non-deductible expenses) |
— | (70,094 | ) | — | — | |||||||||||||||||
Return of Capital |
— | — | — | — | ||||||||||||||||||
Common shares outstanding, end of the year |
14,464,026 | $ | 275,364,267 | 14,464,026 | $ | 275,434,361 | ||||||||||||||||
Apollo Senior Floating Rate Fund Inc. | ||||||||||||||||||||||||||||||||||
Dividend Declaration Date |
Ex-Dividend Date |
Record Date |
Payment Date |
Per Share Amount |
Gross Distribution |
Cash Distribution |
Value of new Common Shares Issued | |||||||||||||||||||||||||||
January 11, 2023 |
January 20, 2023 | January 23, 2023 | January 31, 2023 | $ | 0.1080 | $ | 1,681,946 | $ | 1,681,946 | — | ||||||||||||||||||||||||
February 9, 2023 |
February 17, 2023 | February 21, 2023 | February 28, 2023 | $ | 0.1130 | $ | 1,759,814 | $ | 1,759,814 | — | ||||||||||||||||||||||||
March 13, 2023 |
March 23, 2023 | March 24, 2023 | March 31, 2023 | $ | 0.1130 | $ | 1,759,814 | $ | 1,759,814 | — | ||||||||||||||||||||||||
April 10, 2023 |
April 20, 2023 | April 21, 2023 | April 28, 2023 | $ | 0.1130 | $ | 1,759,814 | $ | 1,759,814 | — | ||||||||||||||||||||||||
May 11, 2023 |
May 22, 2023 | May 23, 2023 | May 31, 2023 | $ | 0.1180 | $ | 1,837,682 | $ | 1,837,682 | — | ||||||||||||||||||||||||
June 12, 2023 |
June 22, 2023 | June 23, 2023 | June 30, 2023 | $ | 0.1180 | $ | 1,837,682 | $ | 1,837,682 | — | ||||||||||||||||||||||||
July 14, 2023 |
July 21, 2023 | July 24, 2023 | July 31, 2023 | $ | 0.1260 | $ | 1,962,270 | $ | 1,962,270 | — | ||||||||||||||||||||||||
August 11, 2023 |
August 23, 2023 | August 24, 2023 | August 31, 2023 | $ | 0.1260 | $ | 1,962,270 | $ | 1,962,270 | — | ||||||||||||||||||||||||
September 11, 2023 |
September 21, 2023 | September 22, 2023 | September 29, 2023 | $ | 0.1290 | $ | 2,008,991 | $ | 2,008,991 | — | ||||||||||||||||||||||||
October 12, 2023 |
October 23, 2023 | October 24, 2023 | October 31, 2023 | $ | 0.1350 | $ | 2,102,433 | $ | 2,102,433 | — | ||||||||||||||||||||||||
November 10, 2023 |
November 21, 2023 | November 22, 2023 | November 30, 2023 | $ | 0.1350 | $ | 2,102,433 | $ | 2,102,433 | — | ||||||||||||||||||||||||
December 11, 2023 |
December 20, 2023 | December 21, 2023 | December 29, 2023 | $ | 0.1370 | $ | 2,133,580 | $ | 2,133,580 | — | ||||||||||||||||||||||||
January 11, 2024* |
January 23, 2024 | January 24, 2024 | January 31, 2024 | $ | 0.1370 | $ | 2,133,580 | $ | 2,133,580 | — | ||||||||||||||||||||||||
February 9, 2024* |
February 21, 2024 | February 22, 2024 | February 29, 2024 | $ | 0.1370 | |||||||||||||||||||||||||||||
Apollo Tactical Income Fund Inc. |
||||||||||||||||||||||||||||||||||
Dividend Declaration Date |
Ex-Dividend Date |
Record Date |
Payment Date |
Per Share Amount |
Gross Distribution |
Cash Distribution |
Value of new Common Shares Issued | |||||||||||||||||||||||||||
January 11, 2023 |
January 20, 2023 | January 23, 2023 | January 31, 2023 | $ | 0.1220 | $ | 1,764,611 | $ | 1,764,611 | — | ||||||||||||||||||||||||
February 9, 2023 |
February 17, 2023 | February 21, 2023 | February 28, 2023 | $ | 0.1220 | $ | 1,764,611 | $ | 1,764,611 | — | ||||||||||||||||||||||||
March 13, 2023 |
March 23, 2023 | March 24, 2023 | March 31, 2023 | $ | 0.1220 | $ | 1,764,611 | $ | 1,764,611 | — | ||||||||||||||||||||||||
April 10, 2023 |
April 20, 2023 | April 21, 2023 | April 28, 2023 | $ | 0.1220 | $ | 1,764,611 | $ | 1,764,611 | — | ||||||||||||||||||||||||
May 11, 2023 |
May 22, 2023 | May 23, 2023 | May 31, 2023 | $ | 0.1220 | $ | 1,764,611 | $ | 1,764,611 | — | ||||||||||||||||||||||||
June 12, 2023 |
June 22, 2023 | June 23, 2023 | June 30, 2023 | $ | 0.1220 | $ | 1,764,611 | $ | 1,764,611 | — | ||||||||||||||||||||||||
July 14, 2023 |
July 21, 2023 | July 24, 2023 | July 31, 2023 | $ | 0.1220 | $ | 1,764,611 | $ | 1,764,611 | — | ||||||||||||||||||||||||
August 11, 2023 |
August 23, 2023 | August 24, 2023 | August 31, 2023 | $ | 0.1220 | $ | 1,764,611 | $ | 1,764,611 | — | ||||||||||||||||||||||||
September 11, 2023 |
September 21, 2023 | September 22, 2023 | September 29, 2023 | $ | 0.1220 | $ | 1,764,611 | $ | 1,764,611 | — | ||||||||||||||||||||||||
October 12, 2023 |
October 23, 2023 | October 24, 2023 | October 31, 2023 | $ | 0.1250 | $ | 1,808,003 | $ | 1,808,003 | — | ||||||||||||||||||||||||
November 10, 2023 |
November 21, 2023 | November 22, 2023 | November 30, 2023 | $ | 0.1250 | $ | 1,808,003 | $ | 1,808,003 | — | ||||||||||||||||||||||||
December 11, 2023 |
December 20, 2023 | December 21, 2023 | December 29, 2023 | $ | 0.1330 | $ | 1,923,715 | $ | 1,923,715 | — | ||||||||||||||||||||||||
January 11, 2024* |
January 23, 2024 | January 24, 2024 | January 31, 2024 | $ | 0.1330 | $ | 1,923,715 | $ | 1,923,715 | — | ||||||||||||||||||||||||
February 9, 2024* |
February 21, 2024 | February 22, 2024 | February 29, 2024 | $ | 0.1330 | |||||||||||||||||||||||||||||
Fund |
Accumulated Loss |
Paid-In Capital | ||||||||
Apollo Senior Floating Rate Fund Inc. |
$ | 90,464 | $ | (90,464 | ) | |||||
Apollo Tactical Income Fund Inc. |
$ |
70,094 |
$ |
(70,094 |
) | |||||
Apollo Senior Floating Rate Fund Inc. |
||||||||||
Distributions Paid to Common Shareholders from: |
2023 |
2022 | ||||||||
Ordinary Income* |
$ | 22,908,728 | $ | 17,037,490 | ||||||
Return of Capital |
— | — | ||||||||
Total Distributions |
$ | 22,908,728 | $ | 17,037,490 | ||||||
Apollo Tactical Income Fund Inc. |
||||||||||
Distributions Paid to Common Shareholders from: |
2023 |
2022 | ||||||||
Ordinary Income* |
$ | 21,421,221 | $ | 17,009,694 | ||||||
Return of Capital |
— | — | ||||||||
Total Distributions |
$ | 21,421,221 | $ | 17,009,694 | ||||||
Fund |
Undistributed Ordinary Income |
Undistributed Long-Term Capital Gains |
Net Unrealized Appreciation/ (Depreciation)* |
Accumulated Capital and Other Losses | ||||||||||||||||||
Apollo Senior Floating Rate Fund Inc. |
$ | 2,243,295 | $ | — | $ |
(15,429,942 |
) |
$ |
(48,158,408 |
) | ||||||||||||
Apollo Tactical Income Fund Inc. |
2,484,919 | — | (13,365,273 | ) | (50,914,234 | ) | ||||||||||||||||
Apollo Senior Floating Rate Fund Inc. |
Apollo Tactical Income Fund Inc. | |||||||||
Federal tax basis, cost |
$ | 351,702,345 | $ | 330,100,246 | ||||||
Unrealized appreciation |
$ | 3,304,230 | $ | 3,111,934 | ||||||
Unrealized depreciation |
(18,778,894 | ) | (16,537,819 | ) | ||||||
Net unrealized appreciation/(depreciation)* |
$ | (15,474,664 | ) | $ | (13,425,885 | ) | ||||
Borrower |
AFT |
AIF | ||||||||
Accelerate 360 Holdings, LLC Revolving Term Loan* ** |
$ | — | $ | 508,873 | ||||||
Advarra Holdings, Inc. Delayed Draw Term Loan |
580,151 | 580,151 | ||||||||
Allied Benefits Systems Intermediate LLC Delayed Draw Term Loan |
618,557 | 463,918 | ||||||||
Anaplan, Inc. Revolving Term Loan |
349,471 | 349,471 | ||||||||
Anuvu Holdings 2, LLC Delayed Draw Term Loan ** |
35,074 | 33,195 | ||||||||
Avalara, Inc. Revolving Term Loan |
454,545 | 454,545 | ||||||||
Channelside AcquisitionCo, Inc. Delayed Draw Term Loan ** |
46,667 | 46,667 | ||||||||
Channelside AcquisitionCo, Inc. Revolving Term Loan |
166,667 | 166,667 | ||||||||
Coretrust Purchasing Group, LLC Delayed Draw Term Loan |
338,346 | 338,346 | ||||||||
Coretrust Purchasing Group, LLC Revolving Term Loan |
338,346 | 338,346 | ||||||||
Crewline Buyer, Inc. Revolving Term Loan |
188,679 | 188,679 | ||||||||
Cube Industrials Buyer, Inc. Revolving Term Loan |
413,793 | 413,793 | ||||||||
Evergreen IX Borrower 2023, LLC Revolving Term Loan |
397,516 | 397,516 | ||||||||
Gateway US Holdings, Inc. Revolving Term Loan* |
— | 112,686 | ||||||||
Higginbotham Insurance Agency, Inc. 3rd Amd. Delayed Draw Term Loan ** |
296,889 | 296,889 | ||||||||
Inovalon Holdings, Inc. Delayed Draw Term Loan* ** |
— | 660,211 | ||||||||
IQN Holding Corp. Delayed Draw Term Loan* |
— | 420,856 | ||||||||
IQN Holding Corp. Revolving Term Loan* |
— | 320,856 | ||||||||
NCL Corporation Ltd. Backstop Notes |
694,000 | 694,000 | ||||||||
NCL Corporation Ltd. Class B Bridge Notes |
1,153,000 | 1,153,000 | ||||||||
OMH-Healthedge Holdings, Inc. Revolving Term Loan |
586,466 | 488,722 | ||||||||
Planet US Buyer LLC Revolving Term Loan*** |
222,222 | 222,222 | ||||||||
Redfin Corp. Delayed Draw Term Loan |
1,750,000 | 1,750,000 | ||||||||
Riverbed Technology, Inc. Revolving Term Loan |
84,607 | 75,542 | ||||||||
Ultimate Baked Goods Midco, LLC Revolving Term Loan* |
— | 248,649 | ||||||||
Zendesk, Inc. Delayed Draw Term Loan |
1,104,901 | 739,130 | ||||||||
Zendesk, Inc. Revolving Term Loan |
454,959 | 304,348 | ||||||||
| $ | 10,274,856 | $ | 11,767,278 | |||||||
Apollo Senior Floating Rate Fund Inc. | |||||
Shareholder Transaction Expenses |
Percentage of Offering Price | ||||
Sales load paid by you (as a percentage of offering price) |
1.00 | % (1) | |||
Offering Expenses borne by Common Shareholders (as a percentage of offering price) |
0.57 | % (1) | |||
Dividend Reinvestment Plan Fees |
None | (2) | |||
Annual Expenses |
Percentage of Net Assets Attributable to Common Shares (6) | ||||
Investment management fee (3) |
1.52 | % | |||
Interest payments on borrowed funds (4) |
3.00 | % | |||
Other expenses (5) |
0.93 | % | |||
Total annual Fund operating expenses |
5.45 | % | |||
Apollo Tactical Income Fund Inc. | |||||
Shareholder Transaction Expenses |
Percentage of Offering Price | ||||
Sales load paid by you ( |
% (1) | ||||
Offering Expenses borne by Common Shareholders ( |
% (1) | ||||
Dividend Reinvestment Plan Fees |
(2) | ||||
Annual Expenses |
Percentage of Net Assets Attributable to Common Shares (6) | ||||
Investment management fee (3) |
% | ||||
Interest payments on borrowed funds (4) |
% | ||||
Other expenses (5) |
% | ||||
Total annual Fund operating expenses |
% | ||||
(1) |
If the Common Shares are sold to or through agents, a corresponding prospectus supplement will set forth any applicable sales load and the estimated offering expenses. Holders of Common Shares will pay all offering expenses involved with an offering. |
(2) |
There is no charge to participants for reinvesting dividends or capital gains distributions. Each Fund’s plan agent service fee for handling the reinvestment of such dividends and capital gains distributions will be paid by the Fund. Shareholders will bear a proportionate share of brokerage commissions on all open market purchases. |
(3) |
(4) |
Interest expense assumes that leverage represents 33% of each Fund’s Managed Assets and is charged at an interest rate pursuant to the terms of each Fund’s credit agreement. The types of leverage and terms of the respective credit agreements are included in Note 8- Credit Agreements and Preferred Shares of this annual report. |
(5) |
(6) |
For purposes of the Fee Table, each Fund’s net assets have been calculated as Managed Assets less the principal amount of borrowings under the Amended Credit Facility. As of the date of this prospectus, each Fund does not have any preferred shares outstanding. |
1 Year |
3 Years |
5 Years |
10 Years | |||||||||||||||||||
Apollo Senior Floating Rate Fund Inc. |
$ | 64 | $ | 171 | $ | 277 | $ | 538 | ||||||||||||||
1 Year |
3 Years |
5 Years |
10 Years | |||||||||||||||||||
Apollo Tactical Income Fund Inc. |
$ | $ | $ | $ | ||||||||||||||||||
Apollo Senior Floating Rate Fund Inc. | ||||||||||||||||||||||||||||||||||
Market Price |
NAV |
Premium/(Discount) to NAV | ||||||||||||||||||||||||||||||||
Period Ended |
High |
Low |
High |
Low |
High |
Low | ||||||||||||||||||||||||||||
December 31, 2023 |
$ | 13.58 | $ | 12.62 | $ | 15.03 | $ | 14.85 | (9.65 | )% | (15.02 | )% | ||||||||||||||||||||||
September 30, 2023 |
$ | 13.71 | $ | 12.80 | $ | 15.25 | $ | 14.87 | (10.10 | )% | (13.92 | )% | ||||||||||||||||||||||
June 30, 2023 |
$ | 12.91 | $ | 12.30 | $ | 14.79 | $ | 14.49 | (12.71 | )% | (15.11 | )% | ||||||||||||||||||||||
March 31, 2023 |
$ | 13.56 | $ | 12.27 | $ | 14.82 | $ | 14.47 | (8.50 | )% | (15.20 | )% | ||||||||||||||||||||||
December 31, 2022 |
$ | 12.83 | $ | 12.18 | $ | 14.33 | $ | 14.31 | (10.47 | )% | (14.88 | )% | ||||||||||||||||||||||
September 30, 2022 |
$ | 13.82 | $ | 12.44 | $ | 15.25 | $ | 14.36 | (9.38 | )% | (13.37 | )% | ||||||||||||||||||||||
June 30, 2022 |
$ | 14.88 | $ | 12.68 | $ | 16.16 | $ | 14.87 | (7.92 | )% | (14.73 | )% | ||||||||||||||||||||||
March 31, 2022 |
$ | 16.99 | $ | 14.29 | $ | 16.61 | $ | 15.98 | 2.29 | % | (10.58 | )% | ||||||||||||||||||||||
December 31, 2021 |
$ | 16.55 | $ | 15.80 | $ | 16.46 | $ | 16.68 | 0.55 | % | (5.28 | )% | ||||||||||||||||||||||
September 30, 2021 |
$ | 15.93 | $ | 15.11 | $ | 16.66 | $ | 16.66 | (4.38 | )% | (9.30 | )% | ||||||||||||||||||||||
June 30, 2021 |
$ | 15.78 | $ | 14.91 | $ | 16.74 | $ | 16.37 | (5.73 | )% | (8.92 | )% | ||||||||||||||||||||||
March 31, 2021 |
$ | 15.03 | $ | 14.30 | $ | 16.49 | $ | 16.15 | (8.85 | )% | (11.46 | )% | ||||||||||||||||||||||
December 31, 2020 |
$ | 14.46 | $ | 12.57 | $ | 16.20 | $ | 15.44 | (10.74 | )% | (18.59 | )% | ||||||||||||||||||||||
Apollo Tactical Income Fund Inc. | ||||||||||||||||||||||||||||||||||
Market Price |
NAV |
Premium/(Discount) to NAV | ||||||||||||||||||||||||||||||||
Period Ended |
High |
Low |
High |
Low |
High |
Low | ||||||||||||||||||||||||||||
December 31, 2023 |
$ | $ | $ | $ | ( |
)% | ( |
)% | ||||||||||||||||||||||||||
September 30, 2023 |
$ | $ | $ | $ | ( |
)% | ( |
)% | ||||||||||||||||||||||||||
June 30, 2023 |
$ | $ | $ | $ | ( |
)% | ( |
)% | ||||||||||||||||||||||||||
March 31, 2023 |
$ | $ | $ | $ | ( |
)% | ( |
)% | ||||||||||||||||||||||||||
December 31, 2022 |
$ | $ | $ | $ | ( |
)% | ( |
)% | ||||||||||||||||||||||||||
September 30, 2022 |
$ | $ | $ | $ | ( |
)% | ( |
)% | ||||||||||||||||||||||||||
June 30, 2022 |
$ | $ | $ | $ | ( |
)% | ( |
)% | ||||||||||||||||||||||||||
March 31, 2022 |
$ | $ | $ | $ | ( |
)% | ( |
)% | ||||||||||||||||||||||||||
December 31, 2021 |
$ | $ | $ | $ | ( |
)% | ( |
)% | ||||||||||||||||||||||||||
September 30, 2021 |
$ | $ | $ | $ | ( |
)% | ( |
)% | ||||||||||||||||||||||||||
June 30, 2021 |
$ | $ | $ | $ | ( |
)% | ( |
)% | ||||||||||||||||||||||||||
March 31, 2021 |
$ | $ | $ | $ | ( |
)% | ( |
)% | ||||||||||||||||||||||||||
December 31, 2020 |
$ | $ | $ | $ | ( |
)% | ( |
)% | ||||||||||||||||||||||||||
Apollo Senior Floating Rate Fund Inc. | ||||||||||||||||||||||
Year Ended |
Total Debt Outstanding |
Asset Coverage per $1,000 of Debt Outstanding (1) |
Asset Coverage Per Share (2) |
Average Market Value per Share (Excluding Debt Outstanding) |
Type of Senior Security | |||||||||||||||||
December 31, 2023 |
$130,000,000 | $2,801 | N/A | N/A | Loan | |||||||||||||||||
December 31, 2022 |
$130,000,000 | $2,700 | N/A | N/A | Loan | |||||||||||||||||
December 31, 2021 |
$130,000,000 | $2,971 | N/A | N/A | Loan | |||||||||||||||||
December 31, 2020 |
$121,000,000 | $3,079 | N/A | N/A | Loan | |||||||||||||||||
December 31, 2019 |
$141,000,000 | $2,871 | N/A | N/A | Loan | |||||||||||||||||
December 31, 2018 |
$141,000,000 | $2,804 | N/A | N/A | Loan | |||||||||||||||||
December 31, 2017 |
$141,000,000 | $2,972 | N/A | N/A | Loan | |||||||||||||||||
December 31, 2016 |
$141,000,000 | $2,995 | N/A | N/A | Loan | |||||||||||||||||
December 31, 2015 |
$149,269,000 | $2,765 | N/A | N/A | Loan | |||||||||||||||||
December 31, 2014 |
$149,269,000 | $2,909 | N/A | N/A | Loan | |||||||||||||||||
December 31, 2013 |
$122,704,615 | $3,676 | $294,078 | $ | 20,000 | Loan & Preferred Shares | ||||||||||||||||
Apollo Tactical Income Fund Inc. | ||||||||||||||||||||||
Year Ended |
Total Debt Outstanding |
Asset Coverage per $1,000 of Debt Outstanding (1) |
Asset Coverage Per Share (2) |
Average Market Value per Share (Excluding Debt Outstanding) |
Type of Senior Security | |||||||||||||||||
December 31, 2023 |
$ |
$ |
N/A | N/A | Loan | |||||||||||||||||
December 31, 2022 |
$ |
$ |
N/A | N/A | Loan | |||||||||||||||||
December 31, 2021 |
$ |
$ |
N/A | N/A | Loan | |||||||||||||||||
December 31, 2020 |
$ |
$ |
N/A | N/A | Loan | |||||||||||||||||
December 31, 2019 |
$ |
$ |
N/A | N/A | Loan | |||||||||||||||||
December 31, 2018 |
$ |
$ |
N/A | N/A | Loan | |||||||||||||||||
December 31, 2017 |
$ |
$ |
N/A | N/A | Loan | |||||||||||||||||
December 31, 2016 |
$ |
$ |
N/A | N/A | Loan | |||||||||||||||||
December 31, 2015 |
$ |
$ |
N/A | N/A | Loan | |||||||||||||||||
December 31, 2014 |
$ |
$ |
N/A | N/A | Loan | |||||||||||||||||
December 31, 2013 |
$ |
$ |
N/A | N/A | Loan | |||||||||||||||||
(1) |
Calculated by subtracting the Fund’s total liabilities (not including the Preferred Shares (if applicable) and borrowings outstanding) from the Fund’s total assets, and dividing this by the amount of borrowings outstanding. |
(2) |
Calculated by subtracting the Fund’s total liabilities (not including the Preferred Shares (if applicable) and borrowings outstanding) from the Fund’s total assets, and dividing this by the number of Preferred Shares outstanding. |
Directors and Officers Name, Address (1) and Year of Birth |
Position(s) Held with the Funds |
Term of Office and Length of Time Served |
Principal Occupation(s) During Past Five Years |
Number of Portfolios in the Complex of Funds Overseen by the Director |
Other Public Directorships/ Trusteeships Held by the Director During Past Five Years | |||||||
| INTERESTED DIRECTORS (2) (6) | ||||||||||||
Barry Cohen (born 1952) |
Director and Chairman of the Board |
AFT Director since 2011 and AIF Director since 2013; current terms end at the 2024 annual meeting. | President, Elysium Management LLC since 2017. Managing Director, Apollo Global Management, Inc. and affiliates (investment advisor) from 2008 to 2022. Senior Advisor, Apollo Global Management, Inc. and affiliates (investment advisor) from 2022 - present. | 2 | None. | |||||||
| INDEPENDENT DIRECTORS (3) | ||||||||||||
Glenn N. Marchak (born 1956) |
Director; Audit Committee Chair |
AFT Director since 2011 and AIF Director since 2013; current terms end at the 2025 annual meeting. | Private Investor; Corporate Director/Trustee. | 2 | Stone Harbor Emerging Markets Income Fund; Stone Harbor Emerging Markets Total Income Fund. | |||||||
Meredith Coffey (born 1968) |
Director | AFT Director since 2023 and AIF Director since 2023; current terms end at the 2026 annual meeting. | Head of Research and Co-Head of Public Policy, Loan & Syndications Trading Association from 2008 to 2023. |
2 | Director, Apollo Debt Solutions, BDC (2021- present), Trustee, Apollo Diversified Credit Fund (2022-present), Apollo S3 Private Markets Fund (2023-present). | |||||||
Todd J. Slotkin (born 1953) |
Lead Independent Director |
AFT Director since 2011 and AIF Director since 2013; current terms end at the 2025 annual meeting. | Co-Founder, President and COO, KMP Music LLC from 2020 to 2023: Managing Director and Global Head, Alvarez & Marsal Asset Management Services, LLC 2014 to 2022. |
2 | CBIZ, Inc. | |||||||
Directors and Officers Name, Address (1) and Year of Birth |
Position(s) Held with the Funds |
Term of Office and Length of Time Served |
Principal Occupation(s) During Past Five Years |
Number of Portfolios in the Complex of Funds Overseen by the Director |
Other Public Directorships/ Trusteeships Held by the Director During Past Five Years | |||||||
Elliot Stein, Jr. (born 1949) |
Director | AFT Director since 2011 and AIF Director since 2013; current terms end at the 2024 annual meeting. | Private Investor; Corporate Director/Trustee. | 2 | MidCap Financial Investment Corporation; BellRing Brands, Inc. | |||||||
| EXECUTIVE OFFICERS (4) | ||||||||||||
James Vanek (born 1979) |
President and Chief Investment Officer |
AFT and AIF since 2023. | Co-head of Apollo’s Global Performing Credit business since 2018. | N/A | Loan Syndications and Trading Association. | |||||||
Kenneth Seifert (born 1978) |
Treasurer and Chief Financial Officer |
AFT and AIF since 2021. | Treasurer and Chief Financial Officer of Apollo Diversified Credit Fund and Apollo Diversified Real Estate Fund since 2022; Treasurer, Chief Financial Officer and Principal Financial Officer of Apollo S3 Private Markets Fund since 2023; Controller, Principal and Director, Apollo Global Management, Inc. and affiliates since 2021 and 2017, respectively. | N/A | N/A | |||||||
Kristin Hester (born 1980) |
Secretary and Chief Legal Officer |
AFT and AIF since 2022. | Chief Legal Officer and Secretary for Apollo Debt Solutions BDC, MidCap Investment Corporation and Apollo Diversified Credit Fund since 2022; Chief Legal Officer and Secretary for Apollo S3 Private Markets Fund since 2023; Apollo Global Management, Inc. and affiliates since 2015. | N/A | N/A | |||||||
Ryan Del Giudice (5) (born 1990) |
Chief Compliance Officer |
AFT and AIF since 2023. | Principal, Apollo Global Management, Inc., since 2022; Chief Compliance Officer, Apollo Diversified Credit Fund and Apollo Diversified Real Estate Fund, since 2018; Chief Compliance Officer, MidCap Financial Investment Corporation and Apollo Debt Solutions BDC, since 2023; Chief Compliance Officer. Apollo S3 Private Markets Fund since 2023; Chief Compliance Officer, Griffin Capital Asset Management Company, LLC from 2017 to 2022. | N/A | N/A | |||||||
(1) |
The address of each Director and Officer is care of the Apollo Senior Floating Rate Fund Inc. or the Apollo Tactical Income Fund Inc. at 9 West 57th Street, New York, NY 10019. |
(2) |
“Interested person,” as defined in the Investment Company Act, of the Funds. Mr. Cohen is an interested person of the Funds due to his affiliation with the Adviser. |
(3) |
“Independent Directors” are the directors who are not “interested persons,” as defined in the Investment Company Act, of the Funds. |
(4) |
Executive officers of the Funds serve at the pleasure of the Board of Directors. |
(5) |
Prior to March 13, 2023, Isabella Gold served as the Chief Compliance Officer of the Funds. Ryan Del Giudice was appointed by the Board of each Fund to serve as his replacement as of such date. |
(6) |
Robert Borden retired from the Board effective December 31, 2023. |
| • | Calling 1-877-864-4834; |
| • | Writing us at the following address: |

| (b) | Not applicable. |
Item 2. Code of Ethics.
| (a) | The registrant, as of the end of the period covered by this report, has adopted a code of ethics that applies to the registrant’s principal executive officer, principal financial officer, principal accounting officer or controller, or persons performing similar functions, regardless of whether these individuals are employed by the registrant or a third party. |
| (b) | No response required. |
| (c) | There have been no amendments, during the period covered by this report, to a provision of the code of ethics that applies to the registrant’s principal executive officer, principal financial officer, principal accounting officer or controller, or persons performing similar functions, regardless of whether these individuals are employed by the registrant or a third party, and that relates to any element of the code of ethics description enumerated in paragraph (b) of this Item 2. |
| (d) | The registrant has not, during the period covered by this report, granted any waivers, including an implicit waiver, from a provision of the code of ethics that applies to the registrant’s principal executive officer, principal financial officer, principal accounting officer or controller, or persons performing similar functions, regardless of whether these individuals are employed by the registrant or a third party, that relates to one or more of the items set forth in paragraph (b) of this Item 2. |
| (e) | Not Applicable. |
| (f) | The code of ethics is included on the registrant’s website at: www.apollofunds.com |
Item 3. Audit Committee Financial Expert.
The registrant’s board of directors has determined that Glenn A. Marchak and Todd J. Slotkin are qualified to serve as audit committee financial experts serving on its audit committee and that they are “independent,” as defined in Item 3 of Form N-CSR.
Item 4. Principal Accountant Fees and Services.
Audit Fees
| (a) | The aggregate fees and expenses billed for professional services rendered by the principal accountant for the audit of the registrant’s annual financial statements or services that are normally provided by the accountant in connection with statutory and regulatory filings or engagements for the fiscal years ended December 31, 2022 and December 31, 2023 were $116,000 and $116,000, respectively. |
Audit-Related Fees
| (b) | The aggregate fees billed in the fiscal years ended December 31, 2022 and December 31, 2023 for assurance and related services by the principal accountant that are reasonably related to the performance of the audit of the registrant’s financial statements and are not reported under paragraph (a) of this Item were $0 and $0, respectively. The aggregate audit-related fees billed in the fiscal years ended December 31, 2022 and December 31, 2023 to Service Affiliates (as defined below) were $0 and $0, respectively. |
Tax Fees
| (c) | The aggregate fees billed in the fiscal years ended December 31, 2022 and December 31, 2023 for professional services rendered by the principal accountant for tax compliance, tax advice, and tax planning were $7,000 and $7,000, respectively. “Tax fees” are for tax services related to reviews of returns and various tax matters. The aggregate tax fees billed in the fiscal years ended December 31, 2022 and December 31, 2023 to Service Affiliates (as defined below) were $0 and $0, respectively. |
All Other Fees
| (d) | The aggregate fees billed in the fiscal years ended December 31, 2022 and December 31, 2023 for products and services provided by the principal accountant, other than the services reported in paragraphs (a) through (c) of this Item, were $27,000 and $10,000, respectively, related to a shelf offering registration statement. The aggregate fees in this category billed in the fiscal years ended December 31, 2022 and December 31, 2023 to Service Affiliates (as defined below) were $0 and $0, respectively. |
| (e)(1) | All services to be performed for the registrant and all services to be performed for the registrant’s investment adviser or any entity controlling, controlled by or under common control with the investment adviser that provides ongoing services to the registrant (“Service Affiliates”), if the engagement relates directly to the operations and financial reporting of the registrant, by the registrant’s principal accountant must be pre-approved by the registrant’s audit committee. |
| (e)(2) | No services described in paragraphs (b) through (d) of this Item were approved by the audit committee pursuant to paragraph (c)(7)(i)(C) of Rule 2-01 of Regulation S-X. |
| (f) | Not applicable. |
| (g) | The aggregate non-audit fees billed by the registrant’s accountant for services rendered to the registrant and to Service Affiliates for the fiscal years ended December 31, 2022 and December 31, 2023 were $34,000 and $17,000, respectively. |
| (h) | Not applicable. |
| (i) | Not applicable. |
| (j) | Not applicable. |
Item 5. Audit Committee of Listed Registrants.
| (a) | The registrant has a separately designated audit committee consisting solely of independent directors of the registrant. The members of the audit committee are: Meredith Coffey, Glenn N. Marchak (Chairman), Todd J. Slotkin and Elliot Stein, Jr. |
| (b) | Not applicable. |
Item 6. Investments.
| (a) | Schedule of Investments in securities of unaffiliated issuers as of the close of the reporting period is included as part of the report to shareholders filed under Item 1 of this Form. |
| (b) | Not applicable due to no such divestments during the semi-annual period covered since the previous Form N-CSR filing. |
Item 7. Disclosure of Proxy Voting Policies and Procedures for Closed-End Management Investment Companies.
The Proxy Voting Policies are included in this Item.
Proxy Voting Policies and Procedures
of
Apollo Credit Management, LLC
SEC registered advisers that have the authority to vote client proxies (which authority may be implied from a general grant of investment discretion) are required to adopt policies and procedures (i) reasonably designed to ensure that the adviser votes proxies in the best interests of its clients and (ii) that include how the adviser addresses material conflicts that may arise between the adviser’s interests and those of its clients. It is expected that, in most cases, Apollo Credit Management, LLC (the “adviser”) will invest the assets of its clients in securities that do not generally carry voting rights. When a client account does have voting rights in a security, it follows the proxy voting policies and procedures summarized below:
In determining how to vote, officers of the adviser will consult with each other, and other investment professionals affiliated with the adviser, taking into account the interests of the adviser’s clients and investors as well as any potential conflicts of interest. The adviser will consult with legal counsel to identify potential conflicts of interest. Where a potential conflict of interest exists, the adviser may, if it so elects, resolve it by following the recommendation of a disinterested third party, including by seeking the direction of the independent directors of the client or, in extreme cases, by abstaining from voting. While the adviser may retain an outside service to provide voting recommendations and to assist in analyzing votes, the adviser does not expect to delegate its voting authority to any third party.
An officer of the adviser will keep a written record of how all such proxies are voted. The adviser will retain records of (1) proxy voting policies and procedures, (2) all proxy statements received (or it may rely on proxy statements filed on the SEC’s EDGAR system in lieu thereof), (3) all votes cast, (4) investor requests for voting information, and (5) any specific documents prepared or received in connection with a decision on a proxy vote. If it uses an outside service, the adviser may rely on such service to maintain copies of proxy statements and records, so long as such service will provide a copy of such documents promptly upon request.
The adviser’s proxy voting policies are not exhaustive and are designed to be responsive to the wide range of issues that may be subject to a proxy vote. In general, the adviser will vote proxies in accordance with these guidelines unless: (1) it has determined otherwise due to the specific and unusual facts and circumstances with respect to a particular vote, (2) the subject matter of the vote is not covered by these guidelines, (3) a material conflict of interest is present, or (4) it is necessary to vote contrary to the general guidelines to maximize shareholder value or the best interests of the adviser’s clients. In reviewing proxy issues, the adviser generally uses the following guidelines:
Elections of Directors: In general, the adviser will vote in favor of the management-proposed slate of directors. If there is a proxy fight for seats on a portfolio company’s board of directors, or the adviser determines that there are other compelling reasons for withholding a vote, it will determine the appropriate vote on the matter. The adviser may withhold votes for directors that fail to act on key issues, such as failure to: (1) implement proposals to declassify a board, (2) implement a majority vote requirement, (3) submit a rights plan to a shareholder vote or (4) act on tender offers where a majority of shareholders have tendered their shares. Finally, the adviser may withhold votes for directors of non-U.S. issuers where there is insufficient information about the nominees disclosed in the proxy statement or where, in the adviser’s discretion, the cost of voting will outweigh the perceived benefit.
Appointment of Auditors: The adviser believes that the board of an issuer remains in the best position to choose its independent auditors and the adviser will generally support management’s recommendation in this regard.
Changes in Capital Structure: Changes in an issuer’s charter or by-laws may be required by state or federal regulation. In general, the adviser will cast client votes in accordance with management on such proposals. However, the adviser will consider carefully any proposal regarding a change in corporate structure that is not required by state or federal regulation.
Corporate Restructurings, Mergers and Acquisitions: The adviser believes proxy votes dealing with corporate reorganizations are an extension of the investment decision. Accordingly, the adviser will analyze such proposals on a case-by-case basis and vote in accordance with its perception of client interests.
Proposals Affecting Shareholder Rights: The adviser generally will vote in favor of proposals that give shareholders a greater voice in the affairs of an issuer and oppose any measure that seeks to limit such rights. However, when analyzing such proposals, the adviser will balance the financial impact of the proposal against any impairment of shareholder rights as well as of a client’s investment in the issuer.
Corporate Governance: The adviser recognizes the importance of good corporate governance. Accordingly, the adviser generally will favor proposals that promote transparency and accountability within an issuer.
Anti-Takeover Measures: The adviser will evaluate, on a case-by-case basis, any proposals regarding anti-takeover measures to determine the measure’s likely effect on shareholder value dilution.
Stock Splits: The adviser generally will vote with management on stock split matters.
Limited Liability of Directors: The adviser generally will vote with management on matters that could adversely affect the limited liability of directors.
Social and Corporate Responsibility: The adviser will review proposals related to social, political and environmental issues to determine whether they may adversely affect shareholder value. The adviser may abstain from voting on such proposals where they do not have a readily determinable financial impact on shareholder value.
Item 8. Portfolio Managers of Closed-End Management Investment Companies.
(a)(1) As of December 31, 2023, the following individuals have primary responsibility for the day-to-day implementation of the registrant’s investment strategy (the “Portfolio Managers”):
| Portfolio Managers |
Title | Length of Service | Business Experience for Last 5 Years | |||
| James Vanek | President and Chief Investment Officer | Joined Apollo in 2008
Portfolio Manager since 2014 |
Mr. Vanek is a Partner and the Co-Head of Apollo’s Global Performing Credit business and serves as a Portfolio Manager of the registrant. Prior to joining Apollo in 2008, Mr. Vanek was an Associate Director, Loan Sales & Trading in the Leveraged Finance group at Bear Stearns. He is a board member of the Loan Syndications and Trading Association, a leading advocate for the U.S. syndicated loan market. Mr. Vanek graduated from Duke University with a BS in Economics and a BA in Computer Science, and received his MBA from Columbia Business School. |
(a)(2) As of December 31, 2023, the Portfolio Managers listed above are also responsible for the day-to-day management of the following (not including the registrant):
| Name of Portfolio Manager
|
Total No. of Accounts Managed |
Total Assets (1)
|
No. of Accounts where Advisory Fee is Based on Performance
|
Total Assets in Accounts where Advisory Fee is Based on
| ||||
| James Vanek | ||||||||
| Registered Investment Companies: | 3 | $10.302 Billion | 1 | $8.834 Billion | ||||
| Other Pooled Investment Vehicles: | 5 | $7.730 Billion | 4 | $3.732 Billion | ||||
| Other Accounts: | 2 | $0.709 Billion | 1 | $0.376 Billion |
| (1) | Total assets represent assets under management as defined by Apollo Global Management, Inc., which includes unfunded commitments. |
| (2) | Represent the assets under management of the accounts managed that generate incremental fees in addition to advisory fees. |
Potential Conflicts of Interests
Actual or apparent conflicts of interest may arise when a Portfolio Manager has day-to-day management responsibilities with respect to more than one fund or other account.
Certain inherent conflicts of interest arise from the fact that the Portfolio Managers, the Adviser and its affiliates provide investment management services both to the registrant and the other Apollo-advised funds, including other funds, client accounts, proprietary accounts and any other investment vehicles that the Adviser and its affiliates may establish from time to time, in which the registrant will not have an interest. The Portfolio Managers, the Adviser and its affiliates may give advice and recommend securities to the other Apollo-advised funds that may differ from advice given to, or securities recommended or bought for, the registrant, even though their investment objectives may be the same or similar to those of the registrant.
The Adviser will seek to manage potential conflicts of interest in good faith; nonetheless, the portfolio strategies employed by the Portfolio Managers, the Adviser and its affiliates in managing the other Apollo-advised funds could conflict with the transactions and strategies employed by the Portfolio Managers in managing the registrant and may affect the prices and availability of the securities and instruments in which the registrant invests. Conversely, participation in specific investment opportunities may be appropriate, at times, for both the registrant and the other Apollo-advised funds. It is the policy of the Adviser to generally share appropriate investment opportunities (and sale opportunities) with the other Apollo-advised funds to the extent consistent with applicable legal requirements. In general, this policy will result in such opportunities being allocated pro rata among the registrant and the other Apollo-advised funds. Nevertheless, investments and/or opportunities may be allocated other than on a pro rata basis, to the extent it is done in good faith and does not, or is not reasonably expected to, result in an improper disadvantage or advantage to one participating Apollo-advised fund as compared to another participating Apollo-advised fund.
In the event investment opportunities are allocated among the registrant and the other Apollo-advised funds, the registrant may not be able to structure its investment portfolio in the manner desired. Although the Adviser endeavors to allocate investment opportunities in a fair and equitable manner, it is possible that the registrant may not be given the opportunity to participate in certain investments made by the other Apollo-advised funds or portfolio managers affiliated with the Adviser. Furthermore, the registrant and the other Apollo-advised funds may make investments in securities where the prevailing trading activity may make impossible the receipt of the same price or execution on the entire volume of securities purchased or sold by the registrant and the other Apollo-advised funds. When this occurs, the various prices may be averaged, and the registrant will be charged or credited with the average price. Thus, the effect of the aggregation may operate on some occasions to the disadvantage of the registrant. In addition, under certain circumstances, the registrant may not be charged the same commission or commission- equivalent rates in connection with a bunched or aggregated order.
It is possible that other Apollo-advised funds may make investments in the same or similar securities at different times and on different terms than the registrant. From time to time, the registrant and the other Apollo-advised funds may make investments at different levels of an issuer’s capital structure or otherwise in different classes of an issuer’s securities. Such investments may inherently give rise to conflicts of interest or perceived conflicts of interest between or among the various classes of securities
that may be held by such entities. Conflicts may also arise because portfolio decisions regarding the registrant may benefit the other Apollo-advised funds. For example, the sale of a long position or establishment of a short position by the registrant may impair the price of the same security sold short by (and therefore benefit) one or more Apollo-advised funds, and the purchase of a security or covering of a short position in a security by the registrant may increase the price of the same security held by (and therefore benefit) one or more Apollo-advised funds.
While these conflicts cannot be eliminated, when consistent with fund objectives, guidelines and other fiduciary considerations and when practicable, the Adviser, the registrant and the other Apollo-advised funds may hold investments in the same levels of an issuer’s capital structure in the same proportion at each level.
Although the professional staff of the Adviser will devote as much time to the management of the registrant as the Adviser deems appropriate to perform its obligations, the professional staff of the Adviser may have conflicts in allocating its time and services among the registrant and the Adviser’s other investment vehicles and accounts. The Adviser and its affiliates are not restricted from forming additional investment funds, from entering into other investment advisory relationships or from engaging in other business activities, even though such activities may be in competition with the registrant and/or may involve substantial time and resources of the Adviser and its professional staff. These activities could be viewed as creating a conflict of interest in that the time and effort of the members of the Adviser and their officers and employees will not be devoted exclusively to the business of the registrant but will be allocated between the business of the registrant and the management of the monies of other clients of the Adviser.
A conflict of interest may arise where the financial or other benefits available to a Portfolio Manager differ among the accounts that he manages. If the structure of the Adviser’s (or its affiliates’) management fee or the Portfolio Manager’s compensation differs among accounts (such as where certain accounts pay higher management fees or performance based management fees), the Portfolio Managers may be motivated to favor accounts in which they have investment interests, or in which the Adviser or its affiliates have investment interests. Similarly, the desire to maintain assets under management or to enhance a Portfolio Manager’s performance record or to derive other rewards, financial or otherwise, could influence the Portfolio Manager in affording preferential treatment to those accounts that could most significantly benefit the Portfolio Manager. For example, as reflected above, if a Portfolio Manager manages accounts that have performance fee arrangements, certain portions of his compensation will depend on the achievement of performance milestones on those accounts. The Portfolio Manager could be incented to afford preferential treatment to those accounts and thereby be subject to a potential conflict of interest.
The registrant and the Adviser have adopted compliance policies and procedures that are reasonably designed to address the various conflicts of interest that may arise for the Adviser and its staff members. However, there is no guarantee that such policies and procedures will be able to detect and prevent every situation in which an actual or potential conflict may arise.
(a)(3) Compensation Structure of Portfolio Manager(s) or Management Team Members
The Adviser’s financial arrangements with its portfolio managers, its competitive compensation and its career path emphasis at all levels reflect the value senior management places on key resources. Compensation may include a variety of components and may vary from year to year based on a number of factors. The principal components of compensation include base compensation and discretionary compensation.
Base Compensation. Generally, portfolio managers receive an annual salary that is consistent with the market rate of annual salaries paid to similarly situated investment professionals.
Discretionary Compensation. Portfolio managers also receive discretionary compensation generally consisting of two components: an annual bonus and carried interest.
Annual Bonus. Generally, a portfolio manager receives an annual bonus based on such person’s individual performance, operational performance for the Apollo-advised funds for which such person serves, and such portfolio manager’s impact on the overall operating performance and potential to contribute to long-term value and growth. A portion of each annual bonus may be deferred and, at the discretion of Apollo, may be in the form of cash or equity of an Apollo entity, such as restricted stock units of Apollo Global Management, Inc.
Carried Interest. Generally, a portfolio manager receives carried interests with respect to the Apollo-advised funds for which such person serves as a portfolio manager, subject to standard terms and conditions, including vesting.
(a)(4) Disclosure of Securities Ownership
The dollar range of common stock of the registrant beneficially owned by each Portfolio Manager as of December 31, 2023 was as follows:
| Name of Portfolio Manager | Dollar ($) Range of Common Stock Beneficially Owned | |
| James Vanek |
$100,001 - $500,000 |
Item 9. Purchases of Equity Securities by Closed-End Management Investment Company and Affiliated Purchasers.
None in the reporting period.
Item 10. Submission of Matters to a Vote of Security Holders.
There have been no material changes to the procedures by which the shareholders may recommend nominees to the registrant’s board of directors implemented since the registrant last provided disclosure in response to the requirements of Item 407(c)(2)(iv) of Regulation S-K (17 CFR 229.407) (as required by Item 22(b)(15) of Schedule 14A (17 CFR 240.14a-101)), or this Item.
Item 11. Controls and Procedures.
| (a) | The registrant’s principal executive and principal financial officers, or persons performing similar functions, have concluded that the registrant’s disclosure controls and procedures (as defined in Rule 30a-3(c) under the Investment Company Act of 1940, as amended (the “1940 Act”) (17 CFR 270.30a-3(c))) are effective, as of a date within 90 days of the filing date of this report, based on the evaluation of these controls and procedures required by Rule 30a-3(b) under the 1940 Act (17 CFR 270.30a-3(b)) and Rules 13a-15(b) or 15d-15(b) under the Securities Exchange Act of 1934, as amended (17 CFR 240.13a-15(b) or 240.15d-15(b)). |
| (b) | There were no changes in the registrant’s internal control over financial reporting (as defined in Rule 30a-3(d) under the 1940 Act (17 CFR 270.30a-3(d))) that occurred during the period covered by this |
| report that have materially affected, or are reasonably likely to materially affect, the registrant’s internal control over financial reporting. |
Item 12. Disclosure of Securities Lending Activities for Closed-End Management Investment Companies
Not applicable.
Item 13. Exhibits.
| (a)(1) | Not applicable. | |
| (a)(2) | Certifications pursuant to Rule 30a-2(a) under the 1940 Act and Section 302 of the Sarbanes-Oxley Act of 2002 are attached hereto. | |
| (a)(3) | Not applicable. | |
| (a)(4) | Not applicable. | |
| (b) | Certifications pursuant to Rule 30a-2(b) under the 1940 Act and Section 906 of the Sarbanes- Oxley Act of 2002 are attached hereto. | |
| (c) | Consent of Independent Registered Public Accounting Firm is attached hereto. | |
SIGNATURES
Pursuant to the requirements of the Securities Exchange Act of 1934 and the Investment Company Act of 1940, the registrant has duly caused this report to be signed on its behalf by the undersigned, thereunto duly authorized.
| (Registrant) Apollo Tactical Income Fund Inc. |
| By (Signature and Title) /s/ James Vanek |
| James Vanek, President |
| (principal executive officer) |
| Date February 21, 2024 |
Pursuant to the requirements of the Securities Exchange Act of 1934 and the Investment Company Act of 1940, this report has been signed below by the following persons on behalf of the registrant and in the capacities and on the dates indicated.
| By (Signature and Title) /s/ James Vanek |
| James Vanek, President |
| (principal executive officer) |
| Date February 21, 2024 |
| By (Signature and Title) /s/ Kenneth Seifert |
| Kenneth Seifert, Treasurer and Chief Financial Officer |
| (principal financial officer) |
| Date February 21, 2024 |
EX.99.CERT
Certification Pursuant to Rule 30a-2(a) under the 1940 Act and Section 302 of the
Sarbanes-Oxley Act
I, James Vanek, certify that:
| 1. | I have reviewed this report on Form N-CSR of Apollo Tactical Income Fund Inc.; |
| 2. | Based on my knowledge, this report does not contain any untrue statement of a material fact or omit to state a material fact necessary to make the statements made, in light of the circumstances under which such statements were made, not misleading with respect to the period covered by this report; |
| 3. | Based on my knowledge, the financial statements, and other financial information included in this report, fairly present in all material respects the financial condition, results of operations, changes in net assets, and cash flows (if the financial statements are required to include a statement of cash flows) of the registrant as of, and for, the periods presented in this report; |
| 4. | The registrant’s other certifying officer(s) and I are responsible for establishing and maintaining disclosure controls and procedures (as defined in Rule 30a-3(c) under the Investment Company Act of 1940) and internal control over financial reporting (as defined in Rule 30a-3(d) under the Investment Company Act of 1940) for the registrant and have: |
| (a) | Designed such disclosure controls and procedures, or caused such disclosure controls and procedures to be designed under our supervision, to ensure that material information relating to the registrant, including its consolidated subsidiaries, is made known to us by others within those entities, particularly during the period in which this report is being prepared; |
| (b) | Designed such internal control over financial reporting, or caused such internal control over financial reporting to be designed under our supervision, to provide reasonable assurance regarding the reliability of financial reporting and the preparation of financial statements for external purposes in accordance with generally accepted accounting principles; |
| (c) | Evaluated the effectiveness of the registrant’s disclosure controls and procedures and presented in this report our conclusions about the effectiveness of the disclosure controls and procedures, as of a date within 90 days prior to the filing date of this report based on such evaluation; and |
| (d) | Disclosed in this report any change in the registrant’s internal control over financial reporting that occurred during the period covered by this report that has materially affected, or is reasonably likely to materially affect, the registrant’s internal control over financial reporting; and |
| 5. | The registrant’s other certifying officer(s) and I have disclosed to the registrant’s auditors and the audit committee of the registrant’s board of directors (or persons performing the equivalent functions): |
| (a) | All significant deficiencies and material weaknesses in the design or operation of internal control over financial reporting which are reasonably likely to adversely affect the registrant’s ability to record, process, summarize, and report financial information; and |
| (b) | Any fraud, whether or not material, that involves management or other employees who have a significant role in the registrant’s internal control over financial reporting. |
| Date: February 21, 2024 |
/s/ James Vanek | |
| James Vanek, President | ||
| (principal executive officer) |
EX.99.CERT
Certification Pursuant to Rule 30a-2(a) under the 1940 Act and Section 302 of the
Sarbanes-Oxley Act
I, Kenneth Seifert, certify that:
| 1. | I have reviewed this report on Form N-CSR of Apollo Tactical Income Fund Inc.; |
| 2. | Based on my knowledge, this report does not contain any untrue statement of a material fact or omit to state a material fact necessary to make the statements made, in light of the circumstances under which such statements were made, not misleading with respect to the period covered by this report; |
| 3. | Based on my knowledge, the financial statements, and other financial information included in this report, fairly present in all material respects the financial condition, results of operations, changes in net assets, and cash flows (if the financial statements are required to include a statement of cash flows) of the registrant as of, and for, the periods presented in this report; |
| 4. | The registrant’s other certifying officer(s) and I are responsible for establishing and maintaining disclosure controls and procedures (as defined in Rule 30a-3(c) under the Investment Company Act of 1940) and internal control over financial reporting (as defined in Rule 30a-3(d) under the Investment Company Act of 1940) for the registrant and have: |
| (a) | Designed such disclosure controls and procedures, or caused such disclosure controls and procedures to be designed under our supervision, to ensure that material information relating to the registrant, including its consolidated subsidiaries, is made known to us by others within those entities, particularly during the period in which this report is being prepared; |
| (b) | Designed such internal control over financial reporting, or caused such internal control over financial reporting to be designed under our supervision, to provide reasonable assurance regarding the reliability of financial reporting and the preparation of financial statements for external purposes in accordance with generally accepted accounting principles; |
| (c) | Evaluated the effectiveness of the registrant’s disclosure controls and procedures and presented in this report our conclusions about the effectiveness of the disclosure controls and procedures, as of a date within 90 days prior to the filing date of this report based on such evaluation; and |
| (d) | Disclosed in this report any change in the registrant’s internal control over financial reporting that occurred during the period covered by this report that has materially affected, or is reasonably likely to materially affect, the registrant’s internal control over financial reporting; and |
| 5. | The registrant’s other certifying officer(s) and I have disclosed to the registrant’s auditors and the audit committee of the registrant’s board of directors (or persons performing the equivalent functions): |
| (a) | All significant deficiencies and material weaknesses in the design or operation of internal control over financial reporting which are reasonably likely to adversely affect the registrant’s ability to record, process, summarize, and report financial information; and |
| (b) | Any fraud, whether or not material, that involves management or other employees who have a significant role in the registrant’s internal control over financial reporting. |
| Date: February 21, 2024 |
/s/ Kenneth Seifert | |
| Kenneth Seifert, Treasurer and Chief Financial Officer | ||
| (principal financial officer) |
EX.99.906CERT
Certification Pursuant to Rule 30a-2(b) under the 1940 Act and Section 906 of the
Sarbanes-Oxley Act
I, James Vanek, President of Apollo Tactical Income Fund Inc. (the “Registrant”), certify that:
| 1. | The Form N-CSR of the Registrant (the “Report”) for the period ended December 31, 2023 fully complies with the requirements of Section 13(a) or 15(d), as applicable, of the Securities Exchange Act of 1934, as amended; and |
| 2. | The information contained in the Report fairly presents, in all material respects, the financial condition and results of operations of the Registrant. |
| Date: February 21, 2024 | /s/ James Vanek | |
| James Vanek, President (principal executive officer) |
I, Kenneth Seifert, Treasurer and Chief Financial Officer of Apollo Tactical Income Fund Inc. (the “Registrant”), certify that:
| 1. | The Form N-CSR of the Registrant (the “Report”) for the period ended December 31, 2023 fully complies with the requirements of Section 13(a) or 15(d), as applicable, of the Securities Exchange Act of 1934, as amended; and |
| 2. | The information contained in the Report fairly presents, in all material respects, the financial condition and results of operations of the Registrant. |
| Date: February 21, 2024 | /s/ Kenneth Seifert | |
| Kenneth Seifert, Treasurer and Chief Financial Officer (principal financial officer) |
CONSENT OF INDEPENDENT REGISTERED PUBLIC ACCOUNTING FIRM
We consent to the incorporation by reference in Registration Statement No. 333-262875 on Form N-2 of our report dated February 21, 2024, relating to the consolidated financial statements and consolidated financial highlights of Apollo Tactical Income Fund Inc. and appearing in this Annual Report on Form N-CSR for the year ended December 31, 2023.
| /s/ Deloitte & Touche LLP |
| New York, New York |
| February 27, 2024 |
N-2 - USD ($) |
3 Months Ended | 12 Months Ended | ||||||||||||||||||||||||||||||||||||||||||||||||||||||||||||||||||||||||||||||||||||||||||||||||||||||||||||||||||||||||||||||||||||||||||||||||||||||||||||||||||||||||||||||||||||||||||||||||||||||||||||||||||||||||||||||||||||||||||||||||||||||||||||||||||||||||||||||||||||||||||||||||||||||||||||||||||||||||||||||||||||||||||||||||||||||||||||||||||||||||||||||||||||||||||||||||||||||||||||||||||||||||||||||||||||||||||||||||||||||||||||||||||||||||||||||||||||||||||||||||||||||||||||||||||||||||||||||||||||||||||||||||||||||||||||||||||||||||||||||||||||||||||||||||||||||||||||||||||||||||||||||||||||||||||||||||||||||||||||||||||||||||||||||||||||||||||||||||||||||||||||||||||||||||||||||||||||||||||||||||||||||||||||||||||||||||||||||||||||||||||||||||||||||||||||||||||||||||||||||||||||||||||||||||||||||||||||||||||||||||||||||||||||||||||||||
|---|---|---|---|---|---|---|---|---|---|---|---|---|---|---|---|---|---|---|---|---|---|---|---|---|---|---|---|---|---|---|---|---|---|---|---|---|---|---|---|---|---|---|---|---|---|---|---|---|---|---|---|---|---|---|---|---|---|---|---|---|---|---|---|---|---|---|---|---|---|---|---|---|---|---|---|---|---|---|---|---|---|---|---|---|---|---|---|---|---|---|---|---|---|---|---|---|---|---|---|---|---|---|---|---|---|---|---|---|---|---|---|---|---|---|---|---|---|---|---|---|---|---|---|---|---|---|---|---|---|---|---|---|---|---|---|---|---|---|---|---|---|---|---|---|---|---|---|---|---|---|---|---|---|---|---|---|---|---|---|---|---|---|---|---|---|---|---|---|---|---|---|---|---|---|---|---|---|---|---|---|---|---|---|---|---|---|---|---|---|---|---|---|---|---|---|---|---|---|---|---|---|---|---|---|---|---|---|---|---|---|---|---|---|---|---|---|---|---|---|---|---|---|---|---|---|---|---|---|---|---|---|---|---|---|---|---|---|---|---|---|---|---|---|---|---|---|---|---|---|---|---|---|---|---|---|---|---|---|---|---|---|---|---|---|---|---|---|---|---|---|---|---|---|---|---|---|---|---|---|---|---|---|---|---|---|---|---|---|---|---|---|---|---|---|---|---|---|---|---|---|---|---|---|---|---|---|---|---|---|---|---|---|---|---|---|---|---|---|---|---|---|---|---|---|---|---|---|---|---|---|---|---|---|---|---|---|---|---|---|---|---|---|---|---|---|---|---|---|---|---|---|---|---|---|---|---|---|---|---|---|---|---|---|---|---|---|---|---|---|---|---|---|---|---|---|---|---|---|---|---|---|---|---|---|---|---|---|---|---|---|---|---|---|---|---|---|---|---|---|---|---|---|---|---|---|---|---|---|---|---|---|---|---|---|---|---|---|---|---|---|---|---|---|---|---|---|---|---|---|---|---|---|---|---|---|---|---|---|---|---|---|---|---|---|---|---|---|---|---|---|---|---|---|---|---|---|---|---|---|---|---|---|---|---|---|---|---|---|---|---|---|---|---|---|---|---|---|---|---|---|---|---|---|---|---|---|---|---|---|---|---|---|---|---|---|---|---|---|---|---|---|---|---|---|---|---|---|---|---|---|---|---|---|---|---|---|---|---|---|---|---|---|---|---|---|---|---|---|---|---|---|---|---|---|---|---|---|---|---|---|---|---|---|---|---|---|---|---|---|---|---|---|---|---|---|---|---|---|---|---|---|---|---|---|---|---|---|---|---|---|---|---|---|---|---|---|---|---|---|---|---|---|---|---|---|---|---|---|---|---|---|---|---|---|---|---|---|---|---|---|---|---|---|---|---|---|---|---|---|---|---|---|---|---|---|---|---|---|---|---|---|---|---|---|---|---|---|---|---|---|---|---|---|---|---|---|---|---|---|---|---|---|---|---|---|---|---|---|---|---|---|---|---|---|---|---|---|---|---|---|---|---|---|---|---|---|---|---|---|---|---|---|---|---|---|---|---|---|---|---|---|---|---|---|---|---|---|---|---|---|---|---|---|---|---|---|---|---|---|---|---|---|---|---|---|---|---|---|---|---|---|---|---|---|---|---|---|---|---|---|---|---|---|---|---|---|---|---|---|---|---|---|---|---|---|---|---|---|---|---|---|---|---|---|---|---|---|---|---|---|---|---|---|---|---|---|---|---|---|---|---|---|---|---|---|---|---|---|---|---|---|---|---|---|---|---|---|---|---|---|---|---|---|---|---|---|---|---|---|---|---|---|---|---|---|---|---|---|---|---|---|---|---|---|---|---|---|---|---|---|---|---|---|---|---|---|---|---|---|---|---|---|---|---|---|---|---|---|---|---|---|---|---|---|---|---|---|---|---|---|---|---|---|---|---|---|---|---|---|---|---|---|---|---|---|---|---|---|---|---|---|---|---|---|
Dec. 31, 2023 |
Sep. 30, 2023 |
Jun. 30, 2023 |
Mar. 31, 2023 |
Dec. 31, 2022 |
Sep. 30, 2022 |
Jun. 30, 2022 |
Mar. 31, 2022 |
Dec. 31, 2021 |
Sep. 30, 2021 |
Jun. 30, 2021 |
Mar. 31, 2021 |
Dec. 31, 2020 |
Dec. 31, 2023 |
Dec. 31, 2019 |
Dec. 31, 2018 |
Dec. 31, 2017 |
Dec. 31, 2016 |
Dec. 31, 2015 |
Dec. 31, 2014 |
Dec. 31, 2013 |
||||||||||||||||||||||||||||||||||||||||||||||||||||||||||||||||||||||||||||||||||||||||||||||||||||||||||||||||||||||||||||||||||||||||||||||||||||||||||||||||||||||||||||||||||||||||||||||||||||||||||||||||||||||||||||||||||||||||||||||||||||||||||||||||||||||||||||||||||||||||||||||||||||||||||||||||||||||||||||||||||||||||||||||||||||||||||||||||||||||||||||||||||||||||||||||||||||||||||||||||||||||||||||||||||||||||||||||||||||||||||||||||||||||||||||||||||||||||||||||||||||||||||||||||||||||||||||||||||||||||||||||||||||||||||||||||||||||||||||||||||||||||||||||||||||||||||||||||||||||||||||||||||||||||||||||||||||||||||||||||||||||||||||||||||||||||||||||||||||||||||||||||||||||||||||||||||||||||||||||||||||||||||||||||||||||||||||||||||||||||||||||||||||||||||||||||||||||||||||||||||||||||||||||||||||||||||||||||||||||||||||
| Cover [Abstract] | ||||||||||||||||||||||||||||||||||||||||||||||||||||||||||||||||||||||||||||||||||||||||||||||||||||||||||||||||||||||||||||||||||||||||||||||||||||||||||||||||||||||||||||||||||||||||||||||||||||||||||||||||||||||||||||||||||||||||||||||||||||||||||||||||||||||||||||||||||||||||||||||||||||||||||||||||||||||||||||||||||||||||||||||||||||||||||||||||||||||||||||||||||||||||||||||||||||||||||||||||||||||||||||||||||||||||||||||||||||||||||||||||||||||||||||||||||||||||||||||||||||||||||||||||||||||||||||||||||||||||||||||||||||||||||||||||||||||||||||||||||||||||||||||||||||||||||||||||||||||||||||||||||||||||||||||||||||||||||||||||||||||||||||||||||||||||||||||||||||||||||||||||||||||||||||||||||||||||||||||||||||||||||||||||||||||||||||||||||||||||||||||||||||||||||||||||||||||||||||||||||||||||||||||||||||||||||||||||||||||||||||||||||||||||||||||||
| Entity Central Index Key | 0001526697 | |||||||||||||||||||||||||||||||||||||||||||||||||||||||||||||||||||||||||||||||||||||||||||||||||||||||||||||||||||||||||||||||||||||||||||||||||||||||||||||||||||||||||||||||||||||||||||||||||||||||||||||||||||||||||||||||||||||||||||||||||||||||||||||||||||||||||||||||||||||||||||||||||||||||||||||||||||||||||||||||||||||||||||||||||||||||||||||||||||||||||||||||||||||||||||||||||||||||||||||||||||||||||||||||||||||||||||||||||||||||||||||||||||||||||||||||||||||||||||||||||||||||||||||||||||||||||||||||||||||||||||||||||||||||||||||||||||||||||||||||||||||||||||||||||||||||||||||||||||||||||||||||||||||||||||||||||||||||||||||||||||||||||||||||||||||||||||||||||||||||||||||||||||||||||||||||||||||||||||||||||||||||||||||||||||||||||||||||||||||||||||||||||||||||||||||||||||||||||||||||||||||||||||||||||||||||||||||||||||||||||||||||||||||||||||||||
| Amendment Flag | false | |||||||||||||||||||||||||||||||||||||||||||||||||||||||||||||||||||||||||||||||||||||||||||||||||||||||||||||||||||||||||||||||||||||||||||||||||||||||||||||||||||||||||||||||||||||||||||||||||||||||||||||||||||||||||||||||||||||||||||||||||||||||||||||||||||||||||||||||||||||||||||||||||||||||||||||||||||||||||||||||||||||||||||||||||||||||||||||||||||||||||||||||||||||||||||||||||||||||||||||||||||||||||||||||||||||||||||||||||||||||||||||||||||||||||||||||||||||||||||||||||||||||||||||||||||||||||||||||||||||||||||||||||||||||||||||||||||||||||||||||||||||||||||||||||||||||||||||||||||||||||||||||||||||||||||||||||||||||||||||||||||||||||||||||||||||||||||||||||||||||||||||||||||||||||||||||||||||||||||||||||||||||||||||||||||||||||||||||||||||||||||||||||||||||||||||||||||||||||||||||||||||||||||||||||||||||||||||||||||||||||||||||||||||||||||||||
| Document Type | N-CSR | |||||||||||||||||||||||||||||||||||||||||||||||||||||||||||||||||||||||||||||||||||||||||||||||||||||||||||||||||||||||||||||||||||||||||||||||||||||||||||||||||||||||||||||||||||||||||||||||||||||||||||||||||||||||||||||||||||||||||||||||||||||||||||||||||||||||||||||||||||||||||||||||||||||||||||||||||||||||||||||||||||||||||||||||||||||||||||||||||||||||||||||||||||||||||||||||||||||||||||||||||||||||||||||||||||||||||||||||||||||||||||||||||||||||||||||||||||||||||||||||||||||||||||||||||||||||||||||||||||||||||||||||||||||||||||||||||||||||||||||||||||||||||||||||||||||||||||||||||||||||||||||||||||||||||||||||||||||||||||||||||||||||||||||||||||||||||||||||||||||||||||||||||||||||||||||||||||||||||||||||||||||||||||||||||||||||||||||||||||||||||||||||||||||||||||||||||||||||||||||||||||||||||||||||||||||||||||||||||||||||||||||||||||||||||||||||
| Entity Registrant Name | Apollo Tactical Income Fund Inc. | |||||||||||||||||||||||||||||||||||||||||||||||||||||||||||||||||||||||||||||||||||||||||||||||||||||||||||||||||||||||||||||||||||||||||||||||||||||||||||||||||||||||||||||||||||||||||||||||||||||||||||||||||||||||||||||||||||||||||||||||||||||||||||||||||||||||||||||||||||||||||||||||||||||||||||||||||||||||||||||||||||||||||||||||||||||||||||||||||||||||||||||||||||||||||||||||||||||||||||||||||||||||||||||||||||||||||||||||||||||||||||||||||||||||||||||||||||||||||||||||||||||||||||||||||||||||||||||||||||||||||||||||||||||||||||||||||||||||||||||||||||||||||||||||||||||||||||||||||||||||||||||||||||||||||||||||||||||||||||||||||||||||||||||||||||||||||||||||||||||||||||||||||||||||||||||||||||||||||||||||||||||||||||||||||||||||||||||||||||||||||||||||||||||||||||||||||||||||||||||||||||||||||||||||||||||||||||||||||||||||||||||||||||||||||||||||
| Fee Table [Abstract] | ||||||||||||||||||||||||||||||||||||||||||||||||||||||||||||||||||||||||||||||||||||||||||||||||||||||||||||||||||||||||||||||||||||||||||||||||||||||||||||||||||||||||||||||||||||||||||||||||||||||||||||||||||||||||||||||||||||||||||||||||||||||||||||||||||||||||||||||||||||||||||||||||||||||||||||||||||||||||||||||||||||||||||||||||||||||||||||||||||||||||||||||||||||||||||||||||||||||||||||||||||||||||||||||||||||||||||||||||||||||||||||||||||||||||||||||||||||||||||||||||||||||||||||||||||||||||||||||||||||||||||||||||||||||||||||||||||||||||||||||||||||||||||||||||||||||||||||||||||||||||||||||||||||||||||||||||||||||||||||||||||||||||||||||||||||||||||||||||||||||||||||||||||||||||||||||||||||||||||||||||||||||||||||||||||||||||||||||||||||||||||||||||||||||||||||||||||||||||||||||||||||||||||||||||||||||||||||||||||||||||||||||||||||||||||||||||
| Shareholder Transaction Expenses [Table Text Block] |
|
|||||||||||||||||||||||||||||||||||||||||||||||||||||||||||||||||||||||||||||||||||||||||||||||||||||||||||||||||||||||||||||||||||||||||||||||||||||||||||||||||||||||||||||||||||||||||||||||||||||||||||||||||||||||||||||||||||||||||||||||||||||||||||||||||||||||||||||||||||||||||||||||||||||||||||||||||||||||||||||||||||||||||||||||||||||||||||||||||||||||||||||||||||||||||||||||||||||||||||||||||||||||||||||||||||||||||||||||||||||||||||||||||||||||||||||||||||||||||||||||||||||||||||||||||||||||||||||||||||||||||||||||||||||||||||||||||||||||||||||||||||||||||||||||||||||||||||||||||||||||||||||||||||||||||||||||||||||||||||||||||||||||||||||||||||||||||||||||||||||||||||||||||||||||||||||||||||||||||||||||||||||||||||||||||||||||||||||||||||||||||||||||||||||||||||||||||||||||||||||||||||||||||||||||||||||||||||||||||||||||||||||||||||||||||||||||
| Sales Load [Percent] | [1] | 1.00% | ||||||||||||||||||||||||||||||||||||||||||||||||||||||||||||||||||||||||||||||||||||||||||||||||||||||||||||||||||||||||||||||||||||||||||||||||||||||||||||||||||||||||||||||||||||||||||||||||||||||||||||||||||||||||||||||||||||||||||||||||||||||||||||||||||||||||||||||||||||||||||||||||||||||||||||||||||||||||||||||||||||||||||||||||||||||||||||||||||||||||||||||||||||||||||||||||||||||||||||||||||||||||||||||||||||||||||||||||||||||||||||||||||||||||||||||||||||||||||||||||||||||||||||||||||||||||||||||||||||||||||||||||||||||||||||||||||||||||||||||||||||||||||||||||||||||||||||||||||||||||||||||||||||||||||||||||||||||||||||||||||||||||||||||||||||||||||||||||||||||||||||||||||||||||||||||||||||||||||||||||||||||||||||||||||||||||||||||||||||||||||||||||||||||||||||||||||||||||||||||||||||||||||||||||||||||||||||||||||||||||||||||||||||||||||||||
| Dividend Reinvestment and Cash Purchase Fees | [2] | $ 0 | ||||||||||||||||||||||||||||||||||||||||||||||||||||||||||||||||||||||||||||||||||||||||||||||||||||||||||||||||||||||||||||||||||||||||||||||||||||||||||||||||||||||||||||||||||||||||||||||||||||||||||||||||||||||||||||||||||||||||||||||||||||||||||||||||||||||||||||||||||||||||||||||||||||||||||||||||||||||||||||||||||||||||||||||||||||||||||||||||||||||||||||||||||||||||||||||||||||||||||||||||||||||||||||||||||||||||||||||||||||||||||||||||||||||||||||||||||||||||||||||||||||||||||||||||||||||||||||||||||||||||||||||||||||||||||||||||||||||||||||||||||||||||||||||||||||||||||||||||||||||||||||||||||||||||||||||||||||||||||||||||||||||||||||||||||||||||||||||||||||||||||||||||||||||||||||||||||||||||||||||||||||||||||||||||||||||||||||||||||||||||||||||||||||||||||||||||||||||||||||||||||||||||||||||||||||||||||||||||||||||||||||||||||||||||||||||
| Other Transaction Expenses [Abstract] | ||||||||||||||||||||||||||||||||||||||||||||||||||||||||||||||||||||||||||||||||||||||||||||||||||||||||||||||||||||||||||||||||||||||||||||||||||||||||||||||||||||||||||||||||||||||||||||||||||||||||||||||||||||||||||||||||||||||||||||||||||||||||||||||||||||||||||||||||||||||||||||||||||||||||||||||||||||||||||||||||||||||||||||||||||||||||||||||||||||||||||||||||||||||||||||||||||||||||||||||||||||||||||||||||||||||||||||||||||||||||||||||||||||||||||||||||||||||||||||||||||||||||||||||||||||||||||||||||||||||||||||||||||||||||||||||||||||||||||||||||||||||||||||||||||||||||||||||||||||||||||||||||||||||||||||||||||||||||||||||||||||||||||||||||||||||||||||||||||||||||||||||||||||||||||||||||||||||||||||||||||||||||||||||||||||||||||||||||||||||||||||||||||||||||||||||||||||||||||||||||||||||||||||||||||||||||||||||||||||||||||||||||||||||||||||||||
| Other Transaction Expenses [Percent] | [1] | 0.57% | ||||||||||||||||||||||||||||||||||||||||||||||||||||||||||||||||||||||||||||||||||||||||||||||||||||||||||||||||||||||||||||||||||||||||||||||||||||||||||||||||||||||||||||||||||||||||||||||||||||||||||||||||||||||||||||||||||||||||||||||||||||||||||||||||||||||||||||||||||||||||||||||||||||||||||||||||||||||||||||||||||||||||||||||||||||||||||||||||||||||||||||||||||||||||||||||||||||||||||||||||||||||||||||||||||||||||||||||||||||||||||||||||||||||||||||||||||||||||||||||||||||||||||||||||||||||||||||||||||||||||||||||||||||||||||||||||||||||||||||||||||||||||||||||||||||||||||||||||||||||||||||||||||||||||||||||||||||||||||||||||||||||||||||||||||||||||||||||||||||||||||||||||||||||||||||||||||||||||||||||||||||||||||||||||||||||||||||||||||||||||||||||||||||||||||||||||||||||||||||||||||||||||||||||||||||||||||||||||||||||||||||||||||||||||||||||
| Annual Expenses [Table Text Block] |
|
|||||||||||||||||||||||||||||||||||||||||||||||||||||||||||||||||||||||||||||||||||||||||||||||||||||||||||||||||||||||||||||||||||||||||||||||||||||||||||||||||||||||||||||||||||||||||||||||||||||||||||||||||||||||||||||||||||||||||||||||||||||||||||||||||||||||||||||||||||||||||||||||||||||||||||||||||||||||||||||||||||||||||||||||||||||||||||||||||||||||||||||||||||||||||||||||||||||||||||||||||||||||||||||||||||||||||||||||||||||||||||||||||||||||||||||||||||||||||||||||||||||||||||||||||||||||||||||||||||||||||||||||||||||||||||||||||||||||||||||||||||||||||||||||||||||||||||||||||||||||||||||||||||||||||||||||||||||||||||||||||||||||||||||||||||||||||||||||||||||||||||||||||||||||||||||||||||||||||||||||||||||||||||||||||||||||||||||||||||||||||||||||||||||||||||||||||||||||||||||||||||||||||||||||||||||||||||||||||||||||||||||||||||||||||||||||
| Management Fees [Percent] | [3],[4] | 1.53% | ||||||||||||||||||||||||||||||||||||||||||||||||||||||||||||||||||||||||||||||||||||||||||||||||||||||||||||||||||||||||||||||||||||||||||||||||||||||||||||||||||||||||||||||||||||||||||||||||||||||||||||||||||||||||||||||||||||||||||||||||||||||||||||||||||||||||||||||||||||||||||||||||||||||||||||||||||||||||||||||||||||||||||||||||||||||||||||||||||||||||||||||||||||||||||||||||||||||||||||||||||||||||||||||||||||||||||||||||||||||||||||||||||||||||||||||||||||||||||||||||||||||||||||||||||||||||||||||||||||||||||||||||||||||||||||||||||||||||||||||||||||||||||||||||||||||||||||||||||||||||||||||||||||||||||||||||||||||||||||||||||||||||||||||||||||||||||||||||||||||||||||||||||||||||||||||||||||||||||||||||||||||||||||||||||||||||||||||||||||||||||||||||||||||||||||||||||||||||||||||||||||||||||||||||||||||||||||||||||||||||||||||||||||||||||||||
| Interest Expenses on Borrowings [Percent] | [3],[5] | 3.02% | ||||||||||||||||||||||||||||||||||||||||||||||||||||||||||||||||||||||||||||||||||||||||||||||||||||||||||||||||||||||||||||||||||||||||||||||||||||||||||||||||||||||||||||||||||||||||||||||||||||||||||||||||||||||||||||||||||||||||||||||||||||||||||||||||||||||||||||||||||||||||||||||||||||||||||||||||||||||||||||||||||||||||||||||||||||||||||||||||||||||||||||||||||||||||||||||||||||||||||||||||||||||||||||||||||||||||||||||||||||||||||||||||||||||||||||||||||||||||||||||||||||||||||||||||||||||||||||||||||||||||||||||||||||||||||||||||||||||||||||||||||||||||||||||||||||||||||||||||||||||||||||||||||||||||||||||||||||||||||||||||||||||||||||||||||||||||||||||||||||||||||||||||||||||||||||||||||||||||||||||||||||||||||||||||||||||||||||||||||||||||||||||||||||||||||||||||||||||||||||||||||||||||||||||||||||||||||||||||||||||||||||||||||||||||||||||
| Other Annual Expenses [Abstract] | ||||||||||||||||||||||||||||||||||||||||||||||||||||||||||||||||||||||||||||||||||||||||||||||||||||||||||||||||||||||||||||||||||||||||||||||||||||||||||||||||||||||||||||||||||||||||||||||||||||||||||||||||||||||||||||||||||||||||||||||||||||||||||||||||||||||||||||||||||||||||||||||||||||||||||||||||||||||||||||||||||||||||||||||||||||||||||||||||||||||||||||||||||||||||||||||||||||||||||||||||||||||||||||||||||||||||||||||||||||||||||||||||||||||||||||||||||||||||||||||||||||||||||||||||||||||||||||||||||||||||||||||||||||||||||||||||||||||||||||||||||||||||||||||||||||||||||||||||||||||||||||||||||||||||||||||||||||||||||||||||||||||||||||||||||||||||||||||||||||||||||||||||||||||||||||||||||||||||||||||||||||||||||||||||||||||||||||||||||||||||||||||||||||||||||||||||||||||||||||||||||||||||||||||||||||||||||||||||||||||||||||||||||||||||||||||||
| Other Annual Expenses [Percent] | [3],[6] | 1.00% | ||||||||||||||||||||||||||||||||||||||||||||||||||||||||||||||||||||||||||||||||||||||||||||||||||||||||||||||||||||||||||||||||||||||||||||||||||||||||||||||||||||||||||||||||||||||||||||||||||||||||||||||||||||||||||||||||||||||||||||||||||||||||||||||||||||||||||||||||||||||||||||||||||||||||||||||||||||||||||||||||||||||||||||||||||||||||||||||||||||||||||||||||||||||||||||||||||||||||||||||||||||||||||||||||||||||||||||||||||||||||||||||||||||||||||||||||||||||||||||||||||||||||||||||||||||||||||||||||||||||||||||||||||||||||||||||||||||||||||||||||||||||||||||||||||||||||||||||||||||||||||||||||||||||||||||||||||||||||||||||||||||||||||||||||||||||||||||||||||||||||||||||||||||||||||||||||||||||||||||||||||||||||||||||||||||||||||||||||||||||||||||||||||||||||||||||||||||||||||||||||||||||||||||||||||||||||||||||||||||||||||||||||||||||||||||||
| Total Annual Expenses [Percent] | [3] | 5.55% | ||||||||||||||||||||||||||||||||||||||||||||||||||||||||||||||||||||||||||||||||||||||||||||||||||||||||||||||||||||||||||||||||||||||||||||||||||||||||||||||||||||||||||||||||||||||||||||||||||||||||||||||||||||||||||||||||||||||||||||||||||||||||||||||||||||||||||||||||||||||||||||||||||||||||||||||||||||||||||||||||||||||||||||||||||||||||||||||||||||||||||||||||||||||||||||||||||||||||||||||||||||||||||||||||||||||||||||||||||||||||||||||||||||||||||||||||||||||||||||||||||||||||||||||||||||||||||||||||||||||||||||||||||||||||||||||||||||||||||||||||||||||||||||||||||||||||||||||||||||||||||||||||||||||||||||||||||||||||||||||||||||||||||||||||||||||||||||||||||||||||||||||||||||||||||||||||||||||||||||||||||||||||||||||||||||||||||||||||||||||||||||||||||||||||||||||||||||||||||||||||||||||||||||||||||||||||||||||||||||||||||||||||||||||||||||||
| Expense Example [Table Text Block] | Example The following example illustrates the hypothetical expenses (including the sales load of $10.00, estimated offering expenses of this offering of $5.65 and the estimated costs of borrowings with the Fund utilizing leverage representing 33% of the Fund’s Managed Assets) that you would pay on a $1,000 investment in Common Shares, assuming (1) total net annual expenses of 5.55% of net assets attributable to Common Shares and (2) a 5% annual return:
|
|||||||||||||||||||||||||||||||||||||||||||||||||||||||||||||||||||||||||||||||||||||||||||||||||||||||||||||||||||||||||||||||||||||||||||||||||||||||||||||||||||||||||||||||||||||||||||||||||||||||||||||||||||||||||||||||||||||||||||||||||||||||||||||||||||||||||||||||||||||||||||||||||||||||||||||||||||||||||||||||||||||||||||||||||||||||||||||||||||||||||||||||||||||||||||||||||||||||||||||||||||||||||||||||||||||||||||||||||||||||||||||||||||||||||||||||||||||||||||||||||||||||||||||||||||||||||||||||||||||||||||||||||||||||||||||||||||||||||||||||||||||||||||||||||||||||||||||||||||||||||||||||||||||||||||||||||||||||||||||||||||||||||||||||||||||||||||||||||||||||||||||||||||||||||||||||||||||||||||||||||||||||||||||||||||||||||||||||||||||||||||||||||||||||||||||||||||||||||||||||||||||||||||||||||||||||||||||||||||||||||||||||||||||||||||||||
| Expense Example, Year 01 | $ 65 | |||||||||||||||||||||||||||||||||||||||||||||||||||||||||||||||||||||||||||||||||||||||||||||||||||||||||||||||||||||||||||||||||||||||||||||||||||||||||||||||||||||||||||||||||||||||||||||||||||||||||||||||||||||||||||||||||||||||||||||||||||||||||||||||||||||||||||||||||||||||||||||||||||||||||||||||||||||||||||||||||||||||||||||||||||||||||||||||||||||||||||||||||||||||||||||||||||||||||||||||||||||||||||||||||||||||||||||||||||||||||||||||||||||||||||||||||||||||||||||||||||||||||||||||||||||||||||||||||||||||||||||||||||||||||||||||||||||||||||||||||||||||||||||||||||||||||||||||||||||||||||||||||||||||||||||||||||||||||||||||||||||||||||||||||||||||||||||||||||||||||||||||||||||||||||||||||||||||||||||||||||||||||||||||||||||||||||||||||||||||||||||||||||||||||||||||||||||||||||||||||||||||||||||||||||||||||||||||||||||||||||||||||||||||||||||||
| Expense Example, Years 1 to 3 | 174 | |||||||||||||||||||||||||||||||||||||||||||||||||||||||||||||||||||||||||||||||||||||||||||||||||||||||||||||||||||||||||||||||||||||||||||||||||||||||||||||||||||||||||||||||||||||||||||||||||||||||||||||||||||||||||||||||||||||||||||||||||||||||||||||||||||||||||||||||||||||||||||||||||||||||||||||||||||||||||||||||||||||||||||||||||||||||||||||||||||||||||||||||||||||||||||||||||||||||||||||||||||||||||||||||||||||||||||||||||||||||||||||||||||||||||||||||||||||||||||||||||||||||||||||||||||||||||||||||||||||||||||||||||||||||||||||||||||||||||||||||||||||||||||||||||||||||||||||||||||||||||||||||||||||||||||||||||||||||||||||||||||||||||||||||||||||||||||||||||||||||||||||||||||||||||||||||||||||||||||||||||||||||||||||||||||||||||||||||||||||||||||||||||||||||||||||||||||||||||||||||||||||||||||||||||||||||||||||||||||||||||||||||||||||||||||||||
| Expense Example, Years 1 to 5 | 281 | |||||||||||||||||||||||||||||||||||||||||||||||||||||||||||||||||||||||||||||||||||||||||||||||||||||||||||||||||||||||||||||||||||||||||||||||||||||||||||||||||||||||||||||||||||||||||||||||||||||||||||||||||||||||||||||||||||||||||||||||||||||||||||||||||||||||||||||||||||||||||||||||||||||||||||||||||||||||||||||||||||||||||||||||||||||||||||||||||||||||||||||||||||||||||||||||||||||||||||||||||||||||||||||||||||||||||||||||||||||||||||||||||||||||||||||||||||||||||||||||||||||||||||||||||||||||||||||||||||||||||||||||||||||||||||||||||||||||||||||||||||||||||||||||||||||||||||||||||||||||||||||||||||||||||||||||||||||||||||||||||||||||||||||||||||||||||||||||||||||||||||||||||||||||||||||||||||||||||||||||||||||||||||||||||||||||||||||||||||||||||||||||||||||||||||||||||||||||||||||||||||||||||||||||||||||||||||||||||||||||||||||||||||||||||||||||
| Expense Example, Years 1 to 10 | $ 545 | |||||||||||||||||||||||||||||||||||||||||||||||||||||||||||||||||||||||||||||||||||||||||||||||||||||||||||||||||||||||||||||||||||||||||||||||||||||||||||||||||||||||||||||||||||||||||||||||||||||||||||||||||||||||||||||||||||||||||||||||||||||||||||||||||||||||||||||||||||||||||||||||||||||||||||||||||||||||||||||||||||||||||||||||||||||||||||||||||||||||||||||||||||||||||||||||||||||||||||||||||||||||||||||||||||||||||||||||||||||||||||||||||||||||||||||||||||||||||||||||||||||||||||||||||||||||||||||||||||||||||||||||||||||||||||||||||||||||||||||||||||||||||||||||||||||||||||||||||||||||||||||||||||||||||||||||||||||||||||||||||||||||||||||||||||||||||||||||||||||||||||||||||||||||||||||||||||||||||||||||||||||||||||||||||||||||||||||||||||||||||||||||||||||||||||||||||||||||||||||||||||||||||||||||||||||||||||||||||||||||||||||||||||||||||||||||
| Purpose of Fee Table , Note [Text Block] | The purpose of the following table and example below is to help you understand the fees and expenses that you, as a holder of Common Shares,
w ould bear directly or indirectly, as a result of an offering. The table reflects the use of leverage in the form of borrowings in an amount equal to 33% of each Fund’s Managed Assets (after the leverage is incurred) and shows each Fund’s expenses as a percentage of net assets attributable to Common Shares. Each Fund’s actual expenses may vary from the estimated expenses shown in the table. The extent of each Fund’s assets attributable to leverage following an offering, and each Fund’s associated expenses, are likely to vary (perhaps significantly) from these assumptions. |
|||||||||||||||||||||||||||||||||||||||||||||||||||||||||||||||||||||||||||||||||||||||||||||||||||||||||||||||||||||||||||||||||||||||||||||||||||||||||||||||||||||||||||||||||||||||||||||||||||||||||||||||||||||||||||||||||||||||||||||||||||||||||||||||||||||||||||||||||||||||||||||||||||||||||||||||||||||||||||||||||||||||||||||||||||||||||||||||||||||||||||||||||||||||||||||||||||||||||||||||||||||||||||||||||||||||||||||||||||||||||||||||||||||||||||||||||||||||||||||||||||||||||||||||||||||||||||||||||||||||||||||||||||||||||||||||||||||||||||||||||||||||||||||||||||||||||||||||||||||||||||||||||||||||||||||||||||||||||||||||||||||||||||||||||||||||||||||||||||||||||||||||||||||||||||||||||||||||||||||||||||||||||||||||||||||||||||||||||||||||||||||||||||||||||||||||||||||||||||||||||||||||||||||||||||||||||||||||||||||||||||||||||||||||||||||||
| Basis of Transaction Fees, Note [Text Block] | as a percentage of offering price | |||||||||||||||||||||||||||||||||||||||||||||||||||||||||||||||||||||||||||||||||||||||||||||||||||||||||||||||||||||||||||||||||||||||||||||||||||||||||||||||||||||||||||||||||||||||||||||||||||||||||||||||||||||||||||||||||||||||||||||||||||||||||||||||||||||||||||||||||||||||||||||||||||||||||||||||||||||||||||||||||||||||||||||||||||||||||||||||||||||||||||||||||||||||||||||||||||||||||||||||||||||||||||||||||||||||||||||||||||||||||||||||||||||||||||||||||||||||||||||||||||||||||||||||||||||||||||||||||||||||||||||||||||||||||||||||||||||||||||||||||||||||||||||||||||||||||||||||||||||||||||||||||||||||||||||||||||||||||||||||||||||||||||||||||||||||||||||||||||||||||||||||||||||||||||||||||||||||||||||||||||||||||||||||||||||||||||||||||||||||||||||||||||||||||||||||||||||||||||||||||||||||||||||||||||||||||||||||||||||||||||||||||||||||||||||||
| Other Expenses, Note [Text Block] | “Other expenses” are based upon estimated amounts for the current fiscal year. Other expenses include amortized offering costs. | |||||||||||||||||||||||||||||||||||||||||||||||||||||||||||||||||||||||||||||||||||||||||||||||||||||||||||||||||||||||||||||||||||||||||||||||||||||||||||||||||||||||||||||||||||||||||||||||||||||||||||||||||||||||||||||||||||||||||||||||||||||||||||||||||||||||||||||||||||||||||||||||||||||||||||||||||||||||||||||||||||||||||||||||||||||||||||||||||||||||||||||||||||||||||||||||||||||||||||||||||||||||||||||||||||||||||||||||||||||||||||||||||||||||||||||||||||||||||||||||||||||||||||||||||||||||||||||||||||||||||||||||||||||||||||||||||||||||||||||||||||||||||||||||||||||||||||||||||||||||||||||||||||||||||||||||||||||||||||||||||||||||||||||||||||||||||||||||||||||||||||||||||||||||||||||||||||||||||||||||||||||||||||||||||||||||||||||||||||||||||||||||||||||||||||||||||||||||||||||||||||||||||||||||||||||||||||||||||||||||||||||||||||||||||||||||
| Management Fee not based on Net Assets, Note [Text Block] | The Adviser receives a monthly management fee for its advisory services equal to an effective annual rate of 1.0% of the average daily value of each Fund’s Managed Assets assuming that the amount of leverage of 33% of each Fund’s Managed Assets is used. The amount of leverage used by a Fund may change over time. Each Fund’s historical use of leverage for the past 10 fiscal periods in shown in the table titled “Senior Securities” below. | |||||||||||||||||||||||||||||||||||||||||||||||||||||||||||||||||||||||||||||||||||||||||||||||||||||||||||||||||||||||||||||||||||||||||||||||||||||||||||||||||||||||||||||||||||||||||||||||||||||||||||||||||||||||||||||||||||||||||||||||||||||||||||||||||||||||||||||||||||||||||||||||||||||||||||||||||||||||||||||||||||||||||||||||||||||||||||||||||||||||||||||||||||||||||||||||||||||||||||||||||||||||||||||||||||||||||||||||||||||||||||||||||||||||||||||||||||||||||||||||||||||||||||||||||||||||||||||||||||||||||||||||||||||||||||||||||||||||||||||||||||||||||||||||||||||||||||||||||||||||||||||||||||||||||||||||||||||||||||||||||||||||||||||||||||||||||||||||||||||||||||||||||||||||||||||||||||||||||||||||||||||||||||||||||||||||||||||||||||||||||||||||||||||||||||||||||||||||||||||||||||||||||||||||||||||||||||||||||||||||||||||||||||||||||||||||
| Financial Highlights [Abstract] | ||||||||||||||||||||||||||||||||||||||||||||||||||||||||||||||||||||||||||||||||||||||||||||||||||||||||||||||||||||||||||||||||||||||||||||||||||||||||||||||||||||||||||||||||||||||||||||||||||||||||||||||||||||||||||||||||||||||||||||||||||||||||||||||||||||||||||||||||||||||||||||||||||||||||||||||||||||||||||||||||||||||||||||||||||||||||||||||||||||||||||||||||||||||||||||||||||||||||||||||||||||||||||||||||||||||||||||||||||||||||||||||||||||||||||||||||||||||||||||||||||||||||||||||||||||||||||||||||||||||||||||||||||||||||||||||||||||||||||||||||||||||||||||||||||||||||||||||||||||||||||||||||||||||||||||||||||||||||||||||||||||||||||||||||||||||||||||||||||||||||||||||||||||||||||||||||||||||||||||||||||||||||||||||||||||||||||||||||||||||||||||||||||||||||||||||||||||||||||||||||||||||||||||||||||||||||||||||||||||||||||||||||||||||||||||||||
| Senior Securities [Table Text Block] | Senior Securities The following tables set forth information regarding each Fund’s outstanding senior securities as of the end of the last ten fiscal periods, as applicable. Each Fund’s senior securities during this time period are comprised of borrowings that constitute “senior securities” as defined in the Investment Company Act. The information in this table for the fiscal years ended 2023, 2022, 2021, 2020 and 2019 has been audited by Deloitte & Touche LLP, an independent registered public accounting firm.
|
|||||||||||||||||||||||||||||||||||||||||||||||||||||||||||||||||||||||||||||||||||||||||||||||||||||||||||||||||||||||||||||||||||||||||||||||||||||||||||||||||||||||||||||||||||||||||||||||||||||||||||||||||||||||||||||||||||||||||||||||||||||||||||||||||||||||||||||||||||||||||||||||||||||||||||||||||||||||||||||||||||||||||||||||||||||||||||||||||||||||||||||||||||||||||||||||||||||||||||||||||||||||||||||||||||||||||||||||||||||||||||||||||||||||||||||||||||||||||||||||||||||||||||||||||||||||||||||||||||||||||||||||||||||||||||||||||||||||||||||||||||||||||||||||||||||||||||||||||||||||||||||||||||||||||||||||||||||||||||||||||||||||||||||||||||||||||||||||||||||||||||||||||||||||||||||||||||||||||||||||||||||||||||||||||||||||||||||||||||||||||||||||||||||||||||||||||||||||||||||||||||||||||||||||||||||||||||||||||||||||||||||||||||||||||||||||
| Senior Securities Amount | $ 121,000,000 | $ 121,000,000 | $ 121,000,000 | $ 110,000,000 | $ 121,000,000 | $ 126,500,000 | $ 126,500,000 | $ 138,000,000 | $ 138,000,000 | $ 138,000,000 | $ 138,000,000 | $ 138,000,000 | ||||||||||||||||||||||||||||||||||||||||||||||||||||||||||||||||||||||||||||||||||||||||||||||||||||||||||||||||||||||||||||||||||||||||||||||||||||||||||||||||||||||||||||||||||||||||||||||||||||||||||||||||||||||||||||||||||||||||||||||||||||||||||||||||||||||||||||||||||||||||||||||||||||||||||||||||||||||||||||||||||||||||||||||||||||||||||||||||||||||||||||||||||||||||||||||||||||||||||||||||||||||||||||||||||||||||||||||||||||||||||||||||||||||||||||||||||||||||||||||||||||||||||||||||||||||||||||||||||||||||||||||||||||||||||||||||||||||||||||||||||||||||||||||||||||||||||||||||||||||||||||||||||||||||||||||||||||||||||||||||||||||||||||||||||||||||||||||||||||||||||||||||||||||||||||||||||||||||||||||||||||||||||||||||||||||||||||||||||||||||||||||||||||||||||||||||||||||||||||||||||||||||||||||||||||||||||||||||||||||||||||||||||||
| Senior Securities Coverage per Unit | [7] | $ 2,765 | $ 2,656 | $ 2,977 | $ 3,139 | $ 2,765 | $ 2,927 | $ 2,837 | $ 2,828 | $ 2,800 | $ 2,674 | $ 2,909 | $ 3,045 | |||||||||||||||||||||||||||||||||||||||||||||||||||||||||||||||||||||||||||||||||||||||||||||||||||||||||||||||||||||||||||||||||||||||||||||||||||||||||||||||||||||||||||||||||||||||||||||||||||||||||||||||||||||||||||||||||||||||||||||||||||||||||||||||||||||||||||||||||||||||||||||||||||||||||||||||||||||||||||||||||||||||||||||||||||||||||||||||||||||||||||||||||||||||||||||||||||||||||||||||||||||||||||||||||||||||||||||||||||||||||||||||||||||||||||||||||||||||||||||||||||||||||||||||||||||||||||||||||||||||||||||||||||||||||||||||||||||||||||||||||||||||||||||||||||||||||||||||||||||||||||||||||||||||||||||||||||||||||||||||||||||||||||||||||||||||||||||||||||||||||||||||||||||||||||||||||||||||||||||||||||||||||||||||||||||||||||||||||||||||||||||||||||||||||||||||||||||||||||||||||||||||||||||||||||||||||||||||||||||||||||||||||||
| General Description of Registrant [Abstract] | ||||||||||||||||||||||||||||||||||||||||||||||||||||||||||||||||||||||||||||||||||||||||||||||||||||||||||||||||||||||||||||||||||||||||||||||||||||||||||||||||||||||||||||||||||||||||||||||||||||||||||||||||||||||||||||||||||||||||||||||||||||||||||||||||||||||||||||||||||||||||||||||||||||||||||||||||||||||||||||||||||||||||||||||||||||||||||||||||||||||||||||||||||||||||||||||||||||||||||||||||||||||||||||||||||||||||||||||||||||||||||||||||||||||||||||||||||||||||||||||||||||||||||||||||||||||||||||||||||||||||||||||||||||||||||||||||||||||||||||||||||||||||||||||||||||||||||||||||||||||||||||||||||||||||||||||||||||||||||||||||||||||||||||||||||||||||||||||||||||||||||||||||||||||||||||||||||||||||||||||||||||||||||||||||||||||||||||||||||||||||||||||||||||||||||||||||||||||||||||||||||||||||||||||||||||||||||||||||||||||||||||||||||||||||||||||||
| Investment Objectives and Practices [Text Block] | AIF — Investment Objective and Policies: AIF’s primary investment objective is to seek current income with a secondary objective of preservation of capital. AIF seeks to achieve its investment objectives primarily by allocating its assets among different types of credit instruments based on absolute and relative value considerations and its analysis of the credit markets. This ability to dynamically allocate AIF’s assets may result in AIF’s portfolio becoming concentrated in a particular type of credit instrument (such as Senior Loans or high yield corporate bonds) and substantially less invested in other types of credit instruments. Under normal market conditions, at least 80% of AIF’s “managed assets” will be invested in credit instruments and investments with similar economic characteristics. For purposes of this policy, “credit instruments” include Senior Loans, subordinated loans, high yield corporate bonds, notes, bills, debentures, distressed securities, mezzanine securities, structured products (including, without limitation, collateralized debt obligations (“CDOs”), collateralized loan obligations (“CLOs”) and asset-backed securities), bank loans, corporate loans, convertible and preferred securities, government and municipal obligations, mortgage-backed securities, repurchase agreements, and other fixed-income instruments of a similar nature that may be represented by derivatives such as options, forwards, futures contracts or swap agreements. The Fund defines “managed assets” as the total assets of the Fund (including any assets attributable to any preferred shares that may be issued or to money borrowed or notes issued by the Fund) minus the sum of the Fund’s accrued liabilities, including accrued interest and accumulated dividends (other than liabilities for money borrowed or notes issued and the liquidation preference of preferred shares). The 80% policy and AIF’s investment objectives are not fundamental and may be changed by the board of directors of AIF with at least 60 days’ prior written notice provided to shareholders. AIF will seek to preserve capital to the extent consistent with its primary investment objective. AIF’s ability to achieve capital preservation may be limited by its investment in credit instruments that have speculative characteristics. There can be no assurance that AIF will achieve its investment objectives. Securities Rated Below Caa or CCC . AIF has adopted a policy to not invest more than 20% of its managed assets in credit instruments that are rated Caa or lower by Moody’s or CCC or lower by S&P or Fitch Ratings Inc. Unrated credit instruments are not subject to this policy. Structured Products . AIF has adopted a policy to not invest more than 20% of its managed assets in structured products. The Adviser seeks to achieve the Fund’s investment objectives primarily by allocating the Fund’s assets among different types of credit instruments based on absolute and relative value considerations and its analysis of the credit markets. The Fund’s investments consist primarily of Senior Loans and Corporate Bonds. The Fund, however, has provided the Adviser with the flexibility to invest in varying types of credit instruments based on its analysis of the credit markets. This ability to dynamically allocate the Fund’s assets may result in the Fund’s portfolio becoming concentrated in a particular type of credit instrument (such as Senior Loans or Corporate Bonds) and substantially less invested in other types of credit instruments. The Fund may invest in subordinated loans. The Fund may invest in distressed securities, including loans purchased in the secondary market, that are the subject of bankruptcy proceedings or otherwise in default or at risk of being in default as to the repayment of principal and/or interest at the time of acquisition by the Fund. The Fund may make investments in non-U.S. entities, including issuers in emerging markets, but expects to make any investments in foreign issuers primarily in U.S. dollar denominated securities. The Fund reserves the right to invest in credit instruments of any maturity. The Fund reserves the right to invest in credit instruments of any duration. It is anticipated that the duration of the Fund’s portfolio will be lower than that of the overall “junk bond” market. Duration is a measure of how sensitive a bond or the Fund’s portfolio may be to changes in interest rates. The Fund currently utilizes leverage from a credit facility in furtherance of this investment strategy. In seeking to achieve the Fund’s investment objectives, the Adviser will actively construct and manage a portfolio of credit instruments and other investments. The Adviser will periodically rebalance the Fund’s allocation of assets among different types of credit instruments based on absolute and relative value considerations and its analysis of the credit markets in order to seek to optimize the Fund’s allocation to credit instruments that the Adviser believes are positioned to contribute to the achievement of the Fund’s investment objectives under the market conditions existing at the time of investment. The Adviser’s investment process is rigorous, proactive and continuous. Close monitoring of each investment in the portfolio provides the basis for making buy, sell and hold decisions. The Adviser utilizes what it believes to be a conservative approach that focuses on credit fundamentals, collateral coverage and structural seniority. The Adviser may also employ a sector analysis to assess industry trends and characteristics that may impact an issuer’s potential future ability to generate cash, as well as profitability, asset values, financial needs and potential liabilities. The Adviser takes a disciplined approach to its credit investment selection process in which the credit ratings of an issuer are evaluated but are not considered to be the sole or determinative factor for selection. The criteria used by the Adviser in credit selection may include an evaluation of whether an issuer’s debts are adequately collateralized or over-collateralized and whether it has sufficient earnings and cash flow to service its indebtedness on a timely basis. The Adviser expects to gain exposure to issuers across a broad range of industries and of varying characteristics and return profiles. Similar to its investment in other credit instruments, the Adviser adheres to a disciplined approach with respect to the Fund’s investments in structured products. The Adviser will seek to select structured products which are well structured and collateralized by portfolios of credit instruments or other assets that the Adviser believes to be of sufficient quality, diversity and amount to support the structure and fully collateralize the instrument purchased by the Fund. Likewise, the Adviser will evaluate the creditworthiness of counterparties and the investment characteristics of reference assets when causing the Fund to enter into swaps or other derivative transactions.
|
|||||||||||||||||||||||||||||||||||||||||||||||||||||||||||||||||||||||||||||||||||||||||||||||||||||||||||||||||||||||||||||||||||||||||||||||||||||||||||||||||||||||||||||||||||||||||||||||||||||||||||||||||||||||||||||||||||||||||||||||||||||||||||||||||||||||||||||||||||||||||||||||||||||||||||||||||||||||||||||||||||||||||||||||||||||||||||||||||||||||||||||||||||||||||||||||||||||||||||||||||||||||||||||||||||||||||||||||||||||||||||||||||||||||||||||||||||||||||||||||||||||||||||||||||||||||||||||||||||||||||||||||||||||||||||||||||||||||||||||||||||||||||||||||||||||||||||||||||||||||||||||||||||||||||||||||||||||||||||||||||||||||||||||||||||||||||||||||||||||||||||||||||||||||||||||||||||||||||||||||||||||||||||||||||||||||||||||||||||||||||||||||||||||||||||||||||||||||||||||||||||||||||||||||||||||||||||||||||||||||||||||||||||||||||||||||
| Risk Factors [Table Text Block] | AIF Risk Factors General Risk Market Risk Russia launched a large-scale invasion of Ukraine on February 24, 2022, significantly amplifying already existing geopolitical tensions. Actual and threatened responses to such military action may impact the markets for certain commodities and various issuers and may likely have collateral impacts on markets globally. The extent and duration of the military action, resulting sanctions imposed and other punitive action taken and resulting future market disruptions, including declines in European stock markets and the value of Russian sovereign debt, cannot be easily predicted, but could be significant. Any such disruptions caused by Russian military action or other actions (including cyberattacks and espionage) or resulting actual and threatened responses to such activity, including escalating and more widespread military conflict, purchasing and financing restrictions, boycotts or changes in consumer or purchaser preferences, sanctions, tariffs or cyberattacks may impact global economies and the Fund’s investments in various markets. In March 2023, the financial distress of certain financial institutions raised economic concerns over disruption in the U.S. banking system and regarding the solvency of certain financial services firms. There can be no certainty that the actions taken by the U.S. government to strengthen public confidence in the U.S. banking system will be effective in mitigating the effects of financial institution failures on the economy and restoring public confidence in the U.S. banking system. Raising the ceiling on U.S. government debt has become increasingly politicized. Any failure to increase the total amount that the U.S. government is authorized to borrow could lead to a default on U.S. government obligations, with unpredictable consequences for economies and markets in the U.S. and elsewhere. On August 1, 2023, Fitch Ratings, Inc. downgraded its U.S. debt rating from the highest AAA rating to AA+, citing “a high and growing general government debt burden, and the erosion of governance relative to ‘AA’ and ‘AAA’ rated peers over the last two decades that has manifested in repeated debt limit standoffs and last-minute resolutions.” The impacts, if any, of the downgrade on financial markets are unknown at this time. The downgrade has potential market impacts, including but not limited to, steep stock market declines and rising bond yields. Below Investment Grade Instruments Risk. Default, or the market’s perception that an issuer is likely to default, could reduce the value and liquidity of instruments held by the Fund, which could have a material adverse impact on the Fund’s business, financial condition and results of operations. In addition, default may cause the Fund to incur expenses in seeking recovery of principal and/or interest on its portfolio holdings. In any reorganization or liquidation proceeding relating to a portfolio company, the Fund may lose its entire investment or may be required to accept cash or securities or other instruments with a value less than its original investment and/or may be subject to restrictions on the sale of such securities or instruments. Among the risks inherent in investments in a troubled entity is the fact that it frequently may be difficult to obtain information as to the true financial condition of the issuer. The Adviser’s judgment about the credit quality of an issuer and the relative value of its securities may prove to be wrong. Investments in below investment grade instruments may present special tax issues for the Fund to the extent that the issuers of these instruments default on the instruments, and the federal income tax consequences to the Fund as a holder of such instruments may not be clear. Covenant Lite Loan Risk Fixed Income Instrument Risk Issuer Risk Credit Risk Interest Rate Risk Reinvestment Risk Spread Risk Prepayment Risk is known as prepayment or “call” risk. Credit instruments frequently have call features that allow the issuer to redeem the instrument at dates prior to its stated maturity at a specified price (typically greater than par) only if certain prescribed conditions are met (“call protection”). An issuer may choose to redeem a fixed income instrument if, for example, the issuer can refinance the instrument at a lower cost due to declining interest rates or an improvement in the credit standing of the issuer. For premium bonds (bonds acquired at prices that exceed their par or principal value) purchased by the Fund, prepayment risk may be increased and may result in losses to the Fund. Senior Loans Risk There may be less readily available and reliable information about most Senior Loans than is the case for many other types of securities, including securities issued in transactions registered under the 1933 Act, or registered under the Securities Exchange Act of 1934. As a result, the Adviser will rely primarily on its own evaluation of a borrower’s credit quality rather than on any available independent sources. Therefore, the Fund will be particularly dependent on the analytical abilities of the Adviser. In general, the secondary trading market for Senior Loans is not well developed. No active trading market may exist for certain Senior Loans, which may make it difficult to value them. Illiquidity and adverse market conditions may mean that the Fund may not be able to sell Senior Loans quickly or at a fair price. To the extent that a secondary market does exist for certain Senior Loans, the market for them may be subject to irregular trading activity, wide bid/ask spreads and extended trade settlement periods. Senior Loans and other variable rate debt instruments are subject to the risk of payment defaults of scheduled interest or principal. Such payment defaults would result in a reduction of income to the Fund, a reduction in the value of the investment and a potential decrease in the net asset value of the Fund. Similarly, a sudden and significant increase in market interest rates may increase the risk for payment defaults and cause a decline in the value of these investments and in the Fund’s net asset value. Other factors (including, but not limited to, rating downgrades, credit deterioration, a large downward movement in stock prices, a disparity in supply and demand of certain securities or market conditions that reduce liquidity) can reduce the value of Senior Loans and other debt obligations, impairing the Fund’s net asset value. Senior Loans are subject to legislative risk. If legislation or state or federal regulations impose additional requirements or restrictions on the ability of financial institutions to make loans, the availability of Senior Loans for investment by the Fund may be adversely affected. In addition, such requirements or restrictions could reduce or eliminate sources of financing for certain issuers. This would increase the risk of default. If legislation or federal or state regulations require financial institutions to increase their capital requirements, this may cause financial institutions to dispose of Senior Loans that are considered highly levered transactions. Such sales could result in prices that, in the opinion of the Adviser, do not represent fair value. If the Fund attempts to sell a Senior Loan at a time when a financial institution is engaging in such a sale, the price the Fund could receive for the Senior Loan may be adversely affected. The Fund may acquire Senior Loans through assignments or participations. The purchaser of an assignment typically succeeds to all the rights and obligations of the assigning institution and becomes a lender under the credit agreement with respect to the debt obligation; however, the purchaser’s rights can be more restricted than those of the assigning institution, and the Fund may not be able to unilaterally enforce all rights and remedies under the loan and with regard to any associated collateral. In general, a participation is a contractual relationship only with the institution participating out the interest, not with the borrower. Sellers of participations typically include banks, broker-dealers, other financial institutions and lending institutions. In purchasing participations, the Fund generally will have no right to enforce compliance by the borrower with the terms of the loan agreement against the borrower and the Fund may not directly benefit from the collateral supporting the debt obligation in which it has purchased the participation. As a result, the Fund will be exposed to the credit risk of both the borrower and the institution selling the participation. Further, in purchasing participations in lending syndicates, the Fund will not be able to conduct the due diligence on the borrower or the quality of the Senior Loan with respect to which it is buying a participation that the Fund would otherwise conduct if it were investing directly in the Senior Loan, which may result in the Fund being exposed to greater credit or fraud risk with respect to the borrower or the Senior Loan. The Fund may also engage in direct origination of loans. In originating loans, the Fund relies on the Adviser’s proprietary sourcing channels, which targets large corporate and private sponsor-backed issuers. In determining whether to originate a loan, the Fund relies on the Adviser’s analysis of the creditworthiness of a borrower and/or any collateral for payment of interest and repayment of principal. The level of analytical sophistication necessary for conducting this analysis is high and the Adviser must rely more significantly on its own resources to conduct due diligence on borrowers than for secondary market debt purchases. The loans the Fund originates are generally Senior Loans, however the Fund is not limited in the type, amount or size of loans it may originate nor to a particular type of borrower. The Fund will earn origination and other types of borrower fees in connection with originating and structuring loans. Direct loans are not publicly traded and may not have a secondary market. Direct loans are subject to heightened liquidity risk and interest rate risk, and some direct loans may be deemed illiquid. The Fund may also face heightened competition for direct origination, which may result in the Fund being required to make lower yielding investments. Subordinated Loans Risk Distressed and Defaulted Securities Risk. Leverage Risk Reference Rate Risk announced a phase out of LIBOR such that after June 30, 2023, the overnight, 1-month, 3-month, 6-month and 12-month U.S. dollar LIBOR settings ceased to be published or are no longer representative. All other LIBOR settings and certain other interbank offered rates, such as the Euro Overnight Index Average, ceased to be published after December 31, 2021. The Secured Overnight Financing Rate (“SOFR”) is a broad measure of the cost of borrowing cash overnight collateralized by U.S. Treasury securities in the repurchase agreement market and has been used increasingly on a voluntary basis in new instruments and transactions. On March 15, 2022, the Adjustable Interest Rate Act was signed into law, providing a statutory fallback mechanism to replace LIBOR with a benchmark rate that is selected by the Federal Reserve Board and based on SOFR for certain contracts that reference LIBOR without adequate fallback provisions. On December 16, 2022, the Federal Reserve Board adopted regulations implementing the Adjustable Interest Rate Act by identifying benchmark rates based on the SOFR that replaced LIBOR in different categories of financial contracts after June 30, 2023. These regulations apply only to contracts governed by U.S. law, among other limitations. Neither the effect of the LIBOR transition process nor its ultimate success can yet be known. Not all existing LIBOR-based instruments may have alternative rate-setting provisions and there remains uncertainty regarding the willingness and ability of issuers to add alternative rate-setting provisions in certain existing instruments. Parties to contract, securities or other instruments using LIBOR may disagree on transition rates or the application of applicable transition regulation, potentially resulting in uncertainty of performance and the possibility of litigation. The Fund may have instruments linked to other interbank offered rates that may also cease to be published in the future. Closed-End Structure; Market Discount from Net Asset Valueclosed-end investment companies that trade in a secondary market frequently trade at market prices that are lower than their net asset values. This is commonly referred to as “trading at a discount.” As a result, the Fund is designed primarily for long-term investors. Although the value of the Fund’s net assets is generally considered by market participants in determining whether to purchase or sell shares, whether an investor will realize gains or losses upon the sale of the shares will depend entirely upon whether the market price of the shares at the time of sale is above or below the investor’s purchase price for the shares. Because the market price of the shares will be determined by factors such as relative supply of and demand for the shares in the market, general market and economic conditions, and other factors beyond the control of the Fund, the Fund cannot predict whether the shares will trade at, below or above net asset value. As with any security, complete loss of investment is possible. |
|||||||||||||||||||||||||||||||||||||||||||||||||||||||||||||||||||||||||||||||||||||||||||||||||||||||||||||||||||||||||||||||||||||||||||||||||||||||||||||||||||||||||||||||||||||||||||||||||||||||||||||||||||||||||||||||||||||||||||||||||||||||||||||||||||||||||||||||||||||||||||||||||||||||||||||||||||||||||||||||||||||||||||||||||||||||||||||||||||||||||||||||||||||||||||||||||||||||||||||||||||||||||||||||||||||||||||||||||||||||||||||||||||||||||||||||||||||||||||||||||||||||||||||||||||||||||||||||||||||||||||||||||||||||||||||||||||||||||||||||||||||||||||||||||||||||||||||||||||||||||||||||||||||||||||||||||||||||||||||||||||||||||||||||||||||||||||||||||||||||||||||||||||||||||||||||||||||||||||||||||||||||||||||||||||||||||||||||||||||||||||||||||||||||||||||||||||||||||||||||||||||||||||||||||||||||||||||||||||||||||||||||||||||||||||||||
| Share Price [Table Text Block] | Price Range of Common Shares The following tables set forth the high and low market prices for Common Shares of each Fund on the NYSE, for each full quarterly period within each Fund’s two most recent fiscal years, along with the corresponding NAV per share and discount or premium to NAV for each quotation.
|
|||||||||||||||||||||||||||||||||||||||||||||||||||||||||||||||||||||||||||||||||||||||||||||||||||||||||||||||||||||||||||||||||||||||||||||||||||||||||||||||||||||||||||||||||||||||||||||||||||||||||||||||||||||||||||||||||||||||||||||||||||||||||||||||||||||||||||||||||||||||||||||||||||||||||||||||||||||||||||||||||||||||||||||||||||||||||||||||||||||||||||||||||||||||||||||||||||||||||||||||||||||||||||||||||||||||||||||||||||||||||||||||||||||||||||||||||||||||||||||||||||||||||||||||||||||||||||||||||||||||||||||||||||||||||||||||||||||||||||||||||||||||||||||||||||||||||||||||||||||||||||||||||||||||||||||||||||||||||||||||||||||||||||||||||||||||||||||||||||||||||||||||||||||||||||||||||||||||||||||||||||||||||||||||||||||||||||||||||||||||||||||||||||||||||||||||||||||||||||||||||||||||||||||||||||||||||||||||||||||||||||||||||||||||||||||||
| Lowest Price or Bid | 12.51 | $ 12.63 | $ 12 | $ 11.78 | 11.78 | $ 11.78 | $ 12.04 | $ 13.91 | 15.29 | $ 15.22 | $ 14.87 | $ 14.24 | 12.51 | |||||||||||||||||||||||||||||||||||||||||||||||||||||||||||||||||||||||||||||||||||||||||||||||||||||||||||||||||||||||||||||||||||||||||||||||||||||||||||||||||||||||||||||||||||||||||||||||||||||||||||||||||||||||||||||||||||||||||||||||||||||||||||||||||||||||||||||||||||||||||||||||||||||||||||||||||||||||||||||||||||||||||||||||||||||||||||||||||||||||||||||||||||||||||||||||||||||||||||||||||||||||||||||||||||||||||||||||||||||||||||||||||||||||||||||||||||||||||||||||||||||||||||||||||||||||||||||||||||||||||||||||||||||||||||||||||||||||||||||||||||||||||||||||||||||||||||||||||||||||||||||||||||||||||||||||||||||||||||||||||||||||||||||||||||||||||||||||||||||||||||||||||||||||||||||||||||||||||||||||||||||||||||||||||||||||||||||||||||||||||||||||||||||||||||||||||||||||||||||||||||||||||||||||||||||||||||||||||||||||||||||||||||
| Highest Price or Bid | 14.5 | 13.54 | 12.69 | 13.08 | 12.49 | 13.41 | 14.53 | 15.91 | 16 | 15.97 | 15.65 | 14.95 | 14.48 | |||||||||||||||||||||||||||||||||||||||||||||||||||||||||||||||||||||||||||||||||||||||||||||||||||||||||||||||||||||||||||||||||||||||||||||||||||||||||||||||||||||||||||||||||||||||||||||||||||||||||||||||||||||||||||||||||||||||||||||||||||||||||||||||||||||||||||||||||||||||||||||||||||||||||||||||||||||||||||||||||||||||||||||||||||||||||||||||||||||||||||||||||||||||||||||||||||||||||||||||||||||||||||||||||||||||||||||||||||||||||||||||||||||||||||||||||||||||||||||||||||||||||||||||||||||||||||||||||||||||||||||||||||||||||||||||||||||||||||||||||||||||||||||||||||||||||||||||||||||||||||||||||||||||||||||||||||||||||||||||||||||||||||||||||||||||||||||||||||||||||||||||||||||||||||||||||||||||||||||||||||||||||||||||||||||||||||||||||||||||||||||||||||||||||||||||||||||||||||||||||||||||||||||||||||||||||||||||||||||||||||||||||||
| Lowest Price or Bid, NAV | 14.42 | 14.45 | 14.09 | 13.92 | 13.86 | 13.85 | 14.09 | 15.75 | 16.44 | 16.73 | 16.43 | 16.33 | 15.34 | |||||||||||||||||||||||||||||||||||||||||||||||||||||||||||||||||||||||||||||||||||||||||||||||||||||||||||||||||||||||||||||||||||||||||||||||||||||||||||||||||||||||||||||||||||||||||||||||||||||||||||||||||||||||||||||||||||||||||||||||||||||||||||||||||||||||||||||||||||||||||||||||||||||||||||||||||||||||||||||||||||||||||||||||||||||||||||||||||||||||||||||||||||||||||||||||||||||||||||||||||||||||||||||||||||||||||||||||||||||||||||||||||||||||||||||||||||||||||||||||||||||||||||||||||||||||||||||||||||||||||||||||||||||||||||||||||||||||||||||||||||||||||||||||||||||||||||||||||||||||||||||||||||||||||||||||||||||||||||||||||||||||||||||||||||||||||||||||||||||||||||||||||||||||||||||||||||||||||||||||||||||||||||||||||||||||||||||||||||||||||||||||||||||||||||||||||||||||||||||||||||||||||||||||||||||||||||||||||||||||||||||||||||
| Highest Price or Bid, NAV | $ 14.73 | $ 14.83 | $ 14.41 | $ 14.39 | $ 14.11 | $ 14.98 | $ 16.06 | $ 16.61 | $ 16.66 | $ 16.75 | $ 16.82 | $ 16.49 | $ 16.27 | |||||||||||||||||||||||||||||||||||||||||||||||||||||||||||||||||||||||||||||||||||||||||||||||||||||||||||||||||||||||||||||||||||||||||||||||||||||||||||||||||||||||||||||||||||||||||||||||||||||||||||||||||||||||||||||||||||||||||||||||||||||||||||||||||||||||||||||||||||||||||||||||||||||||||||||||||||||||||||||||||||||||||||||||||||||||||||||||||||||||||||||||||||||||||||||||||||||||||||||||||||||||||||||||||||||||||||||||||||||||||||||||||||||||||||||||||||||||||||||||||||||||||||||||||||||||||||||||||||||||||||||||||||||||||||||||||||||||||||||||||||||||||||||||||||||||||||||||||||||||||||||||||||||||||||||||||||||||||||||||||||||||||||||||||||||||||||||||||||||||||||||||||||||||||||||||||||||||||||||||||||||||||||||||||||||||||||||||||||||||||||||||||||||||||||||||||||||||||||||||||||||||||||||||||||||||||||||||||||||||||||||||||||
| Highest Price or Bid, Premium (Discount) to NAV [Percent] | (1.56%) | (8.70%) | (11.94%) | (9.10%) | (11.48%) | (10.48%) | (9.53%) | (4.21%) | (3.96%) | (4.66%) | (6.96%) | (9.34%) | (11.00%) | |||||||||||||||||||||||||||||||||||||||||||||||||||||||||||||||||||||||||||||||||||||||||||||||||||||||||||||||||||||||||||||||||||||||||||||||||||||||||||||||||||||||||||||||||||||||||||||||||||||||||||||||||||||||||||||||||||||||||||||||||||||||||||||||||||||||||||||||||||||||||||||||||||||||||||||||||||||||||||||||||||||||||||||||||||||||||||||||||||||||||||||||||||||||||||||||||||||||||||||||||||||||||||||||||||||||||||||||||||||||||||||||||||||||||||||||||||||||||||||||||||||||||||||||||||||||||||||||||||||||||||||||||||||||||||||||||||||||||||||||||||||||||||||||||||||||||||||||||||||||||||||||||||||||||||||||||||||||||||||||||||||||||||||||||||||||||||||||||||||||||||||||||||||||||||||||||||||||||||||||||||||||||||||||||||||||||||||||||||||||||||||||||||||||||||||||||||||||||||||||||||||||||||||||||||||||||||||||||||||||||||||||||||
| Lowest Price or Bid, Premium (Discount) to NAV [Percent] | (13.25%) | (12.60%) | (14.38%) | (15.37%) | (15.01%) | (14.95%) | (14.55%) | (11.68%) | (7.00%) | (9.03%) | (9.49%) | (12.80%) | (18.45%) | |||||||||||||||||||||||||||||||||||||||||||||||||||||||||||||||||||||||||||||||||||||||||||||||||||||||||||||||||||||||||||||||||||||||||||||||||||||||||||||||||||||||||||||||||||||||||||||||||||||||||||||||||||||||||||||||||||||||||||||||||||||||||||||||||||||||||||||||||||||||||||||||||||||||||||||||||||||||||||||||||||||||||||||||||||||||||||||||||||||||||||||||||||||||||||||||||||||||||||||||||||||||||||||||||||||||||||||||||||||||||||||||||||||||||||||||||||||||||||||||||||||||||||||||||||||||||||||||||||||||||||||||||||||||||||||||||||||||||||||||||||||||||||||||||||||||||||||||||||||||||||||||||||||||||||||||||||||||||||||||||||||||||||||||||||||||||||||||||||||||||||||||||||||||||||||||||||||||||||||||||||||||||||||||||||||||||||||||||||||||||||||||||||||||||||||||||||||||||||||||||||||||||||||||||||||||||||||||||||||||||||||||||||
| Share Price | $ 13.96 | $ 13.96 | ||||||||||||||||||||||||||||||||||||||||||||||||||||||||||||||||||||||||||||||||||||||||||||||||||||||||||||||||||||||||||||||||||||||||||||||||||||||||||||||||||||||||||||||||||||||||||||||||||||||||||||||||||||||||||||||||||||||||||||||||||||||||||||||||||||||||||||||||||||||||||||||||||||||||||||||||||||||||||||||||||||||||||||||||||||||||||||||||||||||||||||||||||||||||||||||||||||||||||||||||||||||||||||||||||||||||||||||||||||||||||||||||||||||||||||||||||||||||||||||||||||||||||||||||||||||||||||||||||||||||||||||||||||||||||||||||||||||||||||||||||||||||||||||||||||||||||||||||||||||||||||||||||||||||||||||||||||||||||||||||||||||||||||||||||||||||||||||||||||||||||||||||||||||||||||||||||||||||||||||||||||||||||||||||||||||||||||||||||||||||||||||||||||||||||||||||||||||||||||||||||||||||||||||||||||||||||||||||||||||||||||||||||||||||||||||
| NAV Per Share | $ 14.77 | $ 14.77 | ||||||||||||||||||||||||||||||||||||||||||||||||||||||||||||||||||||||||||||||||||||||||||||||||||||||||||||||||||||||||||||||||||||||||||||||||||||||||||||||||||||||||||||||||||||||||||||||||||||||||||||||||||||||||||||||||||||||||||||||||||||||||||||||||||||||||||||||||||||||||||||||||||||||||||||||||||||||||||||||||||||||||||||||||||||||||||||||||||||||||||||||||||||||||||||||||||||||||||||||||||||||||||||||||||||||||||||||||||||||||||||||||||||||||||||||||||||||||||||||||||||||||||||||||||||||||||||||||||||||||||||||||||||||||||||||||||||||||||||||||||||||||||||||||||||||||||||||||||||||||||||||||||||||||||||||||||||||||||||||||||||||||||||||||||||||||||||||||||||||||||||||||||||||||||||||||||||||||||||||||||||||||||||||||||||||||||||||||||||||||||||||||||||||||||||||||||||||||||||||||||||||||||||||||||||||||||||||||||||||||||||||||||||||||||||||
| Latest Premium (Discount) to NAV [Percent] | (5.48%) | |||||||||||||||||||||||||||||||||||||||||||||||||||||||||||||||||||||||||||||||||||||||||||||||||||||||||||||||||||||||||||||||||||||||||||||||||||||||||||||||||||||||||||||||||||||||||||||||||||||||||||||||||||||||||||||||||||||||||||||||||||||||||||||||||||||||||||||||||||||||||||||||||||||||||||||||||||||||||||||||||||||||||||||||||||||||||||||||||||||||||||||||||||||||||||||||||||||||||||||||||||||||||||||||||||||||||||||||||||||||||||||||||||||||||||||||||||||||||||||||||||||||||||||||||||||||||||||||||||||||||||||||||||||||||||||||||||||||||||||||||||||||||||||||||||||||||||||||||||||||||||||||||||||||||||||||||||||||||||||||||||||||||||||||||||||||||||||||||||||||||||||||||||||||||||||||||||||||||||||||||||||||||||||||||||||||||||||||||||||||||||||||||||||||||||||||||||||||||||||||||||||||||||||||||||||||||||||||||||||||||||||||||||||||||||||||
| Capital Stock, Long-Term Debt, and Other Securities [Abstract] | ||||||||||||||||||||||||||||||||||||||||||||||||||||||||||||||||||||||||||||||||||||||||||||||||||||||||||||||||||||||||||||||||||||||||||||||||||||||||||||||||||||||||||||||||||||||||||||||||||||||||||||||||||||||||||||||||||||||||||||||||||||||||||||||||||||||||||||||||||||||||||||||||||||||||||||||||||||||||||||||||||||||||||||||||||||||||||||||||||||||||||||||||||||||||||||||||||||||||||||||||||||||||||||||||||||||||||||||||||||||||||||||||||||||||||||||||||||||||||||||||||||||||||||||||||||||||||||||||||||||||||||||||||||||||||||||||||||||||||||||||||||||||||||||||||||||||||||||||||||||||||||||||||||||||||||||||||||||||||||||||||||||||||||||||||||||||||||||||||||||||||||||||||||||||||||||||||||||||||||||||||||||||||||||||||||||||||||||||||||||||||||||||||||||||||||||||||||||||||||||||||||||||||||||||||||||||||||||||||||||||||||||||||||||||||||||||
| Capital Stock [Table Text Block] | Note 6. Common Shares Common share transactions were as follows:
Dividends declared on common shares with a record date of January 1, 2023 or later through the date of this report were as follows:
|
|||||||||||||||||||||||||||||||||||||||||||||||||||||||||||||||||||||||||||||||||||||||||||||||||||||||||||||||||||||||||||||||||||||||||||||||||||||||||||||||||||||||||||||||||||||||||||||||||||||||||||||||||||||||||||||||||||||||||||||||||||||||||||||||||||||||||||||||||||||||||||||||||||||||||||||||||||||||||||||||||||||||||||||||||||||||||||||||||||||||||||||||||||||||||||||||||||||||||||||||||||||||||||||||||||||||||||||||||||||||||||||||||||||||||||||||||||||||||||||||||||||||||||||||||||||||||||||||||||||||||||||||||||||||||||||||||||||||||||||||||||||||||||||||||||||||||||||||||||||||||||||||||||||||||||||||||||||||||||||||||||||||||||||||||||||||||||||||||||||||||||||||||||||||||||||||||||||||||||||||||||||||||||||||||||||||||||||||||||||||||||||||||||||||||||||||||||||||||||||||||||||||||||||||||||||||||||||||||||||||||||||||||||||||||||||||
| Outstanding Security, Authorized [Shares] | 1,000,000,000 | |||||||||||||||||||||||||||||||||||||||||||||||||||||||||||||||||||||||||||||||||||||||||||||||||||||||||||||||||||||||||||||||||||||||||||||||||||||||||||||||||||||||||||||||||||||||||||||||||||||||||||||||||||||||||||||||||||||||||||||||||||||||||||||||||||||||||||||||||||||||||||||||||||||||||||||||||||||||||||||||||||||||||||||||||||||||||||||||||||||||||||||||||||||||||||||||||||||||||||||||||||||||||||||||||||||||||||||||||||||||||||||||||||||||||||||||||||||||||||||||||||||||||||||||||||||||||||||||||||||||||||||||||||||||||||||||||||||||||||||||||||||||||||||||||||||||||||||||||||||||||||||||||||||||||||||||||||||||||||||||||||||||||||||||||||||||||||||||||||||||||||||||||||||||||||||||||||||||||||||||||||||||||||||||||||||||||||||||||||||||||||||||||||||||||||||||||||||||||||||||||||||||||||||||||||||||||||||||||||||||||||||||||||||||||||||||
| General Risk [Member] | ||||||||||||||||||||||||||||||||||||||||||||||||||||||||||||||||||||||||||||||||||||||||||||||||||||||||||||||||||||||||||||||||||||||||||||||||||||||||||||||||||||||||||||||||||||||||||||||||||||||||||||||||||||||||||||||||||||||||||||||||||||||||||||||||||||||||||||||||||||||||||||||||||||||||||||||||||||||||||||||||||||||||||||||||||||||||||||||||||||||||||||||||||||||||||||||||||||||||||||||||||||||||||||||||||||||||||||||||||||||||||||||||||||||||||||||||||||||||||||||||||||||||||||||||||||||||||||||||||||||||||||||||||||||||||||||||||||||||||||||||||||||||||||||||||||||||||||||||||||||||||||||||||||||||||||||||||||||||||||||||||||||||||||||||||||||||||||||||||||||||||||||||||||||||||||||||||||||||||||||||||||||||||||||||||||||||||||||||||||||||||||||||||||||||||||||||||||||||||||||||||||||||||||||||||||||||||||||||||||||||||||||||||||||||||||||||
| General Description of Registrant [Abstract] | ||||||||||||||||||||||||||||||||||||||||||||||||||||||||||||||||||||||||||||||||||||||||||||||||||||||||||||||||||||||||||||||||||||||||||||||||||||||||||||||||||||||||||||||||||||||||||||||||||||||||||||||||||||||||||||||||||||||||||||||||||||||||||||||||||||||||||||||||||||||||||||||||||||||||||||||||||||||||||||||||||||||||||||||||||||||||||||||||||||||||||||||||||||||||||||||||||||||||||||||||||||||||||||||||||||||||||||||||||||||||||||||||||||||||||||||||||||||||||||||||||||||||||||||||||||||||||||||||||||||||||||||||||||||||||||||||||||||||||||||||||||||||||||||||||||||||||||||||||||||||||||||||||||||||||||||||||||||||||||||||||||||||||||||||||||||||||||||||||||||||||||||||||||||||||||||||||||||||||||||||||||||||||||||||||||||||||||||||||||||||||||||||||||||||||||||||||||||||||||||||||||||||||||||||||||||||||||||||||||||||||||||||||||||||||||||||
| Risk [Text Block] | General Risk |
|||||||||||||||||||||||||||||||||||||||||||||||||||||||||||||||||||||||||||||||||||||||||||||||||||||||||||||||||||||||||||||||||||||||||||||||||||||||||||||||||||||||||||||||||||||||||||||||||||||||||||||||||||||||||||||||||||||||||||||||||||||||||||||||||||||||||||||||||||||||||||||||||||||||||||||||||||||||||||||||||||||||||||||||||||||||||||||||||||||||||||||||||||||||||||||||||||||||||||||||||||||||||||||||||||||||||||||||||||||||||||||||||||||||||||||||||||||||||||||||||||||||||||||||||||||||||||||||||||||||||||||||||||||||||||||||||||||||||||||||||||||||||||||||||||||||||||||||||||||||||||||||||||||||||||||||||||||||||||||||||||||||||||||||||||||||||||||||||||||||||||||||||||||||||||||||||||||||||||||||||||||||||||||||||||||||||||||||||||||||||||||||||||||||||||||||||||||||||||||||||||||||||||||||||||||||||||||||||||||||||||||||||||||||||||||||
| Market Risk [Member] | ||||||||||||||||||||||||||||||||||||||||||||||||||||||||||||||||||||||||||||||||||||||||||||||||||||||||||||||||||||||||||||||||||||||||||||||||||||||||||||||||||||||||||||||||||||||||||||||||||||||||||||||||||||||||||||||||||||||||||||||||||||||||||||||||||||||||||||||||||||||||||||||||||||||||||||||||||||||||||||||||||||||||||||||||||||||||||||||||||||||||||||||||||||||||||||||||||||||||||||||||||||||||||||||||||||||||||||||||||||||||||||||||||||||||||||||||||||||||||||||||||||||||||||||||||||||||||||||||||||||||||||||||||||||||||||||||||||||||||||||||||||||||||||||||||||||||||||||||||||||||||||||||||||||||||||||||||||||||||||||||||||||||||||||||||||||||||||||||||||||||||||||||||||||||||||||||||||||||||||||||||||||||||||||||||||||||||||||||||||||||||||||||||||||||||||||||||||||||||||||||||||||||||||||||||||||||||||||||||||||||||||||||||||||||||||||||
| General Description of Registrant [Abstract] | ||||||||||||||||||||||||||||||||||||||||||||||||||||||||||||||||||||||||||||||||||||||||||||||||||||||||||||||||||||||||||||||||||||||||||||||||||||||||||||||||||||||||||||||||||||||||||||||||||||||||||||||||||||||||||||||||||||||||||||||||||||||||||||||||||||||||||||||||||||||||||||||||||||||||||||||||||||||||||||||||||||||||||||||||||||||||||||||||||||||||||||||||||||||||||||||||||||||||||||||||||||||||||||||||||||||||||||||||||||||||||||||||||||||||||||||||||||||||||||||||||||||||||||||||||||||||||||||||||||||||||||||||||||||||||||||||||||||||||||||||||||||||||||||||||||||||||||||||||||||||||||||||||||||||||||||||||||||||||||||||||||||||||||||||||||||||||||||||||||||||||||||||||||||||||||||||||||||||||||||||||||||||||||||||||||||||||||||||||||||||||||||||||||||||||||||||||||||||||||||||||||||||||||||||||||||||||||||||||||||||||||||||||||||||||||||||
| Risk [Text Block] | Market Risk Russia launched a large-scale invasion of Ukraine on February 24, 2022, significantly amplifying already existing geopolitical tensions. Actual and threatened responses to such military action may impact the markets for certain commodities and various issuers and may likely have collateral impacts on markets globally. The extent and duration of the military action, resulting sanctions imposed and other punitive action taken and resulting future market disruptions, including declines in European stock markets and the value of Russian sovereign debt, cannot be easily predicted, but could be significant. Any such disruptions caused by Russian military action or other actions (including cyberattacks and espionage) or resulting actual and threatened responses to such activity, including escalating and more widespread military conflict, purchasing and financing restrictions, boycotts or changes in consumer or purchaser preferences, sanctions, tariffs or cyberattacks may impact global economies and the Fund’s investments in various markets. In March 2023, the financial distress of certain financial institutions raised economic concerns over disruption in the U.S. banking system and regarding the solvency of certain financial services firms. There can be no certainty that the actions taken by the U.S. government to strengthen public confidence in the U.S. banking system will be effective in mitigating the effects of financial institution failures on the economy and restoring public confidence in the U.S. banking system. Raising the ceiling on U.S. government debt has become increasingly politicized. Any failure to increase the total amount that the U.S. government is authorized to borrow could lead to a default on U.S. government obligations, with unpredictable consequences for economies and markets in the U.S. and elsewhere. On August 1, 2023, Fitch Ratings, Inc. downgraded its U.S. debt rating from the highest AAA rating to AA+, citing “a high and growing general government debt burden, and the erosion of governance relative to ‘AA’ and ‘AAA’ rated peers over the last two decades that has manifested in repeated debt limit standoffs and last-minute resolutions.” The impacts, if any, of the downgrade on financial markets are unknown at this time. The downgrade has potential market impacts, including but not limited to, steep stock market declines and rising bond yields.
|
|||||||||||||||||||||||||||||||||||||||||||||||||||||||||||||||||||||||||||||||||||||||||||||||||||||||||||||||||||||||||||||||||||||||||||||||||||||||||||||||||||||||||||||||||||||||||||||||||||||||||||||||||||||||||||||||||||||||||||||||||||||||||||||||||||||||||||||||||||||||||||||||||||||||||||||||||||||||||||||||||||||||||||||||||||||||||||||||||||||||||||||||||||||||||||||||||||||||||||||||||||||||||||||||||||||||||||||||||||||||||||||||||||||||||||||||||||||||||||||||||||||||||||||||||||||||||||||||||||||||||||||||||||||||||||||||||||||||||||||||||||||||||||||||||||||||||||||||||||||||||||||||||||||||||||||||||||||||||||||||||||||||||||||||||||||||||||||||||||||||||||||||||||||||||||||||||||||||||||||||||||||||||||||||||||||||||||||||||||||||||||||||||||||||||||||||||||||||||||||||||||||||||||||||||||||||||||||||||||||||||||||||||||||||||||||||
| Below Investment Grade Instruments Risk [Member] | ||||||||||||||||||||||||||||||||||||||||||||||||||||||||||||||||||||||||||||||||||||||||||||||||||||||||||||||||||||||||||||||||||||||||||||||||||||||||||||||||||||||||||||||||||||||||||||||||||||||||||||||||||||||||||||||||||||||||||||||||||||||||||||||||||||||||||||||||||||||||||||||||||||||||||||||||||||||||||||||||||||||||||||||||||||||||||||||||||||||||||||||||||||||||||||||||||||||||||||||||||||||||||||||||||||||||||||||||||||||||||||||||||||||||||||||||||||||||||||||||||||||||||||||||||||||||||||||||||||||||||||||||||||||||||||||||||||||||||||||||||||||||||||||||||||||||||||||||||||||||||||||||||||||||||||||||||||||||||||||||||||||||||||||||||||||||||||||||||||||||||||||||||||||||||||||||||||||||||||||||||||||||||||||||||||||||||||||||||||||||||||||||||||||||||||||||||||||||||||||||||||||||||||||||||||||||||||||||||||||||||||||||||||||||||||||||
| General Description of Registrant [Abstract] | ||||||||||||||||||||||||||||||||||||||||||||||||||||||||||||||||||||||||||||||||||||||||||||||||||||||||||||||||||||||||||||||||||||||||||||||||||||||||||||||||||||||||||||||||||||||||||||||||||||||||||||||||||||||||||||||||||||||||||||||||||||||||||||||||||||||||||||||||||||||||||||||||||||||||||||||||||||||||||||||||||||||||||||||||||||||||||||||||||||||||||||||||||||||||||||||||||||||||||||||||||||||||||||||||||||||||||||||||||||||||||||||||||||||||||||||||||||||||||||||||||||||||||||||||||||||||||||||||||||||||||||||||||||||||||||||||||||||||||||||||||||||||||||||||||||||||||||||||||||||||||||||||||||||||||||||||||||||||||||||||||||||||||||||||||||||||||||||||||||||||||||||||||||||||||||||||||||||||||||||||||||||||||||||||||||||||||||||||||||||||||||||||||||||||||||||||||||||||||||||||||||||||||||||||||||||||||||||||||||||||||||||||||||||||||||||||
| Risk [Text Block] | Below Investment Grade Instruments Risk. Default, or the market’s perception that an issuer is likely to default, could reduce the value and liquidity of instruments held by the Fund, which could have a material adverse impact on the Fund’s business, financial condition and results of operations. In addition, default may cause the Fund to incur expenses in seeking recovery of principal and/or interest on its portfolio holdings. In any reorganization or liquidation proceeding relating to a portfolio company, the Fund may lose its entire investment or may be required to accept cash or securities or other instruments with a value less than its original investment and/or may be subject to restrictions on the sale of such securities or instruments. Among the risks inherent in investments in a troubled entity is the fact that it frequently may be difficult to obtain information as to the true financial condition of the issuer. The Adviser’s judgment about the credit quality of an issuer and the relative value of its securities may prove to be wrong. Investments in below investment grade instruments may present special tax issues for the Fund to the extent that the issuers of these instruments default on the instruments, and the federal income tax consequences to the Fund as a holder of such instruments may not be clear.
|
|||||||||||||||||||||||||||||||||||||||||||||||||||||||||||||||||||||||||||||||||||||||||||||||||||||||||||||||||||||||||||||||||||||||||||||||||||||||||||||||||||||||||||||||||||||||||||||||||||||||||||||||||||||||||||||||||||||||||||||||||||||||||||||||||||||||||||||||||||||||||||||||||||||||||||||||||||||||||||||||||||||||||||||||||||||||||||||||||||||||||||||||||||||||||||||||||||||||||||||||||||||||||||||||||||||||||||||||||||||||||||||||||||||||||||||||||||||||||||||||||||||||||||||||||||||||||||||||||||||||||||||||||||||||||||||||||||||||||||||||||||||||||||||||||||||||||||||||||||||||||||||||||||||||||||||||||||||||||||||||||||||||||||||||||||||||||||||||||||||||||||||||||||||||||||||||||||||||||||||||||||||||||||||||||||||||||||||||||||||||||||||||||||||||||||||||||||||||||||||||||||||||||||||||||||||||||||||||||||||||||||||||||||||||||||||||
| Covenant Lite Loan Risk [Member] | ||||||||||||||||||||||||||||||||||||||||||||||||||||||||||||||||||||||||||||||||||||||||||||||||||||||||||||||||||||||||||||||||||||||||||||||||||||||||||||||||||||||||||||||||||||||||||||||||||||||||||||||||||||||||||||||||||||||||||||||||||||||||||||||||||||||||||||||||||||||||||||||||||||||||||||||||||||||||||||||||||||||||||||||||||||||||||||||||||||||||||||||||||||||||||||||||||||||||||||||||||||||||||||||||||||||||||||||||||||||||||||||||||||||||||||||||||||||||||||||||||||||||||||||||||||||||||||||||||||||||||||||||||||||||||||||||||||||||||||||||||||||||||||||||||||||||||||||||||||||||||||||||||||||||||||||||||||||||||||||||||||||||||||||||||||||||||||||||||||||||||||||||||||||||||||||||||||||||||||||||||||||||||||||||||||||||||||||||||||||||||||||||||||||||||||||||||||||||||||||||||||||||||||||||||||||||||||||||||||||||||||||||||||||||||||||||
| General Description of Registrant [Abstract] | ||||||||||||||||||||||||||||||||||||||||||||||||||||||||||||||||||||||||||||||||||||||||||||||||||||||||||||||||||||||||||||||||||||||||||||||||||||||||||||||||||||||||||||||||||||||||||||||||||||||||||||||||||||||||||||||||||||||||||||||||||||||||||||||||||||||||||||||||||||||||||||||||||||||||||||||||||||||||||||||||||||||||||||||||||||||||||||||||||||||||||||||||||||||||||||||||||||||||||||||||||||||||||||||||||||||||||||||||||||||||||||||||||||||||||||||||||||||||||||||||||||||||||||||||||||||||||||||||||||||||||||||||||||||||||||||||||||||||||||||||||||||||||||||||||||||||||||||||||||||||||||||||||||||||||||||||||||||||||||||||||||||||||||||||||||||||||||||||||||||||||||||||||||||||||||||||||||||||||||||||||||||||||||||||||||||||||||||||||||||||||||||||||||||||||||||||||||||||||||||||||||||||||||||||||||||||||||||||||||||||||||||||||||||||||||||||
| Risk [Text Block] | Covenant Lite Loan Risk |
|||||||||||||||||||||||||||||||||||||||||||||||||||||||||||||||||||||||||||||||||||||||||||||||||||||||||||||||||||||||||||||||||||||||||||||||||||||||||||||||||||||||||||||||||||||||||||||||||||||||||||||||||||||||||||||||||||||||||||||||||||||||||||||||||||||||||||||||||||||||||||||||||||||||||||||||||||||||||||||||||||||||||||||||||||||||||||||||||||||||||||||||||||||||||||||||||||||||||||||||||||||||||||||||||||||||||||||||||||||||||||||||||||||||||||||||||||||||||||||||||||||||||||||||||||||||||||||||||||||||||||||||||||||||||||||||||||||||||||||||||||||||||||||||||||||||||||||||||||||||||||||||||||||||||||||||||||||||||||||||||||||||||||||||||||||||||||||||||||||||||||||||||||||||||||||||||||||||||||||||||||||||||||||||||||||||||||||||||||||||||||||||||||||||||||||||||||||||||||||||||||||||||||||||||||||||||||||||||||||||||||||||||||||||||||||||
| Fixed Income Instrument Risk [Member] | ||||||||||||||||||||||||||||||||||||||||||||||||||||||||||||||||||||||||||||||||||||||||||||||||||||||||||||||||||||||||||||||||||||||||||||||||||||||||||||||||||||||||||||||||||||||||||||||||||||||||||||||||||||||||||||||||||||||||||||||||||||||||||||||||||||||||||||||||||||||||||||||||||||||||||||||||||||||||||||||||||||||||||||||||||||||||||||||||||||||||||||||||||||||||||||||||||||||||||||||||||||||||||||||||||||||||||||||||||||||||||||||||||||||||||||||||||||||||||||||||||||||||||||||||||||||||||||||||||||||||||||||||||||||||||||||||||||||||||||||||||||||||||||||||||||||||||||||||||||||||||||||||||||||||||||||||||||||||||||||||||||||||||||||||||||||||||||||||||||||||||||||||||||||||||||||||||||||||||||||||||||||||||||||||||||||||||||||||||||||||||||||||||||||||||||||||||||||||||||||||||||||||||||||||||||||||||||||||||||||||||||||||||||||||||||||||
| General Description of Registrant [Abstract] | ||||||||||||||||||||||||||||||||||||||||||||||||||||||||||||||||||||||||||||||||||||||||||||||||||||||||||||||||||||||||||||||||||||||||||||||||||||||||||||||||||||||||||||||||||||||||||||||||||||||||||||||||||||||||||||||||||||||||||||||||||||||||||||||||||||||||||||||||||||||||||||||||||||||||||||||||||||||||||||||||||||||||||||||||||||||||||||||||||||||||||||||||||||||||||||||||||||||||||||||||||||||||||||||||||||||||||||||||||||||||||||||||||||||||||||||||||||||||||||||||||||||||||||||||||||||||||||||||||||||||||||||||||||||||||||||||||||||||||||||||||||||||||||||||||||||||||||||||||||||||||||||||||||||||||||||||||||||||||||||||||||||||||||||||||||||||||||||||||||||||||||||||||||||||||||||||||||||||||||||||||||||||||||||||||||||||||||||||||||||||||||||||||||||||||||||||||||||||||||||||||||||||||||||||||||||||||||||||||||||||||||||||||||||||||||||||
| Risk [Text Block] | Fixed Income Instrument Risk |
|||||||||||||||||||||||||||||||||||||||||||||||||||||||||||||||||||||||||||||||||||||||||||||||||||||||||||||||||||||||||||||||||||||||||||||||||||||||||||||||||||||||||||||||||||||||||||||||||||||||||||||||||||||||||||||||||||||||||||||||||||||||||||||||||||||||||||||||||||||||||||||||||||||||||||||||||||||||||||||||||||||||||||||||||||||||||||||||||||||||||||||||||||||||||||||||||||||||||||||||||||||||||||||||||||||||||||||||||||||||||||||||||||||||||||||||||||||||||||||||||||||||||||||||||||||||||||||||||||||||||||||||||||||||||||||||||||||||||||||||||||||||||||||||||||||||||||||||||||||||||||||||||||||||||||||||||||||||||||||||||||||||||||||||||||||||||||||||||||||||||||||||||||||||||||||||||||||||||||||||||||||||||||||||||||||||||||||||||||||||||||||||||||||||||||||||||||||||||||||||||||||||||||||||||||||||||||||||||||||||||||||||||||||||||||||||
| Issuer Risk [Member] | ||||||||||||||||||||||||||||||||||||||||||||||||||||||||||||||||||||||||||||||||||||||||||||||||||||||||||||||||||||||||||||||||||||||||||||||||||||||||||||||||||||||||||||||||||||||||||||||||||||||||||||||||||||||||||||||||||||||||||||||||||||||||||||||||||||||||||||||||||||||||||||||||||||||||||||||||||||||||||||||||||||||||||||||||||||||||||||||||||||||||||||||||||||||||||||||||||||||||||||||||||||||||||||||||||||||||||||||||||||||||||||||||||||||||||||||||||||||||||||||||||||||||||||||||||||||||||||||||||||||||||||||||||||||||||||||||||||||||||||||||||||||||||||||||||||||||||||||||||||||||||||||||||||||||||||||||||||||||||||||||||||||||||||||||||||||||||||||||||||||||||||||||||||||||||||||||||||||||||||||||||||||||||||||||||||||||||||||||||||||||||||||||||||||||||||||||||||||||||||||||||||||||||||||||||||||||||||||||||||||||||||||||||||||||||||||||
| General Description of Registrant [Abstract] | ||||||||||||||||||||||||||||||||||||||||||||||||||||||||||||||||||||||||||||||||||||||||||||||||||||||||||||||||||||||||||||||||||||||||||||||||||||||||||||||||||||||||||||||||||||||||||||||||||||||||||||||||||||||||||||||||||||||||||||||||||||||||||||||||||||||||||||||||||||||||||||||||||||||||||||||||||||||||||||||||||||||||||||||||||||||||||||||||||||||||||||||||||||||||||||||||||||||||||||||||||||||||||||||||||||||||||||||||||||||||||||||||||||||||||||||||||||||||||||||||||||||||||||||||||||||||||||||||||||||||||||||||||||||||||||||||||||||||||||||||||||||||||||||||||||||||||||||||||||||||||||||||||||||||||||||||||||||||||||||||||||||||||||||||||||||||||||||||||||||||||||||||||||||||||||||||||||||||||||||||||||||||||||||||||||||||||||||||||||||||||||||||||||||||||||||||||||||||||||||||||||||||||||||||||||||||||||||||||||||||||||||||||||||||||||||||
| Risk [Text Block] | Issuer Risk |
|||||||||||||||||||||||||||||||||||||||||||||||||||||||||||||||||||||||||||||||||||||||||||||||||||||||||||||||||||||||||||||||||||||||||||||||||||||||||||||||||||||||||||||||||||||||||||||||||||||||||||||||||||||||||||||||||||||||||||||||||||||||||||||||||||||||||||||||||||||||||||||||||||||||||||||||||||||||||||||||||||||||||||||||||||||||||||||||||||||||||||||||||||||||||||||||||||||||||||||||||||||||||||||||||||||||||||||||||||||||||||||||||||||||||||||||||||||||||||||||||||||||||||||||||||||||||||||||||||||||||||||||||||||||||||||||||||||||||||||||||||||||||||||||||||||||||||||||||||||||||||||||||||||||||||||||||||||||||||||||||||||||||||||||||||||||||||||||||||||||||||||||||||||||||||||||||||||||||||||||||||||||||||||||||||||||||||||||||||||||||||||||||||||||||||||||||||||||||||||||||||||||||||||||||||||||||||||||||||||||||||||||||||||||||||||||
| Credit Risk [Member] | ||||||||||||||||||||||||||||||||||||||||||||||||||||||||||||||||||||||||||||||||||||||||||||||||||||||||||||||||||||||||||||||||||||||||||||||||||||||||||||||||||||||||||||||||||||||||||||||||||||||||||||||||||||||||||||||||||||||||||||||||||||||||||||||||||||||||||||||||||||||||||||||||||||||||||||||||||||||||||||||||||||||||||||||||||||||||||||||||||||||||||||||||||||||||||||||||||||||||||||||||||||||||||||||||||||||||||||||||||||||||||||||||||||||||||||||||||||||||||||||||||||||||||||||||||||||||||||||||||||||||||||||||||||||||||||||||||||||||||||||||||||||||||||||||||||||||||||||||||||||||||||||||||||||||||||||||||||||||||||||||||||||||||||||||||||||||||||||||||||||||||||||||||||||||||||||||||||||||||||||||||||||||||||||||||||||||||||||||||||||||||||||||||||||||||||||||||||||||||||||||||||||||||||||||||||||||||||||||||||||||||||||||||||||||||||||||
| General Description of Registrant [Abstract] | ||||||||||||||||||||||||||||||||||||||||||||||||||||||||||||||||||||||||||||||||||||||||||||||||||||||||||||||||||||||||||||||||||||||||||||||||||||||||||||||||||||||||||||||||||||||||||||||||||||||||||||||||||||||||||||||||||||||||||||||||||||||||||||||||||||||||||||||||||||||||||||||||||||||||||||||||||||||||||||||||||||||||||||||||||||||||||||||||||||||||||||||||||||||||||||||||||||||||||||||||||||||||||||||||||||||||||||||||||||||||||||||||||||||||||||||||||||||||||||||||||||||||||||||||||||||||||||||||||||||||||||||||||||||||||||||||||||||||||||||||||||||||||||||||||||||||||||||||||||||||||||||||||||||||||||||||||||||||||||||||||||||||||||||||||||||||||||||||||||||||||||||||||||||||||||||||||||||||||||||||||||||||||||||||||||||||||||||||||||||||||||||||||||||||||||||||||||||||||||||||||||||||||||||||||||||||||||||||||||||||||||||||||||||||||||||||
| Risk [Text Block] | Credit Risk |
|||||||||||||||||||||||||||||||||||||||||||||||||||||||||||||||||||||||||||||||||||||||||||||||||||||||||||||||||||||||||||||||||||||||||||||||||||||||||||||||||||||||||||||||||||||||||||||||||||||||||||||||||||||||||||||||||||||||||||||||||||||||||||||||||||||||||||||||||||||||||||||||||||||||||||||||||||||||||||||||||||||||||||||||||||||||||||||||||||||||||||||||||||||||||||||||||||||||||||||||||||||||||||||||||||||||||||||||||||||||||||||||||||||||||||||||||||||||||||||||||||||||||||||||||||||||||||||||||||||||||||||||||||||||||||||||||||||||||||||||||||||||||||||||||||||||||||||||||||||||||||||||||||||||||||||||||||||||||||||||||||||||||||||||||||||||||||||||||||||||||||||||||||||||||||||||||||||||||||||||||||||||||||||||||||||||||||||||||||||||||||||||||||||||||||||||||||||||||||||||||||||||||||||||||||||||||||||||||||||||||||||||||||||||||||||||
| Reinvestment Risk [Member] | ||||||||||||||||||||||||||||||||||||||||||||||||||||||||||||||||||||||||||||||||||||||||||||||||||||||||||||||||||||||||||||||||||||||||||||||||||||||||||||||||||||||||||||||||||||||||||||||||||||||||||||||||||||||||||||||||||||||||||||||||||||||||||||||||||||||||||||||||||||||||||||||||||||||||||||||||||||||||||||||||||||||||||||||||||||||||||||||||||||||||||||||||||||||||||||||||||||||||||||||||||||||||||||||||||||||||||||||||||||||||||||||||||||||||||||||||||||||||||||||||||||||||||||||||||||||||||||||||||||||||||||||||||||||||||||||||||||||||||||||||||||||||||||||||||||||||||||||||||||||||||||||||||||||||||||||||||||||||||||||||||||||||||||||||||||||||||||||||||||||||||||||||||||||||||||||||||||||||||||||||||||||||||||||||||||||||||||||||||||||||||||||||||||||||||||||||||||||||||||||||||||||||||||||||||||||||||||||||||||||||||||||||||||||||||||||||
| General Description of Registrant [Abstract] | ||||||||||||||||||||||||||||||||||||||||||||||||||||||||||||||||||||||||||||||||||||||||||||||||||||||||||||||||||||||||||||||||||||||||||||||||||||||||||||||||||||||||||||||||||||||||||||||||||||||||||||||||||||||||||||||||||||||||||||||||||||||||||||||||||||||||||||||||||||||||||||||||||||||||||||||||||||||||||||||||||||||||||||||||||||||||||||||||||||||||||||||||||||||||||||||||||||||||||||||||||||||||||||||||||||||||||||||||||||||||||||||||||||||||||||||||||||||||||||||||||||||||||||||||||||||||||||||||||||||||||||||||||||||||||||||||||||||||||||||||||||||||||||||||||||||||||||||||||||||||||||||||||||||||||||||||||||||||||||||||||||||||||||||||||||||||||||||||||||||||||||||||||||||||||||||||||||||||||||||||||||||||||||||||||||||||||||||||||||||||||||||||||||||||||||||||||||||||||||||||||||||||||||||||||||||||||||||||||||||||||||||||||||||||||||||||
| Risk [Text Block] | Reinvestment Risk |
|||||||||||||||||||||||||||||||||||||||||||||||||||||||||||||||||||||||||||||||||||||||||||||||||||||||||||||||||||||||||||||||||||||||||||||||||||||||||||||||||||||||||||||||||||||||||||||||||||||||||||||||||||||||||||||||||||||||||||||||||||||||||||||||||||||||||||||||||||||||||||||||||||||||||||||||||||||||||||||||||||||||||||||||||||||||||||||||||||||||||||||||||||||||||||||||||||||||||||||||||||||||||||||||||||||||||||||||||||||||||||||||||||||||||||||||||||||||||||||||||||||||||||||||||||||||||||||||||||||||||||||||||||||||||||||||||||||||||||||||||||||||||||||||||||||||||||||||||||||||||||||||||||||||||||||||||||||||||||||||||||||||||||||||||||||||||||||||||||||||||||||||||||||||||||||||||||||||||||||||||||||||||||||||||||||||||||||||||||||||||||||||||||||||||||||||||||||||||||||||||||||||||||||||||||||||||||||||||||||||||||||||||||||||||||||||
| Spread Risk [Member] | ||||||||||||||||||||||||||||||||||||||||||||||||||||||||||||||||||||||||||||||||||||||||||||||||||||||||||||||||||||||||||||||||||||||||||||||||||||||||||||||||||||||||||||||||||||||||||||||||||||||||||||||||||||||||||||||||||||||||||||||||||||||||||||||||||||||||||||||||||||||||||||||||||||||||||||||||||||||||||||||||||||||||||||||||||||||||||||||||||||||||||||||||||||||||||||||||||||||||||||||||||||||||||||||||||||||||||||||||||||||||||||||||||||||||||||||||||||||||||||||||||||||||||||||||||||||||||||||||||||||||||||||||||||||||||||||||||||||||||||||||||||||||||||||||||||||||||||||||||||||||||||||||||||||||||||||||||||||||||||||||||||||||||||||||||||||||||||||||||||||||||||||||||||||||||||||||||||||||||||||||||||||||||||||||||||||||||||||||||||||||||||||||||||||||||||||||||||||||||||||||||||||||||||||||||||||||||||||||||||||||||||||||||||||||||||||||
| General Description of Registrant [Abstract] | ||||||||||||||||||||||||||||||||||||||||||||||||||||||||||||||||||||||||||||||||||||||||||||||||||||||||||||||||||||||||||||||||||||||||||||||||||||||||||||||||||||||||||||||||||||||||||||||||||||||||||||||||||||||||||||||||||||||||||||||||||||||||||||||||||||||||||||||||||||||||||||||||||||||||||||||||||||||||||||||||||||||||||||||||||||||||||||||||||||||||||||||||||||||||||||||||||||||||||||||||||||||||||||||||||||||||||||||||||||||||||||||||||||||||||||||||||||||||||||||||||||||||||||||||||||||||||||||||||||||||||||||||||||||||||||||||||||||||||||||||||||||||||||||||||||||||||||||||||||||||||||||||||||||||||||||||||||||||||||||||||||||||||||||||||||||||||||||||||||||||||||||||||||||||||||||||||||||||||||||||||||||||||||||||||||||||||||||||||||||||||||||||||||||||||||||||||||||||||||||||||||||||||||||||||||||||||||||||||||||||||||||||||||||||||||||||
| Risk [Text Block] | Spread Risk |
|||||||||||||||||||||||||||||||||||||||||||||||||||||||||||||||||||||||||||||||||||||||||||||||||||||||||||||||||||||||||||||||||||||||||||||||||||||||||||||||||||||||||||||||||||||||||||||||||||||||||||||||||||||||||||||||||||||||||||||||||||||||||||||||||||||||||||||||||||||||||||||||||||||||||||||||||||||||||||||||||||||||||||||||||||||||||||||||||||||||||||||||||||||||||||||||||||||||||||||||||||||||||||||||||||||||||||||||||||||||||||||||||||||||||||||||||||||||||||||||||||||||||||||||||||||||||||||||||||||||||||||||||||||||||||||||||||||||||||||||||||||||||||||||||||||||||||||||||||||||||||||||||||||||||||||||||||||||||||||||||||||||||||||||||||||||||||||||||||||||||||||||||||||||||||||||||||||||||||||||||||||||||||||||||||||||||||||||||||||||||||||||||||||||||||||||||||||||||||||||||||||||||||||||||||||||||||||||||||||||||||||||||||||||||||||||
| Prepayment Risk [Member] | ||||||||||||||||||||||||||||||||||||||||||||||||||||||||||||||||||||||||||||||||||||||||||||||||||||||||||||||||||||||||||||||||||||||||||||||||||||||||||||||||||||||||||||||||||||||||||||||||||||||||||||||||||||||||||||||||||||||||||||||||||||||||||||||||||||||||||||||||||||||||||||||||||||||||||||||||||||||||||||||||||||||||||||||||||||||||||||||||||||||||||||||||||||||||||||||||||||||||||||||||||||||||||||||||||||||||||||||||||||||||||||||||||||||||||||||||||||||||||||||||||||||||||||||||||||||||||||||||||||||||||||||||||||||||||||||||||||||||||||||||||||||||||||||||||||||||||||||||||||||||||||||||||||||||||||||||||||||||||||||||||||||||||||||||||||||||||||||||||||||||||||||||||||||||||||||||||||||||||||||||||||||||||||||||||||||||||||||||||||||||||||||||||||||||||||||||||||||||||||||||||||||||||||||||||||||||||||||||||||||||||||||||||||||||||||||||
| General Description of Registrant [Abstract] | ||||||||||||||||||||||||||||||||||||||||||||||||||||||||||||||||||||||||||||||||||||||||||||||||||||||||||||||||||||||||||||||||||||||||||||||||||||||||||||||||||||||||||||||||||||||||||||||||||||||||||||||||||||||||||||||||||||||||||||||||||||||||||||||||||||||||||||||||||||||||||||||||||||||||||||||||||||||||||||||||||||||||||||||||||||||||||||||||||||||||||||||||||||||||||||||||||||||||||||||||||||||||||||||||||||||||||||||||||||||||||||||||||||||||||||||||||||||||||||||||||||||||||||||||||||||||||||||||||||||||||||||||||||||||||||||||||||||||||||||||||||||||||||||||||||||||||||||||||||||||||||||||||||||||||||||||||||||||||||||||||||||||||||||||||||||||||||||||||||||||||||||||||||||||||||||||||||||||||||||||||||||||||||||||||||||||||||||||||||||||||||||||||||||||||||||||||||||||||||||||||||||||||||||||||||||||||||||||||||||||||||||||||||||||||||||||
| Risk [Text Block] | Prepayment Risk is known as prepayment or “call” risk. Credit instruments frequently have call features that allow the issuer to redeem the instrument at dates prior to its stated maturity at a specified price (typically greater than par) only if certain prescribed conditions are met (“call protection”). An issuer may choose to redeem a fixed income instrument if, for example, the issuer can refinance the instrument at a lower cost due to declining interest rates or an improvement in the credit standing of the issuer. For premium bonds (bonds acquired at prices that exceed their par or principal value) purchased by the Fund, prepayment risk may be increased and may result in losses to the Fund.
|
|||||||||||||||||||||||||||||||||||||||||||||||||||||||||||||||||||||||||||||||||||||||||||||||||||||||||||||||||||||||||||||||||||||||||||||||||||||||||||||||||||||||||||||||||||||||||||||||||||||||||||||||||||||||||||||||||||||||||||||||||||||||||||||||||||||||||||||||||||||||||||||||||||||||||||||||||||||||||||||||||||||||||||||||||||||||||||||||||||||||||||||||||||||||||||||||||||||||||||||||||||||||||||||||||||||||||||||||||||||||||||||||||||||||||||||||||||||||||||||||||||||||||||||||||||||||||||||||||||||||||||||||||||||||||||||||||||||||||||||||||||||||||||||||||||||||||||||||||||||||||||||||||||||||||||||||||||||||||||||||||||||||||||||||||||||||||||||||||||||||||||||||||||||||||||||||||||||||||||||||||||||||||||||||||||||||||||||||||||||||||||||||||||||||||||||||||||||||||||||||||||||||||||||||||||||||||||||||||||||||||||||||||||||||||||||||
| Senior Loans Risk [Member] | ||||||||||||||||||||||||||||||||||||||||||||||||||||||||||||||||||||||||||||||||||||||||||||||||||||||||||||||||||||||||||||||||||||||||||||||||||||||||||||||||||||||||||||||||||||||||||||||||||||||||||||||||||||||||||||||||||||||||||||||||||||||||||||||||||||||||||||||||||||||||||||||||||||||||||||||||||||||||||||||||||||||||||||||||||||||||||||||||||||||||||||||||||||||||||||||||||||||||||||||||||||||||||||||||||||||||||||||||||||||||||||||||||||||||||||||||||||||||||||||||||||||||||||||||||||||||||||||||||||||||||||||||||||||||||||||||||||||||||||||||||||||||||||||||||||||||||||||||||||||||||||||||||||||||||||||||||||||||||||||||||||||||||||||||||||||||||||||||||||||||||||||||||||||||||||||||||||||||||||||||||||||||||||||||||||||||||||||||||||||||||||||||||||||||||||||||||||||||||||||||||||||||||||||||||||||||||||||||||||||||||||||||||||||||||||||||
| General Description of Registrant [Abstract] | ||||||||||||||||||||||||||||||||||||||||||||||||||||||||||||||||||||||||||||||||||||||||||||||||||||||||||||||||||||||||||||||||||||||||||||||||||||||||||||||||||||||||||||||||||||||||||||||||||||||||||||||||||||||||||||||||||||||||||||||||||||||||||||||||||||||||||||||||||||||||||||||||||||||||||||||||||||||||||||||||||||||||||||||||||||||||||||||||||||||||||||||||||||||||||||||||||||||||||||||||||||||||||||||||||||||||||||||||||||||||||||||||||||||||||||||||||||||||||||||||||||||||||||||||||||||||||||||||||||||||||||||||||||||||||||||||||||||||||||||||||||||||||||||||||||||||||||||||||||||||||||||||||||||||||||||||||||||||||||||||||||||||||||||||||||||||||||||||||||||||||||||||||||||||||||||||||||||||||||||||||||||||||||||||||||||||||||||||||||||||||||||||||||||||||||||||||||||||||||||||||||||||||||||||||||||||||||||||||||||||||||||||||||||||||||||||
| Risk [Text Block] | Senior Loans Risk There may be less readily available and reliable information about most Senior Loans than is the case for many other types of securities, including securities issued in transactions registered under the 1933 Act, or registered under the Securities Exchange Act of 1934. As a result, the Adviser will rely primarily on its own evaluation of a borrower’s credit quality rather than on any available independent sources. Therefore, the Fund will be particularly dependent on the analytical abilities of the Adviser. In general, the secondary trading market for Senior Loans is not well developed. No active trading market may exist for certain Senior Loans, which may make it difficult to value them. Illiquidity and adverse market conditions may mean that the Fund may not be able to sell Senior Loans quickly or at a fair price. To the extent that a secondary market does exist for certain Senior Loans, the market for them may be subject to irregular trading activity, wide bid/ask spreads and extended trade settlement periods. Senior Loans and other variable rate debt instruments are subject to the risk of payment defaults of scheduled interest or principal. Such payment defaults would result in a reduction of income to the Fund, a reduction in the value of the investment and a potential decrease in the net asset value of the Fund. Similarly, a sudden and significant increase in market interest rates may increase the risk for payment defaults and cause a decline in the value of these investments and in the Fund’s net asset value. Other factors (including, but not limited to, rating downgrades, credit deterioration, a large downward movement in stock prices, a disparity in supply and demand of certain securities or market conditions that reduce liquidity) can reduce the value of Senior Loans and other debt obligations, impairing the Fund’s net asset value.
|
|||||||||||||||||||||||||||||||||||||||||||||||||||||||||||||||||||||||||||||||||||||||||||||||||||||||||||||||||||||||||||||||||||||||||||||||||||||||||||||||||||||||||||||||||||||||||||||||||||||||||||||||||||||||||||||||||||||||||||||||||||||||||||||||||||||||||||||||||||||||||||||||||||||||||||||||||||||||||||||||||||||||||||||||||||||||||||||||||||||||||||||||||||||||||||||||||||||||||||||||||||||||||||||||||||||||||||||||||||||||||||||||||||||||||||||||||||||||||||||||||||||||||||||||||||||||||||||||||||||||||||||||||||||||||||||||||||||||||||||||||||||||||||||||||||||||||||||||||||||||||||||||||||||||||||||||||||||||||||||||||||||||||||||||||||||||||||||||||||||||||||||||||||||||||||||||||||||||||||||||||||||||||||||||||||||||||||||||||||||||||||||||||||||||||||||||||||||||||||||||||||||||||||||||||||||||||||||||||||||||||||||||||||||||||||||||
| Senior Loans are subject to legislative risk [Member] | ||||||||||||||||||||||||||||||||||||||||||||||||||||||||||||||||||||||||||||||||||||||||||||||||||||||||||||||||||||||||||||||||||||||||||||||||||||||||||||||||||||||||||||||||||||||||||||||||||||||||||||||||||||||||||||||||||||||||||||||||||||||||||||||||||||||||||||||||||||||||||||||||||||||||||||||||||||||||||||||||||||||||||||||||||||||||||||||||||||||||||||||||||||||||||||||||||||||||||||||||||||||||||||||||||||||||||||||||||||||||||||||||||||||||||||||||||||||||||||||||||||||||||||||||||||||||||||||||||||||||||||||||||||||||||||||||||||||||||||||||||||||||||||||||||||||||||||||||||||||||||||||||||||||||||||||||||||||||||||||||||||||||||||||||||||||||||||||||||||||||||||||||||||||||||||||||||||||||||||||||||||||||||||||||||||||||||||||||||||||||||||||||||||||||||||||||||||||||||||||||||||||||||||||||||||||||||||||||||||||||||||||||||||||||||||||||
| General Description of Registrant [Abstract] | ||||||||||||||||||||||||||||||||||||||||||||||||||||||||||||||||||||||||||||||||||||||||||||||||||||||||||||||||||||||||||||||||||||||||||||||||||||||||||||||||||||||||||||||||||||||||||||||||||||||||||||||||||||||||||||||||||||||||||||||||||||||||||||||||||||||||||||||||||||||||||||||||||||||||||||||||||||||||||||||||||||||||||||||||||||||||||||||||||||||||||||||||||||||||||||||||||||||||||||||||||||||||||||||||||||||||||||||||||||||||||||||||||||||||||||||||||||||||||||||||||||||||||||||||||||||||||||||||||||||||||||||||||||||||||||||||||||||||||||||||||||||||||||||||||||||||||||||||||||||||||||||||||||||||||||||||||||||||||||||||||||||||||||||||||||||||||||||||||||||||||||||||||||||||||||||||||||||||||||||||||||||||||||||||||||||||||||||||||||||||||||||||||||||||||||||||||||||||||||||||||||||||||||||||||||||||||||||||||||||||||||||||||||||||||||||||
| Risk [Text Block] | Senior Loans are subject to legislative risk. If legislation or state or federal regulations impose additional requirements or restrictions on the ability of financial institutions to make loans, the availability of Senior Loans for investment by the Fund may be adversely affected. In addition, such requirements or restrictions could reduce or eliminate sources of financing for certain issuers. This would increase the risk of default. If legislation or federal or state regulations require financial institutions to increase their capital requirements, this may cause financial institutions to dispose of Senior Loans that are considered highly levered transactions. Such sales could result in prices that, in the opinion of the Adviser, do not represent fair value. If the Fund attempts to sell a Senior Loan at a time when a financial institution is engaging in such a sale, the price the Fund could receive for the Senior Loan may be adversely affected. The Fund may acquire Senior Loans through assignments or participations. The purchaser of an assignment typically succeeds to all the rights and obligations of the assigning institution and becomes a lender under the credit agreement with respect to the debt obligation; however, the purchaser’s rights can be more restricted than those of the assigning institution, and the Fund may not be able to unilaterally enforce all rights and remedies under the loan and with regard to any associated collateral. In general, a participation is a contractual relationship only with the institution participating out the interest, not with the borrower. Sellers of participations typically include banks, broker-dealers, other financial institutions and lending institutions. In purchasing participations, the Fund generally will have no right to enforce compliance by the borrower with the terms of the loan agreement against the borrower and the Fund may not directly benefit from the collateral supporting the debt obligation in which it has purchased the participation. As a result, the Fund will be exposed to the credit risk of both the borrower and the institution selling the participation. Further, in purchasing participations in lending syndicates, the Fund will not be able to conduct the due diligence on the borrower or the quality of the Senior Loan with respect to which it is buying a participation that the Fund would otherwise conduct if it were investing directly in the Senior Loan, which may result in the Fund being exposed to greater credit or fraud risk with respect to the borrower or the Senior Loan. The Fund may also engage in direct origination of loans. In originating loans, the Fund relies on the Adviser’s proprietary sourcing channels, which targets large corporate and private sponsor-backed issuers. In determining whether to originate a loan, the Fund relies on the Adviser’s analysis of the creditworthiness of a borrower and/or any collateral for payment of interest and repayment of principal. The level of analytical sophistication necessary for conducting this analysis is high and the Adviser must rely more significantly on its own resources to conduct due diligence on borrowers than for secondary market debt purchases. The loans the Fund originates are generally Senior Loans, however the Fund is not limited in the type, amount or size of loans it may originate nor to a particular type of borrower. The Fund will earn origination and other types of borrower fees in connection with originating and structuring loans. Direct loans are not publicly traded and may not have a secondary market. Direct loans are subject to heightened liquidity risk and interest rate risk, and some direct loans may be deemed illiquid. The Fund may also face heightened competition for direct origination, which may result in the Fund being required to make lower yielding investments.
|
|||||||||||||||||||||||||||||||||||||||||||||||||||||||||||||||||||||||||||||||||||||||||||||||||||||||||||||||||||||||||||||||||||||||||||||||||||||||||||||||||||||||||||||||||||||||||||||||||||||||||||||||||||||||||||||||||||||||||||||||||||||||||||||||||||||||||||||||||||||||||||||||||||||||||||||||||||||||||||||||||||||||||||||||||||||||||||||||||||||||||||||||||||||||||||||||||||||||||||||||||||||||||||||||||||||||||||||||||||||||||||||||||||||||||||||||||||||||||||||||||||||||||||||||||||||||||||||||||||||||||||||||||||||||||||||||||||||||||||||||||||||||||||||||||||||||||||||||||||||||||||||||||||||||||||||||||||||||||||||||||||||||||||||||||||||||||||||||||||||||||||||||||||||||||||||||||||||||||||||||||||||||||||||||||||||||||||||||||||||||||||||||||||||||||||||||||||||||||||||||||||||||||||||||||||||||||||||||||||||||||||||||||||||||||||||||
| Subordinated Loans Risk [Member] | ||||||||||||||||||||||||||||||||||||||||||||||||||||||||||||||||||||||||||||||||||||||||||||||||||||||||||||||||||||||||||||||||||||||||||||||||||||||||||||||||||||||||||||||||||||||||||||||||||||||||||||||||||||||||||||||||||||||||||||||||||||||||||||||||||||||||||||||||||||||||||||||||||||||||||||||||||||||||||||||||||||||||||||||||||||||||||||||||||||||||||||||||||||||||||||||||||||||||||||||||||||||||||||||||||||||||||||||||||||||||||||||||||||||||||||||||||||||||||||||||||||||||||||||||||||||||||||||||||||||||||||||||||||||||||||||||||||||||||||||||||||||||||||||||||||||||||||||||||||||||||||||||||||||||||||||||||||||||||||||||||||||||||||||||||||||||||||||||||||||||||||||||||||||||||||||||||||||||||||||||||||||||||||||||||||||||||||||||||||||||||||||||||||||||||||||||||||||||||||||||||||||||||||||||||||||||||||||||||||||||||||||||||||||||||||||||
| General Description of Registrant [Abstract] | ||||||||||||||||||||||||||||||||||||||||||||||||||||||||||||||||||||||||||||||||||||||||||||||||||||||||||||||||||||||||||||||||||||||||||||||||||||||||||||||||||||||||||||||||||||||||||||||||||||||||||||||||||||||||||||||||||||||||||||||||||||||||||||||||||||||||||||||||||||||||||||||||||||||||||||||||||||||||||||||||||||||||||||||||||||||||||||||||||||||||||||||||||||||||||||||||||||||||||||||||||||||||||||||||||||||||||||||||||||||||||||||||||||||||||||||||||||||||||||||||||||||||||||||||||||||||||||||||||||||||||||||||||||||||||||||||||||||||||||||||||||||||||||||||||||||||||||||||||||||||||||||||||||||||||||||||||||||||||||||||||||||||||||||||||||||||||||||||||||||||||||||||||||||||||||||||||||||||||||||||||||||||||||||||||||||||||||||||||||||||||||||||||||||||||||||||||||||||||||||||||||||||||||||||||||||||||||||||||||||||||||||||||||||||||||||||
| Risk [Text Block] | Subordinated Loans Risk |
|||||||||||||||||||||||||||||||||||||||||||||||||||||||||||||||||||||||||||||||||||||||||||||||||||||||||||||||||||||||||||||||||||||||||||||||||||||||||||||||||||||||||||||||||||||||||||||||||||||||||||||||||||||||||||||||||||||||||||||||||||||||||||||||||||||||||||||||||||||||||||||||||||||||||||||||||||||||||||||||||||||||||||||||||||||||||||||||||||||||||||||||||||||||||||||||||||||||||||||||||||||||||||||||||||||||||||||||||||||||||||||||||||||||||||||||||||||||||||||||||||||||||||||||||||||||||||||||||||||||||||||||||||||||||||||||||||||||||||||||||||||||||||||||||||||||||||||||||||||||||||||||||||||||||||||||||||||||||||||||||||||||||||||||||||||||||||||||||||||||||||||||||||||||||||||||||||||||||||||||||||||||||||||||||||||||||||||||||||||||||||||||||||||||||||||||||||||||||||||||||||||||||||||||||||||||||||||||||||||||||||||||||||||||||||||||
| Distressed and Defaulted Securities Risk [Member] | ||||||||||||||||||||||||||||||||||||||||||||||||||||||||||||||||||||||||||||||||||||||||||||||||||||||||||||||||||||||||||||||||||||||||||||||||||||||||||||||||||||||||||||||||||||||||||||||||||||||||||||||||||||||||||||||||||||||||||||||||||||||||||||||||||||||||||||||||||||||||||||||||||||||||||||||||||||||||||||||||||||||||||||||||||||||||||||||||||||||||||||||||||||||||||||||||||||||||||||||||||||||||||||||||||||||||||||||||||||||||||||||||||||||||||||||||||||||||||||||||||||||||||||||||||||||||||||||||||||||||||||||||||||||||||||||||||||||||||||||||||||||||||||||||||||||||||||||||||||||||||||||||||||||||||||||||||||||||||||||||||||||||||||||||||||||||||||||||||||||||||||||||||||||||||||||||||||||||||||||||||||||||||||||||||||||||||||||||||||||||||||||||||||||||||||||||||||||||||||||||||||||||||||||||||||||||||||||||||||||||||||||||||||||||||||||||
| General Description of Registrant [Abstract] | ||||||||||||||||||||||||||||||||||||||||||||||||||||||||||||||||||||||||||||||||||||||||||||||||||||||||||||||||||||||||||||||||||||||||||||||||||||||||||||||||||||||||||||||||||||||||||||||||||||||||||||||||||||||||||||||||||||||||||||||||||||||||||||||||||||||||||||||||||||||||||||||||||||||||||||||||||||||||||||||||||||||||||||||||||||||||||||||||||||||||||||||||||||||||||||||||||||||||||||||||||||||||||||||||||||||||||||||||||||||||||||||||||||||||||||||||||||||||||||||||||||||||||||||||||||||||||||||||||||||||||||||||||||||||||||||||||||||||||||||||||||||||||||||||||||||||||||||||||||||||||||||||||||||||||||||||||||||||||||||||||||||||||||||||||||||||||||||||||||||||||||||||||||||||||||||||||||||||||||||||||||||||||||||||||||||||||||||||||||||||||||||||||||||||||||||||||||||||||||||||||||||||||||||||||||||||||||||||||||||||||||||||||||||||||||||||
| Risk [Text Block] | Distressed and Defaulted Securities Risk. |
|||||||||||||||||||||||||||||||||||||||||||||||||||||||||||||||||||||||||||||||||||||||||||||||||||||||||||||||||||||||||||||||||||||||||||||||||||||||||||||||||||||||||||||||||||||||||||||||||||||||||||||||||||||||||||||||||||||||||||||||||||||||||||||||||||||||||||||||||||||||||||||||||||||||||||||||||||||||||||||||||||||||||||||||||||||||||||||||||||||||||||||||||||||||||||||||||||||||||||||||||||||||||||||||||||||||||||||||||||||||||||||||||||||||||||||||||||||||||||||||||||||||||||||||||||||||||||||||||||||||||||||||||||||||||||||||||||||||||||||||||||||||||||||||||||||||||||||||||||||||||||||||||||||||||||||||||||||||||||||||||||||||||||||||||||||||||||||||||||||||||||||||||||||||||||||||||||||||||||||||||||||||||||||||||||||||||||||||||||||||||||||||||||||||||||||||||||||||||||||||||||||||||||||||||||||||||||||||||||||||||||||||||||||||||||||||
| Leverage Risk [Member] | ||||||||||||||||||||||||||||||||||||||||||||||||||||||||||||||||||||||||||||||||||||||||||||||||||||||||||||||||||||||||||||||||||||||||||||||||||||||||||||||||||||||||||||||||||||||||||||||||||||||||||||||||||||||||||||||||||||||||||||||||||||||||||||||||||||||||||||||||||||||||||||||||||||||||||||||||||||||||||||||||||||||||||||||||||||||||||||||||||||||||||||||||||||||||||||||||||||||||||||||||||||||||||||||||||||||||||||||||||||||||||||||||||||||||||||||||||||||||||||||||||||||||||||||||||||||||||||||||||||||||||||||||||||||||||||||||||||||||||||||||||||||||||||||||||||||||||||||||||||||||||||||||||||||||||||||||||||||||||||||||||||||||||||||||||||||||||||||||||||||||||||||||||||||||||||||||||||||||||||||||||||||||||||||||||||||||||||||||||||||||||||||||||||||||||||||||||||||||||||||||||||||||||||||||||||||||||||||||||||||||||||||||||||||||||||||||
| General Description of Registrant [Abstract] | ||||||||||||||||||||||||||||||||||||||||||||||||||||||||||||||||||||||||||||||||||||||||||||||||||||||||||||||||||||||||||||||||||||||||||||||||||||||||||||||||||||||||||||||||||||||||||||||||||||||||||||||||||||||||||||||||||||||||||||||||||||||||||||||||||||||||||||||||||||||||||||||||||||||||||||||||||||||||||||||||||||||||||||||||||||||||||||||||||||||||||||||||||||||||||||||||||||||||||||||||||||||||||||||||||||||||||||||||||||||||||||||||||||||||||||||||||||||||||||||||||||||||||||||||||||||||||||||||||||||||||||||||||||||||||||||||||||||||||||||||||||||||||||||||||||||||||||||||||||||||||||||||||||||||||||||||||||||||||||||||||||||||||||||||||||||||||||||||||||||||||||||||||||||||||||||||||||||||||||||||||||||||||||||||||||||||||||||||||||||||||||||||||||||||||||||||||||||||||||||||||||||||||||||||||||||||||||||||||||||||||||||||||||||||||||||||
| Risk [Text Block] | Leverage Risk |
|||||||||||||||||||||||||||||||||||||||||||||||||||||||||||||||||||||||||||||||||||||||||||||||||||||||||||||||||||||||||||||||||||||||||||||||||||||||||||||||||||||||||||||||||||||||||||||||||||||||||||||||||||||||||||||||||||||||||||||||||||||||||||||||||||||||||||||||||||||||||||||||||||||||||||||||||||||||||||||||||||||||||||||||||||||||||||||||||||||||||||||||||||||||||||||||||||||||||||||||||||||||||||||||||||||||||||||||||||||||||||||||||||||||||||||||||||||||||||||||||||||||||||||||||||||||||||||||||||||||||||||||||||||||||||||||||||||||||||||||||||||||||||||||||||||||||||||||||||||||||||||||||||||||||||||||||||||||||||||||||||||||||||||||||||||||||||||||||||||||||||||||||||||||||||||||||||||||||||||||||||||||||||||||||||||||||||||||||||||||||||||||||||||||||||||||||||||||||||||||||||||||||||||||||||||||||||||||||||||||||||||||||||||||||||||||
| Reference Rate Risk [Member] | ||||||||||||||||||||||||||||||||||||||||||||||||||||||||||||||||||||||||||||||||||||||||||||||||||||||||||||||||||||||||||||||||||||||||||||||||||||||||||||||||||||||||||||||||||||||||||||||||||||||||||||||||||||||||||||||||||||||||||||||||||||||||||||||||||||||||||||||||||||||||||||||||||||||||||||||||||||||||||||||||||||||||||||||||||||||||||||||||||||||||||||||||||||||||||||||||||||||||||||||||||||||||||||||||||||||||||||||||||||||||||||||||||||||||||||||||||||||||||||||||||||||||||||||||||||||||||||||||||||||||||||||||||||||||||||||||||||||||||||||||||||||||||||||||||||||||||||||||||||||||||||||||||||||||||||||||||||||||||||||||||||||||||||||||||||||||||||||||||||||||||||||||||||||||||||||||||||||||||||||||||||||||||||||||||||||||||||||||||||||||||||||||||||||||||||||||||||||||||||||||||||||||||||||||||||||||||||||||||||||||||||||||||||||||||||||||
| General Description of Registrant [Abstract] | ||||||||||||||||||||||||||||||||||||||||||||||||||||||||||||||||||||||||||||||||||||||||||||||||||||||||||||||||||||||||||||||||||||||||||||||||||||||||||||||||||||||||||||||||||||||||||||||||||||||||||||||||||||||||||||||||||||||||||||||||||||||||||||||||||||||||||||||||||||||||||||||||||||||||||||||||||||||||||||||||||||||||||||||||||||||||||||||||||||||||||||||||||||||||||||||||||||||||||||||||||||||||||||||||||||||||||||||||||||||||||||||||||||||||||||||||||||||||||||||||||||||||||||||||||||||||||||||||||||||||||||||||||||||||||||||||||||||||||||||||||||||||||||||||||||||||||||||||||||||||||||||||||||||||||||||||||||||||||||||||||||||||||||||||||||||||||||||||||||||||||||||||||||||||||||||||||||||||||||||||||||||||||||||||||||||||||||||||||||||||||||||||||||||||||||||||||||||||||||||||||||||||||||||||||||||||||||||||||||||||||||||||||||||||||||||||
| Risk [Text Block] | Reference Rate Risk announced a phase out of LIBOR such that after June 30, 2023, the overnight, 1-month, 3-month, 6-month and 12-month U.S. dollar LIBOR settings ceased to be published or are no longer representative. All other LIBOR settings and certain other interbank offered rates, such as the Euro Overnight Index Average, ceased to be published after December 31, 2021. The Secured Overnight Financing Rate (“SOFR”) is a broad measure of the cost of borrowing cash overnight collateralized by U.S. Treasury securities in the repurchase agreement market and has been used increasingly on a voluntary basis in new instruments and transactions. On March 15, 2022, the Adjustable Interest Rate Act was signed into law, providing a statutory fallback mechanism to replace LIBOR with a benchmark rate that is selected by the Federal Reserve Board and based on SOFR for certain contracts that reference LIBOR without adequate fallback provisions. On December 16, 2022, the Federal Reserve Board adopted regulations implementing the Adjustable Interest Rate Act by identifying benchmark rates based on the SOFR that replaced LIBOR in different categories of financial contracts after June 30, 2023. These regulations apply only to contracts governed by U.S. law, among other limitations. Neither the effect of the LIBOR transition process nor its ultimate success can yet be known. Not all existing LIBOR-based instruments may have alternative rate-setting provisions and there remains uncertainty regarding the willingness and ability of issuers to add alternative rate-setting provisions in certain existing instruments. Parties to contract, securities or other instruments using LIBOR may disagree on transition rates or the application of applicable transition regulation, potentially resulting in uncertainty of performance and the possibility of litigation. The Fund may have instruments linked to other interbank offered rates that may also cease to be published in the future.
|
|||||||||||||||||||||||||||||||||||||||||||||||||||||||||||||||||||||||||||||||||||||||||||||||||||||||||||||||||||||||||||||||||||||||||||||||||||||||||||||||||||||||||||||||||||||||||||||||||||||||||||||||||||||||||||||||||||||||||||||||||||||||||||||||||||||||||||||||||||||||||||||||||||||||||||||||||||||||||||||||||||||||||||||||||||||||||||||||||||||||||||||||||||||||||||||||||||||||||||||||||||||||||||||||||||||||||||||||||||||||||||||||||||||||||||||||||||||||||||||||||||||||||||||||||||||||||||||||||||||||||||||||||||||||||||||||||||||||||||||||||||||||||||||||||||||||||||||||||||||||||||||||||||||||||||||||||||||||||||||||||||||||||||||||||||||||||||||||||||||||||||||||||||||||||||||||||||||||||||||||||||||||||||||||||||||||||||||||||||||||||||||||||||||||||||||||||||||||||||||||||||||||||||||||||||||||||||||||||||||||||||||||||||||||||||||||
| Closed-End Structure [Member] | ||||||||||||||||||||||||||||||||||||||||||||||||||||||||||||||||||||||||||||||||||||||||||||||||||||||||||||||||||||||||||||||||||||||||||||||||||||||||||||||||||||||||||||||||||||||||||||||||||||||||||||||||||||||||||||||||||||||||||||||||||||||||||||||||||||||||||||||||||||||||||||||||||||||||||||||||||||||||||||||||||||||||||||||||||||||||||||||||||||||||||||||||||||||||||||||||||||||||||||||||||||||||||||||||||||||||||||||||||||||||||||||||||||||||||||||||||||||||||||||||||||||||||||||||||||||||||||||||||||||||||||||||||||||||||||||||||||||||||||||||||||||||||||||||||||||||||||||||||||||||||||||||||||||||||||||||||||||||||||||||||||||||||||||||||||||||||||||||||||||||||||||||||||||||||||||||||||||||||||||||||||||||||||||||||||||||||||||||||||||||||||||||||||||||||||||||||||||||||||||||||||||||||||||||||||||||||||||||||||||||||||||||||||||||||||||||
| General Description of Registrant [Abstract] | ||||||||||||||||||||||||||||||||||||||||||||||||||||||||||||||||||||||||||||||||||||||||||||||||||||||||||||||||||||||||||||||||||||||||||||||||||||||||||||||||||||||||||||||||||||||||||||||||||||||||||||||||||||||||||||||||||||||||||||||||||||||||||||||||||||||||||||||||||||||||||||||||||||||||||||||||||||||||||||||||||||||||||||||||||||||||||||||||||||||||||||||||||||||||||||||||||||||||||||||||||||||||||||||||||||||||||||||||||||||||||||||||||||||||||||||||||||||||||||||||||||||||||||||||||||||||||||||||||||||||||||||||||||||||||||||||||||||||||||||||||||||||||||||||||||||||||||||||||||||||||||||||||||||||||||||||||||||||||||||||||||||||||||||||||||||||||||||||||||||||||||||||||||||||||||||||||||||||||||||||||||||||||||||||||||||||||||||||||||||||||||||||||||||||||||||||||||||||||||||||||||||||||||||||||||||||||||||||||||||||||||||||||||||||||||||||
| Risk [Text Block] | Closed-End Structure; Market Discount from Net Asset Valueclosed-end investment companies that trade in a secondary market frequently trade at market prices that are lower than their net asset values. This is commonly referred to as “trading at a discount.” As a result, the Fund is designed primarily for long-term investors. Although the value of the Fund’s net assets is generally considered by market participants in determining whether to purchase or sell shares, whether an investor will realize gains or losses upon the sale of the shares will depend entirely upon whether the market price of the shares at the time of sale is above or below the investor’s purchase price for the shares. Because the market price of the shares will be determined by factors such as relative supply of and demand for the shares in the market, general market and economic conditions, and other factors beyond the control of the Fund, the Fund cannot predict whether the shares will trade at, below or above net asset value. As with any security, complete loss of investment is possible. |
|||||||||||||||||||||||||||||||||||||||||||||||||||||||||||||||||||||||||||||||||||||||||||||||||||||||||||||||||||||||||||||||||||||||||||||||||||||||||||||||||||||||||||||||||||||||||||||||||||||||||||||||||||||||||||||||||||||||||||||||||||||||||||||||||||||||||||||||||||||||||||||||||||||||||||||||||||||||||||||||||||||||||||||||||||||||||||||||||||||||||||||||||||||||||||||||||||||||||||||||||||||||||||||||||||||||||||||||||||||||||||||||||||||||||||||||||||||||||||||||||||||||||||||||||||||||||||||||||||||||||||||||||||||||||||||||||||||||||||||||||||||||||||||||||||||||||||||||||||||||||||||||||||||||||||||||||||||||||||||||||||||||||||||||||||||||||||||||||||||||||||||||||||||||||||||||||||||||||||||||||||||||||||||||||||||||||||||||||||||||||||||||||||||||||||||||||||||||||||||||||||||||||||||||||||||||||||||||||||||||||||||||||||||||||||||||
| Interest Rate Risk [Member] | ||||||||||||||||||||||||||||||||||||||||||||||||||||||||||||||||||||||||||||||||||||||||||||||||||||||||||||||||||||||||||||||||||||||||||||||||||||||||||||||||||||||||||||||||||||||||||||||||||||||||||||||||||||||||||||||||||||||||||||||||||||||||||||||||||||||||||||||||||||||||||||||||||||||||||||||||||||||||||||||||||||||||||||||||||||||||||||||||||||||||||||||||||||||||||||||||||||||||||||||||||||||||||||||||||||||||||||||||||||||||||||||||||||||||||||||||||||||||||||||||||||||||||||||||||||||||||||||||||||||||||||||||||||||||||||||||||||||||||||||||||||||||||||||||||||||||||||||||||||||||||||||||||||||||||||||||||||||||||||||||||||||||||||||||||||||||||||||||||||||||||||||||||||||||||||||||||||||||||||||||||||||||||||||||||||||||||||||||||||||||||||||||||||||||||||||||||||||||||||||||||||||||||||||||||||||||||||||||||||||||||||||||||||||||||||||||
| General Description of Registrant [Abstract] | ||||||||||||||||||||||||||||||||||||||||||||||||||||||||||||||||||||||||||||||||||||||||||||||||||||||||||||||||||||||||||||||||||||||||||||||||||||||||||||||||||||||||||||||||||||||||||||||||||||||||||||||||||||||||||||||||||||||||||||||||||||||||||||||||||||||||||||||||||||||||||||||||||||||||||||||||||||||||||||||||||||||||||||||||||||||||||||||||||||||||||||||||||||||||||||||||||||||||||||||||||||||||||||||||||||||||||||||||||||||||||||||||||||||||||||||||||||||||||||||||||||||||||||||||||||||||||||||||||||||||||||||||||||||||||||||||||||||||||||||||||||||||||||||||||||||||||||||||||||||||||||||||||||||||||||||||||||||||||||||||||||||||||||||||||||||||||||||||||||||||||||||||||||||||||||||||||||||||||||||||||||||||||||||||||||||||||||||||||||||||||||||||||||||||||||||||||||||||||||||||||||||||||||||||||||||||||||||||||||||||||||||||||||||||||||||||
| Risk [Text Block] | Interest Rate Risk |
|||||||||||||||||||||||||||||||||||||||||||||||||||||||||||||||||||||||||||||||||||||||||||||||||||||||||||||||||||||||||||||||||||||||||||||||||||||||||||||||||||||||||||||||||||||||||||||||||||||||||||||||||||||||||||||||||||||||||||||||||||||||||||||||||||||||||||||||||||||||||||||||||||||||||||||||||||||||||||||||||||||||||||||||||||||||||||||||||||||||||||||||||||||||||||||||||||||||||||||||||||||||||||||||||||||||||||||||||||||||||||||||||||||||||||||||||||||||||||||||||||||||||||||||||||||||||||||||||||||||||||||||||||||||||||||||||||||||||||||||||||||||||||||||||||||||||||||||||||||||||||||||||||||||||||||||||||||||||||||||||||||||||||||||||||||||||||||||||||||||||||||||||||||||||||||||||||||||||||||||||||||||||||||||||||||||||||||||||||||||||||||||||||||||||||||||||||||||||||||||||||||||||||||||||||||||||||||||||||||||||||||||||||||||||||||||
| Common Shares [Member] | ||||||||||||||||||||||||||||||||||||||||||||||||||||||||||||||||||||||||||||||||||||||||||||||||||||||||||||||||||||||||||||||||||||||||||||||||||||||||||||||||||||||||||||||||||||||||||||||||||||||||||||||||||||||||||||||||||||||||||||||||||||||||||||||||||||||||||||||||||||||||||||||||||||||||||||||||||||||||||||||||||||||||||||||||||||||||||||||||||||||||||||||||||||||||||||||||||||||||||||||||||||||||||||||||||||||||||||||||||||||||||||||||||||||||||||||||||||||||||||||||||||||||||||||||||||||||||||||||||||||||||||||||||||||||||||||||||||||||||||||||||||||||||||||||||||||||||||||||||||||||||||||||||||||||||||||||||||||||||||||||||||||||||||||||||||||||||||||||||||||||||||||||||||||||||||||||||||||||||||||||||||||||||||||||||||||||||||||||||||||||||||||||||||||||||||||||||||||||||||||||||||||||||||||||||||||||||||||||||||||||||||||||||||||||||||||||
| Capital Stock, Long-Term Debt, and Other Securities [Abstract] | ||||||||||||||||||||||||||||||||||||||||||||||||||||||||||||||||||||||||||||||||||||||||||||||||||||||||||||||||||||||||||||||||||||||||||||||||||||||||||||||||||||||||||||||||||||||||||||||||||||||||||||||||||||||||||||||||||||||||||||||||||||||||||||||||||||||||||||||||||||||||||||||||||||||||||||||||||||||||||||||||||||||||||||||||||||||||||||||||||||||||||||||||||||||||||||||||||||||||||||||||||||||||||||||||||||||||||||||||||||||||||||||||||||||||||||||||||||||||||||||||||||||||||||||||||||||||||||||||||||||||||||||||||||||||||||||||||||||||||||||||||||||||||||||||||||||||||||||||||||||||||||||||||||||||||||||||||||||||||||||||||||||||||||||||||||||||||||||||||||||||||||||||||||||||||||||||||||||||||||||||||||||||||||||||||||||||||||||||||||||||||||||||||||||||||||||||||||||||||||||||||||||||||||||||||||||||||||||||||||||||||||||||||||||||||||||||
| Outstanding Security, Title [Text Block] | Common Shares | |||||||||||||||||||||||||||||||||||||||||||||||||||||||||||||||||||||||||||||||||||||||||||||||||||||||||||||||||||||||||||||||||||||||||||||||||||||||||||||||||||||||||||||||||||||||||||||||||||||||||||||||||||||||||||||||||||||||||||||||||||||||||||||||||||||||||||||||||||||||||||||||||||||||||||||||||||||||||||||||||||||||||||||||||||||||||||||||||||||||||||||||||||||||||||||||||||||||||||||||||||||||||||||||||||||||||||||||||||||||||||||||||||||||||||||||||||||||||||||||||||||||||||||||||||||||||||||||||||||||||||||||||||||||||||||||||||||||||||||||||||||||||||||||||||||||||||||||||||||||||||||||||||||||||||||||||||||||||||||||||||||||||||||||||||||||||||||||||||||||||||||||||||||||||||||||||||||||||||||||||||||||||||||||||||||||||||||||||||||||||||||||||||||||||||||||||||||||||||||||||||||||||||||||||||||||||||||||||||||||||||||||||||||||||||||||
| Outstanding Security, Held [Shares] | 14,464,026 | |||||||||||||||||||||||||||||||||||||||||||||||||||||||||||||||||||||||||||||||||||||||||||||||||||||||||||||||||||||||||||||||||||||||||||||||||||||||||||||||||||||||||||||||||||||||||||||||||||||||||||||||||||||||||||||||||||||||||||||||||||||||||||||||||||||||||||||||||||||||||||||||||||||||||||||||||||||||||||||||||||||||||||||||||||||||||||||||||||||||||||||||||||||||||||||||||||||||||||||||||||||||||||||||||||||||||||||||||||||||||||||||||||||||||||||||||||||||||||||||||||||||||||||||||||||||||||||||||||||||||||||||||||||||||||||||||||||||||||||||||||||||||||||||||||||||||||||||||||||||||||||||||||||||||||||||||||||||||||||||||||||||||||||||||||||||||||||||||||||||||||||||||||||||||||||||||||||||||||||||||||||||||||||||||||||||||||||||||||||||||||||||||||||||||||||||||||||||||||||||||||||||||||||||||||||||||||||||||||||||||||||||||||||||||||||||
| Common Shareholders [Member] | ||||||||||||||||||||||||||||||||||||||||||||||||||||||||||||||||||||||||||||||||||||||||||||||||||||||||||||||||||||||||||||||||||||||||||||||||||||||||||||||||||||||||||||||||||||||||||||||||||||||||||||||||||||||||||||||||||||||||||||||||||||||||||||||||||||||||||||||||||||||||||||||||||||||||||||||||||||||||||||||||||||||||||||||||||||||||||||||||||||||||||||||||||||||||||||||||||||||||||||||||||||||||||||||||||||||||||||||||||||||||||||||||||||||||||||||||||||||||||||||||||||||||||||||||||||||||||||||||||||||||||||||||||||||||||||||||||||||||||||||||||||||||||||||||||||||||||||||||||||||||||||||||||||||||||||||||||||||||||||||||||||||||||||||||||||||||||||||||||||||||||||||||||||||||||||||||||||||||||||||||||||||||||||||||||||||||||||||||||||||||||||||||||||||||||||||||||||||||||||||||||||||||||||||||||||||||||||||||||||||||||||||||||||||||||||||||
| Other Annual Expenses [Abstract] | ||||||||||||||||||||||||||||||||||||||||||||||||||||||||||||||||||||||||||||||||||||||||||||||||||||||||||||||||||||||||||||||||||||||||||||||||||||||||||||||||||||||||||||||||||||||||||||||||||||||||||||||||||||||||||||||||||||||||||||||||||||||||||||||||||||||||||||||||||||||||||||||||||||||||||||||||||||||||||||||||||||||||||||||||||||||||||||||||||||||||||||||||||||||||||||||||||||||||||||||||||||||||||||||||||||||||||||||||||||||||||||||||||||||||||||||||||||||||||||||||||||||||||||||||||||||||||||||||||||||||||||||||||||||||||||||||||||||||||||||||||||||||||||||||||||||||||||||||||||||||||||||||||||||||||||||||||||||||||||||||||||||||||||||||||||||||||||||||||||||||||||||||||||||||||||||||||||||||||||||||||||||||||||||||||||||||||||||||||||||||||||||||||||||||||||||||||||||||||||||||||||||||||||||||||||||||||||||||||||||||||||||||||||||||||||||||
| Basis of Transaction Fees, Note [Text Block] | as a percentage of offering price | |||||||||||||||||||||||||||||||||||||||||||||||||||||||||||||||||||||||||||||||||||||||||||||||||||||||||||||||||||||||||||||||||||||||||||||||||||||||||||||||||||||||||||||||||||||||||||||||||||||||||||||||||||||||||||||||||||||||||||||||||||||||||||||||||||||||||||||||||||||||||||||||||||||||||||||||||||||||||||||||||||||||||||||||||||||||||||||||||||||||||||||||||||||||||||||||||||||||||||||||||||||||||||||||||||||||||||||||||||||||||||||||||||||||||||||||||||||||||||||||||||||||||||||||||||||||||||||||||||||||||||||||||||||||||||||||||||||||||||||||||||||||||||||||||||||||||||||||||||||||||||||||||||||||||||||||||||||||||||||||||||||||||||||||||||||||||||||||||||||||||||||||||||||||||||||||||||||||||||||||||||||||||||||||||||||||||||||||||||||||||||||||||||||||||||||||||||||||||||||||||||||||||||||||||||||||||||||||||||||||||||||||||||||||||||||||
| ||||||||||||||||||||||||||||||||||||||||||||||||||||||||||||||||||||||||||||||||||||||||||||||||||||||||||||||||||||||||||||||||||||||||||||||||||||||||||||||||||||||||||||||||||||||||||||||||||||||||||||||||||||||||||||||||||||||||||||||||||||||||||||||||||||||||||||||||||||||||||||||||||||||||||||||||||||||||||||||||||||||||||||||||||||||||||||||||||||||||||||||||||||||||||||||||||||||||||||||||||||||||||||||||||||||||||||||||||||||||||||||||||||||||||||||||||||||||||||||||||||||||||||||||||||||||||||||||||||||||||||||||||||||||||||||||||||||||||||||||||||||||||||||||||||||||||||||||||||||||||||||||||||||||||||||||||||||||||||||||||||||||||||||||||||||||||||||||||||||||||||||||||||||||||||||||||||||||||||||||||||||||||||||||||||||||||||||||||||||||||||||||||||||||||||||||||||||||||||||||||||||||||||||||||||||||||||||||||||||||||||||||||||||||||||||||
1 Year Apollo Tactical Income Chart |
1 Month Apollo Tactical Income Chart |

It looks like you are not logged in. Click the button below to log in and keep track of your recent history.
Support: +44 (0) 203 8794 460 | support@advfn.com
By accessing the services available at ADVFN you are agreeing to be bound by ADVFN's Terms & Conditions
 Hot Features