0001527541FALSE00015275412024-03-052024-03-050001527541us-gaap:CommonStockMember2024-03-052024-03-050001527541us-gaap:SeriesBPreferredStockMember2024-03-052024-03-050001527541us-gaap:SeriesDPreferredStockMember2024-03-052024-03-050001527541us-gaap:ConvertibleSubordinatedDebtMember2024-03-052024-03-05
UNITED STATES
SECURITIES AND EXCHANGE COMMISSION
WASHINGTON, D.C. 20549
FORM 8-K
CURRENT REPORT
PURSUANT TO SECTION 13 OR 15(d) OF THE
SECURITIES EXCHANGE ACT OF 1934
Date of report (date of earliest event reported): March 5, 2024
WHEELER REAL ESTATE INVESTMENT TRUST, INC.
(Exact name of registrant as specified in its charter)
| | | | | | | | | | | | | | |
| Maryland | | 001-35713 | | 45-2681082 |
(State or other jurisdiction
of incorporation or organization) | | (Commission
File Number) | | (IRS Employer
Identification No.) |
| | | | | | | | |
2529 Virginia Beach Blvd. Virginia Beach, VA | | 23452 |
| (Address of principal executive offices) | | (Zip code) |
Registrant’s telephone number, including area code: (757) 627-9088
Check the appropriate box below if the Form 8-K filing is intended to simultaneously satisfy the filing obligations of the registrant under any of the following provisions:
| | | | | |
| ☐ | Written communications pursuant to Rule 425 under the Securities Act (17 CFR 230.425) |
| ☐ | Soliciting material pursuant to Rule 14a-12 under the Exchange Act (17 CFR 240.14a-12) |
| ☐ | Pre-commencement communications pursuant to Rule 14d-2(b) under the Exchange Act (17 CFR 240.14d-2(b)) |
| ☐ | Pre-commencement communications pursuant to Rule 13e-4(c) under the Exchange Act (17 CFR 240.13e-4(c)) |
Indicate by check mark whether the registrant is an emerging growth company as defined in Rule 405 of the Securities Act of 1933 (§230.405 of this chapter) or Rule 12b-2 of the Securities Exchange Act of 1934 (§240.12b-2 of this chapter).
Emerging growth company ☐
If an emerging growth company, indicate by check mark if the registrant has elected not to use the extended transition period for complying with any new or revised financial accounting standards provided pursuant to Section 13(a) of the Exchange Act. ☐
Securities registered pursuant to Section 12(b) of the Act:
| | | | | | | | | | | | | | |
| Title of each class | | Trading Symbol(s) | | Name of each exchange on which registered |
| Common Stock, $0.01 par value per share | | WHLR | | Nasdaq Capital Market |
| Series B Convertible Preferred Stock | | WHLRP | | Nasdaq Capital Market |
| Series D Cumulative Convertible Preferred Stock | | WHLRD | | Nasdaq Capital Market |
| 7.00% Subordinated Convertible Notes due 2031 | | WHLRL | | Nasdaq Capital Market |
Item 2.02 Results of Operations and Financial Condition.
On March 5, 2024, Wheeler Real Estate Investment Trust, Inc. (the “Company”), issued a press release announcing that it had reported its financial and operating results for the three and twelve months ended December 31, 2023. A copy of the press release is hereby furnished as Exhibit 99.1 to this report on Form 8-K.
The information contained in this Current Report on Form 8-K, including Exhibit 99.1, shall not be deemed "filed" with the Securities and Exchange Commission ("SEC") nor incorporated by reference in any registration statement filed by the Company under the Securities Act of 1933, as amended (the "Securities Act"), unless specified otherwise.
Item 7.01 Regulation FD Disclosure
On March 5, 2024, the Company made publicly available certain supplemental financial information for the three and twelve months ended December 31, 2023 on its investor relations website, https://ir.whlr.us/.
This supplemental financial information is hereby furnished as Exhibit 99.2 to this Current Report on Form 8-K. The information contained in this Current Report on Form 8-K, including Exhibit 99.2, shall not be deemed "filed" with the SEC nor incorporated by reference in any registration statement filed by the Company under the Securities Act unless specified otherwise. The information found on, or otherwise accessible through, the Company's website is not incorporated into, and does not form a part of, this Current Report on Form 8-K or any other report or document the Company files with or furnishes to the SEC.
Item 9.01 Financial Statements and Exhibits
(d) Exhibits
The following exhibits are included with this Report:
Exhibit No.
| | | | | | | | | | | | | | |
| 99.1 | |
| 99.2 | |
| 104 | Cover Page Interactive Data File (embedded within the Inline XBRL document) |
SIGNATURES
Pursuant to the requirements of the Securities Exchange Act of 1934, the registrant has duly caused this report to be signed on its behalf by the undersigned hereunto duly authorized.
| | | | | | | | |
| | |
| WHEELER REAL ESTATE INVESTMENT TRUST, INC. |
| |
| By: | | /s/ M. Andrew Franklin |
| | Name: M. Andrew Franklin |
| | Title: Chief Executive Officer and President |
Dated: March 5, 2024
WHEELER REAL ESTATE INVESTMENT TRUST, INC.
ANNOUNCES THE RELEASE OF ITS
FOURTH QUARTER AND YEAR-END 2023 FINANCIAL AND OPERATING RESULTS
Virginia Beach, Virginia – March 5, 2024 – Wheeler Real Estate Investment Trust, Inc. (NASDAQ:WHLR) (“WHLR” or the “Company”) announced today that it has reported its financial and operating results for the year ended December 31, 2023 on Form 10-K. In addition, the Company has posted supplemental information to its website regarding Wheeler Real Estate Investment Trust's financial and operating results for the three and twelve months ended December 31, 2023. Both the Form 10-K and the supplemental information can be accessed by visiting the Investor Relations website at https://ir.whlr.us/.
Contact
Investor Relations: investorrelations@whlr.us / (757) 627-9088
ABOUT WHEELER REAL ESTATE INVESTMENT TRUST, INC.
Headquartered in Virginia Beach, Virginia, Wheeler Real Estate Investment Trust, Inc. is a fully integrated, self-managed commercial real estate investment trust (REIT) focused on owning and operating income-producing retail properties with a primary focus on grocery-anchored centers. For more information on the Company, please visit www.whlr.us.
| | | | | |
| Table of Contents | |
| Page |
| Company Overview | |
| Financial and Portfolio Overview | |
| Financial and Operating Results | |
| Financial Summary | |
| Consolidated Balance Sheets | |
| Consolidated Statements of Operations | |
| Reconciliation of Non-GAAP Measures | |
| Debt Summary | |
| Portfolio Summary | |
| Property Summary | |
| Top Ten Tenants by Annualized Base Rent and Lease Expiration Schedule | |
| Leasing Summary | |
| Definitions | |
Forward-Looking Statements
This document contains forward-looking statements that are within the meaning of Section 27A of the Securities Act of 1933, as amended, and Section 21E of the Securities Exchange Act of 1934, as amended, and such statements are intended to be covered by the safe harbor. When used in this presentation, the words "continue," "may," "approximately," "potentially," or similar expressions, are intended to identify forward-looking statements. These forward-looking statements are based on current expectations, forecasts and assumptions that involve risks and uncertainties that could cause actual outcomes and results to differ materially. These risks include, without limitation: the use of and demand for retail space; general and economic business conditions, including those affecting the ability of individuals to spend in retail shopping centers and/or the rate and other terms on which we are able to lease our properties; the loss or bankruptcy of the Company's tenants; the state of the U.S. economy generally, or specifically in the Mid-Atlantic, Southeast and Northeast where our properties are geographically concentrated; consumer spending and confidence trends; availability, terms and deployment of capital; substantial dilution of our common stock, par value $0.01 ("Common Stock") and steep decline in its market value resulting from the exercise by the holders of our Series D Cumulative Convertible Preferred Stock (the "Series D Preferred Stock") of their redemption rights and downward adjustment of the conversion price on our outstanding 7.00% Subordinated Convertible Notes due 2031 (the "Convertible Notes"), each of which has already occurred and is anticipated to continue; the degree and nature of our competition; changes in governmental regulations, accounting rules, tax rates and similar matters; adverse economic or real estate developments in our markets of the Mid-Atlantic, Southeast and Northeast; the ability and willingness of the Company’s tenants and other third parties to satisfy their obligations under their respective contractual arrangements with the Company; the ability and willingness of the Company’s tenants to renew their leases with the Company upon expiration; the Company’s ability to re-lease its properties on the same or better terms in the event of non-renewal or in the event the Company exercises its right to replace an existing tenant, and obligations the Company may incur in connection with the replacement of an existing tenant; litigation risks generally; the risk that shareholder litigation in connection with the Cedar Acquisition (as defined in our Annual Report on Form 10-K for the period ended December 31, 2023) may result in significant costs of defense, indemnification and liability; financing risks, such as the Company’s inability to obtain new financing or refinancing on favorable terms as the
| | | | | |
WHLR | Financial & Operating Data | 2 |
result of market volatility or instability and increases in the Company’s borrowing costs as a result of changes in interest rates and other factors; the impact of the Company’s leverage on operating performance; risks related to the market for retail space generally, including reductions in consumer spending, variability in retailer demand for leased space, adverse impact of e-commerce, ongoing consolidation in the retail sector and changes in economic conditions and consumer confidence; risks endemic to real estate and the real estate industry generally; the adverse effect any future pandemic, endemic or outbreak of infectious diseases, and mitigation
efforts, including government-imposed lockdowns, to control their spread; risks to our information systems - or those of our tenants or vendors - from service interruption, misappropriation of data, breaches of security or information technology, or other cyber-related attacks; competitive risks; risks related to the geographic concentration of the Company’s properties in the Mid-Atlantic, Southeast and Northeast; the Company’s ability to maintain listing on Nasdaq Capital Market ("Nasdaq"); the effects of the one-for-ten reverse stock split of our Common Stock (which we refer to as the "Reverse Stock Split") on the trading market of our Common Stock; damage to the Company’s properties from catastrophic weather and other natural events, and the physical effects of climate change; the risk that an uninsured loss on the Company’s properties or a loss that exceeds the limits of the Company’s insurance policies could subject the Company to lost capital or revenue on those properties; the risk that continued increases in the cost of necessary insurance could negatively impact the Company's profitability; the Company’s ability and willingness to maintain its qualification as a real estate investment trust ("REIT") in light of economic, market, legal, tax and other considerations; the ability of our operating partnership, Wheeler REIT, L.P., and each of our other partnerships and limited liability companies to be classified as partnerships or disregarded entities for federal income tax purposes; the impact of e-commerce on our tenants’ business; and the inability to generate sufficient cash flows due to market conditions, competition, uninsured losses, changes in tax or other applicable laws.
The forward-looking statements contained in this document are based on our current expectations and beliefs concerning future developments and their potential effects on the Company. For a description of the risks and uncertainties that could impact the Company's future results, performance or transactions, see the reports filed by the Company with the Securities and Exchange Commission, including its quarterly reports on Form 10-Q and annual reports on Form 10-K. There can be no assurance that future developments affecting the Company will be those that the Company has anticipated. Except for ongoing obligations to disclose material information as required by the federal securities laws, the Company undertakes no obligation to release publicly any revisions to any forward-looking statements to reflect events or circumstances after the date hereof or to reflect the occurrence of unanticipated events. All of the above factors are difficult to predict, contain uncertainties that may materially affect the Company’s actual results and may be beyond the Company’s control. New factors emerge from time to time, and it is not possible for the Company’s management to predict all such factors or to assess the effects of each factor on the Company’s business. Accordingly, there can be no assurance that the Company’s current expectations will be realized.
| | | | | |
WHLR | Financial & Operating Data | 3 |
Company Overview
Headquartered in Virginia Beach, Virginia, Wheeler Real Estate Investment Trust, Inc. (NASDAQ: WHLR) is a fully-integrated, self-managed commercial real estate investment company focused on owning, leasing and operating income-producing retail properties with a primary focus on grocery-anchored centers. WHLR’s portfolio contains well-located, potentially dominant retail properties in secondary and tertiary markets that generate risk-adjusted returns. WHLR’s common stock, Series B convertible preferred stock, Series D cumulative convertible preferred stock, and 7% Subordinated Convertible Notes due 2031, trade publicly on Nasdaq under the symbols “WHLR”, “WHLRP”, "WHLRD", and "WHLRL", respectively.
Cedar Realty Trust, Inc. ("CDR" or "Cedar") is a subsidiary of WHLR. CDR's 7-1/4% Series B cumulative redeemable preferred stock ("CDR Series B Preferred") and 6-1/2% Series C cumulative redeemable preferred stock ("CDR Series C Preferred") trade publicly on the New York Stock Exchange ("NYSE") under the symbols "CDRpB" and "CDRpC", respectively and represent a noncontrolling interest to WHLR.
Accordingly, the use of the word "Company" refers to WHLR and its consolidated subsidiaries, which includes Cedar, except where the context otherwise requires.
| | | | | | | | |
| Corporate Headquarters | | |
| Wheeler Real Estate Investment Trust, Inc. | | |
2529 Virginia Beach Boulevard
Virginia Beach, VA 23452 | | |
Phone: (757) 627-9088
Toll Free: (866) 203-4864 | | |
| Website: www.whlr.us | | |
| | |
| Executive Management | | |
| M. Andrew Franklin - CEO and President | | |
| Crystal Plum - CFO | | |
| | |
| | |
| Board of Directors | | Board of Directors |
| Stefani D. Carter (Chair) | | Kerry G. Campbell (Chair) |
| E.J. Borrack | | E.J. Borrack |
| Kerry G. Campbell | | M. Andrew Franklin |
| Saverio M. Flemma | | Crystal Plum |
| Megan Parisi | | Paula Poskon |
| Dennis Pollack | | |
| Joseph D. Stilwell | | |
| | |
| Stock Transfer Agent and Registrar | | Stock Transfer Agent and Registrar |
Computershare Trust Company, N.A.
150 Royall Street, Suite 101
Canton, MA 02021
www.computershare.com | | Equiniti Trust Company, LLC
6201 15th Ave
Brooklyn, NY 11219
https://equiniti.com/us/ast-access |
| | |
| Investor Relations Representative | | |
investorrelations@whlr.us
Office: (757) 627-9088 | | |
| | | | | |
WHLR | Financial & Operating Data | 4 |
Financial and Portfolio Overview
All per share amounts, OP units and shares outstanding, warrants, and conversion features of the Convertible Notes for all periods presented reflect our one-for-ten Reverse Stock Split, which was effective August 17, 2023.
For the Three Months Ended December 31, 2023 (consolidated amounts unless otherwise noted)
| | | | | |
Financial Results | |
| Net income attributable to Wheeler REIT common stockholders (in 000s) | $ | 12,377 | |
| Net income per basic shares | $ | 0.55 | |
| Net income per diluted shares | $ | — | |
Funds from operations available to common stockholders and Operating Partnership (OP) unitholders (FFO) (in 000s) (1) | $ | 21,026 | |
| FFO per common share and OP unit | $ | 0.93 | |
Adjusted FFO (AFFO) (in 000s) (1) | $ | 1,428 | |
| AFFO per common share and OP unit | $ | 0.06 | |
| |
Assets and Leverage | |
| Investment Properties, net of $95.6 million accumulated depreciation (in 000s) | $ | 565,122 | |
| Cash and Cash Equivalents (in 000s) | $ | 18,404 | |
| Total Assets (in 000s) | $ | 668,332 | |
| Total Debt (in 000s) | $ | 495,572 | |
| Debt to Total Assets | 74.15 | % |
| Debt to Gross Asset Value | 64.15 | % |
| |
Market Capitalization | |
| Common shares outstanding | 53,769,787 | |
| OP units outstanding | 13,323 | |
| Total common shares and OP units | 53,783,110 | |
| | | | | | | | | | | | | | | | | |
Ticker | Shares Outstanding at December 31, 2023 | | Fourth Quarter stock price range | | Stock price as of December 31, 2023 |
| WHLR | 53,769,787 | | $0.16-$3.13 | | $ | 0.31 | |
| WHLRP | 3,379,142 | | $1.27-$1.85 | | $ | 1.30 | |
| WHLRD | 2,590,458 | | $9.50-$15.30 | | $ | 13.03 | |
| CDRpB | 1,450,000 | | $11.54-$16.38 | | $ | 12.93 | |
| CDRpC | 5,000,000 | | $10.18-$13.17 | | $ | 12.69 | |
| | | | | |
| Common Stock market capitalization (in 000s) | 16,669 | |
| | | | | | | | | | | |
Portfolio Summary | | | |
| Total Leasable Area (GLA) in sq. ft. | 5,309,936 | | | 2,832,129 | |
| Occupancy Rate | 93.6 | % | | 86.4 | % |
Leased Rate (2) | 95.9 | % | | 89.6 | % |
| Annualized Base Rent (in 000s) | $ | 49,819 | | | $ | 25,755 | |
| Total number of leases signed or renewed | 40 | | | 15 | |
| Total sq. ft. leases signed or renewed | 194,975 | | | 172,215 | |
(1) See page 25 for the Company's definition of this non-GAAP measurement and reasons for using it.
(2) Reflects leases executed through December 31, 2023 that commence subsequent to the end of the current reporting period.
| | | | | |
WHLR | Financial & Operating Data | as of 12/31/2023 unless otherwise stated | 5 |
Financial and Operating Results
Today, WHLR reported its financial and operating results for the three and twelve months ended December 31, 2023. For the three months ended December 31, 2023 and 2022, WHLR's net income (loss) attributable to WHLR's common stockholders for basic earnings per share was $0.55 per share and $(5.97) per share, respectively, and for dilutive earnings per share was $0.0 per share and $(5.97) per share, respectively. For the years ended December 31, 2023 and 2022, WHLR's net loss attributable to WHLR's common stockholders was $(4.57) per share and $(22.04) per share, respectively.
2023 FOURTH QUARTER HIGHLIGHTS
(All comparisons are to the same prior year period unless otherwise noted)
LEASING
•The Company's real estate portfolio was 91.1% occupied, a 70 basis point increase from 90.4%.
•The Company's real estate portfolio was 93.7% leased, a 80 basis point increase from 92.9%.
•The Company's real estate portfolio includes 38 properties that are 100% leased.
•WHLR Quarter-To-Date Leasing Activity
•Executed 26 lease renewals totaling 138,049 square feet at a weighted-average increase of $0.66 per square foot, representing an increase of 5.53% over in-place rental rates.
•Signed 14 new leases totaling 56,926 square feet with a weighted-average rental rate of $11.65 per square foot.
•The WHLR portfolio, excluding Cedar, was 93.6% occupied, a 110 basis point decrease from 94.7%.
•The WHLR portfolio, excluding Cedar, was 95.9% leased, a 60 basis point decrease from 96.5%.
•CDR Quarter-To-Date Leasing Activity
•Executed 3 lease renewals totaling 61,361 square feet at a weighted-average increase of $0.32 per square foot, representing an increase of 4.89% over in-place rental rates.
•Signed 12 new leases totaling 110,854 square feet with a weighted-average rental rate of $12.96 per square foot.
•The Cedar portfolio was 86.4% occupied, a 410 basis point increase from 82.3%.
•The Cedar portfolio was 89.6% leased, a 340 basis point increase from 86.2%
•The Company’s gross leasable area ("GLA"), which is subject to leases that expire over the next twelve months and includes month-to-month leases, increased to approximately 7.9%, compared to 6.8%. At December 31, 2023, 50.1% of this expiring GLA is subject to renewal options (a lease expiration schedule can be found on page 21 and provides additional details on the Company's leases).
OPERATIONS
•Total revenue of $26.2 million decreased by 2.7% or $0.7 million, primarily a result of:
•$0.6 million decrease in market lease amortization due to the Cedar Acquisition;
•$0.4 million decrease in nonrecurring revenue related to Cedar's recognition of easement revenue in 2022;
•$0.2 million decrease in rental revenue from properties sold in 2022; partially offset by
•$0.4 million increase in same-property revenues.
•Total operating expenses of $19.0 million decreased by 2.8% or $0.6 million, primarily a result of:
•$0.5 million decrease in depreciation and amortization;
•$0.2 million decrease in property operating expenses related to properties sold in 2022;
•$0.3 million decrease in property operating expenses related to Cedar; partially offset by
•$0.2 million increase in same-property operating expenses; and
•$0.2 million increase in corporate general and administrative expenses.
FINANCIAL
•Funds from operations ("FFO") of $21.0 million, or $0.93 per share of the Company's Common Stock and OP Units in our operating partnership, Wheeler REIT, L.P., as compared to FFO of $(0.9) million, or $(0.95) per share.
•Adjusted Funds from Operations ("AFFO") of $0.06 per share of the Company's Common Stock and OP Units in our operating partnership, Wheeler REIT, L.P., as compared to $1.91 per share.
SAME-PROPERTY NET OPERATING INCOME
•Same-property net operating income ("NOI" (1)), which excludes the impact of the Cedar portfolio, increased by 1.6% or $0.2 million. Same-property NOI was impacted by:
•$0.1 million increase in rental revenue, net change in credits losses from tenants;
•$0.3 million increase in other revenues due to termination fees;
(1) See page 25 for the Company's definition of this non-GAAP measurement and reasons for using it.
| | | | | |
WHLR | Financial & Operating Data | as of 12/31/2023 unless otherwise stated | 6 |
•$0.1 million savings in rent expense due to the Devine Street Land Acquisition (defined below), which terminated the Company's ground lease associated with this property; offset by a
•$0.3 million increase in property operating expenses necessary as part of financing requirements.
CAPITAL MARKETS
•Interest expense was $8.2 million and $11.0 million for the three months ended December 31, 2023 and 2022, respectively, representing an decrease of 25.7%. See page 17 for further details.
•Recognized a non-operating gain of $9.7 million in net changes in fair value of derivative liabilities, primarily due to adjustments in valuation assumptions associated with the embedded derivatives within the Convertible Notes.
OTHER
•On November 30, 2023, the Company subscribed for an additional investment in the amount of $3.5 million for limited partnership interests in Stilwell Activist Investments, L.P., a Delaware limited partnership (“SAI”). See page 8 for more details.
2023 YEAR-TO-DATE HIGHLIGHTS
(All comparisons to the same prior year period unless otherwise noted)
LEASING
•WHLR Year-To-Date Leasing Activity
•Executed 113 lease renewals totaling 818,292 square feet at a weighted-average increase of $0.58 per square foot, representing an increase of 6.46% over in-place rental rates.
•Signed 44 new leases totaling 210,924 square feet with a weighted-average rental rate of $12.06 per square foot.
•CDR Year-To-Date Leasing Activity
•Executed 23 lease renewals totaling 189,754 square feet at a weighted-average increase of $0.74 per square foot, representing an increase of 6.85% over in-place rental rates.
•Signed 26 new leases totaling 224,175 square feet with a weighted-average rental rate of $12.77 per square foot.
OPERATIONS
•Total revenue of $102.3 million increased by 33.5% or $25.7 million primarily a result of:
•$25.1 million increase in rental revenues, which is primarily due to a $21.1 million increase in property revenues from the Cedar Acquisition, partially offset by 2022 property sales;
•$2.8 million increase in market lease amortization; and
•$1.1 million increase in same-property revenues.
•Total operating expenses of $75.1 million increased by 37.5% or $20.5 million a result of:
•$9.1 million increase in property operations expense, primarily as a result of an increase of $7.6 million from the Cedar Acquisition, partially offset by 2022 property sales and an increase of $1.5 million in same-property expenses;
•$9.0 million increase in depreciation and amortization, primarily a result of the Cedar Acquisition;
•$3.1 million increase in corporate general and administrative expense, primarily a result of the Cedar Acquisition; partially offset by
•$0.8 million decrease in impairment, a result of one land parcel, Harbor Point, in 2022.
FINANCIAL
•FFO of $12.8 million, or $2.00 per share of the Company's Common Stock and OP Units in our operating partnership, Wheeler REIT, L.P., as compared to FFO of $(3.2) million, or $(3.18) per share.
•AFFO of $(0.04) per share of the Company's Common Stock and OP Units in our operating partnership, Wheeler REIT, L.P. as compared to $7.95 per share.
SAME-PROPERTY NET OPERATING INCOME
•Same-property NOI, which excludes the impact of the Cedar portfolio, decreased by 0.9% or $0.4 million. Same-property NOI was impacted by:
•$1.3 million increase in rental revenue driven by strong leasing activity;
•$0.3 million increase in other revenues due to termination fees and enterprise zone credits;
•$0.2 million savings in rent expense due to the purchase of the Devine Street Land Acquisition, which terminated the Company's ground lease associated with this property; offset by a
•$1.4 million increase in property operating expenses necessary as part of financing requirements;
•$0.3 million demolition of an outparcel building that was placed out of service; and
•$0.5 million increase in credit losses from tenants.
| | | | | |
WHLR | Financial & Operating Data | as of 12/31/2023 unless otherwise stated | 7 |
CAPITAL MARKETS
•On May 5, 2023, the Company entered into a loan agreement for $61.1 million at a fixed rate of 6.194% and interest-only payments due monthly through June 2025. Commencing in July 2025, until the maturity date of June 1, 2033, monthly principal and interest payments will be $0.4 million. Loan proceeds were used to refinance loans on 12 properties, including $1.1 million in defeasance.
•On May 18, 2023, the Company entered into a loan agreement for $53.1 million at a fixed rate of 6.24% and interest-only payments due monthly through June 2028. Commencing in July 2028, until the maturity date of June 10, 2033, monthly principal and interest payments will be $0.3 million. Loan proceeds were used to refinance loans on 8 properties, including $0.7 million in defeasance.
•The Company effected a one-for-ten Reverse Stock Split on August 17, 2023.
•On September 12, 2023, the Company entered into a term loan agreement (the "Timpany Plaza Loan Agreement") for $11.6 million at a fixed rate of 7.27% with interest-only payments due monthly for the first twelve months. Commencing on September 12, 2024, until the maturity date of September 12, 2028, monthly principal and interest payments will be made based on a 30-year amortization schedule calculated based on the principal amount as of that time. On the closing date, the Company received $9.1 million of the $11.6 million, and the remaining $2.5 million will be received upon the satisfaction of certain lease-related contingencies within one year of the agreement date. The Timpany Plaza Loan Agreement is collateralized by the Timpany Plaza shopping center.
•Interest expense was $32.3 million and $30.1 million for the twelve months ended December 31, 2023 and 2022, respectively, representing an increase of 7.3%. See page 17 for further details. Interest expense on the Convertible Notes included $1.6 million adjustment to fair value for interest paid with the shares of Series D Preferred Stock.
•Recognized a non-operating gain of $3.5 million in net changes in fair value of derivative liabilities, primarily due to adjustments in valuation assumptions associated with the embedded derivatives within the Convertible Notes.
•As of December 31, 2023, the Company paid down $1.5 million of the Convertible Notes through open market purchases of 58,784 units totaling $3.1 million, resulting in a $1.6 million loss included in non-operating expenses.
•As of December 5, 2023, the conversion price for the Convertible Notes was approximately $0.21 per share of the Company’s Common Stock (approximately 116.46 shares of Common Stock for each $25.00 of principal amount of the Convertible Notes being converted).
•Loans payable increased $13.1 million compared to December 31, 2022 and were impacted by:
•$9.1 million increase from the Timpany Plaza loan agreement completed in the third quarter;
•$7.3 million net increase from the two term loan agreements completed in the second quarter; partially offset by
•$1.5 million repurchase of debt securities; and
•$1.8 million monthly principal payments.
•Cash inflows provided by the three loans during 2023, net loan paydowns, were $14.6 million.
DISPOSITIONS
•On July 11, 2023, the Company sold a Rite-Aid outparcel adjacent to Carll's Corner, located in Bridgeton, New Jersey for $3.0 million, generating a gain of $2.2 million and net proceeds of $2.8 million.
OTHER
•The Company recognized non-operating expenses of $5.5 million, which consist of capital structure transaction costs.
•The Company subscribed for an investment in the amount of $10.0 million, in total, for a limited partnership interest in SAI. As of December 31, 2023, the fair value of the Company’s SAI investment was $10.7 million which includes the $10.0 million subscriptions, $0.2 million in fees and $0.7 million in unrealized gains, net of fees. This investment is presented on the line "investment securities - related party”, on the consolidated balance sheets. For more information see Note 4 in our Annual Report on Form 10-K for the period ended December 31, 2023.
•On August 18, 2023, the Company purchased the fee simple interest in the 3.25 acre land parcel known as Devine Street, located in Columbia, South Carolina, for $4.1 million (the "Devine Street Land Acquisition"). The Devine Street Land Acquisition terminated the Company's ground lease associated with this property, a savings of $0.3 million in annual ground rent.
•On December 7, 2023, the Company received a letter from the listing qualifications staff of Nasdaq notifying the Company that based on the Common Stock’s bid price closing below $1.00 per share for 30 consecutive business days, the Company no longer complied with Nasdaq’s bid price rule and that it had a 180-day compliance period until June 4, 2024 to regain compliance.
| | | | | |
WHLR | Financial & Operating Data | as of 12/31/2023 unless otherwise stated | 8 |
BALANCE SHEET
•Cash and cash equivalents totaled $18.4 million, compared to $28.5 million at December 31, 2022.
•Restricted cash totaled $21.4 million, compared to $27.4 million at December 31, 2022. The funds are held in lender reserves primarily for the purpose of tenant improvements, lease commissions, real estate taxes and insurance expenses.
•Debt totaled $495.6 million, compared to $482.4 million at December 31, 2022.
•The Company's weighted average interest rate on property level debt, excluding Cedar, was 5.20% with a term of 8.0 years, compared to 4.58% with a term of 6.2 years at December 31, 2022. The weighted average interest rate on all debt was 5.42% with a term of 8.2 years, compared to 4.99% with a term of 7.4 years at December 31, 2022.
•Net investment properties totaled $565.1 million compared to $561.0 million as of December 31, 2022.
•The Company invested $20.0 million in tenant improvements and capital expenditures into the properties.
DIVIDENDS
•Total cumulative dividends in arrears for WHLR's Series D Preferred Stock were $32.3 million or $12.48 per share as of December 31, 2023.
•On October 20, 2023, Cedar’s Board of Directors declared dividends of $0.453125 and $0.406250 per share with respect to the CDR Series B Preferred Stock and CDR Series C Preferred Stock, respectively. The distributions are payable on November 20, 2023 to shareholders of record of the CDR Series B Preferred Stock and CDR Series C Preferred Stock, as applicable, on November 10, 2023.
•On January 23, 2024, Cedar’s Board of Directors declared a dividend of $0.453125 and $0.406250 per share with respect to the Cedar’s Series B Preferred Stock and Series C Preferred Stock, respectively. The dividends are payable on February 20, 2024 to shareholders of record on February 9, 2024.
SERIES D PREFERRED STOCK REDEMPTIONS
•After September 21, 2023, each holder of Series D Preferred Stock of the Company has the right, at such holder’s option, to request that the Company redeem any or all of such holder’s shares of Series D Preferred Stock on a monthly basis ("Holder Redemption Date") – with redemptions commencing September 22, 2023 and the first Holder Redemption Date of October 5, 2023.
•During the year ended December 31, 2023, the Company processed 175 redemption requests, collectively redeeming 864,070 shares of Series D Preferred Stock. Accordingly, the Company issued 52,788,687 shares of Common Stock in settlement of an aggregate Redemption Price of approximately $32.7 million. At December 31, 2023, the Company had received requests to redeem 9,843 shares of Series D Preferred Stock. As such, the redemption of these Series D Preferred Stock is considered certain at December 31, 2023 and the liquidation value associated with these shares of $0.4 million is presented as a liability.
•The value of the Common Stock issued to holders redeeming their Series D Preferred Stock is the volume weighted average price per share of our Common Stock for the ten consecutive trading days immediately preceding, but not including, the Holder Redemption Date as reported on Nasdaq (the "VWAP"). During the year ended December 31, 2023, the Company has realized a gain of $9.9 million in the aggregate due to the closing price of the Common Stock on the last VWAP date differing from the VWAP used to calculate the shares issued in each redemption round.
SUBSEQUENT EVENTS
•On January 17, 2024, the Company paid down $0.6 million of the Convertible Notes through an open market purchase of 23,280 units at a total purchase price of $1.3 million.
•The Company has processed 84,561 shares of Series D Preferred Stock. Accordingly, the Company has issued 14,253,931 shares of Common Stock in settlement of an aggregate Redemption Price of approximately $3.2 million.
•On February 29, 2024, the Company entered into a revolving credit agreement with KeyBank National Association to draw up to $9.5 million (the "Cedar Revolving Credit Agreement"). The interest rate under the Cedar Revolving Credit Agreement is the daily SOFR, plus applicable margins of 0.10% plus 2.75%. Interest payments are due monthly, and principal is due at maturity on February 28, 2025. The Cedar Revolving Credit Agreement may be extended, at the Company's option, for up to two additional three-month periods, subject to customary conditions. The Cedar Revolving Credit Agreement is collateralized by 6 properties, consisting of Carll's Corner, Fieldstone Marketplace, Oakland Commons, Kings Plaza, Oregon Avenue and South Philadelphia, and proceeds will be used for capital expenditures and tenant improvements for such properties.
| | | | | |
WHLR | Financial & Operating Data | as of 12/31/2023 unless otherwise stated | 9 |
ADDITIONAL INFORMATION
The enclosed information should be read in conjunction with the Company's filings with the Securities and Exchange Commission, including, but not limited to, its quarterly and annual filings on Forms 10-Q and 10-K. These documents are or will be available upon filing via the U.S. Securities and Exchange Commission website (www.sec.gov) or through WHLR’s website at www.whlr.us.
| | | | | |
WHLR | Financial & Operating Data | as of 12/31/2023 unless otherwise stated | 10 |
Consolidated Balance Sheets
$ in 000s, except par value and share data
| | | | | | | | | | | |
| | December 31, |
| | 2023 | | 2022 |
| ASSETS: | | | |
| Real estate: | | | |
| Land and land improvements | $ | 149,908 | | | $ | 144,537 | |
| Buildings and improvements | 510,812 | | | 494,668 | |
| 660,720 | | | 639,205 | |
| Less accumulated depreciation | (95,598) | | | (78,225) | |
| Real estate, net | 565,122 | | | 560,980 | |
| | | |
| Cash and cash equivalents | 18,404 | | | 28,491 | |
| Restricted cash | 21,403 | | | 27,374 | |
| Receivables, net | 13,126 | | | 13,544 | |
| Investment securities - related party | 10,685 | | | — | |
| Above market lease intangibles, net | 2,114 | | | 3,134 | |
| Operating lease right-of-use assets | 9,450 | | | 15,133 | |
| Deferred costs and other assets, net | 28,028 | | | 35,880 | |
| Total Assets | $ | 668,332 | | | $ | 684,536 | |
| | | |
| LIABILITIES: | | | |
| Loans payable, net | $ | 477,574 | | | $ | 466,029 | |
| Below market lease intangible, net | 17,814 | | | 23,968 | |
| Derivative liabilities | 3,653 | | | 7,111 | |
| Operating lease liabilities | 10,329 | | | 16,478 | |
| Series D Preferred Stock redemptions | 369 | | | — | |
| Accounts payable, accrued expenses and other liabilities | 17,065 | | | 18,398 | |
| Total Liabilities | 526,804 | | | 531,984 | |
| Commitments and contingencies | | | |
| Series D Cumulative Convertible Preferred Stock | 96,705 | | | 101,518 | |
| EQUITY: | | | |
| Series A Preferred Stock (no par value, 4,500 shares authorized, 562 shares issued and outstanding; $0.6 million in aggregate liquidation value) | 453 | | | 453 | |
| Series B Convertible Preferred Stock (no par value, 5,000,000 authorized, 3,379,142 shares issued and outstanding; $84.5 million aggregate liquidation preference) | 44,998 | | | 44,911 | |
| Common Stock ($0.01 par value, 200,000,000 shares authorized, 53,769,787 and 979,396 shares issued and outstanding, respectively) | 538 | | | 10 | |
| Additional paid-in capital | 257,572 | | | 235,081 | |
| Accumulated deficit | (324,854) | | | (295,617) | |
| Total Stockholders’ Deficit | (21,293) | | | (15,162) | |
| Noncontrolling interests | 66,116 | | | 66,196 | |
| Total Equity | 44,823 | | | 51,034 | |
| Total Liabilities and Equity | $ | 668,332 | | | $ | 684,536 | |
| | | | | |
WHLR | Financial & Operating Data | as of 12/31/2023 unless otherwise stated | 11 |
Consolidated Statements of Operations
$ in 000s, except share and per share data
| | | | | | | | | | | | | | | | | | | | | | | |
| | Three Months Ended December 31, | | Years Ended December 31, |
| | 2023 | | 2022 | | 2023 | | 2022 |
| REVENUE: | | | | | | | |
| Rental revenues | $ | 25,594 | | | $ | 26,053 | | | $ | 100,332 | | | $ | 75,195 | |
| Other revenues | 621 | | | 898 | | | 1,993 | | | 1,450 | |
| Total Revenue | 26,215 | | | 26,951 | | | 102,325 | | | 76,645 | |
| OPERATING EXPENSES: | | | | | | | |
| Property operations | 8,802 | | | 9,094 | | | 34,870 | | | 25,731 | |
| Depreciation and amortization | 6,860 | | | 7,318 | | | 28,502 | | | 19,540 | |
| Impairment of assets held for sale | — | | | — | | | — | | | 760 | |
| Corporate general & administrative | 3,386 | | | 3,186 | | | 11,750 | | | 8,620 | |
| Total Operating Expenses | 19,048 | | | 19,598 | | | 75,122 | | | 54,651 | |
| Gain on disposal of properties | — | | | 2,619 | | | 2,204 | | | 2,604 | |
| Operating Income | 7,167 | | | 9,972 | | | 29,407 | | | 24,598 | |
| Interest income | 148 | | | 23 | | | 484 | | | 65 | |
| Gain on investment securities, net | 605 | | | — | | | 685 | | | — | |
| Interest expense | (8,189) | | | (11,028) | | | (32,314) | | | (30,107) | |
| Net changes in fair value of derivative liabilities | 9,739 | | | 198 | | | 3,458 | | | (2,335) | |
| Gain on preferred stock redemptions | 9,893 | | | — | | | 9,893 | | | — | |
| Other expense | (209) | | | — | | | (5,482) | | | (691) | |
| Net Income (Loss) Before Income Taxes | 19,154 | | | (835) | | | 6,131 | | | (8,470) | |
| Income tax expense | — | | | — | | | (48) | | | — | |
| Net Income (Loss) | 19,154 | | | (835) | | | 6,083 | | | (8,470) | |
| Less: Net income attributable to noncontrolling interests | 2,709 | | | 2,747 | | | 10,770 | | | 3,984 | |
| Net Income (Loss) Attributable to Wheeler REIT | 16,445 | | | (3,582) | | | (4,687) | | | (12,454) | |
| Preferred Stock dividends - undeclared | (2,322) | | | (2,264) | | | (9,262) | | | (9,056) | |
| Deemed distribution related to preferred stock redemptions | (1,746) | | | — | | | (15,288) | | | — | |
| Net Income (Loss) Attributable to Wheeler REIT Common Stockholders | $ | 12,377 | | | $ | (5,846) | | | $ | (29,237) | | | $ | (21,510) | |
| | | | | | | |
| Per common share: | | | | | | | |
Net Income (Loss) Attributable to Wheeler REIT Common Stockholders | | | | | | | |
| Basic | $ | 0.55 | | | $ | (5.97) | | | $ | (4.57) | | | $ | (22.04) | |
| Diluted | $ | — | | | $ | (5.97) | | | $ | (4.57) | | | $ | (22.04) | |
| | | | | | | |
| Weighted-average number of shares: | | | | | | | |
| Basic | 22,485,112 | | | 979,350 | | | 6,400,490 | | | 976,070 | |
| Diluted | 442,269,064 | | | 979,350 | | | 6,400,490 | | | 976,070 | |
| | | | | |
WHLR | Financial & Operating Data | as of 12/31/2023 unless otherwise stated | 12 |
Reconciliation of Non-GAAP Measures
Same-Property Net Operating Income (1)
$ in 000s
| | | | | | | | | | | | | | | | | | | | | | | |
| | Three Months Ended December 31, | | Year Ended December 31, |
| | 2023 | | 2022 | | 2023 | | 2022 |
| | | | | | | |
| Operating Income | $ | 7,167 | | | $ | 9,972 | | | $ | 29,407 | | | $ | 24,598 | |
| Adjustments: | | | | | | | |
| Gain on disposal of properties | — | | | (2,619) | | | (2,204) | | | (2,604) | |
| Corporate general & administrative | 3,386 | | | 3,186 | | | 11,750 | | | 8,620 | |
| Impairment of assets held for sale | — | | | — | | | — | | | 760 | |
| Depreciation and amortization | 6,860 | | | 7,318 | | | 28,502 | | | 19,540 | |
| Straight-line rents | (366) | | | (253) | | | (1,370) | | | (800) | |
| Above (below) market lease amortization, net | (984) | | | (1,601) | | | (4,849) | | | (2,079) | |
| Other non-property revenue | (4) | | | (9) | | | (135) | | | (23) | |
NOI related to properties not defined as same-properties(2) | (5,067) | | | (5,175) | | | (20,061) | | | (6,607) | |
| Same-Property Net Operating Income | $ | 10,992 | | | $ | 10,819 | | | $ | 41,040 | | | $ | 41,405 | |
| | | | | | | |
| | | | | | | |
| | | | | | | |
| | | | | | | |
(1) See page 25 for the Company's definition of this non-GAAP measurement and reasons for using it.
(2) The Company excluded the CDR portfolio and sold properties from the calculation of same-property NOI since they were not owned during all periods presented in their entirety.
| | | | | |
WHLR | Financial & Operating Data | as of 12/31/2023 unless otherwise stated | 13 |
Reconciliation of Non-GAAP Measures (continued)
FFO and AFFO (1)
$ in 000s, except share, unit and per share data
| | | | | | | | | | | | | | | | | | | | | | | | | | |
| Three Months Ended December 31, | | Years Ended December 31, |
| 2023 | | 2022 | | 2023 | | 2022 |
| Net Income (Loss) | $ | 19,154 | | | $ | (835) | | | $ | 6,083 | | | $ | (8,470) | |
| Depreciation and amortization of real estate assets | 6,860 | | | 7,318 | | | 28,502 | | | 19,540 | |
| Impairment of assets held for sale | — | | | — | | | — | | | 760 | |
| (Gain) loss on disposal of properties | — | | | (2,619) | | | (2,204) | | | (2,604) | |
| FFO | 26,014 | | | 3,864 | | | 32,381 | | | 9,226 | |
| Preferred stock dividends - undeclared | (2,322) | | | (2,264) | | | (9,262) | | | (9,056) | |
| Dividends on noncontrolling interests preferred stock | (2,688) | | | (2,688) | | | (10,752) | | | (3,913) | |
| Preferred stock accretion adjustments | 22 | | | 146 | | | 460 | | | 584 | |
| FFO available to common stockholders and common unitholders | 21,026 | | | (942) | | | 12,827 | | | (3,159) | |
| | | | | | | |
Other non-recurring and non-cash expenses (2) | 8 | | | (296) | | | 2,051 | | | 3,092 | |
| Gain on investment securities, net | (605) | | | — | | | (685) | | | — | |
| Net changes in fair value of derivative liabilities | (9,739) | | | (198) | | | (3,458) | | | 2,335 | |
| Gain on preferred stock redemptions | (9,893) | | | — | | | (9,893) | | | — | |
| Straight-line rental revenue, net straight-line expense | (383) | | | (245) | | | (1,380) | | | (768) | |
| Deferred financing cost amortization | 503 | | | 3,944 | | | 2,860 | | | 6,098 | |
| Paid-in-kind interest | 1,902 | | | 1,640 | | | 3,908 | | | 3,739 | |
| Above (below) market lease amortization, net | (984) | | | (1,601) | | | (4,849) | | | (2,079) | |
| Recurring capital expenditures and tenant improvement reserves | (407) | | | (406) | | | (1,628) | | | (1,354) | |
| AFFO | $ | 1,428 | | | $ | 1,896 | | | $ | (247) | | | $ | 7,904 | |
| | | | | | | |
| Weighted Average Common Shares | 22,485,112 | | | 979,350 | | | 6,400,490 | | | 976,070 | |
| Weighted Average Common Units | 13,400 | | | 14,494 | | | 14,047 | | | 17,730 | |
| Total Common Shares and Units | 22,498,512 | | | 993,844 | | | 6,414,537 | | | 993,800 | |
| FFO per Common Share and Common Units | $ | 0.93 | | | $ | (0.95) | | | $ | 2.00 | | | $ | (3.18) | |
| AFFO per Common Share and Common Units | $ | 0.06 | | | $ | 1.91 | | | $ | (0.04) | | | $ | 7.95 | |
(1) See page 25 for the Company's definition of this non-GAAP measurement and reasons for using it.
(2) Other non-recurring expenses are described in "Management's Discussion and Analysis of Financial Condition and Results of Operations" included in our Annual Report on Form 10-K for the year ended December 31, 2023.
| | | | | |
WHLR | Financial & Operating Data | as of 12/31/2023 unless otherwise stated | 14 |
Reconciliation of Non-GAAP Measures (continued)
EBITDA (4)
$ in 000s
| | | | | | | | | | | | | | | | | | | | | | | | | | |
| Three Months Ended December 31, | | Years Ended December 31, |
| 2023 | | 2022 | | 2023 | | 2022 |
Net Income (Loss) | $ | 19,154 | | | $ | (835) | | | $ | 6,083 | | | $ | (8,470) | |
Add back: | | | | | | | |
| Depreciation and amortization (1) | 5,876 | | | 5,717 | | | 23,653 | | | 17,461 | |
| Interest Expense (2) | 8,189 | | | 11,028 | | | 32,314 | | | 30,107 | |
| Income tax expense | — | | | — | | | 48 | | | — | |
EBITDA | 33,219 | | | 15,910 | | | 62,098 | | | 39,098 | |
| Adjustments for items affecting comparability: | | | | | | | |
| | | | | | | | |
| | | | | | | | |
| Net change in FMV of derivative liabilities | (9,739) | | | (198) | | | (3,458) | | | 2,335 | |
| Other non-recurring and non-cash expenses (3) | — | | | (303) | | | 259 | | | 366 | |
| | | | | | | | |
| Impairment of assets held for sale | — | | | — | | | — | | | 760 | |
| Gain on preferred stock redemptions | (9,893) | | | — | | | (9,893) | | | — | |
| Gain on investment securities, net | (605) | | | — | | | (685) | | | — | |
| Gain on disposal of properties | — | | | (2,619) | | | (2,204) | | | (2,604) | |
Adjusted EBITDA | $ | 12,982 | | | $ | 12,790 | | | $ | 46,117 | | | $ | 39,955 | |
(1) Includes above (below) market lease amortization.
(2) Includes deferred financing cost amortization.
(3) Other non-recurring expenses are described in "Management's Discussion and Analysis of Financial Condition and Results of Operations" included in our Annual Report on Form 10-K for the period ended December 31, 2023.
(4) See page 26 for the Company's definition of this non-GAAP measurement and reasons for using it.
| | | | | |
WHLR | Financial & Operating Data | as of 12/31/2023 unless otherwise stated | 15 |
Debt Summary
$ in 000s
| | | | | | | | | | | | | | | | | | | | | | | | | | | | | | | | |
| Property/Description | | Monthly Payment | | Interest
Rate | | Maturity | | December 31,
2023 | | December 31,
2022 |
| Cypress Shopping Center | | $ | 34,360 | | | 4.70% | | July 2024 | | $ | 5,769 | | | $ | 5,903 | |
| Conyers Crossing | | Interest only | | 4.67% | | October 2025 | | 5,960 | | | 5,960 | |
| Winslow Plaza | | $ | 24,295 | | | 4.82% | | December 2025 | | 4,331 | | | 4,409 | |
| Tuckernuck | | $ | 32,202 | | | 5.00% | | March 2026 | | 4,771 | | | 4,915 | |
| Chesapeake Square | | $ | 23,857 | | | 4.70% | | August 2026 | | 4,014 | | | 4,106 | |
| Sangaree/Tri-County | | $ | 32,329 | | | 4.78% | | December 2026 | | 5,990 | | | 6,086 | |
| Timpany Plaza | | Interest only | | 7.27% | | September 2028 | | 9,060 | | | — | |
| Village of Martinsville | | $ | 89,664 | | | 4.28% | | July 2029 | | 14,755 | | | 15,181 | |
| Laburnum Square | | Interest only | | 4.28% | | September 2029 | | 7,665 | | | 7,665 | |
| Rivergate (1) | | $ | 100,222 | | | 4.25% | | September 2031 | | 17,557 | | | 18,003 | |
| Convertible Notes | | Interest only | | 7.00% | | December 2031 | | 31,530 | | | 33,000 | |
| Term loan, 22 properties | | Interest only | | 4.25% | | July 2032 | | 75,000 | | | 75,000 | |
| JANAF (2) | | Interest only | | 5.31% | | July 2032 | | 60,000 | | | 60,000 | |
| Cedar term loan, 10 properties | | Interest only | | 5.25% | | November 2032 | | 110,000 | | | 110,000 | |
| Patuxent Crossing/Coliseum Marketplace | | Interest only | | 6.35% | | January 2033 | | 25,000 | | | 25,000 | |
| Term loan, 12 properties | | Interest only | | 6.19% | | June 2033 | | 61,100 | | | — | |
| Term loan, 8 properties | | Interest only | | 6.24% | | June 2033 | | 53,070 | | | — | |
| Term loans - fixed interest rate | | various | | 4.47% (3) | | various | | — | | | 107,219 | |
| Total Principal Balance | | | | | | | | 495,572 | | | 482,447 | |
| Unamortized deferred financing cost | | | | | | | | (17,998) | | | (16,418) | |
| Total Loans Payable, net | | | | | | | | $ | 477,574 | | | $ | 466,029 | |
(1) In October 2026, the interest rate under this loan changes to a variable interest rate equal to the 5 year U.S. Treasury Rate plus 2.70%, with a floor of 4.25%.
(2) Collateralized by JANAF properties.
(3) Contractual interest rate weighted average.
Total Debt
$ in 000s
| | | | | | | | | | | | | | |
| Scheduled principal repayments and maturities by year | | Amount | | % Total Principal Payments and Maturities |
| December 31, 2024 | | $ | 7,220 | | | 1.46 | % |
| December 31, 2025 | | 12,313 | | | 2.48 | % |
| December 31, 2026 | | 16,261 | | | 3.28 | % |
| December 31, 2027 | | 3,048 | | | 0.62 | % |
| December 31, 2028 | | 12,924 | | | 2.61 | % |
| Thereafter | | 443,806 | | | 89.55 | % |
| Total principal repayments and debt maturities | | $ | 495,572 | | | 100.00 | % |
| | | | |
| | | | | |
WHLR | Financial & Operating Data | as of 12/31/2023 unless otherwise stated | 16 |
Debt Summary (continued)
Interest Expense
$ in 000s
| | | | | | | | | | | | | | | | | | | | | | | | | | | | | | | | | | | | | | | | | | | | | | | |
| Three Months Ended December 31, | | Twelve Months Ended December 31, | | Three Months Ended Changes | | Twelve Months Ended Changes |
| 2023 | | 2022 | | 2023 | | 2022 | | Change | | % Change | | Change | | % Change |
| Property debt interest - excluding Cedar debt | $ | 4,303 | | | $ | 3,777 | | | $ | 16,153 | | | $ | 14,717 | | | $ | 526 | | | 13.9 | % | | $ | 1,436 | | | 9.8 | % |
Convertible Notes interest (1) | 1,339 | | | 1,062 | | | 3,908 | | | 3,739 | | | 277 | | | 26.1 | % | | 169 | | | 4.5 | % |
| Defeasance paid | — | | | — | | | 1,758 | | | 2,614 | | | — | | | — | % | | (856) | | | (32.7) | % |
| Amortization of deferred financing costs | 503 | | | 3,944 | | | 2,860 | | | 6,098 | | | (3,441) | | | (87.2) | % | | (3,238) | | | (53.1) | % |
| Property debt interest - Cedar | 2,044 | | | 2,245 | | | 7,635 | | | 2,939 | | | (201) | | | (9.0) | % | | 4,696 | | | 159.8 | % |
| Total Interest Expense | $ | 8,189 | | | $ | 11,028 | | | $ | 32,314 | | | $ | 30,107 | | | $ | (2,839) | | | (25.7) | % | | $ | 2,207 | | | 7.3 | % |
(1) Includes the fair value adjustment for the paid-in-kind interest.
| | | | | |
WHLR | Financial & Operating Data | as of 12/31/2023 unless otherwise stated | 17 |
Property Summary | | | | | | | | | | | | | | | | | | | | | | | | | | | | | | | | |
Property | | Location | | Number of
Tenants (1) | Total Leasable
Square Feet | Percentage
Leased (1) | Percentage Occupied | Total SF Occupied | Annualized
Base Rent (in 000's) (2) | Annualized Base Rent per Occupied Sq. Foot |
| WHLR | | | | | | | | | | |
| Alex City Marketplace | | Alexander City, AL | | 19 | | 151,843 | | 100.0 | % | 100.0 | % | 151,843 | | $ | 1,278 | | $ | 8.42 | |
| Amscot Building | | Tampa, FL | | 1 | | 2,500 | | 100.0 | % | 100.0 | % | 2,500 | | 83 | | 33.00 | |
| Beaver Ruin Village | | Lilburn, GA | | 29 | | 74,038 | | 96.8 | % | 94.8 | % | 70,148 | | 1,290 | | 18.39 | |
| Beaver Ruin Village II | | Lilburn, GA | | 4 | | 34,925 | | 100.0 | % | 100.0 | % | 34,925 | | 492 | | 14.08 | |
| Brook Run Shopping Center | | Richmond, VA | | 19 | | 147,738 | | 94.2 | % | 87.2 | % | 128,810 | | 1,133 | | 8.80 | |
| Brook Run Properties (3) | | Richmond, VA | | — | | — | | — | % | — | % | — | | — | | — | |
| Bryan Station | | Lexington, KY | | 9 | | 54,277 | | 94.5 | % | 94.5 | % | 51,275 | | 613 | | 11.95 | |
| Cardinal Plaza | | Henderson, NC | | 9 | | 50,000 | | 100.0 | % | 100.0 | % | 50,000 | | 508 | | 10.16 | |
| Chesapeake Square | | Onley, VA | | 14 | | 108,982 | | 92.1 | % | 92.1 | % | 100,406 | | 779 | | 7.76 | |
| Clover Plaza | | Clover, SC | | 10 | | 45,575 | | 100.0 | % | 100.0 | % | 45,575 | | 384 | | 8.42 | |
| Courtland Commons (3) | | Courtland, VA | | — | | — | | — | % | — | % | — | | — | | — | |
| Conyers Crossing | | Conyers, GA | | 14 | | 170,475 | | 100.0 | % | 100.0 | % | 170,475 | | 1,006 | | 5.90 | |
| Crockett Square | | Morristown, TN | | 4 | | 107,122 | | 100.0 | % | 100.0 | % | 107,122 | | 978 | | 9.13 | |
| Cypress Shopping Center | | Boiling Springs, SC | | 18 | | 80,435 | | 59.9 | % | 59.9 | % | 48,175 | | 622 | | 12.90 | |
| Darien Shopping Center | | Darien, GA | | 1 | | 26,001 | | 100.0 | % | 100.0 | % | 26,001 | | 140 | | 5.38 | |
| Devine Street | | Columbia, SC | | 1 | | 38,464 | | 89.1 | % | 89.1 | % | 34,264 | | 180 | | 5.25 | |
| Edenton Commons (3) | | Edenton, NC | | — | | — | | — | % | — | % | — | | — | | — | |
| Folly Road | | Charleston, SC | | 5 | | 47,794 | | 100.0 | % | 100.0 | % | 47,794 | | 735 | | 15.39 | |
| Forrest Gallery | | Tullahoma, TN | | 26 | | 214,451 | | 89.5 | % | 89.5 | % | 191,859 | | 1,445 | | 7.53 | |
| Fort Howard Shopping Center | | Rincon, GA | | 20 | | 113,652 | | 100.0 | % | 100.0 | % | 113,652 | | 1,283 | | 11.29 | |
| Freeway Junction | | Stockbridge, GA | | 18 | | 156,834 | | 98.2 | % | 98.2 | % | 154,034 | | 1,351 | | 8.77 | |
| Franklin Village | | Kittanning, PA | | 24 | | 151,821 | | 93.3 | % | 93.3 | % | 141,573 | | 1,359 | | 9.60 | |
| Franklinton Square | | Franklinton, NC | | 15 | | 65,366 | | 100.0 | % | 100.0 | % | 65,366 | | 599 | | 9.17 | |
| Georgetown | | Georgetown, SC | | 2 | | 29,572 | | 100.0 | % | 100.0 | % | 29,572 | | 267 | | 9.04 | |
| Grove Park Shopping Center | | Orangeburg, SC | | 14 | | 93,265 | | 100.0 | % | 100.0 | % | 93,265 | | 764 | | 8.19 | |
| Harbor Point (3) | | Grove, OK | | — | | — | | — | % | — | % | — | | — | | — | |
| Harrodsburg Marketplace | | Harrodsburg, KY | | 8 | | 60,048 | | 91.0 | % | 91.0 | % | 54,648 | | 465 | | 8.51 | |
| JANAF (4) | | Norfolk, VA | | 118 | | 798,086 | | 94.3 | % | 89.9 | % | 717,171 | | 8,993 | | 12.54 | |
| Laburnum Square | | Richmond, VA | | 20 | | 109,405 | | 99.1 | % | 99.1 | % | 108,445 | | 1,011 | | 9.33 | |
| Ladson Crossing | | Ladson, SC | | 16 | | 52,607 | | 100.0 | % | 100.0 | % | 52,607 | | 566 | | 10.75 | |
| LaGrange Marketplace | | LaGrange, GA | | 13 | | 76,594 | | 91.8 | % | 91.8 | % | 70,300 | | 435 | | 6.19 | |
| Lake Greenwood Crossing | | Greenwood, SC | | 8 | | 43,618 | | 100.0 | % | 100.0 | % | 43,618 | | 410 | | 9.41 | |
| Lake Murray | | Lexington, SC | | 4 | | 39,218 | | 100.0 | % | 15.3 | % | 6,000 | | 96 | | 15.98 | |
| Litchfield Market Village | | Pawleys Island, SC | | 25 | | 86,740 | | 98.5 | % | 98.5 | % | 85,477 | | 1,085 | | 12.70 | |
| Lumber River Village | | Lumberton, NC | | 11 | | 66,781 | | 100.0 | % | 100.0 | % | 66,781 | | 501 | | 7.51 | |
| Moncks Corner | | Moncks Corner, SC | | 1 | | 26,800 | | 100.0 | % | 100.0 | % | 26,800 | | 330 | | 12.31 | |
| Nashville Commons | | Nashville, NC | | 12 | | 56,100 | | 100.0 | % | 100.0 | % | 56,100 | | 665 | | 11.86 | |
| New Market Crossing | | Mt. Airy, NC | | 13 | | 117,076 | | 100.0 | % | 100.0 | % | 117,076 | | 1,045 | | 8.93 | |
| Parkway Plaza | | Brunswick, GA | | 5 | | 52,365 | | 84.8 | % | 84.8 | % | 44,385 | | 480 | | 10.81 | |
| Pierpont Centre | | Morgantown, WV | | 15 | | 111,162 | | 98.5 | % | 98.5 | % | 109,437 | | 1,063 | | 9.71 | |
| Port Crossing | | Harrisonburg, VA | | 8 | | 65,365 | | 100.0 | % | 100.0 | % | 65,365 | | 865 | | 13.23 | |
| Ridgeland | | Ridgeland, SC | | 1 | | 20,029 | | 100.0 | % | 100.0 | % | 20,029 | | 140 | | 7.00 | |
| Riverbridge Shopping Center | | Carrollton, GA | | 10 | | 91,188 | | 96.9 | % | 95.4 | % | 86,975 | | 721 | | 8.29 | |
| Rivergate Shopping Center | | Macon, GA | | 24 | | 193,960 | | 87.5 | % | 85.8 | % | 166,362 | | 2,338 | | 14.05 | |
| Sangaree Plaza | | Summerville, SC | | 10 | | 66,948 | | 100.0 | % | 100.0 | % | 66,948 | | 716 | | 10.70 | |
| Shoppes at Myrtle Park | | Bluffton, SC | | 14 | | 56,609 | | 99.3 | % | 99.3 | % | 56,189 | | 687 | | 12.23 | |
| South Lake | | Lexington, SC | | 11 | | 44,318 | | 100.0 | % | 100.0 | % | 44,318 | | 259 | | 5.84 | |
| South Park | | Mullins, SC | | 3 | | 60,734 | | 84.9 | % | 84.9 | % | 51,543 | | 365 | | 7.08 | |
| South Square | | Lancaster, SC | | 6 | | 44,350 | | 81.0 | % | 81.0 | % | 35,900 | | 305 | | 8.49 | |
| St. George Plaza | | St. George, SC | | 9 | | 59,174 | | 100.0 | % | 100.0 | % | 59,174 | | 466 | | 7.87 | |
| Sunshine Plaza | | Lehigh Acres, FL | | 23 | | 111,189 | | 100.0 | % | 100.0 | % | 111,189 | | 1,113 | | 10.01 | |
| Surrey Plaza | | Hawkinsville, GA | | 4 | | 42,680 | | 100.0 | % | 100.0 | % | 42,680 | | 258 | | 6.05 | |
| | | | | |
WHLR | Financial & Operating Data | as of 12/31/2023 unless otherwise stated | 18 |
Property Summary (continued)
| | | | | | | | | | | | | | | | | | | | | | | | | | | | | | | | |
Property | | Location | | Number of Tenants (1) | Total Leasable Square Feet | Percentage Leased (1) | Percentage Occupied | Total SF Occupied | Annualized Base Rent (in 000's) (2) | Annualized Base Rent per Occupied Sq. Foot |
| Tampa Festival | | Tampa, FL | | 21 | | 141,580 | | 100.0 | % | 74.9 | % | 105,980 | | $ | 1,029 | | $ | 9.71 | |
| Tri-County Plaza | | Royston, GA | | 7 | | 67,577 | | 90.7 | % | 90.7 | % | 61,277 | | 434 | | 7.08 | |
| Tuckernuck | | Richmond, VA | | 16 | | 93,391 | | 96.9 | % | 96.9 | % | 90,462 | | 1,057 | | 11.69 | |
| Twin City Commons | | Batesburg-Leesville, SC | | 5 | | 47,680 | | 100.0 | % | 100.0 | % | 47,680 | | 490 | | 10.27 | |
| Village of Martinsville | | Martinsville, VA | | 22 | | 288,254 | | 100.0 | % | 100.0 | % | 288,254 | | 2,441 | | 8.47 | |
| Waterway Plaza | | Little River, SC | | 10 | | 49,750 | | 100.0 | % | 100.0 | % | 49,750 | | 505 | | 10.15 | |
| Westland Square | | West Columbia, SC | | 12 | | 62,735 | | 100.0 | % | 100.0 | % | 62,735 | | 533 | | 8.50 | |
| Winslow Plaza | | Sicklerville, NJ | | 18 | | 40,695 | | 100.0 | % | 100.0 | % | 40,695 | | 663 | | 16.30 | |
| | WHLR TOTAL | | 779 | | 5,309,936 | | 95.9 | % | 93.6 | % | 4,970,984 | | $ | 49,819 | | $ | 10.02 | |
| CDR | | | | | | | | | | |
| Brickyard Plaza | | Berlin, CT | | 10 | | 227,598 | | 97.8 | % | 97.8 | % | 222,598 | | $ | 2,024 | | $ | 9.09 | |
| Carll's Corner | | Bridgeton, NJ | | 5 | | 116,532 | | 19.4 | % | 19.4 | % | 22,554 | | 267 | | 11.84 | |
| Coliseum Marketplace | | Hampton, VA | | 9 | | 106,648 | | 94.9 | % | 94.9 | % | 101,198 | | 1,217 | | 12.03 | |
| Fairview Commons | | New Cumberland, PA | | 11 | | 50,119 | | 87.7 | % | 87.7 | % | 43,969 | | 512 | | 11.63 | |
| Fieldstone Marketplace | | New Bedford, MA | | 10 | | 193,970 | | 75.5 | % | 71.7 | % | 139,139 | | 1,655 | | 11.90 | |
| Gold Star Plaza | | Shenandoah, PA | | 7 | | 71,720 | | 100.0 | % | 100.0 | % | 71,720 | | 642 | | 8.95 | |
| Golden Triangle | | Lancaster, PA | | 19 | | 202,790 | | 98.4 | % | 98.4 | % | 199,605 | | 2,619 | | 13.12 | |
| Hamburg Square | | Hamburg, PA | | 7 | | 102,058 | | 100.0 | % | 100.0 | % | 102,058 | | 689 | | 6.75 | |
| Kings Plaza | | New Bedford, MA | | 17 | | 168,243 | | 98.5 | % | 98.5 | % | 165,743 | | 1,444 | | 8.71 | |
| Oakland Commons | | Bristol, CT | | 2 | | 90,100 | | 100.0 | % | 100.0 | % | 90,100 | | 574 | | 6.37 | |
| Oregon Avenue (5) | | Philadelphia, PA | | — | | — | | — | % | — | % | — | | — | | — | |
| Patuxent Crossing | | California, MD | | 27 | | 264,068 | | 81.6 | % | 81.6 | % | 215,589 | | 2,646 | | 12.27 | |
| Pine Grove Plaza | | Brown Mills, NJ | | 13 | | 79,306 | | 77.6 | % | 77.6 | % | 61,526 | | 742 | | 12.05 | |
| South Philadelphia | | Philadelphia, PA | | 10 | | 221,511 | | 88.1 | % | 68.3 | % | 151,388 | | 1,432 | | 9.46 | |
| Southington Center | | Southington, CT | | 11 | | 155,842 | | 100.0 | % | 100.0 | % | 155,842 | | 1,288 | | 8.27 | |
| Timpany Plaza | | Gardner, MA | | 14 | | 182,799 | | 81.8 | % | 63.3 | % | 115,735 | | 1,121 | | 9.68 | |
| Trexler Mall | | Trexlertown, PA | | 22 | | 342,541 | | 99.7 | % | 98.9 | % | 338,788 | | 3,710 | | 10.95 | |
| Washington Center Shoppes | | Sewell, NJ | | 29 | | 157,300 | | 97.5 | % | 95.9 | % | 150,800 | | 1,895 | | 12.56 | |
| Webster Commons | | Webster, MA | | 9 | | 98,984 | | 100.0 | % | 100.0 | % | 98,984 | | 1,278 | | 12.91 | |
| | CDR TOTAL | | 232 | | 2,832,129 | | 89.6 | % | 86.4 | % | 2,447,336 | | $ | 25,755 | | $ | 10.52 | |
| | | | | | | | | | |
| | COMBINED TOTAL | | 1,011 | | 8,142,065 | | 93.7 | % | 91.1 | % | 7,418,320 | | $ | 75,574 | | $ | 10.19 | |
| | | | | | | | | | |
(1) Reflects leases executed through December 31, 2023 that commence subsequent to the end of the current reporting period.
(2) Annualized based rent per occupied square foot; assumes base rent as of the end of the current reporting period; excludes the impact of tenant concessions and rent abatements.
(3) This information is not available because the property is undeveloped.
(4) Square footage is net of the Company's on-premise management office and net of building square footage whereby the Company only leases the land.
(5) Includes property where a redevelopment opportunity exists.
| | | | | |
WHLR | Financial & Operating Data | as of 12/31/2023 unless otherwise stated | 19 |
Property Summary (continued)
| | | | | |
WHLR | Financial & Operating Data | as of 12/31/2023 unless otherwise stated | 20 |
Top Ten Tenants by Annualized Base Rent
| | | | | | | | | | | | | | | | | | | | | | | | | | | | | | | | | | | | | | | | | |
| Tenants | | Category | | Annualized Base Rent
($ in 000s) | | % of Total Annualized Base Rent | | Total Occupied Square Feet | | Percent Total Leasable Square Foot | | Annualized Base Rent Per Occupied Square Foot |
| Food Lion | | Grocery | | $ | 4,476 | | | 5.92 | % | | 549,000 | | | 6.74 | % | | $ | 8.15 | |
| Dollar Tree (1) | | Discount Retailer | | 2,214 | | | 2.93 | % | | 255,000 | | | 3.13 | % | | 8.68 | |
| Kroger Co (2) | | Grocery | | 2,097 | | | 2.77 | % | | 239,000 | | | 2.94 | % | | 8.77 | |
| TJX Companies (3) | | Discount Retailer | | 1,703 | | | 2.25 | % | | 195,000 | | | 2.39 | % | | 8.73 | |
| Planet Fitness | | Gym | | 1,497 | | | 1.98 | % | | 140,000 | | | 1.72 | % | | 10.69 | |
| Piggly Wiggly | | Grocery | | 1,363 | | | 1.80 | % | | 170,000 | | | 2.09 | % | | 8.02 | |
| Lowes Foods (4) | | Grocery | | 1,223 | | | 1.62 | % | | 130,000 | | | 1.60 | % | | 9.41 | |
| Big Lots | | Discount Retailer | | 1,100 | | | 1.46 | % | | 171,000 | | | 2.10 | % | | 6.43 | |
| Kohl's | | Discount Retailer | | 1,031 | | | 1.36 | % | | 147,000 | | | 1.81 | % | | 7.01 | |
| Winn Dixie | | Grocery | | 984 | | | 1.30 | % | | 134,000 | | | 1.65 | % | | 7.34 | |
| | | | | $ | 17,688 | | | 23.39 | % | | 2,130,000 | | | 26.17 | % | | $ | 8.30 | |
(1) Dollar Tree 18 / Family Dollar 7
(2) Kroger 4 / Harris Teeter 1 / 3 fuel stations
(3) Marshall's 4 / HomeGoods 2 / TJ Maxx 1
(4) Lowes Foods 1 / KJ's Market 2
Lease Expiration Schedule | | | | | | | | | | | | | | | | | | | | | | | | | | | | | | | | | | | | | | | | | | | | |
| Lease Expiration Period | | Number of Expiring Leases | | Total Expiring Square Footage | | % of Total Expiring Square Footage | | % of Total Occupied Square Footage Expiring | | Expiring Annualized Base Rent (in 000s) | | % of Total Annualized Base Rent | | Expiring Base Rent Per Occupied
Square Foot |
| Available | | — | | | 723,745 | | | 8.89 | % | | — | % | | $ | — | | | — | % | | $ | — | |
| MTM | | 16 | | | 75,333 | | | 0.93 | % | | 1.02 | % | | 620 | | | 0.82 | % | | 8.23 | |
| 2024 | | 145 | | | 570,852 | | | 7.01 | % | | 7.70 | % | | 6,634 | | | 8.78 | % | | 11.62 | |
| 2025 | | 159 | | | 904,927 | | | 11.11 | % | | 12.20 | % | | 9,635 | | | 12.75 | % | | 10.65 | |
| 2026 | | 170 | | | 910,565 | | | 11.18 | % | | 12.27 | % | | 9,962 | | | 13.18 | % | | 10.94 | |
| 2027 | | 139 | | | 691,220 | | | 8.49 | % | | 9.32 | % | | 8,711 | | | 11.53 | % | | 12.60 | |
| 2028 | | 143 | | | 1,345,729 | | | 16.53 | % | | 18.14 | % | | 12,592 | | | 16.66 | % | | 9.36 | |
| 2029 | | 74 | | | 745,647 | | | 9.16 | % | | 10.05 | % | | 6,970 | | | 9.22 | % | | 9.35 | |
| 2030 | | 43 | | | 636,575 | | | 7.82 | % | | 8.58 | % | | 4,884 | | | 6.46 | % | | 7.67 | |
| 2031 | | 32 | | | 441,000 | | | 5.42 | % | | 5.94 | % | | 4,288 | | | 5.67 | % | | 9.72 | |
| 2032 | | 32 | | | 390,668 | | | 4.80 | % | | 5.27 | % | | 3,442 | | | 4.55 | % | | 8.81 | |
| 2033 & thereafter | | 58 | | | 705,804 | | | 8.66 | % | | 9.51 | % | | 7,836 | | | 10.38 | % | | 11.10 | |
| Total | | 1,011 | | | 8,142,065 | | | 100.00 | % | | 100.00 | % | | $ | 75,574 | | | 100.00 | % | | $ | 10.19 | |
| | | | | |
WHLR | Financial & Operating Data | as of 12/31/2023 unless otherwise stated | 21 |
Leasing Summary
Anchor Lease Expiration Schedule (1)
| | | | | | | | | | | | | | | | | | | | | | | | | | | | | | | | | | | |
| No Option | | Option |
| Lease Expiration Period | Number of Expiring Leases | Expiring Occupied Square Footage | Expiring Annualized Based Rent (in 000s) | % of Total Annualized Base Rent | Expiring Base Rent per Square Foot | | Number of Expiring Leases | Expiring Occupied Square Footage | Expiring Annualized Based Rent (in 000s) | % of Total Annualized Base Rent | Expiring Base Rent per Square Foot |
| Available | — | | 224,644 | | $ | — | | — | % | $ | — | | | — | | — | | $ | — | | — | % | $ | — | |
| Month-to-Month | 2 | | 54,564 | | 297 | | 9.34 | % | 5.44 | | | — | | — | | — | | — | % | — | |
| 2024 | 1 | | 32,000 | | 125 | | 3.93 | % | 3.91 | | | 5 | | 188,460 | | 1,823 | | 6.10 | % | 9.67 | |
| 2025 | 2 | | 57,297 | | 455 | | 14.31 | % | 7.94 | | | 10 | | 392,913 | | 2,888 | | 9.67 | % | 7.35 | |
| 2026 | 1 | | 20,152 | | 97 | | 3.05 | % | 4.81 | | | 14 | | 456,864 | | 3,822 | | 12.80 | % | 8.37 | |
| 2027 | 3 | | 69,819 | | 629 | | 19.78 | % | 9.01 | | | 5 | | 149,546 | | 1,505 | | 5.04 | % | 10.06 | |
| 2028 | 1 | | 23,876 | | 116 | | 3.65 | % | 4.86 | | | 22 | | 905,141 | | 6,438 | | 21.56 | % | 7.11 | |
| 2029 | 2 | | 48,789 | | 517 | | 16.26 | % | 10.60 | | | 11 | | 397,013 | | 2,819 | | 9.44 | % | 7.10 | |
| 2030 | — | | — | | — | | — | % | — | | | 9 | | 509,504 | | 2,810 | | 9.41 | % | 5.52 | |
| 2031 | 1 | | 20,858 | | 60 | | 1.89 | % | 2.88 | | | 6 | | 280,528 | | 2,471 | | 8.27 | % | 8.81 | |
| 2032 | — | | — | | — | | — | % | — | | | 8 | | 273,568 | | 1,736 | | 5.81 | % | 6.35 | |
| 2033+ | 3 | | 109,605 | | 884 | | 27.79 | % | 8.07 | | | 11 | | 461,984 | | 3,555 | | 11.90 | % | 7.70 | |
| Total | 16 | | 661,604 | | $ | 3,180 | | 100.00 | % | $ | 7.28 | | | 101 | | 4,015,521 | | $ | 29,867 | | 100.00 | % | $ | 7.44 | |
(1) Anchors defined as leases occupying 20,000 square feet or more.
Non-anchor Lease Expiration Schedule
| | | | | | | | | | | | | | | | | | | | | | | | | | | | | | | | | | | |
| No Option | | Option |
| Lease Expiration Period | Number of Expiring Leases | Expiring Occupied Square Footage | Expiring Annualized Based Rent (in 000s) | % of Total Annualized Base Rent | Expiring Base Rent per Square Foot | | Number of Expiring Leases | Expiring Occupied Square Footage | Expiring Annualized Based Rent (in 000s) | % of Total Annualized Base Rent | Expiring Base Rent per Square Foot |
| Available | — | | 499,101 | | $ | — | | — | % | $ | — | | | — | | — | | $ | — | | — | % | $ | — | |
| Month-to-Month | 14 | | 20,769 | | 323 | | 1.77 | % | 15.55 | | | — | | — | | — | | — | % | — | |
| 2024 | 93 | | 214,904 | | 2,634 | | 14.41 | % | 12.26 | | | 46 | | 135,488 | | 2,052 | | 8.46 | % | 15.15 | |
| 2025 | 92 | | 222,274 | | 2,920 | | 15.97 | % | 13.14 | | | 55 | | 232,443 | | 3,372 | | 13.91 | % | 14.51 | |
| 2026 | 103 | | 242,889 | | 3,294 | | 18.02 | % | 13.56 | | | 52 | | 190,660 | | 2,749 | | 11.34 | % | 14.42 | |
| 2027 | 81 | | 218,241 | | 3,427 | | 18.75 | % | 15.70 | | | 50 | | 253,614 | | 3,150 | | 12.99 | % | 12.42 | |
| 2028 | 66 | | 158,926 | | 2,689 | | 14.71 | % | 16.92 | | | 54 | | 257,786 | | 3,349 | | 13.81 | % | 12.99 | |
| 2029 | 21 | | 62,030 | | 689 | | 3.77 | % | 11.11 | | | 40 | | 237,815 | | 2,945 | | 12.15 | % | 12.38 | |
| 2030 | 16 | | 34,508 | | 698 | | 3.82 | % | 20.23 | | | 18 | | 92,563 | | 1,376 | | 5.67 | % | 14.87 | |
| 2031 | 5 | | 10,578 | | 186 | | 1.02 | % | 17.58 | | | 20 | | 129,036 | | 1,571 | | 6.48 | % | 12.17 | |
| 2032 | 12 | | 48,586 | | 597 | | 3.27 | % | 12.29 | | | 12 | | 68,514 | | 1,109 | | 4.57 | % | 16.19 | |
| 2033+ | 16 | | 36,343 | | 823 | | 4.49 | % | 22.65 | | | 28 | | 97,872 | | 2,574 | | 10.62 | % | 26.30 | |
| Total | 519 | | 1,769,149 | | $ | 18,280 | | 100.00 | % | $ | 14.39 | | | 375 | | 1,695,791 | | $ | 24,247 | | 100.00 | % | $ | 14.30 | |
| | | | | |
WHLR | Financial & Operating Data | as of 12/31/2023 unless otherwise stated | 22 |
Leasing Summary (continued)
WHLR Leasing Renewals and New Leases
| | | | | | | | | | | | | | | | | | | | | | | |
| Three Months Ended December 31, | | Twelve Months Ended December 31, |
| 2023 | | 2022 | | 2023 | | 2022 |
Renewals(1): | | | | | | | |
| Leases renewed with rate increase (sq feet) | 53,253 | | | 212,108 | | | 530,762 | | | 551,939 | |
| Leases renewed with rate decrease (sq feet) | — | | | 3,744 | | | — | | | 33,548 | |
| Leases renewed with no rate change (sq feet) | 84,796 | | | 1,800 | | | 287,530 | | | 219,511 | |
| Total leases renewed (sq feet) | 138,049 | | | 217,652 | | | 818,292 | | | 804,998 | |
| | | | | | | |
| Leases renewed with rate increase (count) | 22 | | | 25 | | | 96 | | | 92 | |
| Leases renewed with rate decrease (count) | — | | | 1 | | | — | | | 9 | |
| Leases renewed with no rate change (count) | 4 | | | 1 | | | 17 | | | 25 | |
| Total leases renewed (count) | 26 | | | 27 | | | 113 | | | 126 | |
| | | | | | | |
| Option exercised (count) | 8 | | | 5 | | | 26 | | | 16 | |
| | | | | | | |
| Weighted average on rate increases (per sq foot) | $ | 1.72 | | | $ | 0.99 | | | $ | 0.90 | | | $ | 1.16 | |
| Weighted average on rate decreases (per sq foot) | $ | — | | | $ | (1.51) | | | $ | — | | | $ | (1.94) | |
| Weighted average rate on all renewals (per sq foot) | $ | 0.66 | | | $ | 0.94 | | | $ | 0.58 | | | $ | 0.71 | |
| | | | | | | |
| Weighted average change over prior rates | 5.53 | % | | 9.19 | % | | 6.46 | % | | 7.73 | % |
| | | | | | | |
New Leases(1) (2): | | | | | | | |
| New leases (sq feet) | 56,926 | | | 70,232 | | | 210,924 | | | 214,936 | |
| New leases (count) | 14 | | | 14 | | | 44 | | | 65 | |
| Weighted average rate (per sq foot) | $ | 11.65 | | | $ | 9.78 | | | $ | 12.06 | | | $ | 11.88 | |
(1) Lease data presented is based on average rate per square foot over the renewed or new lease term.
(2) The Company does not include ground leases entered into for the purposes of new lease sq feet and weighted average rate (per sq foot) on new leases.
| | | | | |
WHLR | Financial & Operating Data | as of 12/31/2023 unless otherwise stated | 23 |
Leasing Summary (continued)
CDR Leasing Renewals and New Leases
| | | | | | | | | | | |
| Three Months Ended December 31, | | Twelve Months Ended December 31, |
| 2023 | | 2023 |
Renewals(1): | | | |
| Leases renewed with rate increase (sq feet) | 61,361 | | | 182,111 | |
| Leases renewed with rate decrease (sq feet) | — | | | — | |
| Leases renewed with no rate change (sq feet) | — | | | 7,643 | |
| Total leases renewed (sq feet) | 61,361 | | | 189,754 | |
| | | |
| Leases renewed with rate increase (count) | 3 | | | 20 | |
| Leases renewed with rate decrease (count) | — | | | — | |
| Leases renewed with no rate change (count) | — | | | 3 | |
| Total leases renewed (count) | 3 | | | 23 | |
| | | |
| Option exercised (count) | 1 | | | 5 | |
| | | |
| Weighted average on rate increases (per sq foot) | $ | 0.32 | | | $ | 0.77 | |
| Weighted average on rate decreases (per sq foot) | $ | — | | | $ | — | |
| Weighted average rate on all renewals (per sq foot) | $ | 0.32 | | | $ | 0.74 | |
| | | |
| Weighted average change over prior rates | 4.89 | % | | 6.85 | % |
| | | |
New Leases(1) (2): | | | |
| New leases (sq feet) | 110,854 | | | 224,175 | |
| New leases (count) | 12 | | | 26 | |
| Weighted average rate (per sq foot) | $ | 12.96 | | | $ | 12.77 | |
(1) Lease data presented is based on average rate per square foot over the renewed or new lease term.
(2) The Company does not include ground leases entered into for the purposes of new lease sq feet and weighted average rate (per sq foot) on new leases.
| | | | | |
WHLR | Financial & Operating Data | as of 12/31/2023 unless otherwise stated | 24 |
Definitions
Funds from Operations (FFO): an alternative measure of our operating performance, specifically as it relates to results of operations and liquidity. We compute FFO in accordance with standards established by the Board of Governors of Nareit in its March 1995 White Paper (as amended in November 1999, April 2002 and December 2018). As defined by Nareit, FFO represents net income (computed in accordance with GAAP), excluding gains (or losses) from sales of property, plus real estate-related depreciation and amortization (excluding amortization of loan origination costs), plus impairment of real estate related long-lived assets and after adjustments for unconsolidated partnerships and joint ventures. Most industry analysts and equity REITs, including us, consider FFO to be an appropriate supplemental measure of operating performance because, by excluding gains or losses on dispositions and excluding depreciation, FFO is a helpful tool that can assist in the comparison of the operating performance of a company’s real estate between periods, or as compared to different companies. Management uses FFO as a supplemental measure to conduct and evaluate our business because there are certain limitations associated with using GAAP net income alone as the primary measure of our operating performance. Historical cost accounting for real estate assets in accordance with GAAP implicitly assumes that the value of real estate assets diminishes predictably over time, while historically real estate values have risen or fallen with market conditions. Accordingly, we believe FFO provides a valuable alternative measurement tool to GAAP when presenting our operating results.
Adjusted FFO (AFFO): We believe the computation of FFO in accordance with Nareit's definition includes certain items that are not indicative of the results provided by our operating portfolio and affect the comparability of our period-over-period performance. These items include, but are not limited to, legal settlements, non-cash share-based compensation expense, non-cash amortization on loans and acquisition costs. Therefore, in addition to FFO, management uses Adjusted FFO ("AFFO"), which we define to exclude such items. Management believes that these adjustments are appropriate in determining AFFO as they are not indicative of the operating performance of our assets. In addition, we believe that AFFO is a useful supplemental measure for the investing community to use in comparing us to other REITs as many REITs provide some form of adjusted or modified FFO. However, there can be no assurance that AFFO presented by us is comparable to the adjusted or modified FFO of other REITs.
Net Operating Income (NOI): The Company believes that NOI is a useful measure of the Company's property operating performance. The Company defines NOI as property revenues (rental and other revenues) less property and related expenses (property operation and maintenance and real estate taxes). Because NOI excludes general and administrative expenses, depreciation and amortization, interest expense, interest income, provision for income taxes, gain or loss on sale or capital expenditures and leasing costs and impairment charges, it provides a performance measure, that when compared year over year, reflects the revenues and expenses directly associated with owning and operating commercial real estate properties and the impact to operations from trends in occupancy rates, rental rates and operating costs, providing perspective not immediately apparent from net income. The Company uses NOI to evaluate its operating performance since NOI allows the Company to evaluate the impact of factors, such as occupancy levels, lease structure, lease rates and tenant base, have on the Company's results, margins and returns. NOI should not be viewed as a measure of the Company's overall financial performance since it does not reflect general and administrative expenses, depreciation and amortization, involuntary conversion, interest expense, interest income, provision for income taxes, straight-line rents, market lease amortization, gain or loss on sale or disposition of assets, and the level of capital expenditures and leasing costs necessary to maintain the operating performance of the Company's properties. Other REITs may use different methodologies for calculating NOI, and accordingly, the Company's NOI may not be comparable to that of other REITs.
| | | | | |
WHLR | Financial & Operating Data | as of 12/31/2023 unless otherwise stated | 25 |
Earnings Before Interest, Taxes, Depreciation and Amortization (EBITDA): another widely-recognized non-GAAP financial measure that the Company believes, when considered with financial statements prepared in accordance with GAAP, is useful to investors and lenders in understanding financial performance and providing a relevant basis for comparison among other companies, including REITs. While EBITDA should not be considered as a substitute for net income attributable to the Company’s common stockholders, net operating income, cash flow from operating activities, or other income or cash flow data prepared in accordance with GAAP, the Company believes that EBITDA may provide additional information with respect to the Company’s performance or ability to meet its future debt service requirements, capital expenditures and working capital requirements. The Company computes EBITDA by excluding interest expense, net loss attributable to noncontrolling interests, depreciation and amortization and impairment of long-lived assets and notes receivable, from income from continuing operations. The Company also presents Adjusted EBITDA which excludes items affecting the comparability of the periods presented, including but not limited to, costs associated with acquisitions and capital related activities.
| | | | | |
WHLR | Financial & Operating Data | as of 12/31/2023 unless otherwise stated | 26 |
Cover
|
Mar. 05, 2024 |
| Document Information [Line Items] |
|
| Document Type |
8-K
|
| Document Period End Date |
Mar. 05, 2024
|
| Entity Registrant Name |
WHEELER REAL ESTATE INVESTMENT TRUST, INC.
|
| Entity Incorporation, State or Country Code |
MD
|
| Entity File Number |
001-35713
|
| Entity Tax Identification Number |
45-2681082
|
| Entity Address, Address Line One |
2529 Virginia Beach Blvd
|
| Entity Address, City or Town |
Virginia Beach
|
| Entity Address, State or Province |
VA
|
| Entity Address, Postal Zip Code |
23452
|
| City Area Code |
757
|
| Local Phone Number |
627-9088
|
| Written Communications |
false
|
| Soliciting Material |
false
|
| Pre-commencement Tender Offer |
false
|
| Pre-commencement Issuer Tender Offer |
false
|
| Entity Emerging Growth Company |
false
|
| Entity Central Index Key |
0001527541
|
| Amendment Flag |
false
|
| Common Stock, $0.01 par value per share |
|
| Document Information [Line Items] |
|
| Title of 12(b) Security |
Common Stock, $0.01 par value per share
|
| Trading Symbol |
WHLR
|
| Security Exchange Name |
NASDAQ
|
| Series B Convertible Preferred Stock |
|
| Document Information [Line Items] |
|
| Title of 12(b) Security |
Series B Convertible Preferred Stock
|
| Trading Symbol |
WHLRP
|
| Security Exchange Name |
NASDAQ
|
| Series D Cumulative Convertible Preferred Stock |
|
| Document Information [Line Items] |
|
| Title of 12(b) Security |
Series D Cumulative Convertible Preferred Stock
|
| Trading Symbol |
WHLRD
|
| Security Exchange Name |
NASDAQ
|
| 7.00% Subordinated Convertible Notes due 2031 |
|
| Document Information [Line Items] |
|
| Title of 12(b) Security |
7.00% Subordinated Convertible Notes due 2031
|
| Trading Symbol |
WHLRL
|
| Security Exchange Name |
NASDAQ
|
| X |
- DefinitionBoolean flag that is true when the XBRL content amends previously-filed or accepted submission.
| Name: |
dei_AmendmentFlag |
| Namespace Prefix: |
dei_ |
| Data Type: |
xbrli:booleanItemType |
| Balance Type: |
na |
| Period Type: |
duration |
|
| X |
- DefinitionFor the EDGAR submission types of Form 8-K: the date of the report, the date of the earliest event reported; for the EDGAR submission types of Form N-1A: the filing date; for all other submission types: the end of the reporting or transition period. The format of the date is YYYY-MM-DD.
| Name: |
dei_DocumentPeriodEndDate |
| Namespace Prefix: |
dei_ |
| Data Type: |
xbrli:dateItemType |
| Balance Type: |
na |
| Period Type: |
duration |
|
| X |
- DefinitionThe type of document being provided (such as 10-K, 10-Q, 485BPOS, etc). The document type is limited to the same value as the supporting SEC submission type, or the word 'Other'.
| Name: |
dei_DocumentType |
| Namespace Prefix: |
dei_ |
| Data Type: |
dei:submissionTypeItemType |
| Balance Type: |
na |
| Period Type: |
duration |
|
| X |
- DefinitionAddress Line 1 such as Attn, Building Name, Street Name
| Name: |
dei_EntityAddressAddressLine1 |
| Namespace Prefix: |
dei_ |
| Data Type: |
xbrli:normalizedStringItemType |
| Balance Type: |
na |
| Period Type: |
duration |
|
| X |
- Definition
+ References
+ Details
| Name: |
dei_EntityAddressCityOrTown |
| Namespace Prefix: |
dei_ |
| Data Type: |
xbrli:normalizedStringItemType |
| Balance Type: |
na |
| Period Type: |
duration |
|
| X |
- DefinitionCode for the postal or zip code
| Name: |
dei_EntityAddressPostalZipCode |
| Namespace Prefix: |
dei_ |
| Data Type: |
xbrli:normalizedStringItemType |
| Balance Type: |
na |
| Period Type: |
duration |
|
| X |
- DefinitionName of the state or province.
| Name: |
dei_EntityAddressStateOrProvince |
| Namespace Prefix: |
dei_ |
| Data Type: |
dei:stateOrProvinceItemType |
| Balance Type: |
na |
| Period Type: |
duration |
|
| X |
- DefinitionA unique 10-digit SEC-issued value to identify entities that have filed disclosures with the SEC. It is commonly abbreviated as CIK. Reference 1: http://www.xbrl.org/2003/role/presentationRef
-Publisher SEC
-Name Exchange Act
-Number 240
-Section 12
-Subsection b-2
| Name: |
dei_EntityCentralIndexKey |
| Namespace Prefix: |
dei_ |
| Data Type: |
dei:centralIndexKeyItemType |
| Balance Type: |
na |
| Period Type: |
duration |
|
| X |
- DefinitionIndicate if registrant meets the emerging growth company criteria. Reference 1: http://www.xbrl.org/2003/role/presentationRef
-Publisher SEC
-Name Exchange Act
-Number 240
-Section 12
-Subsection b-2
| Name: |
dei_EntityEmergingGrowthCompany |
| Namespace Prefix: |
dei_ |
| Data Type: |
xbrli:booleanItemType |
| Balance Type: |
na |
| Period Type: |
duration |
|
| X |
- DefinitionCommission file number. The field allows up to 17 characters. The prefix may contain 1-3 digits, the sequence number may contain 1-8 digits, the optional suffix may contain 1-4 characters, and the fields are separated with a hyphen.
| Name: |
dei_EntityFileNumber |
| Namespace Prefix: |
dei_ |
| Data Type: |
dei:fileNumberItemType |
| Balance Type: |
na |
| Period Type: |
duration |
|
| X |
- DefinitionTwo-character EDGAR code representing the state or country of incorporation.
| Name: |
dei_EntityIncorporationStateCountryCode |
| Namespace Prefix: |
dei_ |
| Data Type: |
dei:edgarStateCountryItemType |
| Balance Type: |
na |
| Period Type: |
duration |
|
| X |
- DefinitionThe exact name of the entity filing the report as specified in its charter, which is required by forms filed with the SEC. Reference 1: http://www.xbrl.org/2003/role/presentationRef
-Publisher SEC
-Name Exchange Act
-Number 240
-Section 12
-Subsection b-2
| Name: |
dei_EntityRegistrantName |
| Namespace Prefix: |
dei_ |
| Data Type: |
xbrli:normalizedStringItemType |
| Balance Type: |
na |
| Period Type: |
duration |
|
| X |
- DefinitionThe Tax Identification Number (TIN), also known as an Employer Identification Number (EIN), is a unique 9-digit value assigned by the IRS. Reference 1: http://www.xbrl.org/2003/role/presentationRef
-Publisher SEC
-Name Exchange Act
-Number 240
-Section 12
-Subsection b-2
| Name: |
dei_EntityTaxIdentificationNumber |
| Namespace Prefix: |
dei_ |
| Data Type: |
dei:employerIdItemType |
| Balance Type: |
na |
| Period Type: |
duration |
|
| X |
- DefinitionLocal phone number for entity.
| Name: |
dei_LocalPhoneNumber |
| Namespace Prefix: |
dei_ |
| Data Type: |
xbrli:normalizedStringItemType |
| Balance Type: |
na |
| Period Type: |
duration |
|
| X |
- DefinitionBoolean flag that is true when the Form 8-K filing is intended to satisfy the filing obligation of the registrant as pre-commencement communications pursuant to Rule 13e-4(c) under the Exchange Act. Reference 1: http://www.xbrl.org/2003/role/presentationRef
-Publisher SEC
-Name Exchange Act
-Number 240
-Section 13e
-Subsection 4c
| Name: |
dei_PreCommencementIssuerTenderOffer |
| Namespace Prefix: |
dei_ |
| Data Type: |
xbrli:booleanItemType |
| Balance Type: |
na |
| Period Type: |
duration |
|
| X |
- DefinitionBoolean flag that is true when the Form 8-K filing is intended to satisfy the filing obligation of the registrant as pre-commencement communications pursuant to Rule 14d-2(b) under the Exchange Act. Reference 1: http://www.xbrl.org/2003/role/presentationRef
-Publisher SEC
-Name Exchange Act
-Number 240
-Section 14d
-Subsection 2b
| Name: |
dei_PreCommencementTenderOffer |
| Namespace Prefix: |
dei_ |
| Data Type: |
xbrli:booleanItemType |
| Balance Type: |
na |
| Period Type: |
duration |
|
| X |
- DefinitionTitle of a 12(b) registered security. Reference 1: http://www.xbrl.org/2003/role/presentationRef
-Publisher SEC
-Name Exchange Act
-Number 240
-Section 12
-Subsection b
| Name: |
dei_Security12bTitle |
| Namespace Prefix: |
dei_ |
| Data Type: |
dei:securityTitleItemType |
| Balance Type: |
na |
| Period Type: |
duration |
|
| X |
- DefinitionName of the Exchange on which a security is registered. Reference 1: http://www.xbrl.org/2003/role/presentationRef
-Publisher SEC
-Name Exchange Act
-Number 240
-Section 12
-Subsection d1-1
| Name: |
dei_SecurityExchangeName |
| Namespace Prefix: |
dei_ |
| Data Type: |
dei:edgarExchangeCodeItemType |
| Balance Type: |
na |
| Period Type: |
duration |
|
| X |
- DefinitionBoolean flag that is true when the Form 8-K filing is intended to satisfy the filing obligation of the registrant as soliciting material pursuant to Rule 14a-12 under the Exchange Act. Reference 1: http://www.xbrl.org/2003/role/presentationRef
-Publisher SEC
-Name Exchange Act
-Section 14a
-Number 240
-Subsection 12
| Name: |
dei_SolicitingMaterial |
| Namespace Prefix: |
dei_ |
| Data Type: |
xbrli:booleanItemType |
| Balance Type: |
na |
| Period Type: |
duration |
|
| X |
- DefinitionTrading symbol of an instrument as listed on an exchange.
| Name: |
dei_TradingSymbol |
| Namespace Prefix: |
dei_ |
| Data Type: |
dei:tradingSymbolItemType |
| Balance Type: |
na |
| Period Type: |
duration |
|
| X |
- DefinitionBoolean flag that is true when the Form 8-K filing is intended to satisfy the filing obligation of the registrant as written communications pursuant to Rule 425 under the Securities Act. Reference 1: http://www.xbrl.org/2003/role/presentationRef
-Publisher SEC
-Name Securities Act
-Number 230
-Section 425
| Name: |
dei_WrittenCommunications |
| Namespace Prefix: |
dei_ |
| Data Type: |
xbrli:booleanItemType |
| Balance Type: |
na |
| Period Type: |
duration |
|
| X |
- Details
| Name: |
us-gaap_StatementClassOfStockAxis=us-gaap_CommonStockMember |
| Namespace Prefix: |
|
| Data Type: |
na |
| Balance Type: |
|
| Period Type: |
|
|
| X |
- Details
| Name: |
us-gaap_StatementClassOfStockAxis=us-gaap_SeriesBPreferredStockMember |
| Namespace Prefix: |
|
| Data Type: |
na |
| Balance Type: |
|
| Period Type: |
|
|
| X |
- Details
| Name: |
us-gaap_StatementClassOfStockAxis=us-gaap_SeriesDPreferredStockMember |
| Namespace Prefix: |
|
| Data Type: |
na |
| Balance Type: |
|
| Period Type: |
|
|
| X |
- Details
| Name: |
us-gaap_StatementClassOfStockAxis=us-gaap_ConvertibleSubordinatedDebtMember |
| Namespace Prefix: |
|
| Data Type: |
na |
| Balance Type: |
|
| Period Type: |
|
|


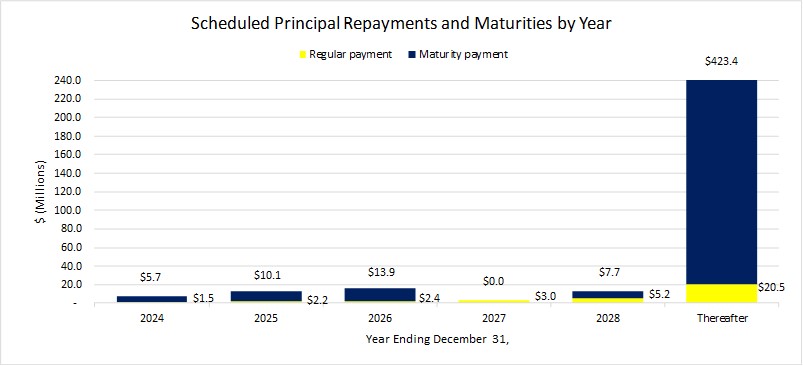
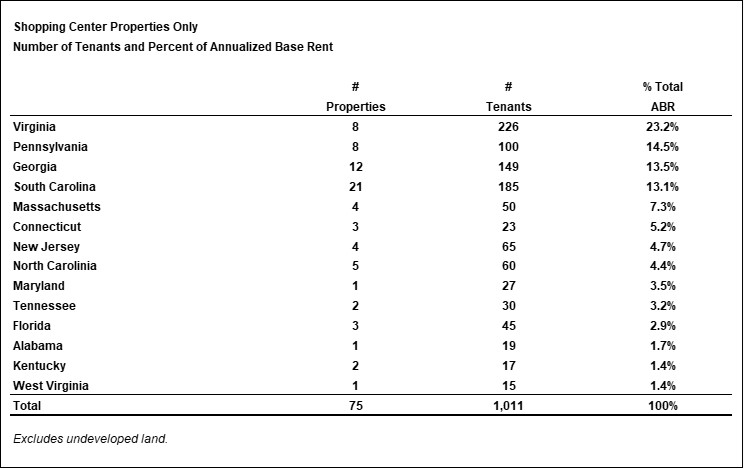


 Hot Features