
We could not find any results for:
Make sure your spelling is correct or try broadening your search.
| Share Name | Share Symbol | Market | Type |
|---|---|---|---|
| Vertex Energy Inc | NASDAQ:VTNR | NASDAQ | Common Stock |
| Price Change | % Change | Share Price | Bid Price | Offer Price | High Price | Low Price | Open Price | Shares Traded | Last Trade | |
|---|---|---|---|---|---|---|---|---|---|---|
| 0.02 | 1.79% | 1.14 | 1.13 | 1.17 | 1.17 | 1.10 | 1.11 | 2,592,743 | 00:59:59 |
UNITED STATES
SECURITIES AND EXCHANGE COMMISSION
Washington, D.C. 20549
FORM
CURRENT REPORT
Pursuant to Section 13 or 15(d) of the Securities Exchange Act of 1934
Date of Report (Date of Earliest Event Reported):
(Exact name of registrant as specified in its charter)
| (State or other jurisdiction of incorporation) |
(Commission File Number) | (IRS Employer Identification No.) |
|
|
|
| (Address of principal executive offices) | (Zip Code) |
Registrant’s telephone number, including
area code:
Check the appropriate box below if the Form 8-K filing is intended to simultaneously satisfy the filing obligation of the registrant under any of the following provisions:
| Written communications pursuant to Rule 425 under the Securities Act (17 CFR 230.425) | |
| Soliciting material pursuant to Rule 14a-12 under the Exchange Act (17 CFR 240.14a-12) | |
| Pre-commencement communications pursuant to Rule 14d-2(b) under the Exchange Act (17 CFR 240.14d-2(b)) | |
| Pre-commencement communications pursuant to Rule 13e-4(c) under the Exchange Act (17 CFR 240.13e-4(c)) |
Securities registered pursuant to Section 12(b) of the Act:
| Title of each class | Trading Symbol(s) | Name of each exchange on which registered |
|
|
The (Nasdaq Capital Market) |
Indicate by check mark whether the registrant is an emerging growth company as defined in Rule 405 of the Securities Act of 1933 (§230.405 of this chapter) or Rule 12b-2 of the Securities Exchange Act of 1934 (§240.12b-2 of this chapter).
Emerging growth company
If an emerging growth company, indicate by check mark if the registrant has elected not to use the extended transition period for complying with any new or revised financial accounting standards provided pursuant to Section 13(a) of the Exchange Act. ☐
| Item 2.02 | Results of Operations and Financial Condition. |
On May 9, 2024, Vertex Energy, Inc. (“Vertex” or the “Company”) issued a press release and will hold a conference call regarding its financial results for the three months ended March 31, 2024. A copy of the press release, which includes information on the conference call and a summary of such financial results is furnished as Exhibit 99.1 to this Form 8-K and incorporated herein by reference. Additionally, a copy of a presentation which will be discussed on the earnings call is furnished as Exhibit 99.2 to this Form 8-K and is incorporated herein by reference, and has also been posted to the Company’s website at https://www.vertexenergy.com/presentation, although the Company reserves the right to discontinue that availability at any time.
The information contained in this Current Report and Exhibits 99.1 and 99.2 hereto shall not be deemed “filed” for purposes of Section 18 of the Securities Exchange Act of 1934, as amended (the “Exchange Act”) or otherwise subject to the liabilities of that section, nor shall they be deemed incorporated by reference in any filing under the Securities Act of 1933, as amended or the Exchange Act, except as expressly set forth by specific reference in such a filing.
The Company is making reference to non-GAAP financial information in the press release, presentation, and the conference call. A reconciliation of these non-GAAP financial measures to the comparable GAAP financial measures is contained in the attached press release and presentation.
| Item 9.01 | Financial Statements and Exhibits. |
| Exhibit No. | Description | ||
| 99.1* | Press Release of Vertex Energy, Inc., dated May 9, 2024 | ||
| 99.2* | First Quarter 2024 Earnings Call Presentation | ||
| 104 | Inline XBRL for the cover page of this Current Report on Form 8-K | ||
* Furnished herewith.
The inclusion of any website address in this Form 8-K, and any exhibit thereto, is intended to be an inactive textual reference only and not an active hyperlink. The information contained in, or that can be accessed through, such website is not part of or incorporated into this Form 8-K.
Forward-Looking Statements
This Current Report on Form 8-K, including the press release and presentation furnished as Exhibits 99.1 and 99.2, respectively, to this Current Report on Form 8-K, contains forward-looking statements within the meaning of the federal securities laws, including the Private Securities Litigation Reform Act of 1995, and, as such, may involve known and unknown risks, uncertainties and assumptions. You can identify these forward-looking statements by words such as “may,” “should,” “expect,” “anticipate,” “believe,” “estimate,” “intend,” “plan” and other similar expressions. These forward-looking statements relate to the Company’s current expectations and are subject to the limitations and qualifications set forth in the press release and presentation as well as in the Company’s other filings with the Securities and Exchange Commission, including, without limitation, that actual events and/or results may differ materially from those projected in such forward-looking statements. These statements also involve known and unknown risks, which may cause the results of the Company, its divisions and concepts to be materially different than those expressed or implied in such statements, including those referenced in the press release and presentation. Accordingly, readers should not place undue reliance on any forward-looking statements. Forward-looking statements may include comments as to the Company’s beliefs and expectations as to future financial performance, events and trends affecting its business and are necessarily subject to uncertainties, many of which are outside the Company’s control. More information on potential factors that could affect the Company’s financial results is included from time to time in the “Cautionary Statement Regarding Forward-Looking Statements,” “Risk Factors” and “Management’s Discussion and Analysis of Financial Condition and Results of Operations” sections of the Company’s most recently filed periodic reports on Form 10-K and Form 10-Q and subsequent filings with the SEC and available at www.sec.gov and in the “Investor Relations” – “SEC Filings” section of the Company’s website at www.vertexenergy.com. Forward-looking statements speak only as of the date they are made. The Company undertakes no obligation to publicly update or revise any forward-looking statements, whether as a result of new information, future events or otherwise that occur after that date, except as otherwise provided by law.
SIGNATURES
Pursuant to the requirements of the Securities Exchange Act of 1934, the registrant has duly caused this report to be signed on its behalf by the undersigned hereunto duly authorized.
| VERTEX ENERGY, INC. | ||
| Date: May 9, 2024 | By: | /s/ Chris Carlson |
| Chris Carlson | ||
| Chief Financial Officer | ||
Exhibit 99.1

VERTEX ENERGY ANNOUNCES FIRST QUARTER 2024 RESULTS AND OPTIMIZATION OF HYDROCRACKING CAPACITY FROM RENEWABLES TO CONVENTIONAL PRODUCTION
HOUSTON, TX (Business Wire) – May 9, 2024 – Vertex Energy, Inc. (NASDAQ:VTNR) (“Vertex” or the “Company”), a leading specialty refiner and marketer of high-quality refined products and renewable fuels, today announced its operational and financial results for the first quarter of 2024. The Company also announced that it plans to optimize its hyrdrocracking capacity between conventional production and renewables production moving forward.
The Company will host a conference call to discuss first quarter 2024 results today, at 9:00 A.M. Eastern Time. Details regarding the conference call are included at the end of this release.
Highlights for the first quarter of 2024 and through the date of this press release include:
| · | Continued safe operation of the Company’s Mobile, Alabama refinery (the “Mobile Refinery”) with first quarter 2024 conventional throughput of 64,065 barrels per day (bpd), above the high end of prior guidance; |
| · | Reduced net loss attributable to the Company to ($17.7) million, or ($0.19) per fully-diluted share compared to the fourth quarter 2023; |
| · | Increased Adjusted EBITDA to $18.6 million driven by 28% improvement in crack spreads compared to the fourth quarter of 2023; |
| · | Decreased direct operating expense by 11% and capital expenditures by 29% compared to previous guidance midpoints; |
| · | Achieved renewable diesel (“RD”) throughput of 4,090 bpd, in line with previous guidance; and |
| · | Reported total cash and cash equivalents of $65.7 million, including restricted cash of $3.6 million. |
Highlights for the strategic redirection of the Company’s renewable business:
| · | Announced a production pause and pivot regarding the Company’s renewable business; |
| o | Optimizing the Mobile Refinery hydrocracker capacity from renewable diesel to conventional fuels; |
| o | Expect to deplete Company inventories of renewable feedstocks prior to the conversion; |
| o | Conversion will be timed with a planned catalyst change and maintenance turnaround that was already scheduled for 2024, after which hydrocracker production is expected to contribute additional upgraded conventional product volumes in Q4 2024; and |
| o | Opportunity to optimize hydrocracker production in conventional service while maintaining the proven renewable diesel production flexibility when market conditions warrant. |
Note: Schedules reconciling the Company’s generally accepted accounting principles in the United States (“GAAP”) and non-GAAP financial results, including Adjusted EBITDA and certain key performance indicators, are included later in this release (see also “Non-GAAP Financial Measures and Key Performance Indicators”, below).
| 1 |
Mr. Benjamin P. Cowart, Vertex’s Chief Executive Officer, stated, “We had a strong operational and financial quarter, as we maintained our commitment to operating safely and reliably. We saw an improved crack spread environment, which drove our Adjusted EBITDA higher by over $50 million compared to the fourth quarter of 2023. Additionally, we saw conventional throughput above our guidance and managed direct operating costs and capital expenditures below our guidance.”
“Over the past few years, we have made material advancements and strategic decisions to grow Vertex. For the past two years we have operated safely and efficiently while investing capital into upgrading the Mobile Refinery. We built in flexibility with our capital spend to allow us to redeploy our renewable equipment back into conventional production if our strategy required adjustment. Due to the significant macroeconomic headwinds over the past 12 months, many of which we believe will continue to occur over the next 18 months and potentially beyond, we have decided to strategically pause our renewable diesel business and pivot to producing conventional fuels from the hydrocracker unit. We plan to reconfigure the hydrocracker in conjunction with a planned turnaround on the unit.”
Mr. Cowart continued, “I am appreciative of the team for their work in proving the hydrocracker in renewables service, obtaining multiple pathway approvals, and successfully incorporating a wide variety of renewable feedstocks. In the future, based on economics and macro conditions, we expect to optimize our hydrocracker capacity between conventional and renewables service. We believe this flexibility to produce based on market demand materially enhances our unit’s long-term value potential. Our engineering and operations teams have worked diligently to preserve our optionality for the unit and to not degrade our ability to produce conventional products. We now have a more robust hydrocracking unit in either service mode. Relative to what’s currently available for renewables, we believe that this shift will allow us to optimize available returns through higher yield capabilities and higher margin opportunities for conventional products. When modeling the unit in conventional service against first quarter 2024 historical data, we estimate the unit could have significantly improved our results providing an additional fuel gross margin contribution of roughly $40 million on conventional fuels.”
Mr. Cowart concluded, “Our strategic priorities remain focused on increasing our cash position, reducing our operating costs, and improving margins. We believe that this decision [to allow for more optionality in the hydrocracking unit] is not only prudent but a necessary step toward accomplishing these for the remainder of 2024 and into 2025.”
MOBILE REFINERY OPERATIONS
Total conventional throughput at the Mobile Refinery was 64,065 bpd in the first quarter of 2024. Total production of finished high-value, light products, such as gasoline, diesel, and jet fuel, represented approximately 64% of total production in the first quarter of 2024, vs. 66% in the fourth quarter of 2023, and in line with management’s original expectations, reflecting a continued successful yield optimization initiative at the Mobile conventional refining facility.
The Mobile Refinery’s conventional operations generated a gross profit of $37.5 million and $73.6 million of fuel gross margin (a key performance indicator (KPI) discussed below) or $12.63 per barrel during the first quarter of 2024, versus generating a gross profit of $7.3 million, and fuel gross margin of $29.6 million, or $4.79 per barrel in the fourth quarter of 2023.
Total renewable throughput at the Mobile Renewable Diesel facility was 4,090 bpd in the first quarter of 2024. Total production of renewable diesel was 4,003 bpd reflecting a product yield of 98%.
The Mobile Renewable Diesel facility operations generated a gross loss of $(10.5) million and $3.8 million of fuel gross margin (a KPI discussed below) or $10.29 per barrel during the first quarter of 2024.
Renewable Business Pause and Pivot
During the second quarter of 2024, Vertex is pausing renewable fuels production and redirecting the hydrocracking unit to conventional fuels and products. The Company had a previously planned catalyst and maintenance turnaround scheduled for 2024. It will use that planned turnaround to load conventional catalyst and bring the unit out of turnaround in conventional service. In addition, the total cost of about $10 million was previously budgeted as part of the planned catalyst and maintenance turnaround and does not represent a material change to our forecasted capital spend. During the second quarter, Vertex is running the remaining Company inventories of renewable feedstock, which is expected to allow the Company to improve its working capital and margins in the second quarter from the renewable business.
| 2 |
First Quarter 2024 Mobile Refinery Results Summary ($/millions unless otherwise noted)
| Conventional Fuels Refinery | 4Q23 | TTM | 1Q24 | |||||||||
| Total Throughput (bpd) | 67,083 | 71,922 | 64,065 | |||||||||
| Total Throughput (MMbbl) | 6.17 | 26.32 | 5.83 | |||||||||
| Conventional Facility Capacity Utilization1 | 89.4 | % | 95.9 | % | 85.4 | % | ||||||
| Direct Opex Per Barrel ($/bbl) | $ | 2.46 | $ | 2.74 | $ | 2.75 | ||||||
| Fuel Gross Margin ($/MM) | $ | 29.6 | $ | 288.5 | $ | 73.6 | ||||||
| Fuel Gross Margin Per Barrel ($/bbl) | $ | 4.79 | $ | 10.96 | $ | 12.63 | ||||||
| Production Yield | ||||||||||||
| Gasoline (bpd) | 17,826 | 17,388 | 14,678 | |||||||||
| % Production | 25.9 | % | 24.0 | % | 22.9 | % | ||||||
| ULSD (bpd) | 14,510 | 15,014 | 13,441 | |||||||||
| % Production | 21.1 | % | 21.6 | % | 21.0 | % | ||||||
| Jet (bpd) | 12,937 | 13,735 | 12,595 | |||||||||
| % Production | 18.8 | % | 19.8 | % | 19.6 | % | ||||||
| Total Finished Fuel Products | 45,273 | 46,137 | 40,714 | |||||||||
| % Production | 65.9 | % | 63.7 | % | 63.5 | % | ||||||
| Other2 | 23,457 | 26,300 | 23,428 | |||||||||
| % Production | 34.1 | % | 37.9 | % | 36.5 | % | ||||||
| Total Production (bpd) | 68,730 | 72,437 | 64,142 | |||||||||
| Total Production (MMbbl) | 6.32 | 26.51 | 5.84 | |||||||||
| Renewable Fuels Refinery | 4Q23 | TTM | 1Q24 | |||||||||
| Total Renewable Throughput (bpd) | 3,926 | 3,980 | 4,090 | |||||||||
| Total Renewable Throughput (MMbbl) | 0.36 | 1.46 | 0.37 | |||||||||
| Renewable Diesel Facility Capacity Utilization3 | 49.1 | % | 49.8 | % | 51.1 | % | ||||||
| Direct Opex Per Barrel ($/bbl) | $ | 27.32 | $ | 25.93 | $ | 25.20 | ||||||
| Renewable Fuel Gross Margin | $ | 4.4 | $ | 7.5 | $ | 3.8 | ||||||
| Renewable Fuel Gross Margin Per Barrel ($/bbl) | $ | 12.11 | $ | 5.13 | $ | 10.29 | ||||||
| Renewable Diesel Production (bpd) | 3,786 | 3,822 | 4,003 | |||||||||
| Renewable Diesel Production (MMbbl) | 0.35 | 1.40 | 0.36 | |||||||||
| Renewable Diesel Production Yield (%) | 96.4 | % | 96.0 | % | 97.9 | % |
1) Assumes 75,000 barrels per day of conventional operational capacity 2) Other includes naphtha, intermediates, and LNG 3) Assumes 8,000 barrels per day of renewable fuels operational capacity
First Quarter 2024 Financial Update
Vertex reported first quarter 2024 net loss attributable to the Company of ($17.7) million, or ($0.19) per fully-diluted share, versus net loss attributable to the Company of ($63.9) million, or ($0.68) per fully-diluted share for the fourth quarter of 2023. Adjusted EBITDA was $18.6 million for the first quarter of 2024, compared to Adjusted EBITDA of ($35.1) million in the fourth quarter of 2023. The improvement in quarter-over-quarter results was primarily driven by improved crack spread pricing, in Vacuum Gas Oil (“VGO”) and gasoline finished products.
| 3 |
Balance Sheet and Liquidity Update
As of March 31, 2024, Vertex had total debt outstanding of $284 million, including $15.2 million in 6.25% Senior Convertible Notes, $196.0 million outstanding on the Company’s Term Loan, finance lease obligations of $68.1 million, and $5.0 million in other obligations. The Company had total cash and equivalents of $65.7 million, including $3.6 million of restricted cash on the balance sheet as of March 31, 2024, for a net debt position of $218.5 million.
As previously announced on January 2, 2024, the Company reached an agreement with its existing lending group to modify certain terms and conditions of the current term loan agreement. The amended term loan provided an incremental $50.0 million in borrowings, the full amount of which was borrowed upon closing on December 29, 2023 and therefore was reflected in Vertex’s year end 2023 cash position.
Vertex management continuously monitors current market conditions to assess expected cash generation and liquidity needs against its available cash position, using the forward crack spreads in the market. Additionally, the Company continues to evaluate strategic financial opportunities seeking further enhancements to its current liquidity position.
Management Outlook
All guidance presented below is current as of the time of this release and is subject to change. All prior financial guidance should no longer be relied upon.
| Conventional Fuels | 2Q 2024 | |||||||
| Operational: | Low | High | ||||||
| Mobile Refinery Conventional Throughput Volume (Mbpd) | 68.0 | 72.0 | ||||||
| Capacity Utilization | 91 | % | 96 | % | ||||
| Production Yield Profile: | ||||||||
| Percentage Finished Products1 | 64 | % | 68 | % | ||||
| Intermediate & Other Products2 | 36 | % | 32 | % | ||||
| Renewable Fuels | 2Q 2024 | |||||||
| Operational: | Low | High | ||||||
| Mobile Refinery Renewable Throughput Volume (Mbpd) | 2.0 | 4.0 | ||||||
| Capacity Utilization | 25 | % | 50 | % | ||||
| Production Yield | 96 | % | 98 | % | ||||
| Yield Loss | 4 | % | 2 | % | ||||
| Consolidated | 2Q 2024 | |||||||
| Operational: | Low | High | ||||||
| Mobile Refinery Total Throughput Volume (Mbpd) | 70.0 | 76.0 | ||||||
| Capacity Utilization | 84 | % | 92 | % | ||||
| Financial Guidance: | ||||||||
| Direct Operating Expense ($/bbl) | $ | 4.11 | $ | 4.46 | ||||
| Capital Expenditures ($/MM) | $ | 20.00 | $ | 25.00 | ||||
| 1.) Finished products include gasoline, ULSD, and Jet A | ||||||||
| 2.) Intermediate & Other products include Vacuum Gas Oil (VGO), Liquified Petroleum Gases (LPGs), | ||||||||
| and Vacuum Tower Bottoms (VTBs) | ||||||||
| 4 |
CONFERENCE CALL AND WEBCAST DETAILS
A conference call will be held today, May 9,2024 at 9:00 A.M. Eastern Time to review the Company’s financial results, discuss recent events and conduct a question-and-answer session. An audio webcast of the conference call and accompanying presentation materials will also be available in the “Events and Presentation” section of Vertex’s website at www.vertexenergy.com. To listen to a live broadcast, visit the site at least 15 minutes prior to the scheduled start time in order to register, download, and install any necessary audio software.
To participate in the live teleconference:
Domestic: (888) 350-3870
International: (646) 960-0308
Conference ID: 8960754
A replay of the teleconference will be available in the “Events and Presentation” section of Vertex’s website at www.vertexenergy.com for up to one year following the conference call.
ABOUT VERTEX ENERGY
Vertex Energy is a leading energy transition company that specializes in producing high purity fuels and products from conventional, sustainable, and renewable feedstocks. The Company’s innovative solutions are designed to enhance the performance of our customers and partners while also prioritizing sustainability, safety, and operational excellence. With a commitment to providing superior products and services, Vertex Energy is dedicated to shaping the future of the energy industry.
| 5 |
FORWARD-LOOKING STATEMENTS
Certain of the matters discussed in this communication which are not statements of historical fact constitute forward-looking statements within the meaning of the securities laws, including the Private Securities Litigation Reform Act of 1995, that involve a number of risks and uncertainties. Words such as “strategy,” “expects,” “continues,” “plans,” “anticipates,” “believes,” “would,” “will,” “estimates,” “intends,” “projects,” “goals,” “targets” and other words of similar meaning are intended to identify forward-looking statements but are not the exclusive means of identifying these statements. Any statements made in this news release other than those of historical fact, about an action, event or development, are forward-looking statements. The important factors that may cause actual results and outcomes to differ materially from those contained in such forward-looking statements include, without limitation, the Company’s projected Outlook for the second quarter of 2024, the costs associated with, and outcome of the Company’s plans to optimize conventional fuel and renewable diesel production moving forward, as discussed above; statements concerning: the Company’s engagement of BofA Securities, Inc., as previously disclosed; the review and evaluation of potential joint ventures, divestitures, acquisitions, mergers, business combinations, or other strategic transactions, the outcome of such review, and the impact on any such transactions, or the review thereof, and their impact on shareholder value; the process by which the Company engages in evaluation of strategic transactions; the Company’s ability to identify potential partners; the outcome of potential future strategic transactions and the terms thereof; the future production of the Company’s Mobile Refinery; anticipated and unforeseen events which could reduce future production at the refinery or delay future capital projects, and changes in commodity and credit values; throughput volumes, production rates, yields, operating expenses and capital expenditures at the Mobile Refinery; the timing of, and outcome of, the evaluation and associated carbon intensity scoring of the Company’s feedstock blends by officials in the state of California; the ability of the Company to obtain low carbon fuel standard (LCFS) credits, and the amounts thereof; the need for additional capital in the future, including, but not limited to, in order to complete capital projects and satisfy liabilities, the Company’s ability to raise such capital in the future, and the terms of such funding, including dilution caused thereby; the timing of capital projects at the Company’s refinery located in Mobile, Alabama (the “Mobile Refinery”) and the outcome of such projects; the future production of the Mobile Refinery, including but not limited to, renewable diesel and conventional production and the breakdown between the two; estimated and actual production and costs associated with the renewable diesel capital project; estimated revenues, margins and expenses, over the course of the agreement with Idemitsu; anticipated and unforeseen events which could reduce future production at the Mobile Refinery or delay planned and future capital projects; changes in commodity and credits values; certain early termination rights associated with third party agreements and conditions precedent to such agreements; certain mandatory redemption provisions of the outstanding senior convertible notes, the conversion rights associated therewith, and dilution caused by conversions and/or the exchanges of convertible notes; the Company’s ability to comply with required covenants under outstanding senior notes and a term loan and to pay amounts due under such senior notes and term loan, including interest and other amounts due thereunder; the ability of the Company to retain and hire key personnel; the level of competition in the Company’s industry and its ability to compete; the Company’s ability to respond to changes in its industry; the loss of key personnel or failure to attract, integrate and retain additional personnel; the Company’s ability to protect intellectual property and not infringe on others’ intellectual property; the Company’s ability to scale its business; the Company’s ability to maintain supplier relationships and obtain adequate supplies of feedstocks; the Company’s ability to obtain and retain customers; the Company’s ability to produce products at competitive rates; the Company’s ability to execute its business strategy in a very competitive environment; trends in, and the market for, the price of oil and gas and alternative energy sources; the impact of inflation on margins and costs; the volatile nature of the prices for oil and gas caused by supply and demand, including volatility caused by the ongoing Ukraine/Russia conflict and/or the Israel/Hamas conflict, changes in interest rates and inflation, and potential recessions; the Company’s ability to maintain relationships with partners; the outcome of pending and potential future litigation, judgments and settlements; rules and regulations making the Company’s operations more costly or restrictive; volatility in the market price of compliance credits (primarily Renewable Identification Numbers (RINs) needed to comply with the Renewable Fuel Standard (“RFS”)) under renewable and low-carbon fuel programs and emission credits needed under other environmental emissions programs, the requirement for the Company to purchase RINs in the secondary market to the extent it does not generate sufficient RINs internally, liabilities associated therewith and the timing, funding and costs of such required purchases, if any; changes in environmental and other laws and regulations and risks associated with such laws and regulations; economic downturns both in the United States and globally, changes in inflation and interest rates, increased costs of borrowing associated therewith and potential declines in the availability of such funding; risk of increased regulation of the Company’s operations and products; disruptions in the infrastructure that the Company and its partners rely on; interruptions at the Company’s facilities; unexpected and expected changes in the Company’s anticipated capital expenditures resulting from unforeseen and expected required maintenance, repairs, or upgrades; the Company’s ability to acquire and construct new facilities; the Company’s ability to effectively manage growth; decreases in global demand for, and the price of, oil, due to inflation, recessions or other reasons, including declines in economic activity or global conflicts; expected and unexpected downtime at the Company’s facilities; the Company’s level of indebtedness, which could affect its ability to fulfill its obligations, impede the implementation of its strategy, and expose the Company’s interest rate risk; dependence on third party transportation services and pipelines; risks related to obtaining required crude oil supplies, and the costs of such supplies; counterparty credit and performance risk; unanticipated problems at, or downtime effecting, the Company’s facilities and those operated by third parties; risks relating to the Company’s hedging activities or lack of hedging activities; and risks relating to planned and future divestitures, asset sales, joint ventures and acquisitions.
Other important factors that may cause actual results and outcomes to differ materially from those contained in the forward-looking statements included in this communication are described in the Company’s publicly filed reports, including, but not limited to, the Company’s Annual Report on Form 10-K for the year ended December 31, 2023, and the Company’s Quarterly Report on Form 10-Q for the quarter ended March 31, 2024, and future Annual Reports on Form 10-K and Quarterly Reports on Form 10-Q. These reports are available at www.sec.gov. The Company cautions that the foregoing list of important factors is not complete. All subsequent written and oral forward-looking statements attributable to the Company or any person acting on behalf of the Company are expressly qualified in their entirety by the cautionary statements referenced above. Other unknown or unpredictable factors also could have material adverse effects on Vertex’s future results. The forward-looking statements included in this press release are made only as of the date hereof. Vertex cannot guarantee future results, levels of activity, performance or achievements. Accordingly, you should not place undue reliance on these forward-looking statements. Finally, Vertex undertakes no obligation to update these statements after the date of this release, except as required by law, and takes no obligation to update or correct information prepared by third parties that are not paid for by Vertex. If we update one or more forward-looking statements, no inference should be drawn that we will make additional updates with respect to those or other forward-looking statements.
| 6 |
PROJECTIONS
The financial projections (the “Projections”) included herein were prepared by Vertex in good faith using assumptions believed to be reasonable. A significant number of assumptions about the operations of the business of Vertex were based, in part, on economic, competitive, and general business conditions prevailing at the time the Projections were developed. Any future changes in these conditions, may materially impact the ability of Vertex to achieve the financial results set forth in the Projections. The Projections are based on numerous assumptions, including realization of the operating strategy of Vertex; industry performance; no material adverse changes in applicable legislation or regulations, or the administration thereof, or generally accepted accounting principles; general business and economic conditions; competition; retention of key management and other key employees; absence of material contingent or unliquidated litigation, indemnity, or other claims; minimal changes in current pricing; static material and equipment pricing; no significant increases in interest rates or inflation; and other matters, many of which will be beyond the control of Vertex, and some or all of which may not materialize. The Projections also assume the continued uptime of the Company’s facilities at historical levels and the successful funding of, timely completion of, and successful outcome of, planned capital projects. Additionally, to the extent that the assumptions inherent in the Projections are based upon future business decisions and objectives, they are subject to change. Although the Projections are presented with numerical specificity and are based on reasonable expectations developed by Vertex’s management, the assumptions and estimates underlying the Projections are subject to significant business, economic, and competitive uncertainties and contingencies, many of which will be beyond the control of Vertex. Accordingly, the Projections are only estimates and are necessarily speculative in nature. It is expected that some or all of the assumptions in the Projections will not be realized and that actual results will vary from the Projections. Such variations may be material and may increase over time. In light of the foregoing, readers are cautioned not to place undue reliance on the Projections. The projected financial information contained herein should not be regarded as a representation or warranty by Vertex, its management, advisors, or any other person that the Projections can or will be achieved. Vertex cautions that the Projections are speculative in nature and based upon subjective decisions and assumptions. As a result, the Projections should not be relied on as necessarily predictive of actual future events.
NON-GAAP FINANCIAL MEASURES AND KEY PERFORMANCE INDICATORS
In addition to our results calculated under generally accepted accounting principles in the United States (“GAAP”), in this news release we also present certain non-U.S. GAAP financial measures and key performance indicators. Non-U.S. GAAP financial measures include Adjusted Gross Margin, Fuel Gross Margin and Adjusted EBITDA, for the Company’s Legacy Refining and Marketing segment, and the total Refining and Marketing segment, as a whole, and Net Long-Term Debt and Ratio of Net Long-Term Debt (collectively, the “Non-U.S. GAAP Financial Measures”). Key performance indicators include Adjusted Gross Margin, Fuel Gross Margin and Adjusted EBITDA for Conventional, Renewable and the Mobile Refinery as a whole, and Fuel Gross Margin Per Barrel of Throughput and Adjusted Gross Margin Per Barrel of Throughput for Conventional, Renewable and the Mobile Refinery as a whole (collectively, the “KPIs”). EBITDA represents net income before interest, taxes, depreciation and amortization, for continued and discontinued operations. Adjusted EBITDA represents EBITDA from operations plus or minus unrealized gain or losses on hedging activities, Renewable Fuel Standard (RFS) costs (mainly related to Renewable Identification Numbers (RINs), and inventory adjustments, acquisition costs, gain on change in value of derivative warrant liability, environmental clean-up, stock-based compensation, (gain) loss on sale of assets, and certain other unusual or non-recurring charges included in selling, general, and administrative expenses. Adjusted Gross Margin is defined as gross profit (loss) plus or minus unrealized gain or losses on hedging activities and inventory valuation adjustments. Fuel Gross Margin is defined as Adjusted Gross Margin, plus production costs, operating expenses and depreciation attributable to cost of revenues and other non-fuel items included in costs of revenues including realized and unrealized gain or losses on hedging activities, RFS costs (mainly related to RINs), fuel financing costs and other revenues and cost of sales items. Fuel Gross Margin Per Barrel of Throughput is calculated as fuel gross margin divided by total throughput barrels for the period presented. Operating Expenses Per Barrel of Throughput is defined as total operating expenses divided by total barrels of throughput. RIN Adjusted Fuel Gross Margin is defined as Fuel Gross Margin minus RIN expense divided by total barrels of throughput. RIN Adjusted Fuel Gross Margin Per Barrel of Throughput is calculated as RIN Adjusted Fuel Gross Margin divided by total throughput barrels for the period presented. Net Long-Term Debt is long-term debt and lease obligations, adjusted for unamortized discount and deferred financing costs, insurance premiums financed, less cash and cash equivalents and restricted cash. Ratio of Net Long-Term Debt is defined as Long-Term Debt divided by Adjusted EBITDA.
| 7 |
Each of the Non-U.S. GAAP Financial Measures and KPIs are discussed in greater detail below. The (a) Non-U.S. GAAP Financial Measures are “non-U.S. GAAP financial measures”, and (b) the KPIs are, presented as supplemental measures of the Company’s performance. They are not presented in accordance with U.S. GAAP. We use the Non-U.S. GAAP Financial Measures and KPIs as supplements to U.S. GAAP measures of performance to evaluate the effectiveness of our business strategies, to make budgeting decisions, to allocate resources and to compare our performance relative to our peers. Additionally, these measures, when used in conjunction with related U.S. GAAP financial measures, provide investors with an additional financial analytical framework which management uses, in addition to historical operating results, as the basis for financial, operational and planning decisions and present measurements that third parties have indicated are useful in assessing the Company and its results of operations. The Non-U.S. GAAP Financial Measures and KPIs are presented because we believe they provide additional useful information to investors due to the various noncash items during the period. Non-U.S. GAAP financial information and KPIs similar to the Non-U.S. GAAP Financial Measures and KPIs are also frequently used by analysts, investors and other interested parties to evaluate companies in our industry. The Non-U.S. GAAP Financial Measures and KPIs are unaudited, and have limitations as analytical tools, and you should not consider them in isolation, or as a substitute for analysis of our operating results as reported under U.S. GAAP. Some of these limitations are: the Non-U.S. GAAP Financial Measures and KPIs do not reflect cash expenditures, or future requirements for capital expenditures, or contractual commitments; the Non-GAAP Financial Measures and KPIs do not reflect changes in, or cash requirements for, working capital needs; the Non-GAAP Financial Measures and KPIs do not reflect the significant interest expense, or the cash requirements necessary to service interest or principal payments, on debt or cash income tax payments; although depreciation and amortization are noncash charges, the assets being depreciated and amortized will often have to be replaced in the future, the Non-U.S. GAAP Financial Measures and KPIs do not reflect any cash requirements for such replacements; the Non-U.S. GAAP Financial Measures and KPIs represent only a portion of our total operating results; and other companies in this industry may calculate the Non-U.S. GAAP Financial Measures and KPIs differently than we do, limiting their usefulness as a comparative measure. You should not consider the Non-U.S. GAAP Financial Measures and KPIs in isolation, or as substitutes for analysis of the Company’s results as reported under U.S. GAAP. The Company’s presentation of these measures should not be construed as an inference that future results will be unaffected by unusual or nonrecurring items. We compensate for these limitations by providing a reconciliation of each of these non-U.S. GAAP Financial Measures and KPIs to the most comparable U.S. GAAP measure below. We encourage investors and others to review our business, results of operations, and financial information in their entirety, not to rely on any single financial measure, and to view these non-U.S. GAAP Financial Measures and KPIs in conjunction with the most directly comparable U.S. GAAP financial measure.
For more information on these non-GAAP financial measures and KPIs, please see the sections titled “Unaudited Reconciliation of Gross Profit (Loss) From Continued and Discontinued Operations to Adjusted Gross Margin, Fuel Gross Margin, Fuel Gross Margin Per Barrel of Throughput and Operating Expenses Per Barrel of Throughput”, “Unaudited Reconciliation of Adjusted EBITDA to Net loss from Continued and Discontinued Operations”, and “Unaudited Reconciliation of Long-Term Debt to Net Long-Term Debt and Net Leverage”, at the end of this release.
| 8 |
| VERTEX ENERGY, INC. | ||||||||
| CONSOLIDATED BALANCE SHEETS | ||||||||
| (in thousands, except number of shares and par value) | ||||||||
| (UNAUDITED) | ||||||||
| March 31, 2024 | December 31, 2023 | |||||||
| ASSETS | ||||||||
| Current assets | ||||||||
| Cash and cash equivalents | $ | 62,140 | $ | 76,967 | ||||
| Restricted cash | 3,609 | 3,606 | ||||||
| Accounts receivable, net | 41,559 | 36,164 | ||||||
| Inventory | 198,979 | 182,120 | ||||||
| Prepaid expenses and other current assets | 38,673 | 53,174 | ||||||
| Total current assets | 344,960 | 352,031 | ||||||
| Fixed assets, net | 332,949 | 326,111 | ||||||
| Finance lease right-of-use assets | 63,524 | 64,499 | ||||||
| Operating lease right-of use assets | 78,802 | 96,394 | ||||||
| Intangible assets, net | 10,789 | 11,541 | ||||||
| Other assets | 4,029 | 4,048 | ||||||
| TOTAL ASSETS’ | $ | 835,053 | $ | 854,624 | ||||
| LIABILITIES AND EQUITY | ||||||||
| Current liabilities | ||||||||
| Accounts payable | $ | 69,796 | $ | 75,004 | ||||
| Accrued expenses and other current liabilities | 69,240 | 73,636 | ||||||
| Finance lease liability-current | 2,497 | 2,435 | ||||||
| Operating lease liability-current | 13,281 | 20,296 | ||||||
| Current portion of long-term debt, net | 12,524 | 16,362 | ||||||
| Obligations under inventory financing agreements, net | 169,656 | 141,093 | ||||||
| Total current liabilities | 336,994 | 328,826 | ||||||
| Long-term debt, net | 177,772 | 170,701 | ||||||
| Finance lease liability-long-term | 65,576 | 66,206 | ||||||
| Operating lease liability-long-term | 64,345 | 74,444 | ||||||
| Deferred tax liabilities | 2,776 | 2,776 | ||||||
| Derivative warrant liability | 3,249 | 9,907 | ||||||
| Other liabilities | 1,377 | 1,377 | ||||||
| Total liabilities | 652,089 | 654,237 | ||||||
| EQUITY | ||||||||
| Common stock, $0.001 par value per share; 750,000,000 shares authorized; 93,514,346 and 93,514,346 shares issued and outstanding at March 31, 2024 and December 31, 2023, respectively. | 94 | 94 | ||||||
| Additional paid-in capital | 384,063 | 383,632 | ||||||
| Accumulated deficit | (205,113 | ) | (187,379 | ) | ||||
| Total Vertex Energy, Inc. shareholders’ equity | 179,044 | 196,347 | ||||||
| Non-controlling interest | 3,920 | 4,040 | ||||||
| Total equity | 182,964 | 200,387 | ||||||
| TOTAL LIABILITIES AND EQUITY | $ | 835,053 | $ | 854,624 | ||||
| 9 |
VERTEX ENERGY, INC.
CONSOLIDATED STATEMENTS OF OPERATIONS
(in thousands, except per share amounts)
(UNAUDITED)
| Three Months Ended March 31, | ||||||||
| 2024 | 2023 | |||||||
| Revenues | $ | 695,326 | $ | 691,142 | ||||
| Cost of revenues (exclusive of depreciation and amortization shown separately below) | 652,034 | 619,352 | ||||||
| Depreciation and amortization attributable to costs of revenues | 8,186 | 4,337 | ||||||
| Gross profit | 35,106 | 67,453 | ||||||
| Operating expenses: | ||||||||
| Selling, general and administrative expenses (exclusive of depreciation and amortization shown separately below) | 39,782 | 41,942 | ||||||
| Depreciation and amortization attributable to operating expenses | 1,104 | 1,016 | ||||||
| Total operating expenses | 40,886 | 42,958 | ||||||
| Income (loss) from operations | (5,780 | ) | 24,495 | |||||
| Other income (expense): | ||||||||
| Other income (expenses) | (1,049 | ) | 1,653 | |||||
| Gain (loss) on change in value of derivative warrant liability | 6,658 | (9,185 | ) | |||||
| Interest expense | (17,683 | ) | (12,477 | ) | ||||
| Total other expense | (12,074 | ) | (20,009 | ) | ||||
| Income (loss) from continuing operations before income tax | (17,854 | ) | 4,486 | |||||
| Income tax expense | — | (1,013 | ) | |||||
| Income (loss) from continuing operations | (17,854 | ) | 3,473 | |||||
| Income from discontinued operations, net of tax (see note 22) | — | 50,340 | ||||||
| Net income (loss) | (17,854 | ) | 53,813 | |||||
| Net loss attributable to non-controlling interest from continuing operations | (120 | ) | (50 | ) | ||||
| Net income (loss) attributable to Vertex Energy, Inc. | (17,734 | ) | 53,863 | |||||
| Net income (loss) attributable to common shareholders from continuing operations | (17,734 | ) | 3,523 | |||||
| Net income attributable to common shareholders from discontinued operations, net of tax | — | 50,340 | ||||||
| Net income (loss) attributable to common shareholders | $ | (17,734 | ) | $ | 53,863 | |||
| Basic income (loss) per common share | ||||||||
| Continuing operations | $ | (0.19 | ) | $ | 0.05 | |||
| Discontinued operations, net of tax | — | 0.66 | ||||||
| Basic income (loss) per common share | $ | (0.19 | ) | $ | 0.71 | |||
| Diluted income (loss) per common share | ||||||||
| Continuing operations | $ | (0.19 | ) | $ | 0.04 | |||
| Discontinued operations, net of tax | — | 0.64 | ||||||
| Diluted income (loss) per common share | $ | (0.19 | ) | $ | 0.68 | |||
| Shares used in computing earnings per share | ||||||||
| Basic | 93,514 | 75,689 | ||||||
| Diluted | 93,514 | 78,996 | ||||||
| 10 |
VERTEX ENERGY, INC.
CONSOLIDATED STATEMENTS OF STOCKHOLDERS EQUITY
(in thousands, except par value)
(UNAUDITED)
| Three Months Ended March 31, 2024 | ||||||||||||||||||||||||
| Common Stock | ||||||||||||||||||||||||
| Shares | $0.001 Par | Additional Paid-In Capital | Accumulated Deficit | Non-controlling Interest | Total Equity | |||||||||||||||||||
| Balance on January 1, 2024 | 93,515 | $ | 94 | $ | 383,632 | $ | (187,379 | ) | $ | 4,040 | $ | 200,387 | ||||||||||||
| Stock based compensation expense | — | — | 431 | — | — | 431 | ||||||||||||||||||
| Net loss | — | — | — | (17,734 | ) | (120 | ) | (17,854 | ) | |||||||||||||||
| Balance on March 31, 2024 | 93,515 | $ | 94 | $ | 384,063 | $ | (205,113 | ) | $ | 3,920 | $ | 182,964 | ||||||||||||
| Three Months Ended March 31, 2023 | ||||||||||||||||||||||||
| Common Stock | ||||||||||||||||||||||||
| Shares | $0.001 Par | Additional Paid-In Capital | Accumulated Deficit | Non-controlling Interest | Total Equity | |||||||||||||||||||
| Balance on January 1, 2023 | 75,670 | $ | 76 | $ | 279,552 | $ | (115,893 | ) | $ | 1,685 | $ | 165,420 | ||||||||||||
| Exercise of options | 166 | — | 209 | — | — | 209 | ||||||||||||||||||
| Stock based compensation expense | — | — | 365 | — | — | 365 | ||||||||||||||||||
| Non-controlling shareholder contribution | — | — | — | — | 980 | 980 | ||||||||||||||||||
| Net income (loss) | — | — | — | 53,863 | (50 | ) | 53,813 | |||||||||||||||||
| Balance on March 31, 2023 | 75,836 | $ | 76 | $ | 280,126 | $ | (62,030 | ) | $ | 2,615 | $ | 220,787 | ||||||||||||
| 11 |
VERTEX ENERGY, INC.
CONSOLIDATED STATEMENTS OF CASH FLOWS
(in thousands)
(UNAUDITED)
| Three Months Ended | ||||||||
| March 31, 2024 | March 31, 2023 | |||||||
| Cash flows from operating activities | ||||||||
| Net income (loss) | $ | (17,854 | ) | $ | 53,813 | |||
| Income from discontinued operations, net of tax | — | 50,340 | ||||||
| Income (loss) from continuing operations | (17,854 | ) | 3,473 | |||||
| Adjustments to reconcile net loss from continuing operations to cash used in operating activities | ||||||||
| Stock based compensation expense | 431 | 365 | ||||||
| Depreciation and amortization | 9,290 | 5,353 | ||||||
| Deferred income tax expense | — | 1,013 | ||||||
| Loss on lease modification | 35 | — | ||||||
| Loss on sale of assets | 691 | 3 | ||||||
| Increase in allowance for credit losses | 19 | 882 | ||||||
| Increase (decrease) in fair value of derivative warrant liability | (6,658 | ) | 9,185 | |||||
| (Gain) loss on commodity derivative contracts | 1,322 | (1,516 | ) | |||||
| Net cash settlements on commodity derivatives | (2,292 | ) | 3,519 | |||||
| Amortization of debt discount and deferred costs | 4,758 | 4,572 | ||||||
| Changes in operating assets and liabilities | ||||||||
| Accounts receivable and other receivables | (4,180 | ) | (26,291 | ) | ||||
| Inventory | (16,859 | ) | (52,553 | ) | ||||
| Prepaid expenses and other current assets | 14,710 | (18,103 | ) | |||||
| Accounts payable | (5,250 | ) | 11,005 | |||||
| Accrued expenses | (7,308 | ) | 22,486 | |||||
| Other assets | 19 | (44 | ) | |||||
| Net cash used in operating activities from continuing operations | (29,126 | ) | (36,651 | ) | ||||
| Cash flows from investing activities | ||||||||
| Purchase of fixed assets | (14,726 | ) | (73,936 | ) | ||||
| Proceeds from sale of discontinued operation | — | 87,238 | ||||||
| Proceeds from sale of fixed assets | 2,576 | — | ||||||
| Net cash provided by (used in) investing activities from continuing operations | (12,150 | ) | 13,302 | |||||
| Cash flows from financing activities | ||||||||
| Payments on finance leases | (586 | ) | (310 | ) | ||||
| Proceeds from exercise of options and warrants to common stock | — | 209 | ||||||
| Contributions received from noncontrolling interest | — | 980 | ||||||
| Net change on inventory financing agreements | 28,313 | (11,284 | ) | |||||
| Proceeds from note payable | 3,175 | — | ||||||
| Payments on note payable | (4,450 | ) | (17,165 | ) | ||||
| Net cash provided by (used in) financing activities from continuing operations | 26,452 | (27,570 | ) | |||||
| Discontinued operations: | ||||||||
| Net cash provided by (used in) operating activities | — | (150 | ) | |||||
| Net cash provided by (used in) discontinued operations | — | (150 | ) | |||||
| Net decrease in cash, cash equivalents and restricted cash | (14,824 | ) | (51,069 | ) | ||||
| Cash, cash equivalents, and restricted cash at beginning of the period | 80,573 | 146,187 | ||||||
| Cash, cash equivalents, and restricted cash at end of period | $ | 65,749 | $ | 95,118 | ||||
| 12 |
The following table provides a reconciliation of cash and cash equivalents and restricted cash reported within the consolidated balance sheets to the same amounts shown in the consolidated statements of cash flows (in thousands).
VERTEX ENERGY, INC.
CONSOLIDATED STATEMENTS OF CASH FLOWS
(in thousands)
(UNAUDITED)
(Continued)
| Three Months Ended | ||||||||
| March 31, 2024 | March 31, 2023 | |||||||
| Cash and cash equivalents | $ | 62,140 | $ | 86,689 | ||||
| Restricted cash | 3,609 | 8,429 | ||||||
| Cash and cash equivalents and restricted cash as shown in the consolidated statements of cash flows | $ | 65,749 | $ | 95,118 | ||||
| SUPPLEMENTAL INFORMATION | ||||||||
| Cash paid for interest | $ | 4,811 | $ | 10,124 | ||||
| Cash paid for taxes | $ | — | $ | — | ||||
| NON-CASH INVESTING AND FINANCING TRANSACTIONS | ||||||||
| ROU assets obtained from new finance leases | $ | 18 | $ | 15,024 | ||||
| ROU assets obtained from new operating leases | $ | 74 | $ | 15,078 | ||||
| ROU assets disposed under operating leases | $ | (17,666 | ) | $ | — | |||
| 13 |
Unaudited segment information for the three months ended March 31, 2024 and 2023 is as follows (in thousands):
| THREE MONTHS ENDED MARCH 31, 2024 | ||||||||||||||||
Refining
& | Black Oil & Recovery | Corporate and Eliminations | Total | |||||||||||||
| Revenues: | ||||||||||||||||
| Refined products | $ | 650,759 | $ | 31,724 | $ | (1,022 | ) | $ | 681,461 | |||||||
| Re-refined products | 3,867 | 5,215 | — | 9,082 | ||||||||||||
| Services | 3,081 | 1,702 | — | 4,783 | ||||||||||||
| Total revenues | 657,707 | 38,641 | (1,022 | ) | 695,326 | |||||||||||
| Cost of revenues (exclusive of depreciation and amortization shown separately below) | 622,974 | 30,082 | (1,022 | ) | 652,034 | |||||||||||
| Depreciation and amortization attributable to costs of revenues | 6,541 | 1,645 | — | 8,186 | ||||||||||||
| Gross profit | 28,192 | 6,914 | — | 35,106 | ||||||||||||
| Selling, general and administrative expenses | 26,147 | 5,397 | 8,238 | 39,782 | ||||||||||||
| Depreciation and amortization attributable to operating expenses | 793 | 72 | 239 | 1,104 | ||||||||||||
| Income (loss) from operations | 1,252 | 1,445 | (8,477 | ) | (5,780 | ) | ||||||||||
| Other income (expenses) | ||||||||||||||||
| Other expense | (685 | ) | (359 | ) | (5 | ) | (1,049 | ) | ||||||||
| Gain on change in derivative liability | — | — | 6,658 | 6,658 | ||||||||||||
| Interest expense | (4,747 | ) | (96 | ) | (12,840 | ) | (17,683 | ) | ||||||||
| Total other expense | (5,432 | ) | (455 | ) | (6,187 | ) | (12,074 | ) | ||||||||
| Income (loss) from continuing operations before income tax | $ | (4,180 | ) | $ | 990 | $ | (14,664 | ) | $ | (17,854 | ) | |||||
| Capital expenditures | $ | 11,299 | $ | 3,427 | $ | — | $ | 14,726 | ||||||||
| 14 |
| THREE MONTHS ENDED MARCH 31, 2023 | ||||||||||||||||
Refining
& | Black Oil & Recovery | Corporate and Eliminations | Total | |||||||||||||
| Revenues: | ||||||||||||||||
| Refined products | $ | 653,042 | $ | 29,423 | $ | (2,733 | ) | $ | 679,732 | |||||||
| Re-refined products | 4,353 | 4,411 | — | 8,764 | ||||||||||||
| Services | 1,933 | 713 | — | 2,646 | ||||||||||||
| Total revenues | 659,328 | 34,547 | (2,733 | ) | 691,142 | |||||||||||
| Cost of revenues (exclusive of depreciation and amortization shown separately below) | 589,812 | 30,418 | (878 | ) | 619,352 | |||||||||||
| Depreciation and amortization attributable to costs of revenues | 3,294 | 1,043 | — | 4,337 | ||||||||||||
| Gross profit | 66,222 | 3,086 | (1,855 | ) | 67,453 | |||||||||||
| Selling, general and administrative expenses | 26,486 | 4,799 | 10,657 | 41,942 | ||||||||||||
| Depreciation and amortization attributable to operating expenses | 808 | 38 | 170 | 1,016 | ||||||||||||
| Income (loss) from operations | 38,928 | (1,751 | ) | (12,682 | ) | 24,495 | ||||||||||
| Other income (expenses) | ||||||||||||||||
| Other income (expense) | — | 1,655 | (2 | ) | 1,653 | |||||||||||
| Loss on change in derivative liability | — | — | (9,185 | ) | (9,185 | ) | ||||||||||
| Interest expense | (3,876 | ) | (57 | ) | (8,544 | ) | (12,477 | ) | ||||||||
| Total other income (expense) | (3,876 | ) | 1,598 | (17,731 | ) | (20,009 | ) | |||||||||
| Income (loss) from continuing operations before income tax | $ | 35,052 | $ | (153 | ) | $ | (30,413 | ) | $ | 4,486 | ||||||
| Capital expenditures | $ | 69,908 | $ | 4,028 | $ | — | $ | 73,936 | ||||||||
Unaudited Reconciliation of Gross Profit (Loss) From Continued and Discontinued Operations to Adjusted Gross Margin, Fuel Gross Margin, Fuel Gross Margin Per Barrel of Throughput and Operating Expenses Per Barrel of Throughput.
| Three Months Ended March 31, 2024 | ||||||||||||
| In thousands | Conventional | Renewable | Mobile Refinery Total | |||||||||
| Gross profit | $ | 37,508 | $ | (10,462 | ) | $ | 27,047 | |||||
| Unrealized (gain) loss on hedging activities | (555 | ) | 934 | 379 | ||||||||
| Inventory valuation adjustments | 9,657 | 4,592 | 14,249 | |||||||||
| Adjusted gross margin | $ | 46,610 | $ | (4,936 | ) | $ | 41,674 | |||||
| Variable production costs attributable to cost of revenues | 25,651 | 6,846 | 32,497 | |||||||||
| Depreciation and amortization attributable to cost of revenues | 2,558 | 3,932 | 6,490 | |||||||||
| RINs | (857 | ) | — | (857 | ) | |||||||
| Realized (gain) loss on hedging activities | 2,577 | (1,783 | ) | 794 | ||||||||
| Financing costs | (172 | ) | 132 | (40 | ) | |||||||
| Other revenues | (2,719 | ) | (362 | ) | (3,081 | ) | ||||||
| Fuel gross margin | $ | 73,648 | $ | 3,829 | $ | 77,477 | ||||||
| Throughput (bpd) | 64,065 | 4,090 | 68,155 | |||||||||
| Fuel gross margin per barrel of throughput | $ | 12.63 | $ | 10.29 | $ | 12.49 | ||||||
| Total OPEX | $ | 16,061 | $ | 9,382 | $ | 25,443 | ||||||
| Operating expenses per barrel of throughput | $ | 2.75 | $ | 25.21 | $ | 4.10 | ||||||
| Three Months Ended December 31, 2023 | ||||||||||||
| In thousands | Conventional | Renewable | Mobile Refinery Total | |||||||||
| Gross profit | $ | 7,283 | $ | (17,557 | ) | $ | (10,273 | ) | ||||
| Unrealized (gain) loss on hedging activities | 4,892 | 77 | 4,969 | |||||||||
| Inventory valuation adjustments | (3,400 | ) | 2,152 | (1,248 | ) | |||||||
| Adjusted gross margin | $ | 8,775 | $ | (15,328 | ) | $ | (6,553 | ) | ||||
| Variable production costs attributable to cost of revenues | 19,770 | 19,497 | 39,267 | |||||||||
| Depreciation and amortization attributable to cost of revenues | 2,492 | 3,997 | 6,489 | |||||||||
| RINs | 6,662 | — | 6,662 | |||||||||
| Realized (gain) loss on hedging activities | (3,751 | ) | (3,587 | ) | (7,338 | ) | ||||||
| Financing costs | 1,989 | 157 | 2,146 | |||||||||
| Other revenues | (6,361 | ) | (361 | ) | (6,722 | ) | ||||||
| Fuel gross margin | $ | 29,576 | $ | 4,375 | $ | 33,951 | ||||||
| Throughput (bpd) | 67,083 | 3,926 | 71,009 | |||||||||
| Fuel gross margin per barrel of throughput | $ | 4.79 | $ | 12.11 | $ | 5.20 | ||||||
| Total OPEX | $ | 15,162 | $ | 9,868 | $ | 25,030 | ||||||
| Operating expenses per barrel of throughput | $ | 2.46 | $ | 27.32 | $ | 3.83 | ||||||
| 15 |
| Twelve Months Ended March 31, 2024 | ||||||||||||
| In thousands | Conventional | Renewable | Mobile Refinery Total | |||||||||
| Gross profit | $ | 137,519 | $ | (49,540 | ) | $ | 87,979 | |||||
| Unrealized (gain) loss on hedging activities | 566 | 302 | 868 | |||||||||
| Inventory valuation adjustments | 15,236 | 6,638 | 21,874 | |||||||||
| Adjusted gross margin | $ | 153,321 | $ | (42,600 | ) | $ | 110,721 | |||||
| Variable production costs attributable to cost of revenues | 100,954 | 39,378 | 140,332 | |||||||||
| Depreciation and amortization attributable to cost of revenues | 11,383 | 13,267 | 24,650 | |||||||||
| RINs | 38,273 | — | 38,273 | |||||||||
| Realized (gain) loss on hedging activities | 530 | (1,681 | ) | (1,151 | ) | |||||||
| Financing costs | 3,502 | 552 | 4,054 | |||||||||
| Other revenues | (19,494 | ) | (1,437 | ) | (20,931 | ) | ||||||
| Fuel gross margin | $ | 288,469 | $ | 7,479 | $ | 295,948 | ||||||
| Throughput (bpd) | 71,922 | 3,980 | 75,901 | |||||||||
| Fuel gross margin per barrel of throughput | $ | 10.96 | $ | 5.13 | $ | 10.65 | ||||||
| Total OPEX | $ | 72,242 | $ | 37,771 | $ | 110,013 | ||||||
| Operating expenses per barrel of throughput | $ | 2.74 | $ | 25.93 | $ | 3.96 | ||||||
| 16 |
Unaudited Reconciliation of Adjusted EBITDA to Net loss from Continued and Discontinued Operations.
| In thousands | Three Months Ended | Twelve Months Ended | ||||||||||||||
| March 31, 2024 | March 31, 2023 | March 31, 2024 | March 31, 2023 | |||||||||||||
| Net income (loss) | $ | (17,854 | ) | $ | 53,813 | $ | (143,641 | ) | $ | 56,619 | ||||||
| Depreciation and amortization | 9,290 | 5,498 | 35,102 | 22,527 | ||||||||||||
| Income tax expense (benefit) | — | 18,759 | (13,462 | ) | 16,269 | |||||||||||
| Interest expense | 17,683 | 12,477 | 124,773 | 88,192 | ||||||||||||
| EBITDA | $ | 9,119 | $ | 90,547 | $ | 2,772 | $ | 183,607 | ||||||||
| Unrealized (gain) loss on hedging activities | 445 | (255 | ) | 448 | (133 | ) | ||||||||||
| Inventory valuation adjustments | 14,249 | (1,532 | ) | 21,874 | 49,234 | |||||||||||
| Gain on change in value of derivative warrant liability | (6,658 | ) | 9,185 | (23,835 | ) | (2,215 | ) | |||||||||
| Stock-based compensation | 430 | 365 | 2,350 | 1,689 | ||||||||||||
| (Gain) loss on sale of assets | 691 | (67,741 | ) | (2,446 | ) | (67,325 | ) | |||||||||
| Acquisition costs | — | 4,308 | — | 16,275 | ||||||||||||
| Environmental clean-up reserve | — | — | — | 1,428 | ||||||||||||
| Other | 358 | 0 | (276 | ) | 280 | |||||||||||
| Adjusted EBITDA | $ | 18,634 | $ | 34,877 | $ | 887 | $ | 182,841 | ||||||||
| 17 |
| Three Months Ended March 31, 2024 | ||||||||||||||||||||||||||||
| Mobile Refinery | Legacy Refining & Marketing | Total Refining & Marketing | Black Oil and Recovery | Corporate | Consolidated | |||||||||||||||||||||||
| In thousands | Conventional | Renewable | ||||||||||||||||||||||||||
| Net income (loss) | $ | 17,535 | $ | (22,157 | ) | $ | 442 | $ | (4,180 | ) | $ | 990 | $ | (14,664 | ) | $ | (17,854 | ) | ||||||||||
| Depreciation and amortization | 3,330 | 3,953 | 51 | 7,334 | 1,717 | 239 | 9,290 | |||||||||||||||||||||
| Income tax expense (benefit) | — | — | — | — | — | — | — | |||||||||||||||||||||
| Interest expense | 2,455 | 2,292 | — | 4,747 | 96 | 12,840 | 17,683 | |||||||||||||||||||||
| EBITDA | $ | 23,320 | $ | (15,912 | ) | $ | 493 | $ | 7,901 | $ | 2,803 | $ | (1,585 | ) | $ | 9,119 | ||||||||||||
| Unrealized (gain) loss on hedging activities | (555 | ) | 934 | 20 | 399 | 46 | — | 445 | ||||||||||||||||||||
| Inventory valuation adjustments | 9,657 | 4,592 | — | 14,249 | — | — | 14,249 | |||||||||||||||||||||
| Gain on change in value of derivative warrant liability | — | — | — | — | — | (6,658 | ) | (6,658 | ) | |||||||||||||||||||
| Stock-based compensation | — | — | — | — | — | 430 | 430 | |||||||||||||||||||||
| (Gain) loss on sale of assets | 685 | — | — | 685 | 5 | 1 | 691 | |||||||||||||||||||||
| Other | — | — | — | — | 354 | 4 | 358 | |||||||||||||||||||||
| Adjusted EBITDA | $ | 33,107 | $ | (10,386 | ) | $ | 513 | $ | 23,234 | $ | 3,208 | $ | (7,808 | ) | $ | 18,634 | ||||||||||||
| 18 |
| Three Months Ended December 31, 2023 | ||||||||||||||||||||||||||||
| Mobile Refinery | Legacy Refining & Marketing | Total Refining & Marketing | Black Oil and Recovery | Corporate | Consolidated | |||||||||||||||||||||||
| In thousands | Conventional | Renewable | ||||||||||||||||||||||||||
| Net income (loss) | $ | (11,112 | ) | $ | (30,266 | ) | $ | (2,424 | ) | $ | (43,801 | ) | $ | (1,670 | ) | $ | (18,395 | ) | $ | (63,865 | ) | |||||||
| Depreciation and amortization | 3,252 | 4,017 | 313 | 7,582 | 1,476 | 167 | 9,225 | |||||||||||||||||||||
| Income tax expense (benefit) | — | — | — | — | (517 | ) | 2,060 | 1,543 | ||||||||||||||||||||
| Interest expense | 2,473 | 2,820 | — | 5,293 | 62 | 10,675 | 16,029 | |||||||||||||||||||||
| EBITDA | $ | (5,387 | ) | $ | (23,429 | ) | $ | (2,111 | ) | $ | (30,926 | ) | $ | (649 | ) | $ | (5,493 | ) | $ | (37,068 | ) | |||||||
| Unrealized (gain) loss on hedging activities | 4,892 | 77 | (7 | ) | 4,962 | 19 | — | 4,981 | ||||||||||||||||||||
| Inventory valuation adjustments | (3,400 | ) | 2,152 | — | (1,248 | ) | — | — | (1,248 | ) | ||||||||||||||||||
| Gain on change in value of derivative warrant liability | — | — | — | — | — | (2,956 | ) | (2,956 | ) | |||||||||||||||||||
| Stock-based compensation | — | — | — | — | — | 783 | 783 | |||||||||||||||||||||
| (Gain) loss on sale of assets | — | — | — | — | — | 3 | 3 | |||||||||||||||||||||
| Acquisition costs | — | — | — | — | — | — | — | |||||||||||||||||||||
| Other | — | — | — | — | 389 | (1 | ) | 388 | ||||||||||||||||||||
| Adjusted EBITDA | $ | (3,895 | ) | $ | (21,200 | ) | $ | (2,118 | ) | $ | (27,212 | ) | $ | (241 | ) | $ | (7,664 | ) | $ | (35,117 | ) | |||||||
| Twelve Months Ended March 31, 2024 | ||||||||||||||||||||||||||||
| Mobile Refinery | Legacy Refining & Marketing | Total Refining & Marketing | Black Oil and Recovery | Corporate | Consolidated | |||||||||||||||||||||||
| In thousands | Conventional | Renewable | ||||||||||||||||||||||||||
| Net income (loss) | $ | 49,932 | $ | (94,694 | ) | $ | (4,782 | ) | $ | (49,544 | ) | $ | 48,246 | $ | (142,343 | ) | $ | (143,641 | ) | |||||||||
| Depreciation and amortization | 14,387 | 13,343 | 932 | 28,662 | 5,700 | 740 | 35,102 | |||||||||||||||||||||
| Income tax expense (benefit) | — | — | — | — | 18,682 | (32,144 | ) | (13,462 | ) | |||||||||||||||||||
| Interest expense | 11,656 | 7,307 | — | 18,963 | 227 | 105,583 | 124,773 | |||||||||||||||||||||
| EBITDA | $ | 75,975 | $ | (74,044 | ) | $ | (3,850 | ) | $ | (1,919 | ) | $ | 72,855 | $ | (68,164 | ) | $ | 2,772 | ||||||||||
| Unrealized (gain) loss on hedging activities | 566 | 302 | (2 | ) | 866 | (418 | ) | — | 448 | |||||||||||||||||||
| Inventory valuation adjustments | 15,236 | 6,638 | — | 21,874 | — | — | 21,874 | |||||||||||||||||||||
| Gain on change in value of derivative warrant liability | — | — | — | — | — | (23,835 | ) | (23,835 | ) | |||||||||||||||||||
| Stock-based compensation | — | — | — | — | — | 2,350 | 2,350 | |||||||||||||||||||||
| (Gain) loss on sale of assets | 685 | — | — | 685 | (69,224 | ) | 66,093 | (2,446 | ) | |||||||||||||||||||
| Other | — | — | — | — | (241 | ) | (35 | ) | (276 | ) | ||||||||||||||||||
| Adjusted EBITDA | $ | 92,462 | $ | (67,104 | ) | $ | (3,852 | ) | $ | 21,506 | $ | 2,972 | $ | (23,591 | ) | $ | 887 | |||||||||||
Unaudited Reconciliation of Long-Term Debt to Net Long-Term Debt and Net Leverage.
| 19 |
| In thousands | As of | |||||||||||
| March 31, 2024 | March 31, 2023 | December 31, 2023 | ||||||||||
| Long-Term Debt: | ||||||||||||
| Senior Convertible Note | $ | 15,230 | $ | 95,178 | $ | 15,230 | ||||||
| Term Loan 2025 | 195,950 | 152,138 | 195,950 | |||||||||
| Promissory Note | 2,612 | — | — | |||||||||
| Finance lease liability long-term | 65,576 | 59,325 | 66,206 | |||||||||
| Finance lease liability short-term | 2,497 | 1,916 | 2,435 | |||||||||
| Insurance premiums financed | 2,399 | 1,359 | 6,237 | |||||||||
| Long-Term Debt and Lease Obligations | $ | 284,264 | $ | 309,916 | $ | 286,058 | ||||||
| Unamortized discount and deferred financing costs | (25,893 | ) | (77,596 | ) | (30,354 | ) | ||||||
| Long-Term Debt and Lease Obligations per Balance Sheet | $ | 258,371 | $ | 232,320 | $ | 255,704 | ||||||
| Cash and Cash Equivalents | (62,140 | ) | (86,689 | ) | (76,967 | ) | ||||||
| Restricted Cash | (3,609 | ) | (8,429 | ) | (3,606 | ) | ||||||
| Less Total Cash and Cash Equivalents | $ | (65,749 | ) | $ | (95,118 | ) | $ | (80,573 | ) | |||
| Net Long-Term Debt | $ | 218,515 | $ | 214,798 | $ | 205,485 | ||||||
| Adjusted EBITDA | $ | 887 | $ | 182,898 | $ | 17,130 | ||||||
| Net Leverage | 246.4 | x | 1.2 | x | 12.0 | x | ||||||
Note: Net Leverage is calculated using trailing twelve months Adjusted EBITDA
| 20 |
Exhibit 99.2

First Quarter 2024 Results Summary Presentation May 2024
DISCLAIMER Forward - looking statements 2 Forward - Looking Statements Certain of the matters discussed in this presentation which are not statements of historical fact constitute forward - looking sta tements within the meaning of the securities laws, including the Private Securities Litigation Reform Act of 1995, that invol ve a number of risks and uncertainties. Words such as “strategy,” “expects,” “continues,” “plans,” “anticipates,” “believes,” “would,” “will,” “estimates,” “intends,” “projects,” “goals,” “targets” and other words of similar me aning are intended to identify forward - looking statements but are not the exclusive means of identifying these statements. Any s tatements made in this presentation other than those of historical fact, about an action, event or development, are forward - looking statements. The important factors that may cause actual results and outcomes to differ material ly from those contained in such forward - looking statements include, without limitation; statements concerning: the Company’s pro jected Outlook for the second quarter of 2024, the costs associated with, and outcome of the Company’s plans to optimize conventional fuel and renewal diesel production moving forward, as discussed above; the Compa ny’ s engagement of BofA Securities, Inc., as previously disclosed; the review and evaluation of potential joint ventures, divestitures, acquisitions, m ergers, business combinations, or other strategic transactions, the outcome of such review, and the impact on any such transactions, or the review thereof and their impact on shareholder value; the pro ces s by which the Company engages in evaluation of strategic transactions; the Company’s ability to identify potential partners; th e outcome of potential future strategic transactions and the terms thereof; the future production of the Company’s Mobile, Alabama Refinery (the “Mobile Refinery”); anticipated and unforeseen events which could reduce futur e p roduction at the refinery or delay future capital projects, and changes in commodity and credit values; throughput volumes, p rod uction rates, yields, operating expenses and capital expenditures at the Mobile Refinery; the timing of, and outcome of, the evaluation and associated carbon intensity scoring of the Company’s feedstock blends by of fic ials in the state of California; the ability of the Company to obtain low carbon fuel standard (LCFS) credits , and the amoun ts thereof; the need for additional capital in the future, including, but not limited to, in order to complete capital projects and satisfy liabilities, the Company’s ability to raise such capital in the future, and the terms o f s uch funding, including dilution caused thereby; the timing of capital projects at the Company’s refinery located in Mobile, A lab ama (the “Mobile Refinery”) and the outcome of such projects; the future production of the Mobile Refinery, including but not limited to, renewable diesel and conventional production and the breakdown between the two; estim ate d and actual production and costs associated with the renewable diesel capital project; estimated revenues, margins and expen ses , over the course of the agreement with Idemitsu Kosan (“ Idemitsu ”); anticipated and unforeseen events which could reduce future production at the Mobile Refinery or delay planned and future capital projects; c han ges in commodity and credits values; certain early termination rights associated with third party agreements and conditions p rec edent to such agreements; certain mandatory redemption provisions of the outstanding senior convertible notes, the conversion rights associated therewith, and dilution caused by conversions and/or the exchanges of convertible notes; the Company’s ability to comply with required covenants under outstanding senior notes and a term loan and t o pay amounts due under such senior notes and term loan, including interest and other amounts due thereunder; the ability of the Company to retain and hire key personnel; the level of competition in the Company’ s i ndustry and its ability to compete; the Company’s ability to respond to changes in its industry; the loss of key personnel or fa ilure to attract, integrate and retain additional personnel; the Company’s ability to protect intellectual property and not infringe on others’ intellectual property; the Company’s ability to scale its business; the Com pan y’s ability to maintain supplier relationships and obtain adequate supplies of feedstocks; the Company’s ability to obtain an d r etain customers; the Company’s ability to produce products at competitive rates; the Company’s ability to execute its business strategy in a very competitive environment; trends in, and the market for, the price of oil a nd gas and alternative energy sources; the impact of inflation on margins and costs; the volatile nature of the prices for oil a nd gas caused by supply and demand, including volatility caused by the ongoing Ukraine/Russia conflict and/or the Israel/Hamas conflict, changes in interest rates and inflation and potential recessions; the Company’s ability to mai ntain relationships with partners; the outcome of pending and potential future litigation, judgments and settlements; rules a nd regulations making the Company’s operations more costly or restrictive; volatility in the market price of compliance credits (primarily Renewable Identification Numbers (RINs) needed to comply with the Renewable Fuel Stand ard (“RFS”)) under renewable and low - carbon fuel programs and emission credits needed under other environmental emissions programs, the requirement for the Company to purchase RINs in the secondary market to the extent it does not generate sufficient RINs internally, liabilities associated therewith and the timing, funding and costs of su ch required purchases, if any; changes in environmental and other laws and regulations and risks associated with such laws an d r egulations; economic downturns both in the United States and globally, changes in inflation and interest rates, increased costs of borrowing associated therewith and potential declines in the availability of such funding; ri sk of increased regulation of the Company’s operations and products; disruptions in the infrastructure that the Company and i ts partners rely on; interruptions at the Company’s facilities; unexpected and expected changes in the Company’s anticipated capital expenditures resulting from unforeseen and expected required maintenance, repairs, or upgrades; th e Company’s ability to acquire and construct new facilities; the Company’s ability to effectively manage growth; decreases in gl obal demand for, and the price of, oil, due to inflation, recessions or other reasons, including declines in economic activity or global conflicts; expected and unexpected downtime at the Company’s facilities; the Company’ s l evel of indebtedness, which could affect its ability to fulfill its obligations, impede the implementation of its strategy, a nd expose the Company’s interest rate risk; dependence on third party transportation services and pipelines; risks related to obtaining required crude oil supplies, and the costs of such supplies; counterparty credit and pe rfo rmance risk; unanticipated problems at, or downtime effecting, the Company’s facilities and those operated by third parties; ris ks relating to the Company’s hedging activities or lack of hedging activities; and risks relating to planned and future divestitures, asset sales, joint ventures and acquisitions. Other important factors that may cause actual results and outcomes to differ materially from those contained in the forward - look ing statements included in this communication are described in the Company’s publicly filed reports, including, but not limit ed to, the Company’s Annual Report on Form 10 - K for the year ended December 31, 2023, and the Company’s Quarterly Report on Form 10 - Q for the quarter ended March 31, 2024, and future Annual Reports on Form 10 - K and Quarter ly Reports on Form 10 - Q. These reports are available at www.sec.gov. The Company cautions that the foregoing list of important f actors is not complete. All subsequent written and oral forward - looking statements attributable to the Company or any person acting on behalf of the Company are expressly qualified in their entirety by the ca uti onary statements referenced above. Other unknown or unpredictable factors also could have material adverse effects on Vertex’ s f uture results. The forward - looking statements included in this presentation are made only as of the date hereof. Vertex cannot guarantee future results, levels of activity, performance or achievements. Accordingly, you sh ould not place undue reliance on these forward - looking statements. Finally, Vertex undertakes no obligation to update these stat ements after the date of this presentation, except as required by law, and takes no obligation to update or correct information prepared by third parties that are not paid for by Vertex. If we update one or more forward - lookin g statements, no inference should be drawn that we will make additional updates with respect to those or other forward - looking s tatements. Date of Information in Presentation All information in this presentation is as of May 9, 2024 (unless otherwise stated). The Company undertakes no duty to update an y forward - looking statement to conform the statement to actual results or changes in the Company’s expectations. Industry Information In this presentation, we may rely on and refer to information regarding the refining, re - refining, used oil and oil and gas indu stries in general from market research reports, analyst reports and other publicly available information. Although we believe th at this information is reliable, we have not commissioned any of such information, we cannot guarantee the accuracy and completeness of this information, and we have not independently verified any of it. Projections The financial projections (the “Projections”) included herein were prepared by Vertex in good faith using assumptions believe d t o be reasonable. A significant number of assumptions about the operations of the business of Vertex were based, in part, on e con omic, competitive, and general business conditions prevailing at the time the Projections were developed. Any future changes in these conditions, may materially impact the ability of Vertex to achieve the financial resul ts set forth in the Projections. The Projections are based on numerous assumptions, including realization of the operating strat egy of Vertex; industry performance; no material adverse changes in applicable legislation or regulations, or the administration thereof, or generally accepted accounting principles; general business and economic condit ion s; competition; retention of key management and other key employees; absence of material contingent or unliquidated litigatio n, indemnity, or other claims; minimal changes in current pricing; static material and equipment pricing; no significant increases in interest rates or inflation; and other matters, many of which will be beyond the control of Vertex, and some or all of which may not materialize . The Projections also assume the continued uptime of the Company’s faci li ties at historical levels and the successful funding of, timely completion of, and successful outcome of, planned capital projects. Additionally, to the extent that the assumptions inherent in the Projections are based upon fut ure business decisions and objectives, they are subject to change. Although the Projections are presented with numerical specific it y and are based on reasonable expectations developed by Vertex’s management, the assumptions and estimates underlying the Projections are subject to significant business, economic, and competitive uncertainties and con tin gencies, many of which will be beyond the control of Vertex. Accordingly, the Projections are only estimates and are necessar ily speculative in nature. It is expected that some or all of the assumptions in the Projections will not be realized and that actual results will vary from the Projections. Such variations may be material and may increase over ti me. In light of the foregoing, readers are cautioned not to place undue reliance on the Projections. The projected financial inf ormation contained herein should not be regarded as a representation or warranty by Vertex, its management, advisors, or any other person that the Projections can or will be achieved. Vertex cautions that the Projections are speculative in nature and based upon subjective decisions and assumptions. As a result, the Projections should not be relied on as necessarily predictive of actual future events.
DISCLAIMER Non - GAAP Financial Measures 3 Non - GAAP Financial Measures and Key Performance Measures In addition to our results calculated under generally accepted accounting principles in the United States (“GAAP”), in this p res entation we also present certain non - U.S. GAAP financial measures and key performance indicators. Non - U.S. GAAP financial measur es include Adjusted EBITDA, Net Long - Term Debt and Net Leverage for the Company (collectively, the “Non - U.S. GAAP Financial Measures”). Key performance indicators include Fuel Gross Margin, Fuel Gross Margin Per Barrel, Operating Expenses Per Barrel of Throughput, Renewable Gross Margin and Renewable Gross Margin Per Barrel (c ollectively, the “KPIs”). EBITDA represents net income before interest, taxes, depreciation and amortization, for continued and discontinued operations. Adjusted EBITDA represents EBITDA plus unrea liz ed gain or losses on hedging activities, Renewable Fuel Standard (RFS) costs (mainly related to Renewable Identification Numb ers (RINs) , and inventory adjustments, acquisition costs, gain on change in value of derivative warrant liability, environmental clean - up, stock - based compensation, (gain) loss on sale of assets, and certain ot her unusual or non - recurring charges included in selling, general, and administrative expenses. Net Long - Term Debt is long - term debt and lease obligations, adjusted for unamortized discount and deferred financing costs, less cash and cash equivalents and restricted cash. Net Leverage is defined as Long - Term Debt divided by Adjust ed EBITDA for the trailing 12 months. Fuel Gross Margin is defined as gross profit (loss) plus unrealized gain or losses on h edg ing activities, plus production costs, depreciation attributable to cost of revenues and certain other non - fuel items included in costs of revenues including realized and unrealized gain or losses on hedging activitie s, RFS costs (mainly related to RINs), fuel financing costs and other revenues and cost of sales items. Fuel Gross Margin Per Ba rrel of Throughput is calculated as fuel gross margin divided by total throughput barrels for the period presented. Operating Expenses Per Barrel of Throughput is defined as total operating expenses divided by total ba rrels of throughput. Renewable Fuel Gross Margin is defined as gross profit (loss) plus unrealized gain or losses on hedging act ivities and inventory valuation adjustments, plus production costs, operating expenses and depreciation attributable to cost of revenues and other non - fuel items included in costs of revenues including real ized and unrealized gain or losses on hedging activities, inventory valuation adjustments, fuel financing costs and other rev enu es and cost of sales items. Renewable Fuel Gross Margin Per Barrel is Renewable Gross Margin divided by total renewable throughput barrels for the period presented. The (a) Non - U.S. GAAP Financial Measures, which are “non - U.S. GAAP financial measures”, and (b) the KPIs, are presented as suppl emental measures of the Company’s performance. They are not presented in accordance with U.S. GAAP. We use the Non - U.S. GAAP Fin ancial Measures and KPIs as supplements to U.S. GAAP measures of performance to evaluate the effectiveness of our business strategies, to make budgeting decisions, to allocate resources and to compare our performance relative to our peers. Additionally, these measures, when used in conjunction with related U.S. GAAP fin ancial measures, provide investors with an additional financial analytical framework which management uses, in addition to historical operating results, as the basis for financial, operational and pla nni ng decisions and present measurements that third parties have indicated are useful in assessing the Company and its results o f o perations. The Non - U.S. GAAP Financial Measures and KPIs are presented because we believe they provide additional useful information to investors due to the various noncash items during the period. Non - U.S. GAAP financial information and KPIs similar to the Non - U.S. GAAP Financial Measures and KPIs are also frequently used by analyst s, investors and other interested parties to evaluate companies in our industry. The Non - U.S. GAAP Financial Measures and KPIs are unaudited, and have limitations as analytical tools, and you should not consid er them in isolation, or as a substitute for analysis of our operating results as reported under U.S. GAAP. Some of these lim ita tions are: the Non - U.S. GAAP Financial Measures and KPIs do not reflect cash expenditures, or future requirements for capital expenditures, or contractual commitments; the Non - GAAP Financial Measures and K PIs do not reflect changes in, or cash requirements for, working capital needs; the Non - GAAP Financial Measures and KPIs do not reflect the significant interest expense, or the cash requirements necessary to service interest or principal payments, on debt or cash income tax payments; although depreciation and amortization are no nca sh charges, the assets being depreciated and amortized will often have to be replaced in the future, the Non - U.S. GAAP Financial Measures and KPIs do not reflect any cash requirements for such replacements; the Non - U.S. GAAP Financial Measures and KPIs represent only a portion of our total operating results; and other c ompanies in this industry may calculate the Non - U.S. GAAP Financial Measures and KPIs differently than we do, limiting their use fulness as a comparative measure. You should not consider the Non - U.S. GAAP Financial Measures and KPIs in isolation, or as substitutes for analysis of the Company’s results as reported under U.S. GAAP . T he Company’s presentation of these measures should not be construed as an inference that future results will be unaffected by un usual or nonrecurring items. We compensate for these limitations by providing a reconciliation of each of these non - U.S. GAAP Financial Measures and KPIs to the most comparable U.S. GAAP measure below. We enc ourage investors and others to review our business, results of operations, and financial information in their entirety, not t o r ely on any single financial measure, and to view these non - U.S. GAAP Financial Measures and KPIs in conjunction with the most directly comparable U.S. GAAP financial measure. For more information on these non - GAAP financial measures and KPIs, please see the sections titled “Unaudited Reconciliation of Gross Profit (Loss) From Continued and Discontinued Operations to Adjusted Gross Margin, Fuel Gross Margin, Fuel Gross Margin Pe r Barrel of Throughput and Operating Expenses Per Barrel of Throughput”, “Unaudited Reconciliation of Adjusted EBITDA to Net loss from Continued and Discontinued Operations”, and “Unaudited Reconcil iat ion of Long - Term Debt to Net Long - Term Debt and Net Leverage”, at the end of this presentation.

2024 YTD HIGHLIGHTS 4 Continued Excellence in Safety • Mobile Refinery has achieved two years without any OSHA Recordable Injuries, while legacy refining operations have maintained more than a year with zero OSHA recordables. Strengthening Conventional Business • Significant margin improvements in Q1 2024 • Following successful maintenance in Q1, the Mobile facility is well positioned to operate more efficiently in Q2 and Q3 • Aligns with an expected increase in demand during the driving season Advancements in Commercial Strategy • Improvement in targeted netback opportunities for both conventional and renewable products • Completed all pathway approvals for renewable feedstocks and secured direct offtake agreements for jet fuel • These milestones are critical components to enhance margins, expected to position the business to capitalize on future market opportunities effectively and efficiently Production Pause and Pivot for the Company’s Renewable Business • Optimizing the Mobile Refinery hydrocracker capacity from renewable diesel to conventional fuels • Opportunity to optimize hydrocracker production in conventional service while maintaining the proven renewable diesel production flexibility when market conditions warrant
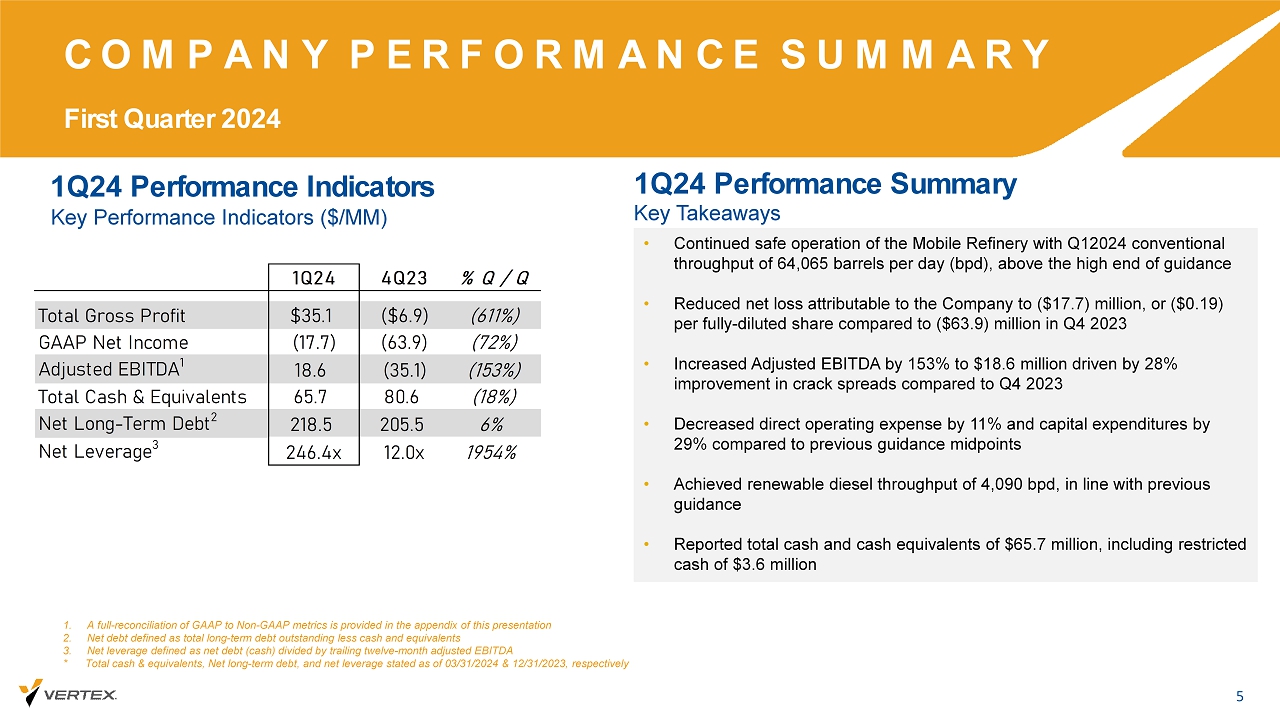
1Q24 Performance Indicators COMPANY PERFORMANCE SUMMARY First Quarter 2024 5 1. A full - reconciliation of GAAP to Non - GAAP metrics is provided in the appendix of this presentation 2. Net debt defined as total long - term debt outstanding less cash and equivalents 3. Net leverage defined as net debt (cash) divided by trailing twelve - month adjusted EBITDA * Total cash & equivalents, Net long - term debt, and net leverage stated as of 03/31/2024 & 12/31/2023, respectively Key Performance Indicators ($/MM) Key Takeaways 1Q24 Performance Summary • Continued safe operation of the Mobile Refinery with Q12024 conventional throughput of 64,065 barrels per day (bpd), above the high end of guidance • Reduced net loss attributable to the Company to ($17.7) million, or ($0.19) per fully - diluted share compared to ($63.9) million in Q4 2023 • Increased Adjusted EBITDA by 153% to $18.6 million driven by 28% improvement in crack spreads compared to Q4 2023 • Decreased direct operating expense by 11% and capital expenditures by 29% compared to previous guidance midpoints • Achieved renewable diesel throughput of 4,090 bpd, in line with previous guidance • Reported total cash and cash equivalents of $65.7 million, including restricted cash of $3.6 million 1Q24 4Q23 % Q / Q Total Gross Profit $35.1 ($6.9) (611%) GAAP Net Income (17.7) (63.9) (72%) Adjusted EBITDA 1 18.6 (35.1) (153%) Total Cash & Equivalents 65.7 80.6 (18%) Net Long-Term Debt 2 218.5 205.5 6% Net Leverage 3 246.4x 12.0x 1954%
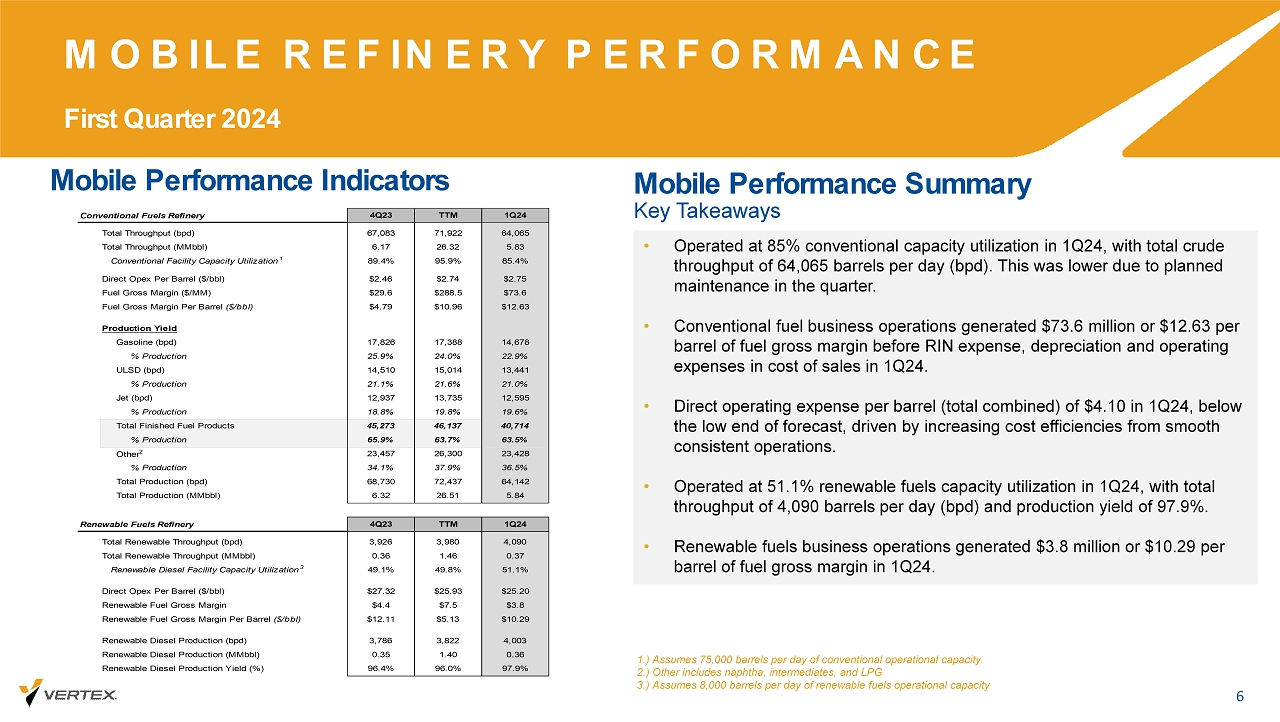
Mobile Performance Indicators MOBILE REFINERY PERFORMANCE First Quarter 2024 6 • Operated at 85% conventional capacity utilization in 1Q24, with total crude throughput of 64,065 barrels per day (bpd). This was lower due to planned maintenance in the quarter. • Conventional fuel business operations generated $73.6 million or $12.63 per barrel of fuel gross margin before RIN expense, depreciation and operating expenses in cost of sales in 1Q24. • Direct operating expense per barrel (total combined) of $4.10 in 1Q24, below the low end of forecast, driven by increasing cost efficiencies from smooth consistent operations. • Operated at 51.1% renewable fuels capacity utilization in 1Q24, with total throughput of 4,090 barrels per day (bpd) and production yield of 97.9%. • Renewable fuels business operations generated $3.8 million or $10.29 per barrel of fuel gross margin in 1Q24. 1.) Assumes 75,000 barrels per day of conventional operational capacity 2.) Other includes naphtha, intermediates, and LPG 3.) Assumes 8,000 barrels per day of renewable fuels operational capacity Mobile Performance Summary Key Takeaways Conventional Fuels Refinery 4Q23 TTM 1Q24 Total Throughput (bpd) 67,083 71,922 64,065 Total Throughput (MMbbl) 6.17 26.32 5.83 Conventional Facility Capacity Utilization 1 89.4% 95.9% 85.4% Direct Opex Per Barrel ($/bbl) $2.46 $2.74 $2.75 Fuel Gross Margin ($/MM) $29.6 $288.5 $73.6 Fuel Gross Margin Per Barrel ($/bbl) $4.79 $10.96 $12.63 Production Yield Gasoline (bpd) 17,826 17,388 14,678 % Production 25.9% 24.0% 22.9% ULSD (bpd) 14,510 15,014 13,441 % Production 21.1% 21.6% 21.0% Jet (bpd) 12,937 13,735 12,595 % Production 18.8% 19.8% 19.6% Total Finished Fuel Products 45,273 46,137 40,714 % Production 65.9% 63.7% 63.5% Other 2 23,457 26,300 23,428 % Production 34.1% 37.9% 36.5% Total Production (bpd) 68,730 72,437 64,142 Total Production (MMbbl) 6.32 26.51 5.84 Renewable Fuels Refinery 4Q23 TTM 1Q24 Total Renewable Throughput (bpd) 3,926 3,980 4,090 Total Renewable Throughput (MMbbl) 0.36 1.46 0.37 Renewable Diesel Facility Capacity Utilization 3 49.1% 49.8% 51.1% Direct Opex Per Barrel ($/bbl) $27.32 $25.93 $25.20 Renewable Fuel Gross Margin $4.4 $7.5 $3.8 Renewable Fuel Gross Margin Per Barrel ($/bbl) $12.11 $5.13 $10.29 Renewable Diesel Production (bpd) 3,786 3,822 4,003 Renewable Diesel Production (MMbbl) 0.35 1.40 0.36 Renewable Diesel Production Yield (%) 96.4% 96.0% 97.9%
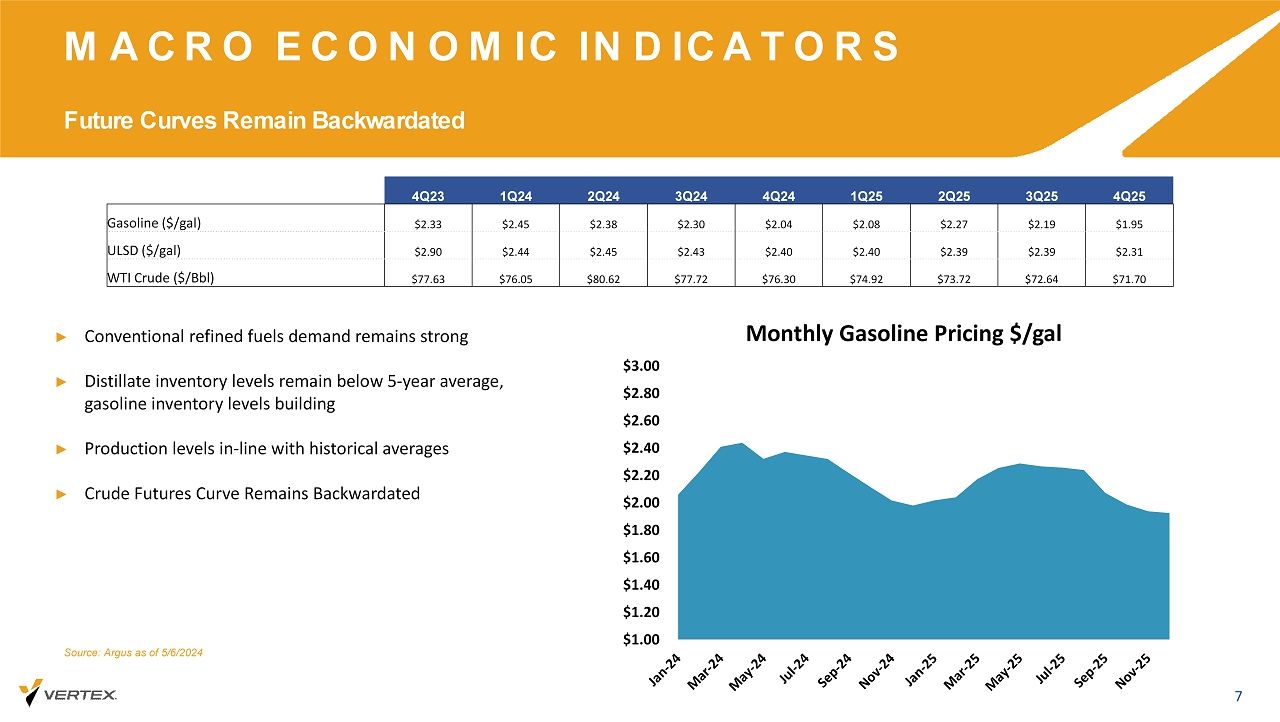
Future Curves Remain Backwardated 7 MACRO ECONOMIC INDICATORS 4Q25 3Q25 2Q25 1Q25 4Q24 3Q24 2Q24 1Q24 4Q23 $1.95 $2.19 $2.27 $2.08 $2.04 $2.30 $2.38 $2.45 $2.33 Gasoline ($/gal) $2.31 $2.39 $2.39 $2.40 $2.40 $2.43 $2.45 $2.44 $2.90 ULSD ($/gal) $71.70 $72.64 $73.72 $74.92 $76.30 $77.72 $80.62 $76.05 $77.63 WTI Crude ($/ Bbl ) Source: Argus as of 5/6/2024 ► Conventional refined fuels demand remains strong ► Distillate inventory levels remain below 5 - year average, gasoline inventory levels building ► Production levels in - line with historical averages ► Crude Futures Curve Remains Backwardated $1.00 $1.20 $1.40 $1.60 $1.80 $2.00 $2.20 $2.40 $2.60 $2.80 $3.00 Monthly Gasoline Pricing $/gal
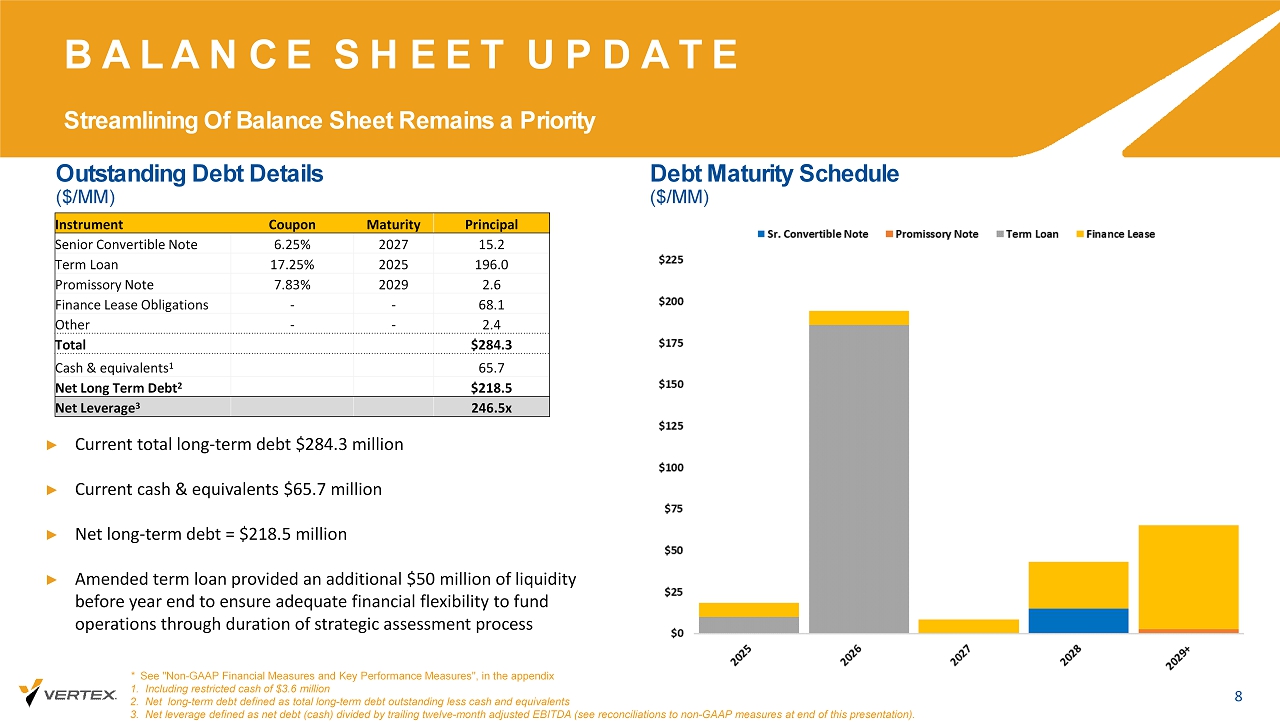
BALANCE SHEET UPDATE Streamlining Of Balance Sheet Remains a Priority 8 Outstanding Debt Details ($/MM) Debt Maturity Schedule ($/MM) ► Current total long - term debt $284.3 million ► Current cash & equivalents $65.7 million ► Net long - term debt = $218.5 million ► Amended term loan provided an additional $50 million of liquidity before year end to ensure adequate financial flexibility to fund operations through duration of strategic assessment process * See "Non - GAAP Financial Measures and Key Performance Measures", in the appendix 1. Including restricted cash of $3.6 million 2. Net long - term debt defined as total long - term debt outstanding less cash and equivalents 3. Net leverage defined as net debt (cash) divided by trailing twelve - month adjusted EBITDA (see reconciliations to non - GAAP me asures at end of this presentation). Principal Maturity Coupon Instrument 15.2 2027 6.25% Senior Convertible Note 196.0 2025 17.25% Term Loan 2.6 2029 7.83% Promissory Note 68.1 - - Finance Lease Obligations 2.4 - - Other $284.3 Total 65.7 Cash & equivalents 1 $218.5 Net Long Term Debt 2 246.5x Net Leverage 3
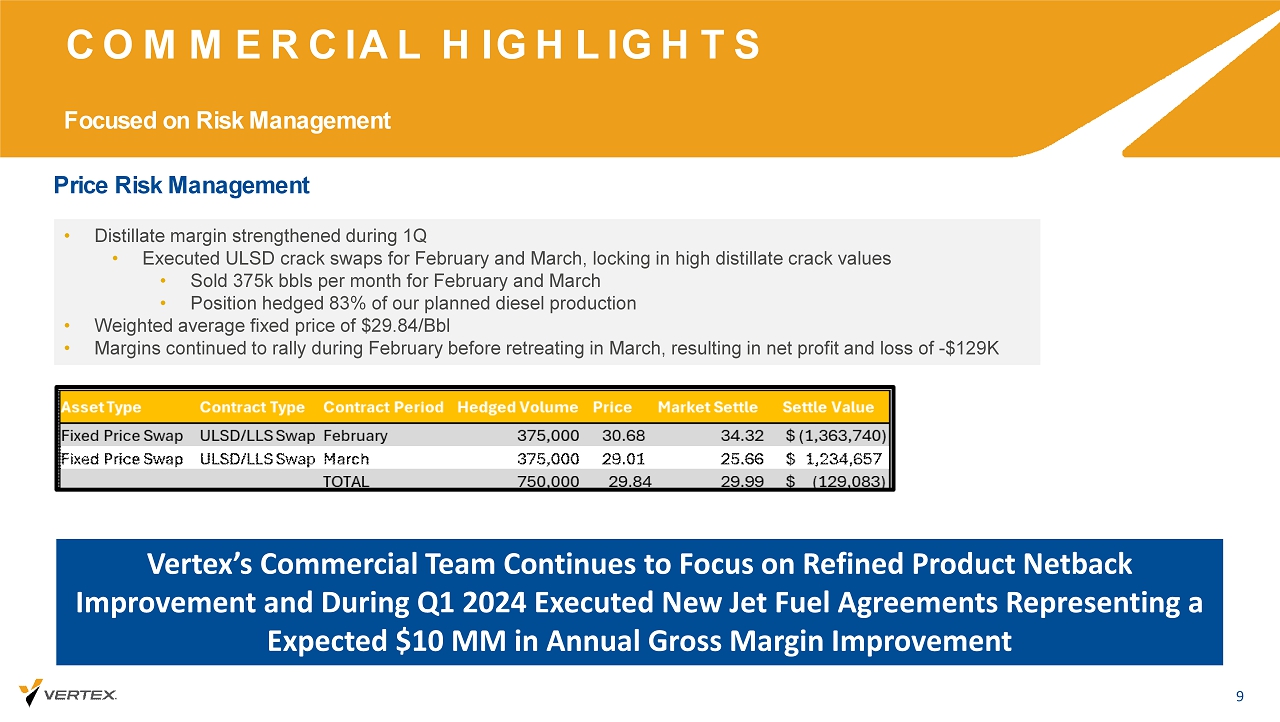
Price Risk Management COMMERCIAL HIGHLIGHTS Focused on Risk Management 9 • Distillate margin strengthened during 1Q • Executed ULSD crack swaps for February and March, locking in high distillate crack values • Sold 375k bbls per month for February and March • Position hedged 83% of our planned diesel production • Weighted average fixed price of $29.84/ Bbl • Margins continued to rally during February before retreating in March, resulting in net profit and loss of - $129K Vertex’s Commercial Team Continues to Focus on Refined Product Netback Improvement and During Q1 2024 Executed New Jet Fuel Agreements Representing a Expected $10 MM in Annual Gross Margin Improvement
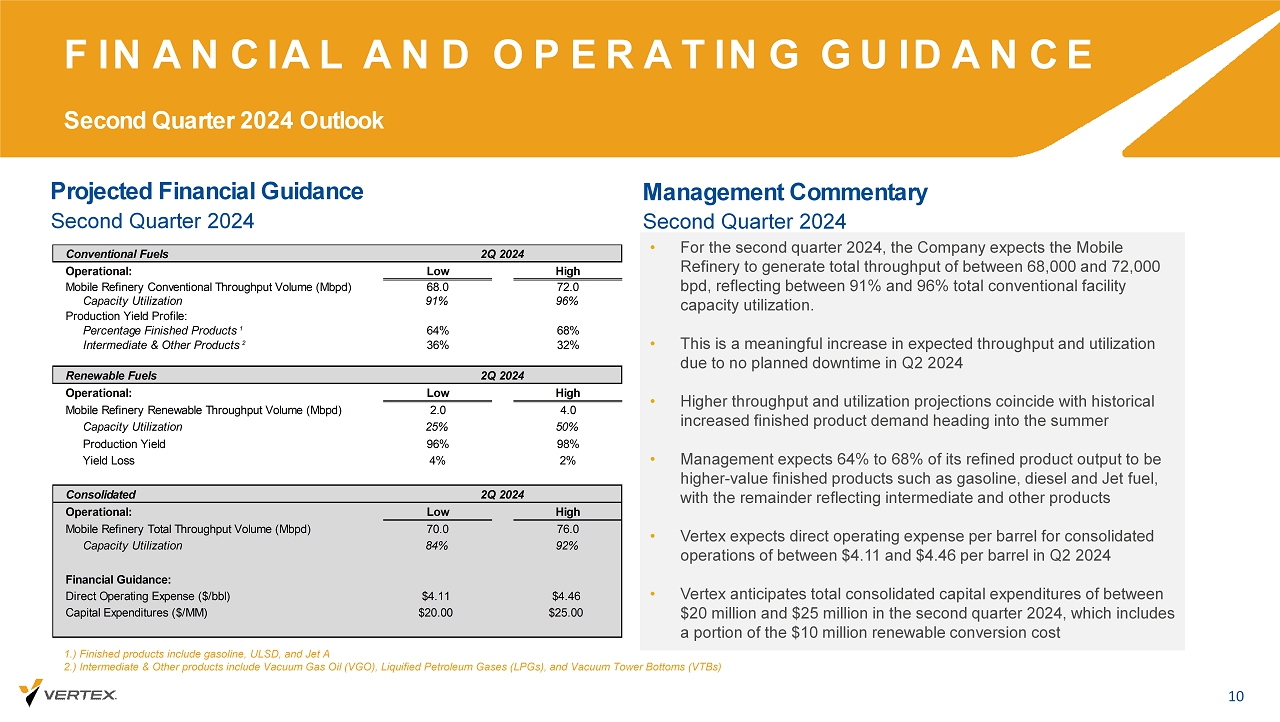
Projected Financial Guidance FINANCIAL AND OPERATING GUIDANCE Second Quarter 2024 Outlook 10 Management Commentary • For the second quarter 2024, the Company expects the Mobile Refinery to generate total throughput of between 68,000 and 72,000 bpd, reflecting between 91% and 96% total conventional facility capacity utilization. • This is a meaningful increase in expected throughput and utilization due to no planned downtime in Q2 2024 • Higher throughput and utilization projections coincide with historical increased finished product demand heading into the summer • Management expects 64% to 68% of its refined product output to be higher - value finished products such as gasoline, diesel and Jet fuel, with the remainder reflecting intermediate and other products • Vertex expects direct operating expense per barrel for consolidated operations of between $4.11 and $4.46 per barrel in Q2 2024 • Vertex anticipates total consolidated capital expenditures of between $20 million and $25 million in the second quarter 2024, which includes a portion of the $10 million renewable conversion cost Second Quarter 2024 Second Quarter 2024 1.) Finished products include gasoline, ULSD, and Jet A 2.) Intermediate & Other products include Vacuum Gas Oil (VGO), Liquified Petroleum Gases (LPGs), and Vacuum Tower Bottoms (V TBs ) Conventional Fuels Operational: Low High Mobile Refinery Conventional Throughput Volume (Mbpd) 68.0 72.0 Capacity Utilization 91% 96% Production Yield Profile: Percentage Finished Products 1 64% 68% Intermediate & Other Products 2 36% 32% Renewable Fuels Operational: Low High Mobile Refinery Renewable Throughput Volume (Mbpd) 2.0 4.0 Capacity Utilization 25% 50% Production Yield 96% 98% Yield Loss 4% 2% Consolidated Operational: Low High Mobile Refinery Total Throughput Volume (Mbpd) 70.0 76.0 Capacity Utilization 84% 92% Financial Guidance: Direct Operating Expense ($/bbl) $4.11 $4.46 Capital Expenditures ($/MM) $20.00 $25.00 2Q 2024 2Q 2024 2Q 2024
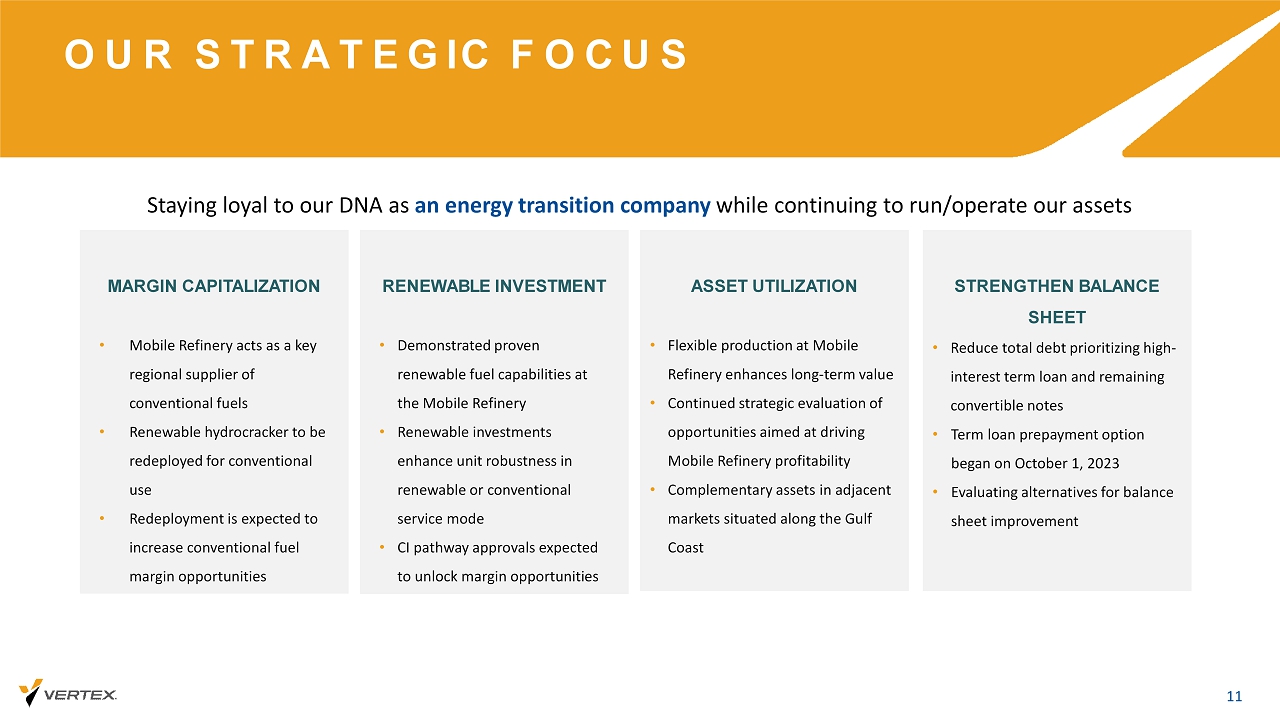
OUR STRATEGIC FOCUS 11 ASSET UTILIZATION • Flexible production at Mobile Refinery enhances long - term value • Continued strategic evaluation of opportunities aimed at driving Mobile Refinery profitability • Complementary assets in adjacent markets situated along the Gulf Coast MARGIN CAPITALIZATION • Mobile Refinery acts as a key regional supplier of conventional fuels • Renewable hydrocracker to be redeployed for conventional use • Redeployment is expected to increase conventional fuel margin opportunities RENEWABLE INVESTMENT • Demonstrated proven renewable fuel capabilities at the Mobile Refinery • Renewable investments enhance unit robustness in renewable or conventional service mode • CI pathway approvals expected to unlock margin opportunities STRENGTHEN BALANCE SHEET • Reduce total debt prioritizing high - interest term loan and remaining convertible notes • Term loan prepayment option began on October 1, 2023 • Evaluating alternatives for balance sheet improvement Staying loyal to our DNA as an energy transition company while continuing to run/operate our assets
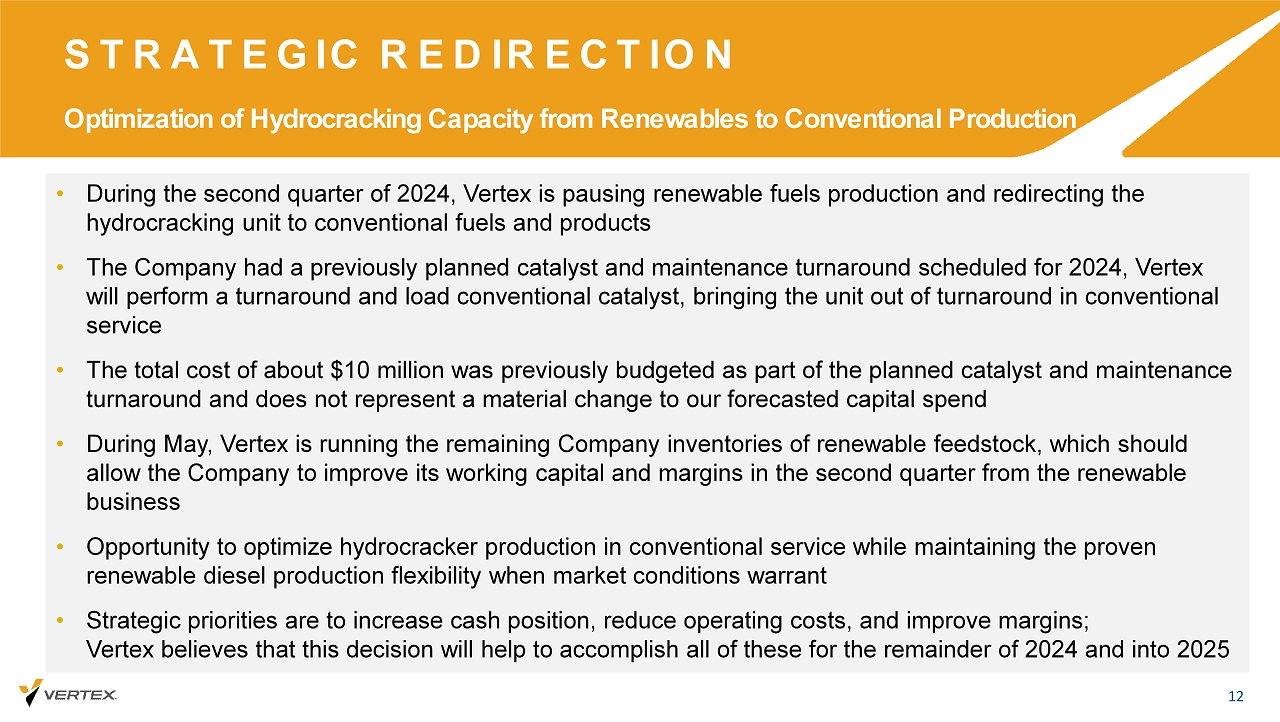
STRATEGIC REDIRECTION Optimization of Hydrocracking Capacity from Renewables to Conventional Production 12 • During the second quarter of 2024, Vertex is pausing renewable fuels production and redirecting the hydrocracking unit to conventional fuels and products • The Company had a previously planned catalyst and maintenance turnaround scheduled for 2024, Vertex will perform a turnaround and load conventional catalyst, bringing the unit out of turnaround in conventional service • The total cost of about $10 million was previously budgeted as part of the planned catalyst and maintenance turnaround and does not represent a material change to our forecasted capital spend • During May, Vertex is running the remaining Company inventories of renewable feedstock, which should allow the Company to improve its working capital and margins in the second quarter from the renewable business • Opportunity to optimize hydrocracker production in conventional service while maintaining the proven renewable diesel production flexibility when market conditions warrant • Strategic priorities are to increase cash position, reduce operating costs, and improve margins; Vertex believes that this decision will help to accomplish all of these for the remainder of 2024 and into 2025

APPENDIX

NON - GAAP RECONCILIATION 14 Unaudited Reconciliation of Gross Profit (Loss) From Continued and Discontinued Operations to Adjusted Gross Margin, Fuel Gross Margin, Fuel Gross Margin Per Barrel of Throughput and Operating Expenses Per Barrel of Throughput. In thousands Conventional Renewable Mobile Refinery Total Gross profit 37,508$ (10,462)$ 27,047$ Unrealized (gain) loss on hedging activities (555) 934 379 Inventory valuation adjustments 9,657 4,592 14,249 Adjusted gross margin 46,610$ (4,936)$ 41,674$ Variable production costs attributable to cost of revenues 25,651 6,846 32,497 Depreciation and amortization attributable to cost of revenues 2,558 3,932 6,490 RINs (857) - (857) Realized (gain) loss on hedging activities 2,577 (1,783) 794 Financing costs (172) 132 (40) Other revenues (2,719) (362) (3,081) Fuel gross margin 73,648$ 3,829$ 77,477$ Throughput (bpd) 64,065 4,090 68,155 Fuel gross margin per barrel of throughput $12.63 10.29$ $12.49 Total OPEX 16,061$ 9,382$ 25,443$ Operating expenses per barrel of throughput $2.75 25.21$ $4.10 Three Months Ended March 31, 2024
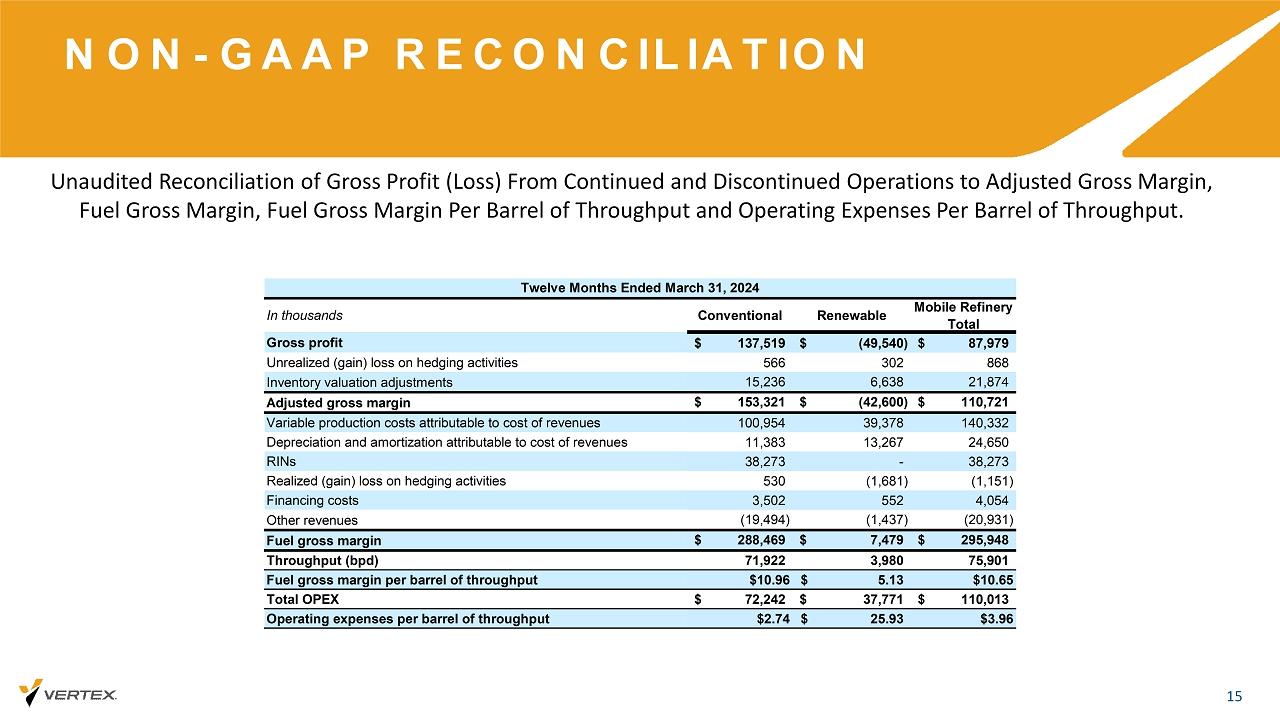
NON - GAAP RECONCILIATION 15 Unaudited Reconciliation of Gross Profit (Loss) From Continued and Discontinued Operations to Adjusted Gross Margin, Fuel Gross Margin, Fuel Gross Margin Per Barrel of Throughput and Operating Expenses Per Barrel of Throughput. In thousands Conventional Renewable Mobile Refinery Total Gross profit 137,519$ (49,540)$ 87,979$ Unrealized (gain) loss on hedging activities 566 302 868 Inventory valuation adjustments 15,236 6,638 21,874 Adjusted gross margin 153,321$ (42,600)$ 110,721$ Variable production costs attributable to cost of revenues 100,954 39,378 140,332 Depreciation and amortization attributable to cost of revenues 11,383 13,267 24,650 RINs 38,273 - 38,273 Realized (gain) loss on hedging activities 530 (1,681) (1,151) Financing costs 3,502 552 4,054 Other revenues (19,494) (1,437) (20,931) Fuel gross margin 288,469$ 7,479$ 295,948$ Throughput (bpd) 71,922 3,980 75,901 Fuel gross margin per barrel of throughput $10.96 5.13$ $10.65 Total OPEX 72,242$ 37,771$ 110,013$ Operating expenses per barrel of throughput $2.74 25.93$ $3.96 Twelve Months Ended March 31, 2024

NON - GAAP RECONCILIATION 16 Unaudited Reconciliation of EBITDA and Adjusted EBITDA to Net loss from Continued and Discontinued Operations In thousands Conventional Renewable Net income (loss) $ 17,535 $ (22,157) $ 442 $ (4,180) $ 990 $ (14,664) $ (17,854) Depreciation and amortization 3,330 3,953 51 7,334 1,717 239 9,290 Income tax expense (benefit) - - - - - - - Interest expense 2,455 2,292 - 4,747 96 12,840 17,683 EBITDA $ 23,320 $ (15,912) $ 493 $ 7,901 $ 2,803 $ (1,585) $ 9,119 Unrealized (gain) loss on hedging activities (555) 934 20 399 46 - 445 Inventory valuation adjustments 9,657 4,592 - 14,249 - - 14,249 Gain on change in value of derivative warrant liability - - - - - (6,658) (6,658) Stock-based compensation - - - - - 430 430 (Gain) loss on sale of assets 685 - - 685 5 1 691 Other - - - - 354 4 358 Adjusted EBITDA $ 33,107 $ (10,386) $ 513 $ 23,234 $ 3,208 $ (7,808) $ 18,634 Three Months Ended March 31, 2024 Mobile Refinery Legacy Refining & Marketing Corporate Consolidated Total Refining & Marketing Black Oil and Recovery

NON - GAAP RECONCILIATION 17 Unaudited Reconciliation of EBITDA and Adjusted EBITDA to Net loss from Continued and Discontinued Operations In thousands Conventional Renewable Net income (loss) $ (11,112) $ (30,266) $ (2,424) $ (43,801) $ (1,670) $ (18,395) $ (63,865) Depreciation and amortization 3,252 4,017 313 7,582 1,476 167 9,225 Income tax expense (benefit) - - - - (517) 2,060 1,543 Interest expense 2,473 2,820 - 5,293 62 10,675 16,029 EBITDA $ (5,387) $ (23,429) $ (2,111) $ (30,926) $ (649) $ (5,493) $ (37,068) Unrealized (gain) loss on hedging activities 4,892 77 (7) 4,962 19 - 4,981 Inventory valuation adjustments (3,400) 2,152 - (1,248) - - (1,248) Gain on change in value of derivative warrant liability - - - - - (2,956) (2,956) Stock-based compensation - - - - - 783 783 (Gain) loss on sale of assets - - - - - 3 3 Other - - - - 389 (1) 388 Adjusted EBITDA $ (3,895) $ (21,200) $ (2,118) $ (27,212) $ (241) $ (7,664) $ (35,117) Corporate Consolidated Three Months Ended December 31, 2023 Mobile Refinery Legacy Refining & Marketing Total Refining & Marketing Black Oil and Recovery
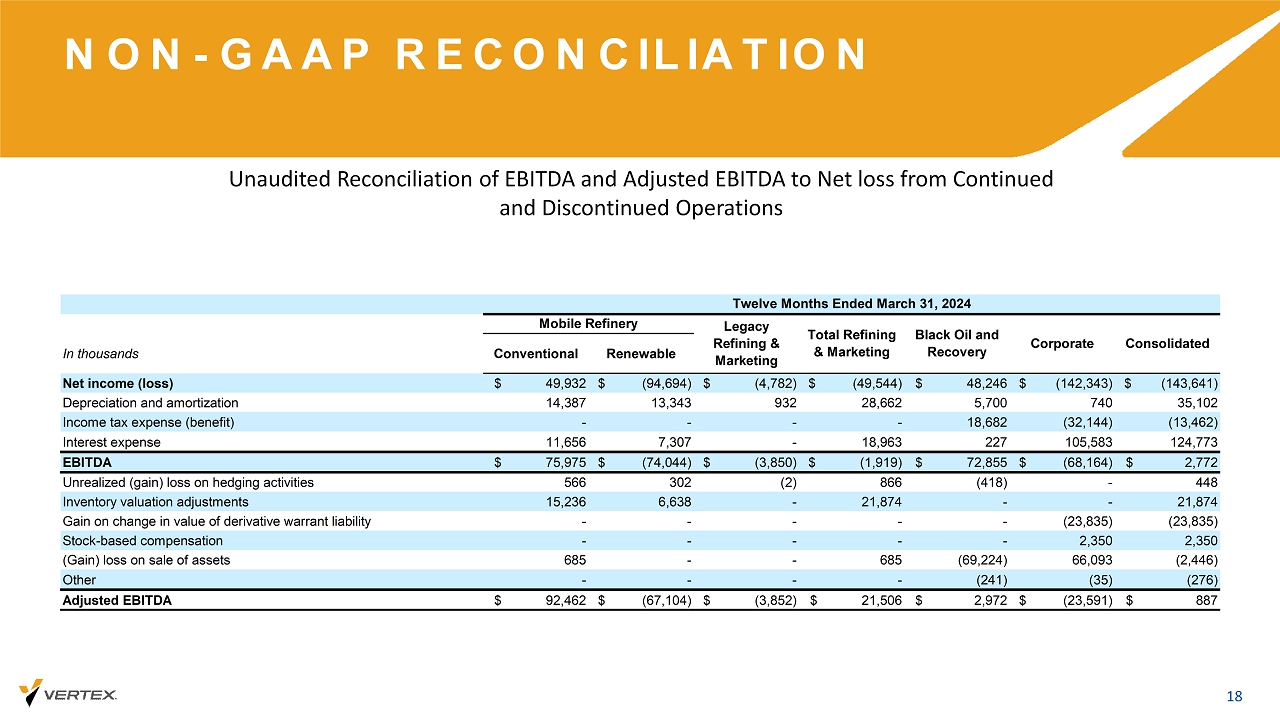
NON - GAAP RECONCILIATION 18 Unaudited Reconciliation of EBITDA and Adjusted EBITDA to Net loss from Continued and Discontinued Operations In thousands Conventional Renewable Net income (loss) $ 49,932 $ (94,694) $ (4,782) $ (49,544) $ 48,246 $ (142,343) $ (143,641) Depreciation and amortization 14,387 13,343 932 28,662 5,700 740 35,102 Income tax expense (benefit) - - - - 18,682 (32,144) (13,462) Interest expense 11,656 7,307 - 18,963 227 105,583 124,773 EBITDA $ 75,975 $ (74,044) $ (3,850) $ (1,919) $ 72,855 $ (68,164) $ 2,772 Unrealized (gain) loss on hedging activities 566 302 (2) 866 (418) - 448 Inventory valuation adjustments 15,236 6,638 - 21,874 - - 21,874 Gain on change in value of derivative warrant liability - - - - - (23,835) (23,835) Stock-based compensation - - - - - 2,350 2,350 (Gain) loss on sale of assets 685 - - 685 (69,224) 66,093 (2,446) Other - - - - (241) (35) (276) Adjusted EBITDA $ 92,462 $ (67,104) $ (3,852) $ 21,506 $ 2,972 $ (23,591) $ 887 Twelve Months Ended March 31, 2024 Mobile Refinery Legacy Refining & Marketing Total Refining & Marketing Black Oil and Recovery Corporate Consolidated
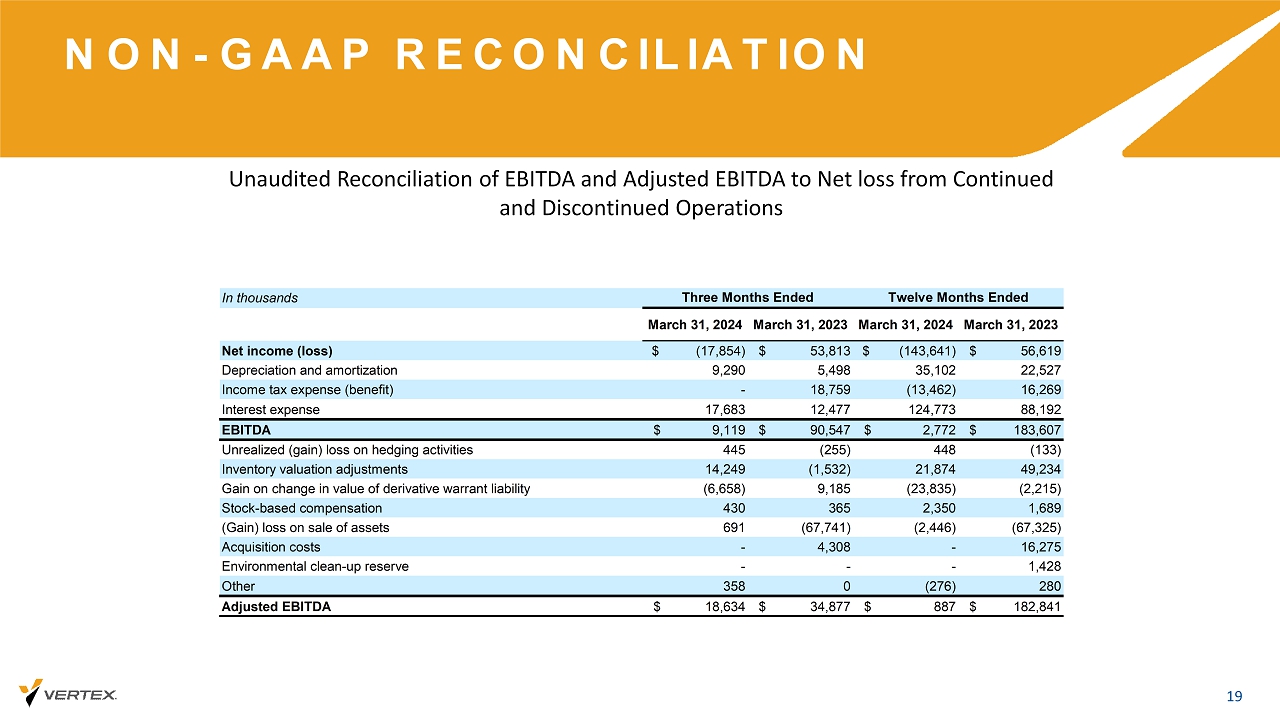
NON - GAAP RECONCILIATION 19 Unaudited Reconciliation of EBITDA and Adjusted EBITDA to Net loss from Continued and Discontinued Operations In thousands March 31, 2024 March 31, 2023 March 31, 2024 March 31, 2023 Net income (loss) $ (17,854) $ 53,813 $ (143,641) $ 56,619 Depreciation and amortization 9,290 5,498 35,102 22,527 Income tax expense (benefit) - 18,759 (13,462) 16,269 Interest expense 17,683 12,477 124,773 88,192 EBITDA $ 9,119 $ 90,547 $ 2,772 $ 183,607 Unrealized (gain) loss on hedging activities 445 (255) 448 (133) Inventory valuation adjustments 14,249 (1,532) 21,874 49,234 Gain on change in value of derivative warrant liability (6,658) 9,185 (23,835) (2,215) Stock-based compensation 430 365 2,350 1,689 (Gain) loss on sale of assets 691 (67,741) (2,446) (67,325) Acquisition costs - 4,308 - 16,275 Environmental clean-up reserve - - - 1,428 Other 358 0 (276) 280 Adjusted EBITDA $ 18,634 $ 34,877 $ 887 $ 182,841 Three Months Ended Twelve Months Ended

NON - GAAP RECONCILIATION 20 Unaudited Reconciliation of Long - Term Debt to Net Long - Term Debt and Net Leverage In thousands March 31, 2024 March 31, 2023 December 31, 2023 Long-Term Debt: Senior Convertible Note $ 15,230 $ 95,178 $ 15,230 Term Loan 2025 195,950 152,138 195,950 Promissory Note 2,612 - - Finance lease liability long-term 65,576 59,325 66,206 Finance lease liability short-term 2,497 1,916 2,435 Insurance premiums financed 2,399 1,359 6,237 Long-Term Debt and Lease Obligations $ 284,264 $ 309,916 $ 286,058 Unamortized discount and deferred financing costs (25,893) (77,596) (30,354) Long-Term Debt and Lease Obligations per Balance Sheet 258,371$ 232,320$ 255,704$ Cash and Cash Equivalents (62,140) (86,689) (76,967) Restricted Cash (3,609) (8,429) (3,606) Total Cash and Cash Equivalents $ (65,749) $ (95,118) $ (80,573) Net Long-Term Debt 218,515$ 214,798$ 205,485$ Adjusted EBITDA $ 887 $ 182,898 $ 17,130 Net Leverage 246.4x 1.2x 12.0x As of Note: Net Leverage is calculated using trailing twelve months Adjusted EBITDA
Cover |
May 09, 2024 |
|---|---|
| Cover [Abstract] | |
| Document Type | 8-K |
| Amendment Flag | false |
| Document Period End Date | May 09, 2024 |
| Entity File Number | 001-11476 |
| Entity Registrant Name | VERTEX ENERGY, INC. |
| Entity Central Index Key | 0000890447 |
| Entity Tax Identification Number | 94-3439569 |
| Entity Incorporation, State or Country Code | NV |
| Entity Address, Address Line One | 1331 Gemini Street |
| Entity Address, Address Line Two | Suite 250 |
| Entity Address, City or Town | Houston |
| Entity Address, State or Province | TX |
| Entity Address, Postal Zip Code | 77058 |
| City Area Code | (866) |
| Local Phone Number | 660-8156 |
| Written Communications | false |
| Soliciting Material | false |
| Pre-commencement Tender Offer | false |
| Pre-commencement Issuer Tender Offer | false |
| Title of 12(b) Security | Common Stock, $0.001 Par Value Per Share |
| Trading Symbol | VTNR |
| Security Exchange Name | NASDAQ |
| Entity Emerging Growth Company | false |
1 Year Vertex Energy Chart |
1 Month Vertex Energy Chart |

It looks like you are not logged in. Click the button below to log in and keep track of your recent history.
Support: +44 (0) 203 8794 460 | support@advfn.com
By accessing the services available at ADVFN you are agreeing to be bound by ADVFN's Terms & Conditions
 Hot Features