
We could not find any results for:
Make sure your spelling is correct or try broadening your search.
| Share Name | Share Symbol | Market | Type |
|---|---|---|---|
| LendingTree Inc | NASDAQ:TREE | NASDAQ | Common Stock |
| Price Change | % Change | Share Price | Bid Price | Offer Price | High Price | Low Price | Open Price | Shares Traded | Last Trade | |
|---|---|---|---|---|---|---|---|---|---|---|
| -0.38 | -0.79% | 47.89 | 46.80 | 49.20 | 49.6179 | 46.4565 | 48.50 | 384,817 | 00:39:03 |
From May 2019 to May 2024
CHARLOTTE, N.C., July 17, 2018 /PRNewswire/ -- LendingTree®, the nation's leading online loan marketplace, today released a study on where home price inequality is highest.
The GINI coefficient, a well-regarded metric, is the most commonly used measure of economic inequality. The coefficient ranges from 0 (complete equality where every value is the same) to 1 (complete inequality where one entity has 100 percent of the value and all others have none). Thus, a higher GINI coefficient means there is more inequality. LendingTree analyzed homes in the 50 largest metro areas to determine the GINI coefficient of home values in each metro to measure home price inequality in each market.
"Inequality is the defining economic debate of our times," said Tendayi Kapfidze, Chief Economist and report author. "Since 1980, the majority of income growth in the United States has accrued to the top of the income scale, a trend that accelerated following the 2007-08 financial crisis. Home values have finally recovered from the most recent housing crisis to the extent that affordability is now a concern. In many large cities, the median-priced home is now out of reach of median income households."
LendingTree's study ranks the top 50 cities by the GINI coefficient and shows the values of the 5th and 95th percentile homes and their ratio to provide a more tangible measure of home value inequality.
Key Findings
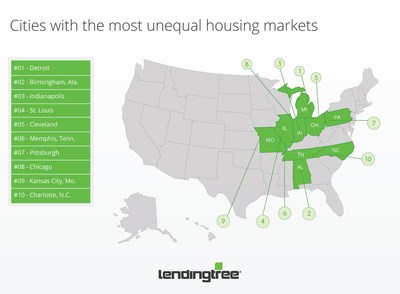
Cities with the most unequal housing markets
#1 Detroit
#2 Birmingham, Ala.
#3 Indianapolis
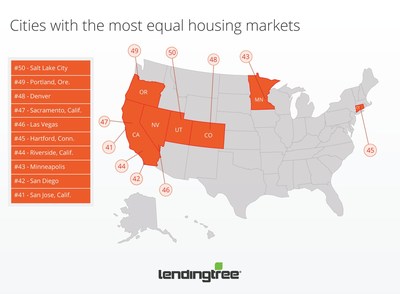
Cities with the most equal housing markets
#48 Denver
#49 Portland, Ore.
#50 Salt Lake City
"As we went through the analysis, we reached a conclusion that might be counterintuitive to conventional thought — housing value inequality might be a good thing," said Kapfidze.
"Cities with more home value inequality have a wider distribution of home values, which means that families earning lower incomes may still have the opportunity to access homeownership in these cities. The concurrent presence of high value homes suggests that their economies are vibrant enough to support higher earning jobs as well. Looked at in this manner, home value inequality could be beneficial."
To view the full report, visit https://www.lendingtree.com/home/where-home-price-inequality-is-highest/.
|
Home Price Inequality in the Top 50 MSAs | |||||
|
Rank |
City |
Gini |
95th |
5th |
Ratio |
|
1 |
Detroit |
0.446 |
$431,000 |
$32,000 |
13.5 |
|
2 |
Birmingham, Ala. |
0.392 |
$518,000 |
$45,000 |
11.5 |
|
3 |
Indianapolis |
0.385 |
$445,000 |
$44,000 |
10.1 |
|
4 |
St. Louis |
0.379 |
$493,000 |
$43,000 |
11.5 |
|
5 |
Cleveland |
0.374 |
$401,000 |
$41,000 |
9.8 |
|
6 |
Memphis, Tenn. |
0.370 |
$423,000 |
$39,000 |
10.8 |
|
7 |
Pittsburgh |
0.367 |
$471,000 |
$53,000 |
8.9 |
|
8 |
Chicago |
0.355 |
$668,000 |
$68,000 |
9.8 |
|
9 |
Kansas City, Mo. |
0.352 |
$398,000 |
$40,000 |
10.0 |
|
10 |
Charlotte, N.C. |
0.351 |
$653,000 |
$80,000 |
8.2 |
|
11 |
Jacksonville, Fla. |
0.349 |
$533,000 |
$52,000 |
10.3 |
|
12 |
Atlanta |
0.347 |
$620,000 |
$75,000 |
8.3 |
|
13 |
New York |
0.347 |
$1,230,000 |
$159,000 |
7.7 |
|
14 |
Houston |
0.346 |
$645,000 |
$94,000 |
6.9 |
|
15 |
New Orleans |
0.344 |
$617,000 |
$91,000 |
6.8 |
|
16 |
Louisville/Jefferson County, Ky. |
0.339 |
$464,000 |
$56,000 |
8.3 |
|
17 |
Baltimore |
0.337 |
$709,000 |
$69,000 |
10.3 |
|
18 |
Miami |
0.337 |
$968,000 |
$152,000 |
6.4 |
|
19 |
Cincinnati |
0.336 |
$463,000 |
$61,000 |
7.6 |
|
20 |
Dallas |
0.334 |
$652,000 |
$95,000 |
6.9 |
|
21 |
Columbus, Ohio |
0.333 |
$494,000 |
$53,000 |
9.3 |
|
22 |
Oklahoma City |
0.332 |
$419,000 |
$51,000 |
8.2 |
|
23 |
Tampa, Fla. |
0.330 |
$563,000 |
$75,000 |
7.5 |
|
24 |
Nashville, Tenn. |
0.329 |
$709,000 |
$110,000 |
6.4 |
|
25 |
Milwaukee |
0.327 |
$532,000 |
$60,000 |
8.9 |
|
26 |
Philadelphia |
0.327 |
$628,000 |
$74,000 |
8.5 |
|
27 |
Buffalo, N.Y. |
0.319 |
$370,000 |
$45,000 |
8.2 |
|
28 |
Seattle |
0.317 |
$1,336,000 |
$234,000 |
5.7 |
|
29 |
Los Angeles |
0.311 |
$2,134,000 |
$330,000 |
6.5 |
|
30 |
Boston |
0.308 |
$1,318,000 |
$231,000 |
5.7 |
|
31 |
Austin, Texas |
0.304 |
$796,000 |
$160,000 |
5.0 |
|
32 |
Raleigh, N.C. |
0.303 |
$629,000 |
$112,000 |
5.6 |
|
33 |
San Francisco |
0.298 |
$2,279,000 |
$387,000 |
5.9 |
|
34 |
Virginia Beach, Va. |
0.293 |
$576,000 |
$103,000 |
5.6 |
|
35 |
Washington |
0.293 |
$1,092,000 |
$202,000 |
5.4 |
|
36 |
Richmond, Va. |
0.292 |
$602,000 |
$99,000 |
6.1 |
|
37 |
San Antonio |
0.292 |
$506,000 |
$91,000 |
5.6 |
|
38 |
Orlando, Fla. |
0.290 |
$557,000 |
$100,000 |
5.6 |
|
39 |
Phoenix |
0.284 |
$638,000 |
$140,000 |
4.6 |
|
40 |
Providence, R.I. |
0.274 |
$669,000 |
$158,000 |
4.2 |
|
41 |
San Jose, Calif. |
0.270 |
$2,687,000 |
$561,000 |
4.8 |
|
42 |
San Diego |
0.264 |
$1,598,000 |
$363,000 |
4.4 |
|
43 |
Minneapolis |
0.260 |
$617,000 |
$150,000 |
4.1 |
|
44 |
Riverside, Calif. |
0.259 |
$700,000 |
$152,000 |
4.6 |
|
45 |
Hartford, Conn. |
0.256 |
$536,000 |
$127,000 |
4.2 |
|
46 |
Las Vegas |
0.247 |
$591,000 |
$153,000 |
3.9 |
|
47 |
Sacramento, Calif. |
0.229 |
$812,000 |
$227,000 |
3.6 |
|
48 |
Denver |
0.226 |
$885,000 |
$260,000 |
3.4 |
|
49 |
Portland, Ore. |
0.217 |
$772,000 |
$237,000 |
3.3 |
|
50 |
Salt Lake City |
0.210 |
$597,000 |
$191,000 |
3.1 |
About LendingTree
LendingTree (NASDAQ: TREE) is the nation's leading online loan marketplace, empowering consumers as they comparison-shop across a full suite of loan and credit-based offerings. LendingTree provides an online marketplace which connects consumers with multiple lenders that compete for their business, as well as an array of online tools and information to help consumers find the best loan. Since inception, LendingTree has facilitated more than 65 million loan requests. LendingTree provides free monthly credit scores through My LendingTree and access to its network of over 500 lenders offering home loans, personal loans, credit cards, student loans, business loans, home equity loans/lines of credit, auto loans and more. LendingTree, LLC is a subsidiary of LendingTree, Inc. For more information go to www.lendingtree.com, dial 800-555-TREE, like our Facebook page and/or follow us on Twitter @LendingTree.
MEDIA CONTACT:
Megan Greuling
704-943-8208
Megan.greuling@lendingtree.com
![]()
![]() View original content with multimedia:http://www.prnewswire.com/news-releases/lendingtree-study-where-home-price-inequality-is-highest-300682163.html
View original content with multimedia:http://www.prnewswire.com/news-releases/lendingtree-study-where-home-price-inequality-is-highest-300682163.html
SOURCE LendingTree

Copyright 2018 PR Newswire
1 Year LendingTree Chart |
1 Month LendingTree Chart |

It looks like you are not logged in. Click the button below to log in and keep track of your recent history.
Support: +44 (0) 203 8794 460 | support@advfn.com
By accessing the services available at ADVFN you are agreeing to be bound by ADVFN's Terms & Conditions
 Hot Features