ADVFN Logo ADVFN

We could not find any results for:
Make sure your spelling is correct or try broadening your search.

Trending Now

Toplists

It looks like you aren't logged in.
Click the button below to log in and view your recent history.

Hot Features

Registration Strip Icon for monitor Customisable watchlists with full streaming quotes from leading exchanges, such as LSE, NASDAQ, NYSE, AMEX, Bovespa, BIT and more.

OTIV On Track Innovations Ltd

0.17
0.00 (0.00%)
Last Updated: 01:00:00
Delayed by 15 minutes
Share Name Share Symbol Market Type
On Track Innovations Ltd NASDAQ:OTIV NASDAQ Common Stock
  Price Change % Change Share Price Bid Price Offer Price High Price Low Price Open Price Shares Traded Last Trade
  0.00 0.00% 0.17 0.1701 0.18 0 01:00:00

OTI Reports FY 2006 Third Quarter and Nine Months Financial Results

20/11/2006 1:00pm

PR Newswire (US)


On Track Innovations (NASDAQ:OTIV)
Historical Stock Chart


From Jul 2019 to Jul 2024
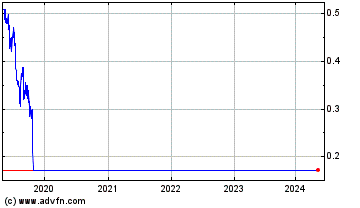
Click Here for more On Track Innovations Charts.
FORT LEE, N.J., Nov. 20 /PRNewswire-FirstCall/ -- On Track Innovations Ltd. (OTI) (NASDAQ:OTIV), a global leader in contactless microprocessor-based smart card solutions for homeland security, payments, petroleum payments and other applications, today announced its consolidated financial results for the third quarter and nine months ended September 30, 2006. -- Revenues: $8.0 million for the three months ended September 30, 2006, a decrease of 34% compared to $12.1 million in the same period last year. Revenues for the first nine months of 2006 were $27.4 million, an increase of 4% compared to $26.4 million in the same period last year. -- Gross Margin: 43% compared to 35% in the third quarter of 2005. Gross margin for the first nine months of 2006 was 45% compared to 35% in the same period last year. -- GAAP Net Loss: $(2.4) million, an increase of 14% compared to $(2.1) million in the third quarter last year. GAAP net loss for the first nine months of 2006 was $(6.3) million, a decrease of 7% compared to $(6.8) million in the same period last year. -- Non-GAAP Net Loss: $(1.7) million, a decrease of 19% compared to $(2.1) million in the third quarter last year. Non-GAAP net loss for the first nine months of 2006 was $(4.0) million, a 38% decrease compared to $(6.5) million in the same period last year. -- GAAP Loss per Share: $(0.16), compared to $(0.23) in the third quarter of 2005. GAAP loss per share for the first nine months of 2006 was $(0.47) compared to $(0.76) in the same period last year. -- Non-GAAP Loss per Share: $(0.11) for the third quarter, compared to $(0.22) for the same period last year. Non-GAAP net loss for the first nine months of 2006, was $(0.29), compared to $(0.73) in the same period last year. Non-GAAP results for the third quarter and nine months of 2006 excludes the impact of SFAS 123(R) and amortization of intangible assets. Non-GAAP results for the third quarter and nine months of 2005 excludes amortization of intangible assets. Please see the attached tables for a full reconciliation of GAAP to Non-GAAP results. "We are making good progress in our overall business," said Oded Bashan, President and CEO of OTI. "While we continued to see the effects of the protracted evaluation and validation period in the U.S. contactless payment cards market in Q3, we see no change in the positive long term outlook for this market and continue to expect acceleration of orders during 2007. All other segments of our business are tracking well and we have a strong pipeline of projects in each of our vertical markets." Recent Developments -- OTI to Acquire most of SuperCom's Assets -- OTI and VeriFone demonstrated contactless reader solution at Cartes show in Paris -- OTI to provide USA Technologies next generation contactless payment readers with initial orders for 10,000 readers -- 'Yellow' Convenience Stores to distribute and add loading infrastructure for EasyPark -- Chevron selected OTI's EasyFuel as its petroleum payment and automated fuel management Solution -- OTI delivers Garanti Bank of Turkey contactless card solutions Conference call and Webcast Information The Company has scheduled a conference call and simultaneous Web cast for Monday, November 20, 2006, which will be hosted by Oded Bashan, President and CEO, Guy Shafran, CFO, and Ohad Bashan, Chief Marketing Officer and President OTI America, for 9:00 AM EST to discuss operating results and future outlook. To participate, call: 1-800-418-6860 (U.S. toll free) 1-809-245-917 (Israel toll free) 0-800-180-8316 (Germany toll free) 1-973-935-8756 (standard international) ID Code: OTI Q3 Conference call. To attend the Web cast, use the following links: http://www.otiglobal.com/content.aspx?id=226 For those unable to participate, the teleconference will be available for replay until midnight November 26th, by calling U.S.: 877-519-4471 or International; 973-341-3080 and entering the PIN number # 8126495 or on the web at: http://www.otiglobal.com/content.aspx?id=226 Use of Non-GAAP Financial Information In addition to reporting financial results in accordance with generally accepted accounting principles, or GAAP, OTI uses non-GAAP measures of gross profit, net income and earnings per share, which are adjustments from results based on GAAP to exclude non-cash equity-based compensation charges in accordance with SFAS 123(R) and amortization of intangible assets. OTI management believes the non-GAAP financial information provided in this release provides meaningful supplemental information regarding our performance and enhances the understanding of the Company's on-going economic performance. The presentation of this non-GAAP financial information is not intended to be considered in isolation or as a substitute for results prepared in accordance with GAAP. Management uses both GAAP and non-GAAP information in evaluating and operating the business and as such deemed it important to provide all this information to investors. About OTI Established in 1990, OTI (NASDAQ:OTIV) designs, develops and markets secure contactless microprocessor-based smart card technology to address the needs of a wide variety of markets. Applications developed by OTI include product solutions for petroleum payment systems, homeland security solutions, electronic passports and IDs, payments, mass transit ticketing, parking and loyalty programs. OTI has a global network of regional offices to market and support its products. The company was awarded the Frost & Sullivan 2005 and 2006 Company of the Year Award in the field of smart cards. For more information on OTI, visit http://www.otiglobal.com/. OTI Contact: Media Relations Galit Mendelson Adam Handelsman Director of Corporate Communications 5W Public Relations 201 944 5200 ext. 111 212 999 5585 (TABLES TO FOLLOW) Safe Harbor for Forward-Looking Statements: This press release contains forward-looking statements within the meaning of the Private Securities Litigation Reform Act of 1995 and other Federal securities laws. Whenever we use words such as "believe," "expect," "anticipate," "intend," "plan," "estimate" or similar expressions, we are making forward-looking statements. Because such statements deal with future events and are based on OTI's current expectations, they are subject to various risks and uncertainties and actual results, performance or achievements of OTI could differ materially from those described in or implied by the statements in this press release. For example, forward-looking statements include statements regarding our goals, beliefs, future growth strategies, objectives, plans or current expectations. Forward-looking statements could be impacted by the effects of the protracted evaluation and validation period in the U.S. contactless payment cards market, the failure of the purchase of assets of SuperCom to close to due a failure to satisfy closing conditions, market acceptance of new and existing products and our ability to execute production on orders, as well as the other risk factors discussed in OTI's Annual Report on Form 20-F for the year ended December 31, 2005, which is on file with the Securities and Exchange Commission. Although OTI believes that the expectations reflected in such forward-looking statements are based on reasonable assumptions, it can give no assurance that its expectations will be achieved. OTI disclaims any intention or obligation to update or revise any forward-looking statements, which speak only as of the date hereof, whether as a result of new information, future events or circumstances or otherwise. ON TRACK INNOVATIONS LTD CONDENSED CONSOLIDATED STATEMENT OF OPERATIONS (In thousands, except share and per share data) Nine months ended Three months ended September 30 September 30 2006 2005 2006 2005 (Unaudited) (Unaudited) (Unaudited) (Unaudited) Revenues Sales $24,754 $24,184 $7,381 $11,583 Licensing and transaction fees 2,607 2,215 624 471 Total revenues 27,361 26,399 8,005 12,054 Cost of Revenues Cost of sales 14,960 17,207 4,576 7,824 Total cost of revenues 14,960 17,207 4,576 7,824 Gross profit 12,401 9,192 3,429 4,230 Operating Expenses Research and development 5,254 4,218 1,953 1,511 Less - participation by the Office of the Chief Scientist - 651 - 146 Research and development, net 5,254 3,567 1,953 1,365 Selling and marketing 5,120 4,809 1,831 1,457 General and administrative 9,177 6,902 3,101 2,642 Amortization of intangible assets 557 285 189 89 Expenses relating to raising of capital, exchange of subsidiary's employees equity interests in equity interest of the company and new acquisitions in the Far East* - 1,768 - 1,768 Gain from sale of subsidiaries (122) (510) (122) - Total operating expenses 19,986 16,821 6,952 7,321 Operating loss (7,585) (7,629) (3,523) (3,091) Financial income, net 1,278 562 542 666 Other income, net 20 53 6 49 Loss before taxes on income and minority interests (6,287) (7,014) (2,975) (2,376) Taxes on income 314 (177) 149 (133) Minority interests 593 (79) 479 (79) Equity in income (loss) of affiliate (969) 5 (63) 5 Loss before extraordinary item $(6,349) $(7,265) $(2,410) $(2,583) Extraordinary item - 444 - 444 Net loss $(6,349) $(6,821) $(2,410) $(2,139) Basic and diluted net loss per ordinary share from: Loss before extraordinary item $ (0.47) $ (0.81) $ (0.16) $ (0.27) Extraordinary item $ - $ 0.05 $ - $ 0.04 Net loss $ (0.47) $ (0.76) $ (0.16) $(0.23) Weighted average number of ordinary shares used in computing basic and diluted net loss per ordinary share 13,456,869 8,985,072 15,097,867 9,495,554 * Consist of: Research and development $- $78 $- $78 Selling and marketing - 231 - 231 General and administrative - 1,459 - 1,459 $- $1,768 $- $1,768 ON TRACK INNOVATIONS LTD CONDENSED NON-GAAP CONSOLIDATED STATEMENT OF OPERATIONS (In thousands, except share and per share data) Nine months ended Three months ended September 30 September 30 2006 2005 2006 2005 (Unaudited) (Unaudited) (Unaudited) (Unaudited) Revenues Sales $24,754 $24,184 $7,381 $11,583 Licensing and transaction fees 2,607 2,215 624 471 Total revenues 27,361 26,399 8,005 12,054 Cost of Revenues Cost of sales 14,949 17,207 4,572 7,824 Total cost of revenues 14,949 17,207 4,572 7,824 Gross profit 12,412 9,192 3,433 4,230 Operating Expenses Research and development 4,456 4,218 1,709 1,511 Less - participation by the Office of the Chief Scientist - 651 - 146 Research and development, net 4,456 3,567 1,709 1,365 Selling and marketing 5,022 4,809 1,804 1,457 General and administrative 8,260 6,902 2,821 2,642 Expenses relating to raising of capital, exchange of subsidiary's employees equity interests in equity interest of the company and new acquisitions in the Far East* - 1,768 - 1,768 Gain from sale of subsidiaries (122) (510) (122) - Total operating expenses 17,616 16,536 6,212 7,232 Operating loss (5,204) (7,344) (2,779) (3,002) Financial income, net 1,278 562 542 666 Other income, net 20 53 6 49 Loss before taxes on income and minority interests (3,906) (6,729) (2,231) (2,287) Taxes on income 314 (177) 149 (133) Minority interests 593 (79) 479 (79) Equity in income (loss) of affiliate (969) 5 (63) 5 Loss before extraordinary item $(3,968) $(6,980) $(1,666) $(2,494) Extraordinary item - 444 - 444 Net loss $(3,968) $(6,536) $(1,666) $(2,050) Basic and diluted net loss per ordinary share from: Loss before extraordinary item $ (0.29) $ (0.78) $ (0.11) $ (0.26) Extraordinary item $ - $ 0.05 $ - $0.04 Net loss $ (0.29) $ (0.73) $ (0.11) $ (0.22) Weighted average number of ordinary shares used in computing basic and diluted net loss per ordinary share 13,456,869 8,985,072 15,097,867 9,495,554 * Consist of: Research and development $- $78 $- $78 Selling and marketing - 231 - 231 General and administrative - 1,459 - 1,459 $- $1,768 $- $1,768 See next tables for full reconciliation of GAAP to Non-GAAP results. ON TRACK INNOVATIONS LTD RECONCILIATION BETWEEN GAAP TO NON-GAAP STATEMENT OF OPERATIONS (In thousands, except share and per share data) Nine Months Ended September 30, 2006 GAAP Adjustments Non-GAAP (unaudited) (unaudited) (unaudited) Revenues Sales $24,754 - $24,754 Licensing and transaction fees 2,607 - 2,607 Total revenues 27,361 27,361 Cost of Revenues Cost of sales 14,960 (11) (a) 14,949 Total cost of revenues 14,960 (11) 14,949 Gross profit 12,401 11 12,412 Operating Expenses Research and development 5,254 (798) (a) 4,456 Selling and marketing 5,120 (98) (a) 5,022 General and administrative 9,177 (917) (a) 8,260 Amortization of intangible assets 557 (557) (b) - Gain from sale of subsidiaries (122) - (122) Total operating expenses 19,986 2,370 17,616 Operating loss (7,585) 2,381 (5,204) Financial income, net 1,278 - 1,278 Other income, net 20 - 20 Loss before taxes on income and minority interests (6,287) 2,381 (3,906) Taxes on income 314 - 314 Minority interests 593 - 593 Equity in loss of affiliate (969) - (969) Net loss $(6,349) $2,381 $ (3,968) Basic and diluted net loss per ordinary share $(0.47) $0.18 $(0.29) Weighted average number of ordinary shares used in computing basic and diluted net loss per ordinary share 13,456,869 13,456,869 (a) The effect of stock-based compensation. The Company adopted the provisions of Statement of Financial Accounting Standards No. 123(R), "Share-Based Payment" on January 1, 2006 using the modified- prospective transition method. (b) The effect of amortization of intangible assets. ON TRACK INNOVATIONS LTD RECONCILIATION BETWEEN GAAP TO NON-GAAP STATEMENT OF OPERATIONS (In thousands, except share and per share data) Three Months Ended September 30, 2006 GAAP Adjustments Non-GAAP (unaudited) (unaudited) (unaudited) Revenues Sales $7,381 - $7,381 Licensing and transaction fees 624 - 624 Total revenues 8,005 8,005 Cost of Revenues Cost of sales 4,576 (4) (a) 4,572 Total cost of revenues 4,576 (4) 4,572 Gross profit 3,429 4 3,433 Operating Expenses Research and development 1,953 (244) (a) 1,709 Selling and marketing 1,831 (27) (a) 1,804 General and administrative 3,101 (280) (a) 2,821 Amortization of intangible assets 189 (189) (b) - Gain from sale of subsidiaries (122) - (122) Total operating expenses 6,952 740 6,212 Operating loss (3,523) 744 (2,779) Financial income, net 542 - 542 Other income, net 6 - 6 Loss before taxes on income and minority interests (2,975) 744 (2,231) Taxes on income 149 - 149 Minority interests 479 - 479 Equity in loss of affiliate (63) - (63) Net loss $(2,410) $744 $(1,666) Basic and diluted net loss per ordinary share $(0.16) $0.05 $(0.11) Weighted average number of ordinary shares used in computing basic and diluted net loss per ordinary share 15,097,867 15,097,867 (a) The effect of stock-based compensation. The Company adopted the provisions of Statement of Financial Accounting Standards No. 123(R), "Share-Based Payment" on January 1, 2006 using the modified- prospective transition method. (b) The effect of amortization of intangible assets. ON TRACK INNOVATIONS LTD RECONCILIATION BETWEEN GAAP TO NON-GAAP STATEMENT OF OPERATIONS (In thousands, except share and per share data) Nine Months Ended September 30, 2005 GAAP Adjustments Non-GAAP (unaudited) (unaudited) (unaudited) Revenues Sales $24,184 - $24,184 Licensing and transaction fees 2,215 - 2,215 Total revenues 26,399 - 26,399 Cost of Revenues Cost of sales 17,207 - 17,207 Total cost of revenues 17,207 - 17,207 Gross profit 9,192 - 9,192 Operating Expenses Research and development 4,218 - 4,218 Less - participation by the Office of the Chief Scientist 651 - 651 Research and development, net 3,567 - 3,567 Selling and marketing 4,809 - 4,809 General and administrative 6,902 - 6,902 Amortization of intangible assets 285 (285) (b) - Expenses relating to raising of capital, exchange of subsidiary's employees equity interests in equity interest of the company and new acquisitions in the Far East* 1,768 - 1,768 Gain from sale of subsidiaries (510) - (510) Total operating expenses 16,821 285 16,536 Operating loss (7,629) 285 (7,344) Financial income, net 562 - 562 Other income, net 53 - 53 Loss before taxes on income and minority interests (7,014) 285 (6,729) Taxes on income (177) - (177) Minority interests (79) - (79) Equity in income of affiliate 5 - 5 Loss before extraordinary item (7,265) - (6,980) Extraordinary item 444 - 444 Net loss $(6,821) $285 $(6,536) Basic and diluted net loss per ordinary share Loss before extraordinary item $(0.81) $0.03 $(0.78) Extraordinary item $0.05 - $0.05 Net loss $(0.76) $0.03 $(0.73) Weighted average number of ordinary shares used in computing basic and diluted net loss per ordinary share 8,985,072 8,985,072 * Consist of: Research and development $78 Selling and marketing 231 General and administrative 1,459 $1,768 (b) The effect of amortization of intangible assets. ON TRACK INNOVATIONS LTD RECONCILIATION BETWEEN GAAP TO NON-GAAP STATEMENT OF OPERATIONS (In thousands, except share and per share data) Three Months Ended September 30, 2005 GAAP Adjustments Non-GAAP (unaudited) (unaudited) (unaudited) Revenues Sales $11,583 - $11,583 Licensing and transaction fees 471 - 471 Total revenues 12,054 - 12,054 Cost of Revenues Cost of sales 7,824 - 7,824 Total cost of revenues 7,824 - 7,824 Gross profit 4,230 - 4,230 Operating Expenses Research and development 1,511 - 1,511 Less - participation by the Office of the Chief Scientist 146 - 146 Research and development, net 1,365 - 1,365 Selling and marketing 1,457 - 1,457 General and administrative 2,642 - 2,642 Amortization of intangible assets 89 (89) (b) - Expenses relating to raising of capital, exchange of subsidiary's employees equity interests in equity interest of the company and new acquisitions in the Far East* 1,768 1,768 Total operating expenses 7,321 89 7,232 Operating loss (3,091) 89 (3,002) Financial income, net 666 - 666 Other income, net 49 49 Loss before taxes on income and minority interests (2,376) 89 (2,287) Taxes on income (133) - (133) Minority interests (79) - (79) Equity income of affiliate 5 - 5 Loss before extraordinary item (2,583) - (2,494) Extraordinary item 444 - 444 Net loss $(2,139) $89 $(2,050) Basic and diluted net loss per ordinary share Loss before extraordinary item $(0.27) $0.01 $(0.26) Extraordinary item $0.04 - $0.04 Net loss $(0.23) $0.01 $(0.22) Weighted average number of ordinary shares used in computing basic and diluted net loss per ordinary share 9,495,554 9,495,554 * Consist of: Research and development $78 Selling and marketing 231 General and administrative 1,459 $1,768 (b) The effect of amortization of intangible assets. ON TRACK INNOVATIONS LTD CONDENSED CONSOLIDATED BALANCE SHEET (In thousands, except share and per share data) September 30 December 31 2006 2005 (Unaudited) (Audited) Assets Current Assets Cash and cash equivalents $40,144 $29,657 Short-term investments 10,017 20,004 Trade receivables (net of allowance for doubtful accounts of $296 and $785 as of September 30, 2006 and December 31, 2005, respectively) 7,740 8,350 Other receivables and prepaid expenses 4,055 3,156 Inventories 8,752 6,747 Total current assets 70,708 67,914 Severance Pay Deposits Fund 585 583 Long-Term Receivables 615 878 Investment in an affiliated company 1,733 2,607 Property, Plant and Equipment, Net 10,732 7,009 Intangible Assets, Net 3,948 1,921 Goodwill 5,766 4,146 Total Assets $94,087 $85,058 Liabilities and Shareholders' Equity Current Liabilities Short-term bank credit and current maturities of long-term bank loans $1,703 $ 760 Trade payables 5,871 4,245 Other current liabilities 4,326 5,771 Total current liabilities 11,900 10,776 Long-Term Liabilities Long-term loans, net of current maturities 1,333 1,535 Accrued severance pay 3,162 1,909 Deferred tax liabilities 1,070 293 Total long-term liabilities 5,565 3,737 Total liabilities 17,465 14,513 Minority interests 530 310 Shareholders' equity Ordinary shares of NIS 0.1 par value: authorized - 50,000,000 shares as of September 30, 2006 and 30,000,000 as of December 31, 2005; issued 15,556,008 and 11,932,074 shares as of September 30, 2006 and December 31, 2005, respectively; outstanding 15,164,893 and 11,932,074 shares as of September 30, 2006 and December 31, 2005, respectively 358 274 Additional paid-in capital 140,024 128,761 Deferred compensation - (833) Accumulated other comprehensive income 258 232 Accumulated deficit (64,548) (58,199) Total shareholders' equity 76,092 70,235 Total Liabilities and Shareholders' Equity $94,087 $85,058 ON TRACK INNOVATIONS LTD CONDENSED CONSOLIDATED STATEMENT OF CASH FLOWS (In thousands, except share and per share data) Nine months ended September 30 2006 2005 (Unaudited) (Unaudited) Cash flows from operating activities Net loss $(6,349) $(6,821) Adjustments required to reconcile net loss to net cash used by operating activities: Stock-based compensation related to options and shares issued to employees and others 2,922 7,137 Gain from sale of subsidiaries (122) (510) Equity in loss (income) of affiliate 969 (5) Extraordinary gain in business combination - (444) Amortization of intangible assets 557 424 Depreciation 1,218 595 Minority share in income (loss) of subsidiaries (593) 79 Accrued severance pay, net 1,251 519 Increase (decrease) in deferred tax liabilities (52) 4 Decrease (increase) in trade receivables 366 (1,761) Decrease (increase) in other receivables and prepaid expenses 389 (46) Decrease in inventories (1,946) (1,402) Increase in trade payables 1,528 417 Increase (decrease) in other current liabilities (1,043) 800 Other, net (374) (37) Net cash used in operating activities (1,279) (1,051) Cash flows from investing activities Acquisition of consolidated subsidiaries, net of cash acquired (23) 80 Proceeds from maturity of available - for sale securities 19,079 6,603 Purchase of available-for sale securities (8,863) (16,642) Purchase of property and equipment (3,502) (1,384) Receipts on account of loans and receivables 261 876 Other, net (102) 22 Net cash provided by (used in) investing activities 6,850 (10,445) Cash flows from financing activities Increase in short-term bank credit, net 1,024 66 Exercise of options and warrants 3,246 4,387 Repayment of long-term bank loans (430) (600) Proceeds from minority in subsidiary 1,036 - Net cash provided by financing activities 4,876 3,853 Effect of exchange rate changes on cash 40 (99) Increase (decrease) in cash and cash equivalents 10,487 (7,742) Cash and cash equivalents at the beginning of the period 29,657 23,917 Cash and cash equivalents at the end of the period $40,144 $16,175 DATASOURCE: On Track Innovations Ltd. CONTACT: Galit Mendelson, Director of Corporate Communications of OTI, +1-201-944-5200 ext. 111, ; or Media Relations, Adam Handelsman of 5W Public Relations, +1-212-999-5585, Web site: http://www.otiglobal.com/

Copyright

1 Year On Track Innovations Chart

1 Year On Track Innovations Chart

1 Month On Track Innovations Chart

1 Month On Track Innovations Chart