ADVFN Logo ADVFN

We could not find any results for:
Make sure your spelling is correct or try broadening your search.

Trending Now

Toplists

It looks like you aren't logged in.
Click the button below to log in and view your recent history.

Hot Features

Registration Strip Icon for charts Register for streaming realtime charts, analysis tools, and prices.

OSIS OSI Systems Inc

150.57
4.62 (3.17%)
After Hours
Last Updated: 21:02:31
Delayed by 15 minutes
Share Name Share Symbol Market Type
OSI Systems Inc NASDAQ:OSIS NASDAQ Common Stock
  Price Change % Change Share Price Bid Price Offer Price High Price Low Price Open Price Shares Traded Last Trade
  4.62 3.17% 150.57 147.65 154.34 151.00 141.57 141.70 190,254 21:02:31

OSI Systems Reports Third Quarter Fiscal 2007 Financial Results

07/05/2007 2:01pm

Business Wire


OSI Systems (NASDAQ:OSIS)
Historical Stock Chart


From Jul 2019 to Jul 2024
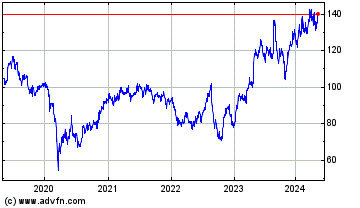
Click Here for more OSI Systems Charts.
OSI Systems, Inc. (NASDAQ:OSIS), a vertically integrated provider of specialized electronics products for critical applications in the Security and Healthcare industries, today announced operating results for its third quarter and nine months ended March 31, 2007. The Company reported revenues of $126.5 million for the third quarter of fiscal 2007, an increase of 17% from the $108.1 million reported for the third quarter of fiscal 2006. The net income for the third quarter of fiscal 2007 was $3.6 million, or $0.21 per diluted share, compared to net income of $1.0 million, or $0.06 per diluted share, for the third quarter of fiscal 2006. For the nine months ended March 31, 2007, the Company reported record revenues of $379.5 million, an increase of $52.4 million, or 16%, from $327.1 million for the first nine months of fiscal 2006. The net loss for the first nine months of fiscal 2007 was ($23.0) million or ($1.37) per diluted share, compared to a net loss of ($3.1) million, or ($0.20) per diluted share, for the first nine months of fiscal 2006. The financial results for the three and nine months ended March 31, 2007 were favorably impacted by the settlement of a dispute with GE related to the acquisition of Spacelabs Medical in fiscal 2004. The settlement resulted in approximately $15.0 million of pre-tax income, which has been recorded as other income. The results were adversely impacted by a ($2.8) million fiscal third quarter operating loss in the OSI Defense Systems business, which is included in the Optoelectronics and Manufacturing division. In the third quarter of fiscal 2007 the Company consolidated certain manufacturing processes and facilities resulting in a pre-tax restructuring charge of $2.2 million. These costs were directly related to the Company’s previously announced plan to generate approximately $15 - $17 million of pre-tax annualized cost savings through the integration of recent acquisitions and the rationalization of the Company’s cost structure. For the first nine months of fiscal 2007, the Company has incurred impairment, restructuring and other charges of approximately $34.0 million. Including the aforementioned restructuring charges the company incurred non-cash pre-tax charges of approximately $21.5 million associated with the impairment of certain fixed and intangible assets as well as the recording of $10.3 million of additional inventory reserves, which is included in cost of goods sold. Deepak Chopra, OSI Systems’ Chairman and CEO, stated, “We continued our positive top line momentum while our overall backlog increased to record levels due to the strength of our Security bookings. Improving our overall operating performance continues to be our top priority. We expect the previously announced cost cutting measures to be largely implemented by the end of the fiscal year.” The Company’s backlog as of March 31, 2007 was $209 million compared to $197 million as of December 31, 2006. The Security Division had a backlog of approximately $124 million as of March 31, 2007 compared to $115 million as of December 31, 2006. Forward-Looking Guidance The Company reaffirms its previously published revenue guidance of $535 - $545 million for the fiscal year ended June 30, 2007. Conference Call Information OSI Systems, Inc. will host a conference call and simultaneous webcast over the Internet beginning at 9:00am PST (12:00pm EST), today to discuss its results for the third quarter and first nine months of fiscal 2007. To listen, please log on to www.fulldisclosure.com or www.osi-systems.com and follow the link that will be posted on the front page. A replay of the webcast will be available shortly after the conclusion of the conference call until May 21, 2007. The replay can either be accessed through the Company’s website, www.osi-systems.com, or via telephonic replay by calling 1-888-286-8010 and entering the conference call identification number ‘71537634’ when prompted for the replay code. About OSI Systems, Inc. OSI Systems, Inc. is a vertically integrated designer and manufacturer of specialized electronic systems and components for critical applications. The Company sells its products in diversified markets, including homeland security, healthcare, defense and aerospace. The Company has more than 30 years of experience in electronics engineering and manufacturing and maintains offices and production facilities located in more than a dozen countries. It implements a strategy of expansion by leveraging its electronics and contract manufacturing capabilities into selective end product markets through organic growth and acquisitions. For more information on OSI Systems Inc. or any of its subsidiary companies, visit www.osi-systems.com. This press release contains forward-looking statements within the meaning of Section 27A of the Securities Act of 1933, as amended, and Section 21E of the Securities Exchange Act of 1934, as amended. Such statements include information regarding the Company’s expectations, goals or intentions about the future, including, the Company’s predictions about the size and effect of its cost-cutting measures, steps being taken to improve profitability and future revenues. The actual results may differ materially from those described in or implied by any forward-looking statement. In particular, there can be no assurance that cost-cutting measures will ultimately result in savings that are in line with current expectations, that the Company will achieve profitability or that future revenues predictions will ultimately prove accurate. Other important factors are set forth in our Securities and Exchange Commission filings. All forward-looking statements speak only as of the date made, and we undertake no obligation to update these forward-looking statements. OSI SYSTEMS, INC. AND SUBSIDIARIES   Consolidated Statements of Operations (in thousands, except share and per share data)     Three Months Ended   Nine Months Ended   March 31,   March 31, 2007  2006  2007  2006      Revenues $ 126,498  $ 108,092  $ 379,485  $ 327,100  Cost of goods sold 82,562  65,019  257,772  201,932  Gross profit 43,936  43,073  121,713  125,168    Operating expenses: Selling, general and administrative 36,199  33,805  110,531  100,738  Research and development 11,390  8,851  33,424  26,281  Impairment, restructuring, and other charges 2,226  -  23,769  800  Other operating expenses 110  51  658  624  Total operating expenses 49,925  42,707  168,382  128,443    Income (loss) from operations (5,989) 366  (46,669) (3,275)   Interest expense (1,239) (236) (3,520) (1,186) Interest income 85  91  322  180  Other income / (expense) 15,772  -  15,772  349    Income (loss) before provision for income taxes and minority interest 8,629  221  (34,095) (3,932) Provision (benefit) for income taxes 3,678  (820) (11,607) (1,816) Minority interest (1,338) (30) (553) (976) Net income (loss) $ 3,613  $ 1,011  $ (23,041) $ (3,092)     Diluted income (loss) per share $ 0.21  $ 0.06  $ (1.37) $ (0.20)   Weighted average shares outstanding - diluted 17,237  16,766  16,779  16,326  Condensed Consolidated Balance Sheets (in thousands)   June 30, March 31, 2006  2007  Assets Cash and cash equivalents $ 13,799  $ 18,787  Accounts receivable, net 119,419  120,134  Inventories 120,604  121,702  Other current assets 29,477  45,462  Total current assets 283,299  306,085  Non-current assets 119,774  126,704  Total $ 403,073  $ 432,789    Liabilities and Stockholders' Equity Bank lines of credit $ 10,857  $ 16,358  Current portion of long-term debt 1,251  5,578  Accounts payable and accrued expenses 68,526  71,910  Other current liabilities 40,509  43,312  Total current liabilities 121,143  137,158  Long-term debt 5,483  26,965  Other long-term liabilities 17,769  20,349  Total liabilities 144,395  184,472  Minority interest 9,731  9,723  Shareholders' equity 248,947  238,594  Total $ 403,073  $ 432,789  SEGMENT INFORMATION (in thousands)   Three Months Ended Nine Months Ended March 31, March 31, 2007  2006  2007  2006    Revenues - by Segment Group: Security Group $ 45,044  $ 36,446  $ 130,479  $ 93,787  Healthcare Group 53,671  49,429  164,639  161,799  Optoelectronics and Manufacturing Group including intersegment revenues 37,200  29,689  111,068  88,593  Intersegment revenues elimination (9,417) (7,472) (26,701) (17,079) Total $ 126,498  $ 108,092  $ 379,485  $ 327,100    Operating income (loss) - by Segment Group: Security Group $ 527  $ 1,230  $ (31,284) $ (2,614) Healthcare Group (3,381) 1,063  (8,994) 8,159  Optoelectronics and Manufacturing Group 547  3,608  7,279  7,391  Corporate (3,291) (5,293) (13,436) (16,002) Eliminations (391) (242) (234) (209) Total $ (5,989) $ 366  $ (46,669) $ (3,275)

1 Year OSI Systems Chart

1 Year OSI Systems Chart

1 Month OSI Systems Chart

1 Month OSI Systems Chart

Your Recent History

Delayed Upgrade Clock