
We could not find any results for:
Make sure your spelling is correct or try broadening your search.
| Share Name | Share Symbol | Market | Type |
|---|---|---|---|
| IM Cannabis Corporation | NASDAQ:IMCC | NASDAQ | Common Stock |
| Price Change | % Change | Share Price | Bid Price | Offer Price | High Price | Low Price | Open Price | Shares Traded | Last Trade | |
|---|---|---|---|---|---|---|---|---|---|---|
| 0.01214 | 2.67% | 0.4661 | 0.46 | 1.72 | 0.4781 | 0.4422 | 0.4427 | 64,770 | 01:00:00 |
|
|
|
IM CANNABIS CORP.
|
|
|
|
|
(Registrant)
|
|
|
|
|
|
|
|
Date:
|
November 13, 2023
|
By:
|
/s/ Oren Shuster
|
|
|
|
Name:
|
Oren Shuster
|
|
|
|
Title:
|
Chief Executive Officer and Director
|
| • |
6.6% decrease in Revenue and an additional 6.4% decrease in Revenue directly related to negative currency fluctuations for a total revenue of $12.4 million
|
| • |
10% increase in Gross Margin
|
| • |
30% increase in Gross Profit
|
| • |
65% decrease in Non-IFRS Adjusted EBITDA Loss
|
| • |
34% decrease in operating expenses, a 6% decrease compared to Q2, 2023
|
| • |
In Q3 we kicked off a full integration project between Israel and Germany to further drive efficiencies in both of our markets. From supply to marketing and sales we are sharing information and working together as one team.
|
| • |
We reenforced our position as #1 in the premium market through the launch of two new LOT 420 high THC strains, Glto 33 and Xeno, as well as an additional IMC product, Chemchew.
|
| • |
We outsourced outpatient delivery service, keeping the same level of service but with an estimated $300,000 CAD in annual savings.
|
| • |
We launched our first premium High THC strain leveraging the entire IMC Israel branding and collateral. By working closely with the Israeli team, we were able to ensure that this launch was our strongest launch in Germany so far.
|
| • |
Revenues for the third quarter of 2023 were $12.4 million compared to $14.2 million in the third quarter of 2022, a decrease of 13%. Of these 13%, almost
half, 6.4% or $0.9 million of the decrease is coming from negative currency fluctuations.
|
| • |
Gross Margin, before fair value adjustments, in the third quarter of 2023 was 22%, compared to 20% in the third quarter of 2022, an increase of 10%.
|
| • |
Non-IFRS Adjusted EBITDA Loss in the third quarter of 2023 was $1.3 million, compared to an Adjusted EBITDA Loss of $3.7 million in the third quarter of
2022, a decrease of 65%. The decrease is mainly attributable to slow moving mid-range stock discounts and dollar rate increase effect.
|
| • |
Total Operating Expenses in the third quarter of 2023 were $4.9 million, compared to $7.5 million in the third quarter of 2022, a decrease of 34%. Most of the decline can be attributed to restructuring that took place in 2023.
|
| • |
Total Dried Flower sold in the third quarter of 2023 was approximately 2,558kg with an average selling price of $4.35 per gram compared to approximately 1,453kg in the third quarter of 2022 with an
average selling price of $9.08 per gram. The decrease in average selling price was caused by increased competition within the retail segment, and mid-range stock discounts.
|
| • |
Gross Profit for the third quarter of 2023 was $2.6 million, compared to $2 million in the third quarter of 2022, an increase of 30%. The increase is mainly
attributable to increased high margin sales of imported premium cannabis products, and reduction of costs of sales.
|
| • |
General and Administrative Expenses in the third quarter of 2023 were $2.1 million, compared to $4.3 million in the third quarter of 2022, a decrease of 51%.
The decrease in the general and administrative expense is mainly attributable to reduced employee salaries derived from the restructuring plan in Israel announced in the first quarter of 2023 and presented separately in the interim
financial statement for the period.
|
| • |
Selling and Marketing Expenses in the third quarter of 2023 were $2.6 million, compared to $2.8 million in the third quarter of 2022, a decrease of 7%.
|
| • |
Operating Loss in the third quarter of 2023 was $2.3 million, compared to $5.5 million in the third quarter of 2022, a decrease of 58%.
|
| • |
Net Loss from Continuing Operations in the third quarter of 2023 was $2.1 million, compared to $4.5 million in the third quarter of 2022, driven mostly by
higher gross margin and reduction in operating expenses and offset by finance income in the third quarter of 2022.
|
| • |
Basic Loss and Diluted per Share from Continuing Operations in the third quarter of 2023 was $(0.16), compared to a loss of $(0.06) per share in the third quarter of 2022.
|
| • |
Cash and Cash Equivalents as of September 30, 2023 were $1.3 million, compared to $2.4 million in December 31, 2022.
|
| • |
Total Assets as of September 30, 2023 were $52.4 million, compared to $60.7 million in December 31, 2022, a decrease of 14%. The decrease is mainly
attributed to reduced cash and cash equivalents, inventory and to the effect of dollar rate increase on items denominated in Israeli Shekels.
|
| • |
Total Liabilities as of September 30, 2023 were $32.6 million, compared to $36.9 in December 31, 2022, a decrease of 12%. The
decrease was mainly due to the reduction in trade payables, valuation of warrants fair value and to the effect of dollar rate increase on items denominated in Israeli Shekels.
|
|
INTERIM CONDENSED CONSOLIDATED STATEMENTS OF FINANCIAL POSITION
|
||||
|
Canadian Dollars in thousands
|
||||
|
September 30, 2023
|
December 31, 2022
|
|||||||||||
|
Note
|
(Unaudited)
|
|||||||||||
|
ASSETS
|
||||||||||||
|
CURRENT ASSETS:
|
||||||||||||
|
Cash and cash equivalents
|
$
|
1,304
|
$
|
2,449
|
||||||||
|
Trade receivables
|
9,672
|
8,684
|
||||||||||
|
Advances to suppliers
|
1,198
|
1,631
|
||||||||||
|
Other accounts receivable
|
5,140
|
3,323
|
||||||||||
|
Inventories
|
11,031
|
16,585
|
||||||||||
|
28,345
|
32,672
|
|||||||||||
|
NON-CURRENT ASSETS:
|
||||||||||||
|
Property, plant and equipment, net
|
5,020
|
5,221
|
||||||||||
|
Investments in affiliates
|
2,202
|
2,410
|
||||||||||
|
Right-of-use assets, net
|
1,203
|
1,929
|
||||||||||
|
Deferred tax assets, net
|
648
|
763
|
||||||||||
|
Intangible assets, net
|
6,021
|
7,910
|
||||||||||
|
Goodwill
|
8,926
|
9,771
|
||||||||||
|
24,020
|
28,004
|
|||||||||||
|
Total assets
|
$
|
52,365
|
$
|
60,676
|
||||||||
|
The accompanying notes are an integral part of the interim condensed consolidated financial statements.
|
|
INTERIM CONDENSED CONSOLIDATED STATEMENTS OF FINANCIAL POSITION
|
|
Canadian Dollars in thousands
|
|
|
September 30, 2023
|
December 31, 2022
|
||||||||||
|
Note
|
(Unaudited)
|
|||||||||||
|
LIABILITIES AND EQUITY
|
||||||||||||
|
CURRENT LIABILITIES:
|
||||||||||||
|
Trade payables
|
$
|
9,586
|
$
|
15,312
|
||||||||
|
Bank loans and credit facilities
|
10,137
|
9,246
|
||||||||||
|
Other accounts payable and accrued expenses
|
6,000
|
6,013
|
||||||||||
|
Accrued purchase consideration liabilities
|
1,830
|
2,434
|
||||||||||
|
Current maturities of operating lease liabilities
|
448
|
814
|
||||||||||
|
28,001
|
33,819
|
|||||||||||
|
NON-CURRENT LIABILITIES:
|
||||||||||||
|
Warrants measured at fair value
|
3
|
2,447
|
8
|
|||||||||
|
Operating lease liabilities
|
720
|
1,075
|
||||||||||
|
Long-term loans
|
376
|
399
|
||||||||||
|
Employee benefit liabilities, net
|
30
|
246
|
||||||||||
|
Deferred tax liability, net
|
997
|
1,332
|
||||||||||
|
4,570
|
3,060
|
|||||||||||
|
Total liabilities
|
32,571
|
36,879
|
||||||||||
|
EQUITY ATTRIBUTABLE TO EQUITY HOLDERS OF THE COMPANY:
|
4
|
|||||||||||
|
Share capital and premium
|
251,155
|
245,776
|
||||||||||
|
Translation reserve
|
1,304
|
1,283
|
||||||||||
|
Reserve from share-based payment transactions
|
12,455
|
15,167
|
||||||||||
|
Accumulated deficit
|
(245,747
|
)
|
(239,574
|
)
|
||||||||
|
Total equity attributable to equity holders of the Company
|
19,167
|
22,652
|
||||||||||
|
Non-controlling interests
|
627
|
1,145
|
||||||||||
|
Total equity
|
19,794
|
23,797
|
||||||||||
|
Total liabilities and equity
|
$
|
52,365
|
$
|
60,676
|
||||||||
|
The accompanying notes are an integral part of the interim condensed consolidated financial statements.
|
|
INTERIM CONDENSED CONSOLIDATED STATEMENTS OF PROFIT OR LOSS
AND OTHER COMPREHENSIVE INCOME (UNAUDITED)
|
|
Canadian Dollars in thousands, except per share data
|
|
Nine months ended
September 30,
|
Three months ended
September 30,
|
|||||||||||||||
|
2023
|
2022
|
2023
|
2022
|
|||||||||||||
|
(Unaudited)
|
||||||||||||||||
|
Revenues
|
$
|
38,106
|
$
|
39,874
|
$
|
12,370
|
$
|
14,170
|
||||||||
|
Cost of revenues
|
28,391
|
31,374
|
9,632
|
11,351
|
||||||||||||
|
Gross profit before fair value adjustments
|
9,715
|
8,500
|
2,738
|
2,819
|
||||||||||||
|
Fair value adjustments:
|
||||||||||||||||
|
Unrealized change in fair value of biological assets
|
-
|
(315
|
)
|
-
|
-
|
|||||||||||
|
Realized fair value adjustments on inventory sold in the period
|
(710
|
)
|
(1,626
|
)
|
(93
|
)
|
(866
|
)
|
||||||||
|
Total fair value adjustments
|
(710
|
)
|
(1,941
|
)
|
(93
|
)
|
(866
|
)
|
||||||||
|
Gross profit
|
9,005
|
6,559
|
2,645
|
1,953
|
||||||||||||
|
General and administrative expenses
|
7,708
|
11,670
|
2,145
|
4,315
|
||||||||||||
|
Selling and marketing expenses
|
7,991
|
8,379
|
2,564
|
2,797
|
||||||||||||
|
Restructuring expenses
|
617
|
4,383
|
-
|
-
|
||||||||||||
|
Share-based compensation
|
316
|
2,209
|
195
|
367
|
||||||||||||
|
Total operating expenses
|
16,632
|
26,641
|
4,904
|
7,479
|
||||||||||||
|
Operating loss
|
7,627
|
20,082
|
2,259
|
5,526
|
||||||||||||
|
Finance income, net
|
869
|
3,782
|
248
|
1,198
|
||||||||||||
|
Loss before income taxes
|
6,758
|
16,300
|
2,011
|
4,328
|
||||||||||||
|
Income tax benefit (expense)
|
(50
|
)
|
(1,029
|
)
|
125
|
204
|
||||||||||
|
Net loss from continuing operations
|
(6,708
|
)
|
(15,271
|
)
|
(2,136
|
)
|
(4,532
|
)
|
||||||||
|
Net loss from discontinued operations
|
-
|
(142,581
|
)
|
-
|
(123,643
|
)
|
||||||||||
|
Net loss
|
(6,708
|
)
|
(157,852
|
)
|
(2,136
|
)
|
(128,175
|
)
|
||||||||
|
Other comprehensive income (loss) that will not be reclassified to profit or loss in subsequent periods:
|
||||||||||||||||
|
Remeasurement gain on defined benefit plan
|
36
|
-
|
-
|
-
|
||||||||||||
|
Exchange differences on translation to presentation currency
|
(622
|
)
|
(1,630
|
)
|
39
|
1,312
|
||||||||||
|
Total other comprehensive income (loss) that will not be reclassified to profit or loss in subsequent periods
|
(586
|
)
|
(1,630
|
)
|
39
|
1,312
|
||||||||||
|
Other comprehensive income (loss) that will be reclassified to profit or loss in subsequent periods:
|
||||||||||||||||
|
Adjustments arising from translating financial statements of foreign operation
|
624
|
654
|
158
|
(549
|
)
|
|||||||||||
|
Total other comprehensive income (loss) that will be reclassified to profit or loss in subsequent periods:
|
624
|
654
|
158
|
(549
|
)
|
|||||||||||
|
Total other comprehensive income (loss)
|
38
|
(976
|
)
|
197
|
763
|
|||||||||||
|
Total comprehensive loss
|
$
|
(6,670
|
)
|
$
|
(158,828
|
)
|
$
|
(1,939
|
)
|
$
|
(127,412
|
)
|
||||
|
INTERIM CONDENSED CONSOLIDATED STATEMENTS OF PROFIT OR LOSS AND OTHER COMPREHENSIVE INCOME (UNAUDITED)
|
|
Canadian Dollars in thousands, except per share data
|
|
Nine months ended
September 30,
|
Three months ended
September 30,
|
|||||||||||||||||||
|
2023
|
2022
|
2023
|
2022
|
|||||||||||||||||
|
Note
|
Unaudited
|
|||||||||||||||||||
|
Net loss attributable to:
|
||||||||||||||||||||
|
Equity holders of the Company
|
$
|
(6,209
|
)
|
$
|
(155,863
|
)
|
$
|
(2,150
|
)
|
$
|
(127,788
|
)
|
||||||||
|
Non-controlling interests
|
(499
|
)
|
(1,989
|
)
|
14
|
(387
|
)
|
|||||||||||||
|
$
|
(6,708
|
)
|
$
|
(157,852
|
)
|
$
|
(2,136
|
)
|
$
|
(128,175
|
)
|
|||||||||
|
Total comprehensive loss attributable to:
|
||||||||||||||||||||
|
Equity holders of the Company
|
$
|
(6,152
|
)
|
$
|
(156,754
|
)
|
$
|
(1,943
|
)
|
$
|
(127,069
|
)
|
||||||||
|
Non-controlling interests
|
(518
|
)
|
(2,074
|
)
|
4
|
(343
|
)
|
|||||||||||||
|
$
|
(6,670
|
)
|
$
|
(158,828
|
)
|
$
|
(1,939
|
)
|
$
|
(127,412
|
)
|
|||||||||
|
Net income (loss) per share attributable to equity holders of the Company:
|
6
|
|||||||||||||||||||
|
Basic loss per share (in CAD)
|
$
|
(0.49
|
)
|
$
|
(2.22
|
)
|
$
|
(0.16
|
)
|
$
|
(1.81
|
)
|
||||||||
|
Diluted loss per share (in CAD)
|
$
|
(0.49
|
)
|
$
|
(2.29
|
)
|
$
|
(0.16
|
)
|
$
|
(1.81
|
)
|
||||||||
|
Earnings (loss) per share attributable to equity holders of the Company from continuing operations:
|
||||||||||||||||||||
|
Basic loss per share (in CAD)
|
$
|
(0.49
|
)
|
$
|
(0.19
|
)
|
$
|
(0.16
|
)
|
$
|
(0.06
|
)
|
||||||||
|
Diluted loss per share (in CAD)
|
$
|
(0.49
|
)
|
$
|
(0.26
|
)
|
$
|
(0.16
|
)
|
$
|
(0.06
|
)
|
||||||||
|
Loss per share attributable to equity holders of the Company from discontinued operations:
|
||||||||||||||||||||
|
Basic and diluted loss per share (in CAD)
|
-
|
$
|
(2.03
|
)
|
-
|
$
|
(1.75
|
)
|
||||||||||||
|
The accompanying notes are an integral part of the interim condensed consolidated financial statements.
|
||||||||||||||||||||
|
INTERIM CONDENSED CONSOLIDATED STATEMENTS OF CASH FLOWS (UNAUDITED)
|
|
Canadian Dollars in thousands
|
|
Nine months ended
September 30,
|
||||||||
|
2023
|
2022
|
|||||||
|
Cash flows from operating activities:
|
||||||||
|
Net loss for the period
|
$
|
(6,708
|
)
|
$
|
(157,852
|
)
|
||
|
Adjustments for non-cash items:
|
||||||||
|
Unrealized gain on changes in fair value of biological assets
|
-
|
(553
|
)
|
|||||
|
Fair value adjustment on sale of inventory
|
710
|
3,816
|
||||||
|
Fair value adjustment of warrants measured at fair value and derivative assets
|
(4,547
|
)
|
(5,892
|
)
|
||||
|
Depreciation of property, plant and equipment
|
494
|
2,530
|
||||||
|
Amortization of intangible assets
|
1,329
|
1,834
|
||||||
|
Depreciation of right-of-use assets
|
442
|
1,504
|
||||||
|
Goodwill impairment
|
-
|
107,854
|
||||||
|
Impairment of property, plant and equipment
|
-
|
2,277
|
||||||
|
Impairment of intangible assets
|
-
|
3,067
|
||||||
|
Impairment of right-of-use assets
|
-
|
1,914
|
||||||
|
Finance expenses, net
|
3,678
|
6,226
|
||||||
|
Deferred tax benefit, net
|
(200
|
)
|
(1,851
|
)
|
||||
|
Share-based payment
|
316
|
3,284
|
||||||
|
Revaluation of other receivable
|
-
|
4,191
|
||||||
|
Restructuring expenses
|
-
|
8,773
|
||||||
|
2,222
|
138,974
|
|||||||
|
Changes in working capital:
|
||||||||
|
Decrease (increase) in trade receivables, net
|
(2,719
|
)
|
1,215
|
|||||
|
Decrease (increase) in other accounts receivable
|
(353
|
)
|
3,419
|
|||||
|
Decrease in biological assets, net of fair value adjustments
|
-
|
522
|
||||||
|
Decrease (increase) in inventories, net of fair value adjustments
|
4,844
|
(641
|
)
|
|||||
|
Increase (decrease) in trade payables
|
(4,652
|
)
|
8,020
|
|||||
|
Increase (decrease) in employee benefit liabilities, net
|
(204
|
)
|
14
|
|||||
|
Increase (decrease) in other accounts payable and accrued expenses
|
265
|
(3,324
|
)
|
|||||
|
(2,819
|
)
|
9,225
|
||||||
|
Taxes paid
|
(552
|
)
|
(470
|
)
|
||||
|
Net cash used in operating activities
|
(7,857
|
)
|
(10,123
|
)
|
||||
|
The accompanying notes are an integral part of the interim condensed consolidated financial statements.
|
|
INTERIM CONDENSED CONSOLIDATED STATEMENTS OF CASH FLOWS (UNAUDITED)
|
|
Canadian Dollars in thousands
|
|
Nine months ended
September 30,
|
||||||||
|
2023
|
2022
|
|||||||
|
Unaudited
|
||||||||
|
Cash flows from investing activities:
|
||||||||
|
Purchase of property, plant and equipment
|
$
|
(553
|
)
|
$
|
(1,386
|
)
|
||
|
Proceeds from sales of property, plant and equipment
|
-
|
210
|
||||||
|
Proceeds from loans receivable
|
-
|
350
|
||||||
|
Net cash used in investing activities
|
$
|
(553
|
)
|
$
|
(826
|
)
|
||
|
Cash flow from financing activities:
|
||||||||
|
Proceeds from issuance of share capital, net of issuance costs
|
$
|
1,688
|
$
|
3,174
|
||||
|
Proceeds from exercise of options
|
-
|
335
|
||||||
|
Proceeds from issuance of Warrants
|
6,585
|
-
|
||||||
|
Repayment of lease liability
|
(435
|
)
|
(1,075
|
)
|
||||
|
Payment of lease liability interest
|
(44
|
)
|
(1,262
|
)
|
||||
|
(Repayment) proceeds from bank loan and credit facilities, net
|
(1,109
|
)
|
2,510
|
|||||
|
Interest paid
|
(163
|
)
|
(774
|
)
|
||||
|
Proceeds from factoring of checks receivables
|
2,932
|
-
|
||||||
|
Net cash provided by financing activities
|
9,454
|
2,908
|
||||||
|
Effect of foreign exchange on cash and cash equivalents
|
(2,189
|
)
|
(1,879
|
)
|
||||
|
Increase (decrease) in cash and cash equivalents
|
(1,145
|
)
|
(9,920
|
)
|
||||
|
Cash and cash equivalents at beginning of the period
|
2,449
|
13,903
|
||||||
|
Cash and cash equivalents at end of the period
|
$
|
1,304
|
$
|
3,983
|
||||
|
Supplemental disclosure of non-cash activities:
|
||||||||
|
Right-of-use asset recognized with corresponding lease liability
|
$
|
49
|
$
|
269
|
||||
|
Issuance of shares in payment of purchase consideration liability
|
$
|
-
|
$
|
3,062
|
||||
|
Issuance of shares and warrants in payment of debt settlement to a non-independent director of the company
|
$
|
1,061
|
$
|
-
|
||||
|
The accompanying notes are an integral part of the interim condensed consolidated financial statements.
|
|
Page
|
|
|
F-4 - F-5
|
|
|
F-6 - F-7
|
|
|
F-8
|
|
|
F-9 - F-10
|
|
|
F-11 - F-29
|
|
September 30,
2023
|
December 31, 2022
|
|||||||||||
|
Note
|
(Unaudited)
|
|||||||||||
|
ASSETS
|
||||||||||||
|
CURRENT ASSETS:
|
||||||||||||
|
Cash and cash equivalents
|
$
|
1,304
|
$
|
2,449
|
||||||||
|
Trade receivables
|
9,672
|
8,684
|
||||||||||
|
Advances to suppliers
|
1,198
|
1,631
|
||||||||||
|
Other accounts receivable
|
5,140
|
3,323
|
||||||||||
|
Inventories
|
11,031
|
16,585
|
||||||||||
|
28,345
|
32,672
|
|||||||||||
|
NON-CURRENT ASSETS:
|
||||||||||||
|
Property, plant and equipment, net
|
5,020
|
5,221
|
||||||||||
|
Investments in affiliates
|
2,202
|
2,410
|
||||||||||
|
Right-of-use assets, net
|
1,203
|
1,929
|
||||||||||
|
Deferred tax assets, net
|
648
|
763
|
||||||||||
|
Intangible assets, net
|
6,021
|
7,910
|
||||||||||
|
Goodwill
|
8,926
|
9,771
|
||||||||||
|
24,020
|
28,004
|
|||||||||||
|
Total assets
|
$
|
52,365
|
$
|
60,676
|
||||||||
|
September 30,
2023
|
December 31, 2022
|
||||||||||
|
Note
|
(Unaudited)
|
||||||||||
|
LIABILITIES AND EQUITY
|
|||||||||||
|
CURRENT LIABILITIES:
|
|||||||||||
|
Trade payables
|
$
|
9,586
|
$
|
15,312
|
|||||||
|
Bank loans and credit facilities
|
10,137
|
9,246
|
|||||||||
|
Other accounts payable and accrued expenses
|
6,000
|
6,013
|
|||||||||
|
Accrued purchase consideration liabilities
|
1,830
|
2,434
|
|||||||||
|
Current maturities of operating lease liabilities
|
448
|
814
|
|||||||||
|
28,001
|
33,819
|
||||||||||
|
NON-CURRENT LIABILITIES:
|
|||||||||||
|
Warrants measured at fair value
|
3
|
2,447
|
8
|
||||||||
|
Operating lease liabilities
|
720
|
1,075
|
|||||||||
|
Long-term loans
|
376
|
399
|
|||||||||
|
Employee benefit liabilities, net
|
30
|
246
|
|||||||||
|
Deferred tax liability, net
|
997
|
1,332
|
|||||||||
|
4,570
|
3,060
|
||||||||||
|
Total liabilities
|
32,571
|
36,879
|
|||||||||
|
EQUITY ATTRIBUTABLE TO EQUITY HOLDERS OF THE COMPANY:
|
4
|
||||||||||
|
Share capital and premium
|
251,155
|
245,776
|
|||||||||
|
Translation reserve
|
1,304
|
1,283
|
|||||||||
|
Reserve from share-based payment transactions
|
12,455
|
15,167
|
|||||||||
|
Accumulated deficit
|
(245,747
|
)
|
(239,574
|
)
|
|||||||
|
Total equity attributable to equity holders of the Company
|
19,167
|
22,652
|
|||||||||
|
Non-controlling interests
|
627
|
1,145
|
|||||||||
|
Total equity
|
19,794
|
23,797
|
|||||||||
|
Total liabilities and equity
|
$
|
52,365
|
$
|
60,676
|
|||||||
|
Nine months ended
September 30,
|
Three months ended
September 30,
|
|||||||||||||||
|
2023
|
2022
|
2023
|
2022
|
|||||||||||||
|
(Unaudited)
|
||||||||||||||||
|
Revenues
|
$
|
38,106
|
$
|
39,874
|
$
|
12,370
|
$
|
14,170
|
||||||||
|
Cost of revenues
|
28,391
|
31,374
|
9,632
|
11,351
|
||||||||||||
|
Gross profit before fair value adjustments
|
9,715
|
8,500
|
2,738
|
2,819
|
||||||||||||
|
Fair value adjustments:
|
||||||||||||||||
|
Unrealized change in fair value of biological assets
|
-
|
(315
|
)
|
-
|
-
|
|||||||||||
|
Realized fair value adjustments on inventory sold in the period
|
(710
|
)
|
(1,626
|
)
|
(93
|
)
|
(866
|
)
|
||||||||
|
Total fair value adjustments
|
(710
|
)
|
(1,941
|
)
|
(93
|
)
|
(866
|
)
|
||||||||
|
Gross profit
|
9,005
|
6,559
|
2,645
|
1,953
|
||||||||||||
|
General and administrative expenses
|
7,708
|
11,670
|
2,145
|
4,315
|
||||||||||||
|
Selling and marketing expenses
|
7,991
|
8,379
|
2,564
|
2,797
|
||||||||||||
|
Restructuring expenses
|
617
|
4,383
|
-
|
-
|
||||||||||||
|
Share-based compensation
|
316
|
2,209
|
195
|
367
|
||||||||||||
|
Total operating expenses
|
16,632
|
26,641
|
4,904
|
7,479
|
||||||||||||
|
Operating loss
|
7,627
|
20,082
|
2,259
|
5,526
|
||||||||||||
|
Finance income, net
|
869
|
3,782
|
248
|
1,198
|
||||||||||||
|
Loss before income taxes
|
6,758
|
16,300
|
2,011
|
4,328
|
||||||||||||
|
Income tax benefit (expense)
|
(50
|
)
|
(1,029
|
)
|
125
|
204
|
||||||||||
|
Net loss from continuing operations
|
(6,708
|
)
|
(15,271
|
)
|
(2,136
|
)
|
(4,532
|
)
|
||||||||
|
Net loss from discontinued operations
|
-
|
(142,581
|
)
|
-
|
(123,643
|
)
|
||||||||||
|
Net loss
|
(6,708
|
)
|
(157,852
|
)
|
(2,136
|
)
|
(128,175
|
)
|
||||||||
|
Other comprehensive income (loss) that will not be reclassified to profit or loss in subsequent periods:
|
||||||||||||||||
|
Remeasurement gain on defined benefit plan
|
36
|
-
|
-
|
-
|
||||||||||||
|
Exchange differences on translation to presentation currency
|
(622
|
)
|
(1,630
|
)
|
39
|
1,312
|
||||||||||
|
Total other comprehensive income (loss) that will not be reclassified to profit or loss in subsequent periods
|
(586
|
)
|
(1,630
|
)
|
39
|
1,312
|
||||||||||
|
Other comprehensive income (loss) that will be reclassified to profit or loss in subsequent periods:
|
||||||||||||||||
|
Adjustments arising from translating financial statements of foreign operation
|
624
|
654
|
158
|
(549
|
)
|
|||||||||||
|
Total other comprehensive income (loss) that will be reclassified to profit or loss in subsequent periods:
|
624
|
654
|
158
|
(549
|
)
|
|||||||||||
|
Total other comprehensive income (loss)
|
38
|
(976
|
)
|
197
|
763
|
|||||||||||
|
Total comprehensive loss
|
$
|
(6,670
|
)
|
$
|
(158,828
|
)
|
$
|
(1,939
|
)
|
$
|
(127,412
|
)
|
||||
|
Nine months ended
September 30,
|
Three months ended
September 30,
|
||||||||||||||||||
|
2023
|
2022
|
2023
|
2022
|
||||||||||||||||
|
Note
|
Unaudited
|
||||||||||||||||||
|
Net loss attributable to:
|
|||||||||||||||||||
|
Equity holders of the Company
|
$
|
(6,209
|
)
|
$
|
(155,863
|
)
|
$
|
(2,150
|
)
|
$
|
(127,788
|
)
|
|||||||
|
Non-controlling interests
|
(499
|
)
|
(1,989
|
)
|
14
|
(387
|
)
|
||||||||||||
|
$
|
(6,708
|
)
|
$
|
(157,852
|
)
|
$
|
(2,136
|
)
|
$
|
(128,175
|
)
|
||||||||
|
Total comprehensive loss attributable to:
|
|||||||||||||||||||
|
Equity holders of the Company
|
$
|
(6,152
|
)
|
$
|
(156,754
|
)
|
$
|
(1,943
|
)
|
$
|
(127,069
|
)
|
|||||||
|
Non-controlling interests
|
(518
|
)
|
(2,074
|
)
|
4
|
(343
|
)
|
||||||||||||
|
$
|
(6,670
|
)
|
$
|
(158,828
|
)
|
$
|
(1,939
|
)
|
$
|
(127,412
|
)
|
||||||||
|
Net income (loss) per share attributable to equity holders of the Company:
|
6
|
||||||||||||||||||
|
Basic loss per share (in CAD)
|
$
|
(0.49
|
)
|
$
|
(2.22
|
)
|
$
|
(0.16
|
)
|
$
|
(1.81
|
)
|
|||||||
|
Diluted loss per share (in CAD)
|
$
|
(0.49
|
)
|
$
|
(2.29
|
)
|
$
|
(0.16
|
)
|
$
|
(1.81
|
)
|
|||||||
|
Earnings (loss) per share attributable to equity holders of the Company from continuing operations:
|
|||||||||||||||||||
|
Basic loss per share (in CAD)
|
$
|
(0.49
|
)
|
$
|
(0.19
|
)
|
$
|
(0.16
|
)
|
$
|
(0.06
|
)
|
|||||||
|
Diluted loss per share (in CAD)
|
$
|
(0.49
|
)
|
$
|
(0.26
|
)
|
$
|
(0.16
|
)
|
$
|
(0.06
|
)
|
|||||||
|
Loss per share attributable to equity holders of the Company from discontinued operations:
|
|||||||||||||||||||
|
Basic and diluted loss per share (in CAD)
|
-
|
$
|
(2.03
|
)
|
-
|
$
|
(1.75
|
)
|
|||||||||||
|
Share
Capital and premium
|
Reserve from share-based payment transactions
|
Translation reserve
|
Accumulated deficit
|
Total
|
Non-controlling interests
|
Total
equity
|
||||||||||||||||||||||
|
Balance as of January 1, 2023
|
$
|
245,776
|
$
|
15,167
|
$
|
1,283
|
$
|
(239,574
|
)
|
$
|
22,652
|
$
|
1,145
|
$
|
23,797
|
|||||||||||||
|
Net loss
|
-
|
-
|
-
|
(6,209
|
)
|
(6,209
|
)
|
(499
|
)
|
(6,708
|
)
|
|||||||||||||||||
|
Total other comprehensive loss
|
-
|
-
|
21
|
36
|
57
|
(19
|
)
|
38
|
||||||||||||||||||||
|
Total comprehensive loss
|
-
|
-
|
21
|
(6,173
|
)
|
(6,152
|
)
|
(518
|
)
|
(6,670
|
)
|
|||||||||||||||||
|
Issuance of common shares
|
2,351
|
-
|
-
|
-
|
2,351
|
-
|
2,351
|
|||||||||||||||||||||
|
Share-based compensation
|
-
|
316
|
-
|
-
|
316
|
-
|
316
|
|||||||||||||||||||||
|
Expired options
|
3,028
|
(3,028
|
)
|
-
|
-
|
-
|
-
|
-
|
||||||||||||||||||||
|
Balance as of September 30, 2023
|
$
|
251,155
|
$
|
12,455
|
$
|
1,304
|
$
|
(245,747
|
)
|
$
|
19,167
|
$
|
627
|
$
|
19,794
|
|||||||||||||
|
Share capital and premium
|
Treasury stock
|
Reserve for share-based payment transactions
|
Translation reserve
|
Accumulate deficit
|
Total
|
Non-controlling interests
|
Total
equity
|
|||||||||||||||||||||||||
|
Balance as of January 1, 2022
|
$
|
237,677
|
$
|
(660
|
)
|
$
|
12,348
|
$
|
2,614
|
$
|
(50,743
|
)
|
$
|
201,236
|
$
|
3,709
|
$
|
204,945
|
||||||||||||||
|
Net loss
|
-
|
-
|
-
|
-
|
(155,863
|
)
|
(155,863
|
)
|
(1,989
|
)
|
(157,852
|
)
|
||||||||||||||||||||
|
Other comprehensive income (loss)
|
-
|
-
|
-
|
(891
|
)
|
-
|
(891
|
)
|
(85
|
)
|
(976
|
)
|
||||||||||||||||||||
|
Total comprehensive loss
|
-
|
-
|
-
|
(891
|
)
|
(155,863
|
)
|
(156,754
|
)
|
(2,074
|
)
|
(158,828
|
)
|
|||||||||||||||||||
|
Issuance of common shares
|
6,236
|
-
|
-
|
-
|
-
|
6,236
|
-
|
6,236
|
||||||||||||||||||||||||
|
Exercise of options
|
1,072
|
-
|
(737
|
)
|
-
|
-
|
335
|
-
|
335
|
|||||||||||||||||||||||
|
Share based payment
|
-
|
-
|
3,284
|
-
|
-
|
3,284
|
-
|
3,284
|
||||||||||||||||||||||||
|
Expired Options
|
217
|
-
|
(217
|
)
|
-
|
-
|
-
|
-
|
-
|
|||||||||||||||||||||||
|
Balance as of September 30, 2022
|
$
|
245,202
|
$
|
(660
|
)
|
$
|
14,678
|
$
|
1,723
|
$
|
(206,606
|
)
|
$
|
54,337
|
$
|
1,635
|
$
|
55,972
|
||||||||||||||
|
Nine months ended
September 30,
|
||||||||
|
2023
|
2022
|
|||||||
|
Cash flows from operating activities:
|
||||||||
|
Net loss for the period
|
$
|
(6,708
|
)
|
$
|
(157,852
|
)
|
||
|
Adjustments for non-cash items:
|
||||||||
|
Unrealized gain on changes in fair value of biological assets
|
-
|
(553
|
)
|
|||||
|
Fair value adjustment on sale of inventory
|
710
|
3,816
|
||||||
|
Fair value adjustment of warrants measured at fair value and derivative assets
|
(4,547
|
)
|
(5,892
|
)
|
||||
|
Depreciation of property, plant and equipment
|
494
|
2,530
|
||||||
|
Amortization of intangible assets
|
1,329
|
1,834
|
||||||
|
Depreciation of right-of-use assets
|
442
|
1,504
|
||||||
|
Goodwill impairment
|
-
|
107,854
|
||||||
|
Impairment of property, plant and equipment
|
-
|
2,277
|
||||||
|
Impairment of intangible assets
|
-
|
3,067
|
||||||
|
Impairment of right-of-use assets
|
-
|
1,914
|
||||||
|
Finance expenses, net
|
3,678
|
6,226
|
||||||
|
Deferred tax benefit, net
|
(200
|
)
|
(1,851
|
)
|
||||
|
Share-based payment
|
316
|
3,284
|
||||||
|
Revaluation of other receivable
|
-
|
4,191
|
||||||
|
Restructuring expenses
|
-
|
8,773
|
||||||
|
2,222
|
138,974
|
|||||||
|
Changes in working capital:
|
||||||||
|
Decrease (increase) in trade receivables, net
|
(2,719
|
)
|
1,215
|
|||||
|
Decrease (increase) in other accounts receivable
|
(353
|
)
|
3,419
|
|||||
|
Decrease in biological assets, net of fair value adjustments
|
-
|
522
|
||||||
|
Decrease (increase) in inventories, net of fair value adjustments
|
4,844
|
(641
|
)
|
|||||
|
Increase (decrease) in trade payables
|
(4,652
|
)
|
8,020
|
|||||
|
Increase (decrease) in employee benefit liabilities, net
|
(204
|
)
|
14
|
|||||
|
Increase (decrease) in other accounts payable and accrued expenses
|
265
|
(3,324
|
)
|
|||||
|
(2,819
|
)
|
9,225
|
||||||
|
Taxes paid
|
(552
|
)
|
(470
|
)
|
||||
|
Net cash used in operating activities
|
(7,857
|
)
|
(10,123
|
)
|
||||
|
Nine months ended
September 30,
|
||||||||
|
2023
|
2022
|
|||||||
|
Unaudited
|
||||||||
|
Cash flows from investing activities:
|
||||||||
|
Purchase of property, plant and equipment
|
$
|
(553
|
)
|
$
|
(1,386
|
)
|
||
|
Proceeds from sales of property, plant and equipment
|
-
|
210
|
||||||
|
Proceeds from loans receivable
|
-
|
350
|
||||||
|
Net cash used in investing activities
|
$
|
(553
|
)
|
$
|
(826
|
)
|
||
|
Cash flow from financing activities:
|
||||||||
|
Proceeds from issuance of share capital, net of issuance costs
|
$
|
1,688
|
$
|
3,174
|
||||
|
Proceeds from exercise of options
|
-
|
335
|
||||||
|
Proceeds from issuance of Warrants
|
6,585
|
-
|
||||||
|
Repayment of lease liability
|
(435
|
)
|
(1,075
|
)
|
||||
|
Payment of lease liability interest
|
(44
|
)
|
(1,262
|
)
|
||||
|
(Repayment) proceeds from bank loan and credit facilities, net
|
(1,109
|
)
|
2,510
|
|||||
|
Interest paid
|
(163
|
)
|
(774
|
)
|
||||
|
Proceeds from factoring of checks receivables
|
2,932
|
-
|
||||||
|
Net cash provided by financing activities
|
9,454
|
2,908
|
||||||
|
Effect of foreign exchange on cash and cash equivalents
|
(2,189
|
)
|
(1,879
|
)
|
||||
|
Increase (decrease) in cash and cash equivalents
|
(1,145
|
)
|
(9,920
|
)
|
||||
|
Cash and cash equivalents at beginning of the period
|
2,449
|
13,903
|
||||||
|
Cash and cash equivalents at end of the period
|
$
|
1,304
|
$
|
3,983
|
||||
|
Supplemental disclosure of non-cash activities:
|
||||||||
|
Right-of-use asset recognized with corresponding lease liability
|
$
|
49
|
$
|
269
|
||||
|
Issuance of shares in payment of purchase consideration liability
|
$
|
-
|
$
|
3,062
|
||||
|
Issuance of shares and warrants in payment of debt settlement to a non-independent director of the company
|
$
|
1,061
|
$
|
-
|
||||
| NOTE 1:- |
GENERAL
|
| a. |
Corporate information:
|
| 1. |
In January 2022, Focus entered into a revolving credit facility with an Israeli bank, Bank Mizrahi (the “Mizrahi Facility”). The Mizrahi Facility is guaranteed by Focus assets. Advances from the Mizrahi Facility will be used for working
capital needs. The Mizrahi Facility has a total commitment of up to NIS 15 million (approximately $6,000) and has a one-year term for on-going needs and 6 months term for imports and purchases needs. The Mizrahi Facility is renewable upon
mutual agreement by the parties. The borrowing base is available for draw at any time throughout the Mizrahi Facility and is subject to several covenants to be measured on a quarterly basis (the “Mizrahi Facility Covenants”).
|
| 2. |
On August 24, 2022, the Company announced a private placement for aggregate gross proceeds of up to $6,500 (US$5 million) (the “Private Placement”). In this Private Placement the Company issued 599,999 Common Shares for a total amount of
$3,756 (US$3 million) including investments by the Company’s management and executives. Issuance costs of this transaction amounted to $178.
|
| 3. |
On October 11, 2022, IMC Holdings entered into a loan agreement with A.D.I. Car Alarms Stereo Systems Ltd (“ADI” and the “ADI Agreement”), to borrow a
principal amount of NIS 10,500 thousands (approximately $4,000) at an annual interest of 15% (the “ADI Loan”), which is to be repaid within 12 months of the date of the ADI Agreement. The ADI Loan is
secured by a second rank land charge on the Logistics Center of Adjupharm. In addition, CEO and Director of the Company, provided a personal guarantee to ADI should the security not be sufficient to cover the repayment of the ADI Loan.
|
| 4. |
In January and February of 2023, the Company issued an aggregate of issued 2,828,248 units of the Company (each a “Unit”) at a price of US$1.25 per Unit for aggregate gross proceeds of US$3,535 (approximately $4,792) in a series of
closings pursuant to a non-brokered private placement offering to purchasers resident in Canada (except the Province of Quebec) and/or other qualifying jurisdictions relying on the listed issuer financing exemption under Part 5A of National
Instrument 45-106 – Prospectus Exemptions (the “LIFE Offering”). Each Unit consisted of one Common Share and one Common Share purchase warrant (each, a “Warrant”), with each Warrant entitling the holder thereof to purchase one additional
Common Share at an exercise price of US$1.50 for a period of 36 months from the date of issue.
|
| 5. |
On July 3rd, 2023, the Company entered into a short-term loan agreement with a non-financial institution in the amount of NIS 1,000 thousands (approx. $358). The Loan beard interest rate of 10% and was repaid in October 2023, according
to the Loan Agreement terms.
|
| 6. |
As of September 30, 2023, the Company's cash position (cash and cash equivalents) totaled $1,304 and the Company's working capital (current assets minus current liabilities) amounted to $344. In the nine months ended September 30, 2023,
the Company had an operating loss of $7,627 and negative cash flows from operating activities of $7,857.
|
| b. |
Approval of Interim Condensed Consolidated Financial Statements:
|
| c. |
Definitions:
|
|
The Company, or IMCC
|
-
|
IM Cannabis Corp.
|
|
The Group
|
-
|
IM Cannabis Corp., its Subsidiaries and Focus
|
|
Subsidiaries
|
-
|
Companies that are controlled by the Company (as defined in IFRS 10) and whose accounts are consolidated with those of the Company
|
|
CAD or $
|
-
|
Canadian Dollar
|
|
NIS
|
-
|
New Israeli Shekel
|
|
USD or US$
|
-
|
United States Dollar
|
|
EURO or €
|
-
|
Euro
|
| a. |
Basis of presentation and measurement:
|
| 1) |
Amendment to IAS 8, "Accounting Policies, Changes to Accounting Estimates and Errors":
|
| 2) |
Amendment to IAS 12, "Income Taxes":
|
| 3) |
Amendment to IAS 1, "Disclosure of Accounting Policies":
|
| b. |
Significant accounting judgements and estimates:
|
| NOTE 3:- |
FINANCIAL INSTRUMENTS
|
| a. |
Financial instruments are measured either at fair value or at amortized cost. The table below lists the valuation methods used to determine fair value of each financial instrument.
|
|
Financial Instruments Measured at Fair Value
|
Fair Value Method
|
|
|
Liability for Warrants *)
Investment in affiliates
|
Black & Scholes model (Level 3 category)
Market comparable (Level 3 category)
|
| *) |
Finance (income) expenses include fair value adjustment of Warrants measured at fair value, which for the nine months ended September 30, 2023 and 2022, amounted to $(4,547) and $(5,905) respectively.
|
|
Issue date
|
||||||||||||
|
May 2023
|
February 2023
|
May 2021
|
||||||||||
|
Expected volatility
|
97
|
%
|
104
|
%
|
97
|
%
|
||||||
|
Share price (Canadian Dollar)
|
0.97
|
0.97
|
0.97
|
|||||||||
|
Expected life (in years)
|
2.589
|
2.342
|
2.589
|
|||||||||
|
Risk-free interest rate
|
3.62
|
%
|
3.70
|
%
|
3.62
|
%
|
||||||
|
Expected dividend yield
|
0
|
%
|
0
|
%
|
0
|
%
|
||||||
|
Fair value:
|
||||||||||||
|
Per Warrant (Canadian Dollar)
|
$
|
0.408
|
$
|
0.418
|
$
|
0.129
|
||||||
|
Total Warrants (Canadian Dollar in thousands)
|
$
|
201
|
$
|
2,208
|
$
|
38
|
||||||
| NOTE 4:- |
EQUITY
|
| a. |
Composition of share capital:
|
|
September 30,
2023
|
December 31,
2022
|
|||||||||||||
|
Authorized
|
Issued and outstanding
|
Authorized
|
Issued and outstanding
|
|||||||||||
|
Common Shares without par value
|
Unlimited
|
13,394,136
|
Unlimited
|
7,569,526
|
||||||||||
| b. |
Capital issuances:
|
| NOTE 4:- |
EQUITY (Cont.)
|
| c. |
Changes in issued and outstanding share capital:
|
|
Number of shares
|
||||
|
Balance as of January 1, 2023
|
7,569,526
|
|||
|
Issuance of Common Shares pursuant to private placement offering
|
5,277,119
|
|||
|
Issuance of Common Shares pursuant to debt settlement
|
492,492
|
|||
|
Issuance of Common Shares pursuant to vested RSUs
|
54,999
|
|||
|
Balance as of September 30, 2023
|
13,394,136
|
|||
| NOTE 4:- |
EQUITY (Cont.)
|
|
Nine months ended
September 30, 2023
|
||||||||
|
Number of options
|
Weighted average exercise price
|
|||||||
|
in CAD
|
||||||||
|
Options outstanding at the beginning of the period
|
519,170
|
$
|
37.61
|
|||||
|
Options granted during the period
|
3,000
|
1.10
|
||||||
|
Options forfeited during the period
|
(127,718
|
)
|
(51.78
|
)
|
||||
|
Options outstanding at the end of the period
|
394,452
|
$
|
32.75
|
|||||
|
Options exercisable at the end of the period
|
344,256
|
$
|
36.65
|
|||||
| NOTE 5:- |
SELECTED STATEMENTS OF PROFIT OR LOSS DATA
|
|
Nine months ended
September 30,
|
Three months ended
September 30,
|
|||||||||||||||
|
2023
|
2022
|
2023
|
2022
|
|||||||||||||
|
Salaries and related expenses
|
$
|
6,081
|
$
|
8,659
|
$
|
1,821
|
$
|
3,103
|
||||||||
|
Depreciation and amortization
|
$
|
2,265
|
$
|
1,942
|
$
|
678
|
$
|
626
|
||||||||
|
Nine months ended September 30,
|
||||||||||||||||
|
2023
|
2022
|
|||||||||||||||
|
Weighted average number of shares (in thousands)
|
Net loss attributable to equity holders of the Company
|
Weighted average number of shares (in thousands)
|
Net loss attributable to equity holders of the Company
|
|||||||||||||
|
For the computation of basic net earnings from continuing operations
|
12,625
|
(6,209
|
)
|
70,337
|
(13,282
|
)
|
||||||||||
|
Effect of potential dilutive Common Shares
|
-
|
-
|
3,077
|
(5,905
|
)
|
|||||||||||
|
For the computation of diluted net earnings from continuing operations
|
12,625
|
(6,209
|
)
|
73,414
|
(19,187
|
)
|
||||||||||
|
For the computation of basic and diluted net earnings from discontinued operations
|
-
|
-
|
70,337
|
(142,581
|
)
|
|||||||||||
|
Three months ended September 30,
|
||||||||||||||||
|
2023
|
2022
|
|||||||||||||||
|
Weighted average number of shares (in thousands)
|
Net loss attributable to equity holders of the Company
|
Weighted average number of shares (in thousands)
|
Net loss attributable to equity holders of the Company
|
|||||||||||||
|
For the computation of basic net earnings from continuing operations
|
13,393
|
(2,150
|
)
|
70,667
|
(4,145
|
)
|
||||||||||
|
Effect of potential dilutive Common Shares
|
-
|
-
|
3,077
|
(203
|
)
|
|||||||||||
|
For the computation of diluted net earnings from continuing operations
|
13,393
|
(2,150
|
)
|
73,744
|
(4,348
|
)
|
||||||||||
|
For the computation of basic and diluted net earnings from discontinued operations
|
-
|
-
|
70,667
|
(123,643
|
)
|
|||||||||||
| NOTE 7:- |
OPERATING SEGMENTS
|
| a. |
Reporting operating segments:
|
|
Israel
|
Germany
|
Adjustments
|
Total
|
|||||||||||||
|
Revenue
|
$
|
33,941
|
$
|
4,165
|
$
|
-
|
$
|
38,106
|
||||||||
|
Segment loss
|
$
|
(2,974
|
)
|
$
|
(1,035
|
)
|
$
|
-
|
$
|
(4,009
|
)
|
|||||
|
Unallocated corporate expenses
|
$
|
-
|
$
|
-
|
$
|
(3,618
|
)
|
$
|
(3,618
|
)
|
||||||
|
Total operating loss
|
$
|
(2,974
|
)
|
$
|
(1,035
|
)
|
$
|
(3,618
|
)
|
$
|
(7,627
|
)
|
||||
|
Income (loss) before tax
|
$
|
(6,131
|
)
|
$
|
(1,537
|
)
|
$
|
910
|
$
|
(6,758
|
)
|
|||||
|
Depreciation, amortization and impairment
|
$
|
2,139
|
$
|
126
|
$
|
-
|
$
|
2,265
|
||||||||
|
Israel
|
Germany
|
Adjustments
|
Total
|
|||||||||||||
|
Revenue
|
$
|
37,364
|
$
|
2,510
|
$
|
-
|
$
|
39,874
|
||||||||
|
Segment loss
|
$
|
(13,325
|
)
|
$
|
(2,708
|
)
|
$
|
-
|
$
|
(16,033
|
)
|
|||||
|
Unallocated corporate expenses
|
$
|
-
|
$
|
-
|
$
|
(4,049
|
)
|
$
|
(4,049
|
)
|
||||||
|
Total operating loss
|
$
|
(13,325
|
)
|
$
|
(2,708
|
)
|
$
|
(4,049
|
)
|
$
|
(20,082
|
)
|
||||
|
Income (loss) before tax
|
$
|
(15,427
|
)
|
$
|
(3,074
|
)
|
$
|
2,201
|
$
|
(16,300
|
)
|
|||||
|
Depreciation, amortization and impairment
|
$
|
1,821
|
$
|
121
|
$
|
-
|
$
|
1,942
|
||||||||
| NOTE 7:- |
OPERATING SEGMENTS (Cont.)
|
|
Israel
|
Germany
|
Adjustments
|
Total
|
|||||||||||||
|
Revenue
|
$
|
10,832
|
$
|
1,538
|
$
|
-
|
$
|
12,370
|
||||||||
|
Segment loss
|
$
|
(1,132
|
)
|
$
|
(268
|
)
|
$
|
-
|
$
|
(1,400
|
)
|
|||||
|
Unallocated corporate expenses
|
$
|
-
|
$
|
-
|
$
|
(859
|
)
|
$
|
(859
|
)
|
||||||
|
Total operating loss
|
$
|
(1,132
|
)
|
$
|
(268
|
)
|
$
|
(859
|
)
|
$
|
(2,259
|
)
|
||||
|
Income (loss) before tax
|
$
|
(1,931
|
)
|
$
|
(441
|
)
|
$
|
361
|
$
|
(2,011
|
)
|
|||||
|
Depreciation, amortization and impairment
|
$
|
630
|
$
|
48
|
$
|
-
|
$
|
678
|
||||||||
|
Israel
|
Germany
|
Adjustments
|
Total
|
|||||||||||||
|
Revenue
|
$
|
13,158
|
$
|
1,012
|
$
|
-
|
$
|
14,170
|
||||||||
|
Segment loss
|
$
|
(3,110
|
)
|
$
|
(699
|
)
|
$
|
-
|
$
|
(3,809
|
)
|
|||||
|
Unallocated corporate expenses
|
$
|
-
|
$
|
-
|
$
|
(1,717
|
)
|
$
|
(1,717
|
)
|
||||||
|
Total operating loss
|
$
|
(3,110
|
)
|
$
|
(699
|
)
|
$
|
(1,717
|
)
|
$
|
(5,526
|
)
|
||||
|
Income (loss) before tax
|
$
|
(2,128
|
)
|
$
|
(808
|
)
|
$
|
(1,392
|
)
|
$
|
(4,328
|
)
|
||||
|
Depreciation, amortization and impairment
|
$
|
588
|
$
|
38
|
$
|
-
|
$
|
626
|
||||||||
| NOTE 8:- |
DISCONTINUED OPERATIONS AND DECONSOLIDATION OF TRICHOME
|
| NOTE 8:- |
DISCONTINUED OPERATIONS AND DECONSOLIDATION OF TRICHOME (Cont.)
|
|
Nine months
|
Three months
|
|||||||
|
Revenues
|
$
|
27,272
|
$
|
5,586
|
||||
|
Cost of revenues
|
21,813
|
6,413
|
||||||
|
Gross profit before fair value adjustments
|
5,459
|
(827
|
)
|
|||||
|
Fair value adjustments:
|
||||||||
|
Unrealized change in fair value of biological assets
|
868
|
(582
|
)
|
|||||
|
Realized fair value adjustments on inventory sold in the period
|
(2,190
|
)
|
(433
|
)
|
||||
|
Total fair value adjustments
|
(1,322
|
)
|
(1,015
|
)
|
||||
|
Gross profit
|
4,137
|
(1,842
|
)
|
|||||
|
General and administrative expenses
|
132,784
|
119,841
|
||||||
|
Selling and marketing expenses
|
4,557
|
1,393
|
||||||
|
Share-based compensation
|
1,075
|
259
|
||||||
|
Restructuring
|
4,506
|
(273
|
)
|
|||||
|
Total operating expenses
|
142,922
|
121,220
|
||||||
|
Operating loss
|
(138,785
|
)
|
(123,062
|
)
|
||||
|
Finance expenses, net
|
(4,117
|
)
|
(703
|
)
|
||||
|
Loss before income taxes
|
(142,902
|
)
|
(123,765
|
)
|
||||
|
Income tax expense (benefit)
|
(321
|
)
|
(122
|
)
|
||||
|
Net loss from discontinued operations, net of tax
|
$
|
(142,581
|
)
|
$
|
(123,643
|
)
|
||
|
Nine months ended September 30, 2022
|
Three month ended September 30, 2022
|
|||||||
|
Operating activities
|
$
|
(762
|
)
|
$
|
2,010
|
|||
|
Investing activities
|
$
|
(613
|
)
|
$
|
(428
|
)
|
||
|
Financing activities
|
$
|
(1,035
|
)
|
$
|
(3,032
|
)
|
||
|
4
|
|
|
5
|
|
| 5 | |
| 7 | |
| 11 | |
|
11
|
|
| 16 | |
| 40 | |
|
47
|
|
|
52
|
|
Legal Entity
|
Jurisdiction
|
Relationship with the Company
|
|
I.M.C. Holdings Ltd. (“IMC Holdings”)
|
Israel
|
Wholly-owned subsidiary
|
|
I.M.C. Pharma Ltd. (“IMC Pharma”)
|
Israel
|
Wholly-owned subsidiary of IMC Holdings
|
|
I.M.C. Farms Israel Ltd. (“IMC Farms”)
|
Israel
|
Wholly-owned subsidiary of IMC Holdings
|
|
Focus Medical Herbs Ltd. (“Focus”)
|
Israel
|
Private company over which IMC Holdings exercises “de facto control” under IFRS 10 Consolidated Financial
Statements (“IFRS 10”)
|
|
R.A. Yarok Pharm Ltd. (“Pharm Yarok”)
|
Israel
|
Wholly-owned subsidiary of IMC Holdings
|
|
Rosen High Way Ltd. (“Rosen High Way”)
|
Israel
|
Wholly-owned subsidiary of IMC Holdings
|
|
Revoly Trading and Marketing Ltd. dba Vironna Pharm (“Vironna”)
|
Israel
|
Subsidiary of IMC Holdings
|
|
Oranim Plus Pharm Ltd. (“Oranim Plus”)
|
Israel
|
Subsidiary of IMC Holdings
|
|
Adjupharm GmbH (“Adjupharm”)
|
Germany
|
Subsidiary of IMC Holdings
|
|
Trichome Financial Corp. (“Trichome”) *
|
Canada
|
Wholly-owned subsidiary
|
| • |
Continue building on the increasing demand and positive momentum in Israel and Germany, supported by strategic alliances with Canadian suppliers and a highly skilled sourcing team, to cement its leadership position in markets where the
Company operates.
|
| • |
Develop and execute a long-term growth plan in Germany, based on the strong sourcing infrastructure in Israel which is powered by advanced product knowledge and regulatory expertise establishing, in the Company’s view, a competitive
advantage ahead of proposals for the legalization of recreational cannabis in Germany.
|
| • |
Properly position brands with respect to target-market, price, potency and quality, such as our IMC brand in Israel and Germany.
|
| • |
Strong focus on efficiencies and synergies as a global organization with domestic expertise in Israel and Germany.
|
| • |
High-quality, reliable supply to our customers and patients, leading to recurring sales.
|
| • |
Ongoing introduction of new Stock Keeping Unit (“SKUs”) to keep consumers and patients engaged.
|
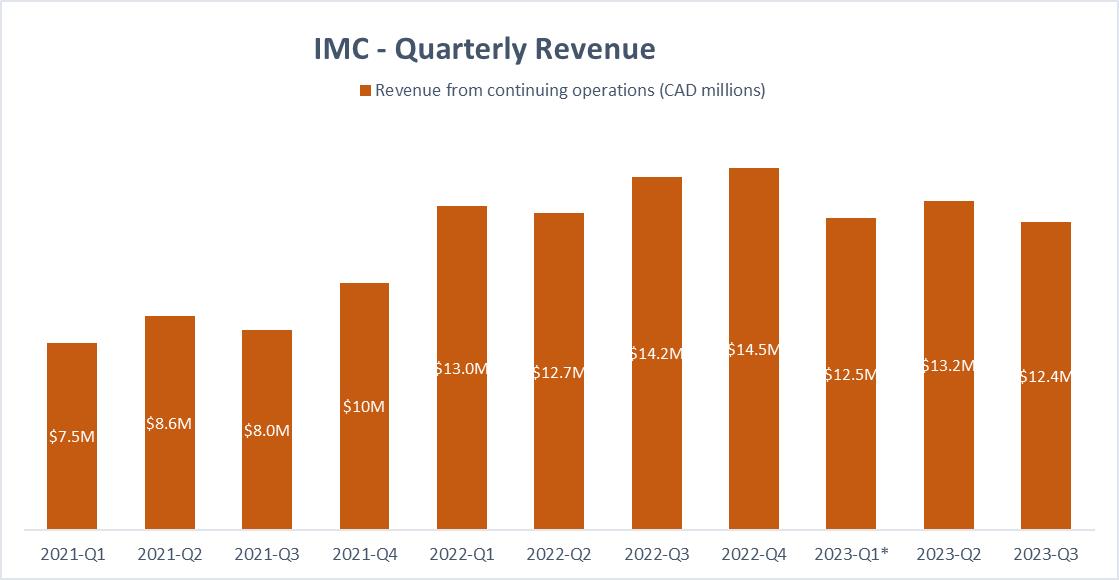

|
The Top-Shelf Collection –offers indoor-grown, high-THC cannabis flowers with strains such as Lemon
Rocket, Diesel Drift, Tropicana Gold, Lucy Dreamz and Santa Cruz. Inspired by the 1970’s cannabis culture in America, the Top-Shelf Collection targets the growing segment of medical patients who are cannabis culture enthusiasts.
|
 |
|
The WAGNERS™ brand launched in Israel in Q1 2022, with indoor-grown cannabis imported from Canada. The WAGNERS™ brand was
the first international premium, indoor-grown brand introduced to the Israel cannabis market, at a competitive price point. The WAGNERS™ brand includes the Dark Helmet, Dark Helmet Minis, Cherry Jam launched in Q1 2022, and Golden Ghost
that was launched in Q4 2022. In Q1 2023 The Company launched three additional products under the WAGNERS™ brand, Pink Bubba, Golden Ghost and Tiki Rain; all an indoor-grown cannabis flowers, with high-THC. In Q2 2023 the Company launched
Rainforest Crunch. In Q3 2023 the Company launched Cherry Jam.
|
 |
|
BLKMKT™, the Company’s second Canadian brand, super-premium product line with indoor-grown, hand-dried and hand-trimmed
high-THC cannabis flowers The BLKMKT™ includes Jealousy, BACIO GLTO, PNPL P and PARK FIRE OG
|
 |
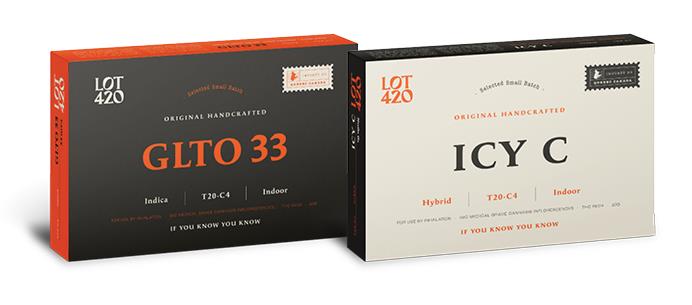

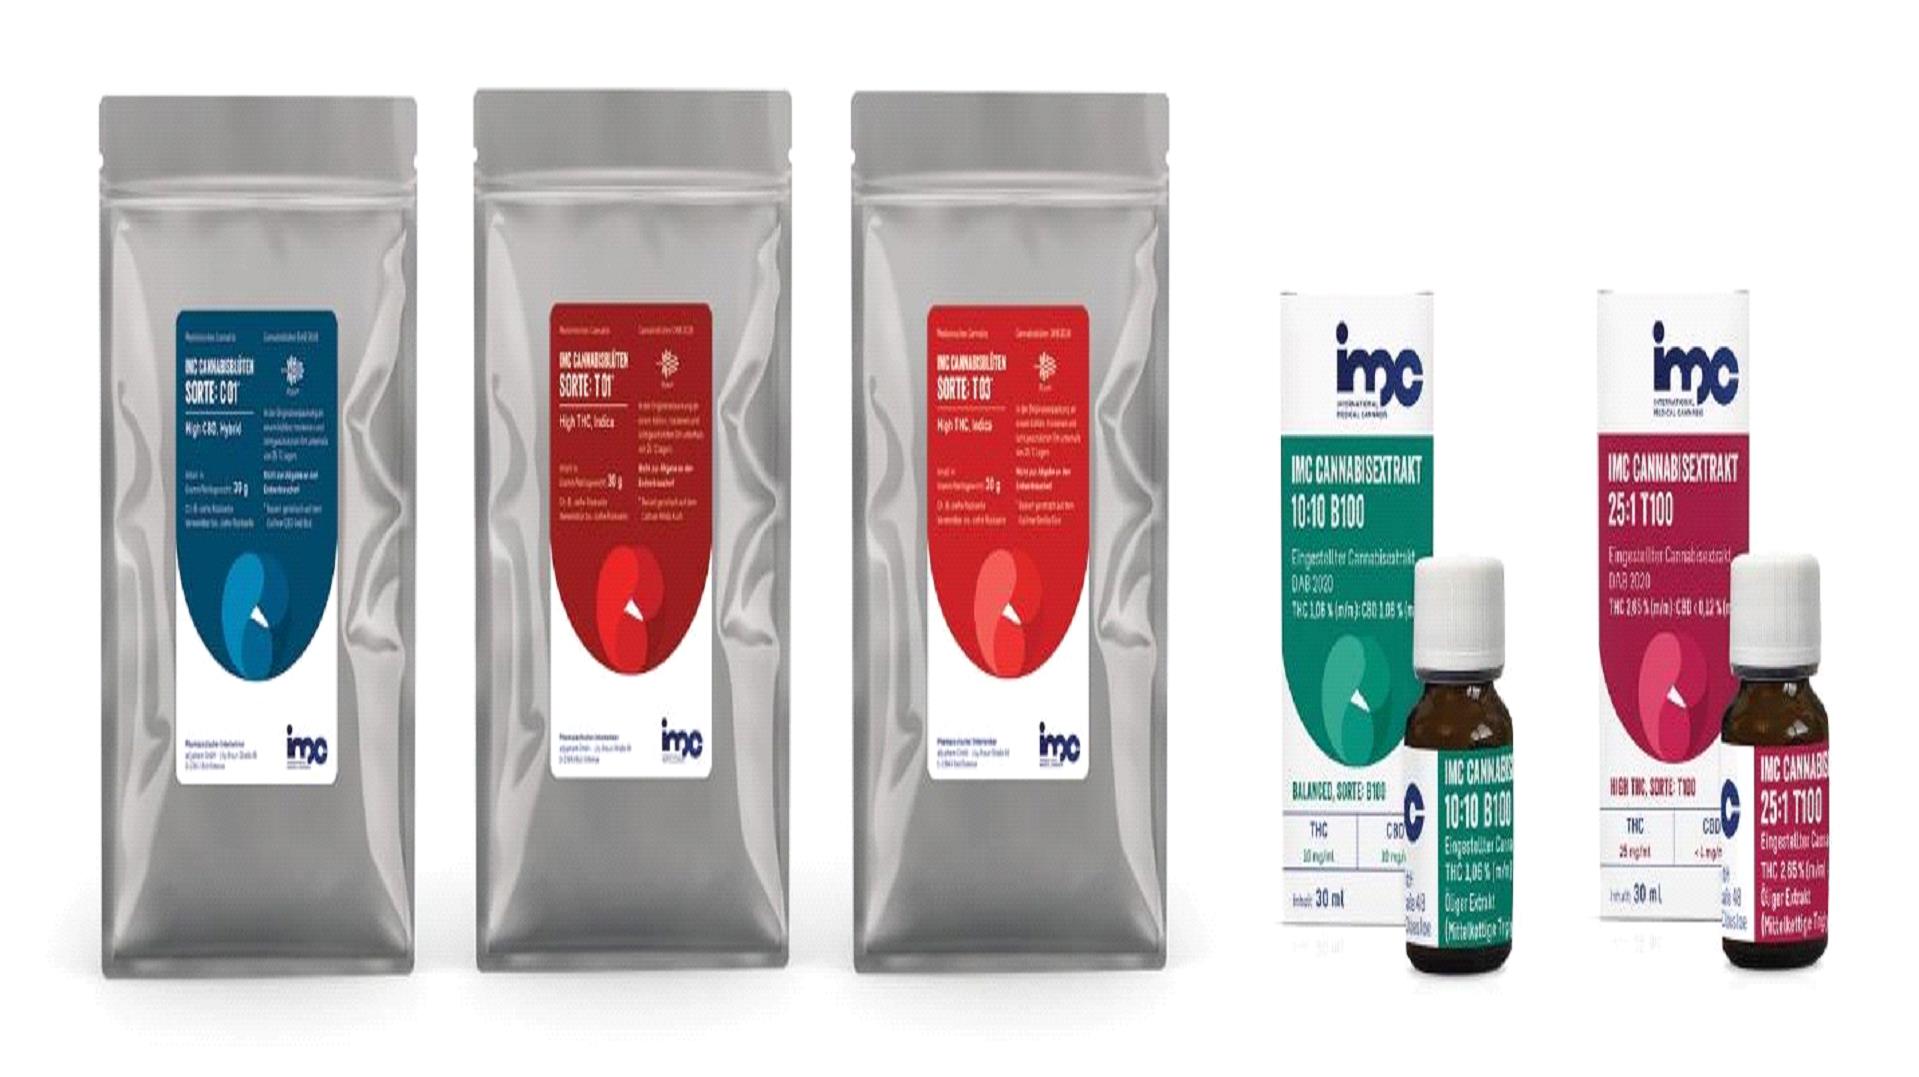
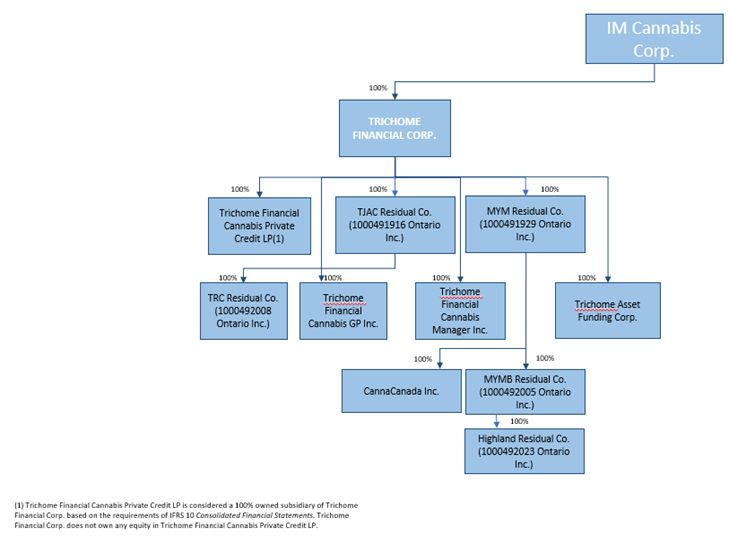
|
For the nine months
ended September 30, |
For the three months
ended September 30,
|
For the Year ended December 31,
|
||||||||||||||||||
|
2023(1)
|
2022*
|
2023
|
2022*
|
2022*
|
||||||||||||||||
|
Net Revenues
|
$
|
38,106
|
$
|
39,874
|
$
|
12,370
|
$
|
14,170
|
$
|
54,335
|
||||||||||
|
Gross profit before fair value impacts in cost of sales
|
$
|
9,715
|
$
|
8,500
|
$
|
2,738
|
$
|
2,819
|
$
|
11,291
|
||||||||||
|
Gross margin before fair value impacts in cost of sales (%)
|
25
|
%
|
21
|
%
|
22
|
%
|
20
|
%
|
21
|
%
|
||||||||||
|
Operating Loss
|
$
|
(7,627
|
)
|
$
|
(20,082
|
)
|
$
|
(2,259
|
)
|
$
|
(5,526
|
)
|
$
|
(30,791
|
)
|
|||||
|
Loss
|
$
|
(6,708
|
)
|
$
|
(15,271
|
)
|
$
|
(2,136
|
)
|
$
|
(4,532
|
)
|
$
|
(24,922
|
)
|
|||||
|
Loss per share attributable to equity holders of the Company – Basic (in CAD)
|
$
|
(0.49
|
)
|
$
|
(0.19
|
)
|
$
|
(0.16
|
)
|
$
|
(0.06
|
)
|
$
|
(3.13
|
)
|
|||||
|
Loss per share attributable to equity holders of the Company - Diluted (in CAD)
|
$
|
(0.49
|
)
|
$
|
(0.26
|
) |
$
|
(0.16
|
)
|
$
|
(0.06
|
)
|
$
|
(3.81
|
)
|
|||||
|
For the Nine Months
Ended September 30,
|
For the Three months
ended September 30,
|
For the Year ended December 31,
|
||||||||||||||||||
|
2023
|
2022*
|
2023
|
2022*
|
2022*
|
||||||||||||||||
|
Average net selling price of dried flower (per Gram)
|
$
|
5.34
|
$
|
8.13
|
$
|
4.35
|
$
|
9.08
|
$
|
7.12
|
||||||||||
|
Quantity of dried flower sold (in Kilograms)
|
6,528
|
4,460
|
2,558
|
1,453
|
6,794
|
|||||||||||||||
|
Israel
|
Germany
|
Adjustments
|
Total
|
|||||||||||||||||||||||||||||
|
2023(*)
|
2022
|
2023(*)
|
2022
|
2023(*)
|
2022
|
2023(*)
|
2022
|
|||||||||||||||||||||||||
|
Revenues
|
$
|
33,941
|
$
|
37,364
|
$
|
4,165
|
$
|
2,510
|
$
|
-
|
$
|
-
|
$
|
38,106
|
$
|
39,874
|
||||||||||||||||
|
Segment loss
|
$
|
(2,974
|
)
|
$
|
(13,325
|
)
|
$
|
(1,035
|
)
|
$
|
(2,708
|
)
|
$
|
-
|
$
|
-
|
$
|
(4,009
|
)
|
$
|
(16,033
|
)
|
||||||||||
|
Unallocated corporate expenses
|
$
|
-
|
$
|
-
|
$
|
-
|
$
|
-
|
$
|
(3,618
|
)
|
$
|
(4,049
|
)
|
$
|
(3,618
|
)
|
$
|
(4,049
|
)
|
||||||||||||
|
Total operating (loss)
|
$
|
(2,974
|
)
|
$
|
(13,325
|
)
|
$
|
(1,035
|
)
|
$
|
(2,708
|
)
|
$
|
(3,618
|
)
|
$
|
(4,049
|
)
|
$
|
(7,627
|
)
|
$
|
(20,082
|
)
|
||||||||
|
Income (loss) before tax
|
$
|
(6,131
|
)
|
$
|
(15,427
|
)
|
$
|
(1,537
|
)
|
$
|
(3,074
|
)
|
$
|
910
|
$
|
2,201
|
$
|
(6,758
|
)
|
$
|
(16,300
|
)
|
||||||||||
|
Depreciation, amortization
|
$
|
2,139
|
$
|
1,821
|
$
|
126
|
$
|
121
|
$
|
-
|
$
|
-
|
$
|
2,265
|
$
|
1,942
|
||||||||||||||||
| ● |
Revenues for the nine months ended September 30, 2023 and 2022 were $38,106 and $39,874, respectively, representing a decrease of $1,768 or 4%. Revenues for the three months ended September 30, 2023 and 2022 were $12,370 and $14,170,
respectively, representing a decrease of $1,800 or 13%. The decrease in revenues is attributed mainly to dollar rate increase and to the increase in the quantity of medical cannabis products sold, off set by lower average selling price per
gram due to high competition.
|
| ● |
Revenues from the Israeli operation were attributed to the sale of medical cannabis through the Company’s agreement with Focus Medical and the revenues from the Israeli Pharmacies the Company owns, mostly from cannabis products.
|
| ● |
In Germany, Company revenues were attributed to the sale of medical cannabis through Adjupharm.
|
| ● |
Total dried flower sold for the nine months ended September 30, 2023, was 6,528kg at an average selling price of $5.34 per gram compared to 4,460kg for the same period in 2022 at an average selling price of $8.13 per gram, mainly
attributable to the higher average selling price per gram the Company recognized through selling premium cannabis products. Total dried flower sold for the three months ended September 30, 2023, was 2,558kg at an average selling price of
$4.35 per gram compared to 1,453kg for the same period in 2022 at an average selling price of $9.08 per gram.
|
|
Less than one year
|
1 to 5 years
|
6 to 10 years
|
> 10 years
|
|||||||||||||
|
Contractual Obligations
|
$
|
10,603
|
$
|
1,194
|
$
|
-
|
$
|
-
|
||||||||
|
Payments Due by Period
|
||||||||||||||||||||
|
Contractual Obligations
|
Total
|
Less than one year
|
1 to 3 years
|
4 to 5 years
|
After 5 years
|
|||||||||||||||
|
Debt
|
$
|
10,513
|
$
|
10,137
|
$
|
376
|
$
|
-
|
$
|
-
|
||||||||||
|
Finance Lease Obligations
|
$
|
1,284
|
$
|
466
|
$
|
695
|
$
|
123
|
$
|
-
|
||||||||||
|
Total Contractual Obligations
|
$
|
11,797
|
$
|
10,603
|
$
|
1,071
|
$
|
123
|
$
|
-
|
||||||||||
|
For the nine months
ended September 30,
|
For the three months
ended September 30,
|
For the Year ended December 31,
|
||||||||||||||||||
|
|
2023
|
2022
|
2023
|
2022
|
2022
|
|||||||||||||||
|
Net cash provided by (used in):
|
||||||||||||||||||||
|
Operating activities
|
$
|
(7,857
|
)
|
$
|
(9,361
|
)
|
$
|
3,174
|
$
|
(1,203
|
)
|
$
|
(12,340
|
)
|
||||||
|
Investing activities
|
$
|
(553
|
)
|
$
|
(213
|
)
|
$
|
-
|
$
|
(242
|
)
|
$
|
(793
|
)
|
||||||
|
Financing activities
|
$
|
9,454
|
$
|
3,943
|
$
|
(1,333
|
)
|
$
|
(445
|
)
|
$
|
6,612
|
||||||||
|
Effect of foreign exchange
|
$
|
(2,189
|
)
|
$
|
(1,879
|
)
|
$
|
(1,858
|
)
|
$
|
1,715
|
$
|
(2,168
|
)
|
||||||
|
Increase (Decrease) in cash
|
$
|
(1,145
|
)
|
$
|
(7,510
|
)
|
$
|
(17
|
)
|
$
|
(175
|
)
|
$
|
(8,689
|
)
|
|||||
|
For the year ended
|
December 31,
2022 |
December 31, 2021
|
December 31, 2020
|
|||||||||
|
Revenues
|
$
|
54,335
|
$
|
34,053
|
$
|
15,890
|
||||||
|
Net Loss
|
$
|
(24,922
|
)
|
$
|
(664
|
)
|
$
|
(28,734
|
)
|
|||
|
Basic net income (Loss) per share:
|
$
|
(3.13
|
)
|
$
|
0.02
|
$
|
(1.86
|
)
|
||||
|
Diluted net income (Loss) per share:
|
$
|
(3.81
|
)
|
$
|
(3.62
|
)
|
$
|
(1.86
|
)
|
|||
|
Total assets
|
$
|
60,676
|
$
|
129,066
|
$
|
38,116
|
||||||
|
Total non-current liabilities
|
$
|
3,060
|
$
|
21,354
|
$
|
19,237
|
||||||
|
For the three months ended
|
September 30, 2023
|
June 30, 2023
|
March 31, 2023 (1)
|
December 31, 2022
|
||||||||||||
|
Revenues
|
$
|
12,370
|
$
|
13,207
|
$
|
12,529
|
$
|
14,461
|
||||||||
|
Net Loss
|
$
|
(2,136
|
)
|
$
|
(3,706
|
)
|
$
|
(866
|
)
|
$
|
(9,651
|
)
|
||||
|
Basic net income (Loss) per share:
|
$
|
(0.16
|
)
|
$
|
(0.26
|
)
|
$
|
(0.05
|
)
|
$
|
(1.32
|
)
|
||||
|
Diluted net loss per share:
|
$
|
(0.16
|
)
|
$
|
(0.26
|
)
|
$
|
(0.05
|
)
|
$
|
(1.28
|
)
|
||||
|
For the three months ended
|
September 30, 2022
|
June 30, 2022
|
March 31, 2022
|
December 31, 2021
|
||||||||||||
|
Revenues
|
$
|
14,170
|
$
|
12,703
|
$
|
13,001
|
$
|
9,912
|
||||||||
|
Net income (Loss)
|
$
|
(4,532
|
)
|
$
|
(3,736
|
)
|
$
|
(7,081
|
)
|
$
|
(8,363
|
)
|
||||
|
Basic net income (Loss) per share:
|
$
|
(0.06
|
)
|
$
|
(0.27
|
)
|
$
|
(0.14
|
)
|
$
|
(0.19
|
)
|
||||
|
Diluted net income (Loss) per share:
|
$
|
(0.06
|
)
|
$
|
(0.30
|
)
|
$
|
(0.14
|
)
|
$
|
(0.19
|
)
|
||||
|
Nine months ended
|
September 30, 2023*
|
September 30, 2022
|
||||||
|
Net Revenue
|
$
|
38,106
|
$
|
39,874
|
||||
|
Cost of sales
|
$
|
28,391
|
$
|
31,374
|
||||
|
Gross profit before FV adjustments
|
$
|
9,715
|
$
|
8,500
|
||||
|
Gross margin before FV adjustments (Non-IFRS)
|
25
|
%
|
21
|
%
|
||||
|
Three months ended
|
September 30, 2023
|
September 30, 2022
|
||||||
|
Net Revenue
|
$
|
12,370
|
$
|
14,170
|
||||
|
Cost of sales
|
$
|
9,632
|
$
|
11,351
|
||||
|
Gross profit before FV adjustments
|
$
|
2,738
|
$
|
2,819
|
||||
|
Gross margin before FV adjustments (Non-IFRS)
|
22
|
%
|
20
|
%
|
||||
|
For the Nine Months
ended September 30,
|
For the Three Months
ended September 30,
|
For the Year ended December 31,
|
||||||||||||||||||
|
2023*
|
2022
|
2023
|
2022
|
2022
|
||||||||||||||||
|
Operating Loss
|
$
|
(7,627
|
)
|
$
|
(20,082
|
)
|
$
|
(2,259
|
)
|
$
|
(5,526
|
)
|
$
|
(30,791
|
)
|
|||||
|
Depreciation & Amortization
|
$
|
2,265
|
$
|
1,942
|
$
|
678
|
$
|
626
|
$
|
2,815
|
||||||||||
|
EBITDA
|
$
|
(5,362
|
)
|
$
|
(18,140
|
)
|
$
|
(1,581
|
)
|
$
|
(4,900
|
)
|
$
|
(27,976
|
)
|
|||||
|
IFRS Biological assets fair value adjustments, net 1
|
$
|
710
|
$
|
1,941
|
$
|
93
|
$
|
866
|
$
|
2,129
|
||||||||||
|
Share-based payments
|
$
|
316
|
$
|
2,209
|
$
|
195
|
$
|
367
|
$
|
2,637
|
||||||||||
|
Restructuring cost 2
|
$
|
617
|
$
|
4,383
|
$
|
-
|
$
|
-
|
$
|
4,383
|
||||||||||
|
Other non-recurring costs 3
|
$
|
-
|
$
|
-
|
$
|
-
|
$
|
-
|
$
|
7,336
|
||||||||||
|
Adjusted EBITDA (Non-IFRS)
|
$
|
(3,719
|
)
|
$
|
(9,607
|
)
|
$
|
(1,293
|
)
|
$
|
(3,667
|
)
|
$
|
(11,491
|
)
|
|||||
| 1. |
Losses from unrealized changes in fair value of biological assets and realized fair value adjustments on inventory. See “Cost of Revenues” section of the MD&A.
|
| 2. |
Costs attributable to the Israel Restructuring and closure of Sdei Avraham Farm in 2022, and to Israel reorganization plan of the company’s management and operations in 2023.
|
| 3. |
Mainly fair value adjustment of the Company’s purchase option to acquire a pharmacy. See ”Subsequent Events – Panaxia Transaction Update” of the 2022 MD&A.
|
|
Less than one year
|
1 to 5 years
|
6 to 10 years
|
>10 years
|
|||||||||||||
|
Lease liabilities
|
$
|
466
|
$
|
818
|
$
|
-
|
$
|
-
|
||||||||
|
Less than one year
|
1 to 5 years
|
6 to 10 years
|
>10 years
|
|||||||||||||
|
Lease liabilities
|
$
|
755
|
$
|
1,917
|
$
|
673
|
$
|
-
|
||||||||
| 1. |
that the contractual partner of the Company is not the defendant, Stroakmont & Atton is not the real purchaser rather a company named Uniclaro GmbH.
|
| 2. |
that the Company allegedly placed an order with Uniclaro GmbH for a total of 4.3 million Clongene COVID-19 tests, of which Uniclaro GmbH claims to have a payment claim against the Company for a partial delivery of 380,400 Clongene
COVID-19 tests in the total amount of EUR 941,897.20. Uniclaro GmbH has assigned this alleged claim against the Company to Stroakmont & Atton Trading GmbH, and Stroakmont & Atton Trading GmbH has precautionary declared a set-off
against the Company’s claim.
|
| • |
Under the Focus Agreement (as defined below), IMC Holdings retains an option with Messrs. Shuster and Gabay to re-acquire the sold interest in Focus Medical at its sole discretion and in accordance with Israeli cannabis regulations. See
“Legal and Regulatory – Restructuring” section of the MD&A.
|
| • |
The Company is a party to Indemnification Agreement with certain directors and officers of the Company and Trichome to cover certain tax liabilities, interest and penalties arising from the Trichome Transaction.
|
| • |
Oren Shuster, a director and officer of the Company (the “Participating Insider”) loaned an amount of NIS 500 thousands (approximately $170) to IMC Holdings. For further information please see
"SUBSEQUENT EVENTS – Short -Term Loan Agreement".
|
| a. |
Amendment to IAS 8, "Accounting Policies, Changes to Accounting Estimates and Errors":
|
| b. |
Amendment to IAS 12, "Income Taxes":
|
| c. |
Amendment to IAS 1, "Disclosure of Accounting Policies":
|
|
Financial Instruments Measured at Fair Value
|
Fair Value Method
|
|
|
Warrants liability1
|
Black & Scholes model (Level 3 category)
|
|
|
Investment in affiliates
|
Market comparable (Level 3 category)
|
|
|
Financial Instruments Measured at
Amortized Cost |
||
|
Cash and cash equivalents, trade receivables and other account receivables
|
Carrying amount (approximates fair value due to short-term nature)
|
|
|
Loans receivable
|
Amortized cost (effective interest method)
|
|
|
Trade payables, other accounts payable and accrued expenses
|
Carrying amount (approximates fair value due to short-term nature)
|
| 1. |
Finance expense (income) include fair value adjustment of warrants measured at fair value, for the nine months ended September 30, 2023 and 2022, amounted to $(4,547) and $(5,905), respectively.
|
|
Issue date
|
||||||||||||
|
May 2023
|
February 2023
|
May 2021
|
||||||||||
|
Expected volatility
|
97
|
%
|
104
|
%
|
97
|
%
|
||||||
|
Share price (Canadian Dollar)
|
0.97
|
0.97
|
0.97
|
|||||||||
|
Expected life (in years)
|
2.589
|
2.342
|
2.589
|
|||||||||
|
Risk-free interest rate
|
3.62
|
%
|
3.70
|
%
|
3.62
|
%
|
||||||
|
Expected dividend yield
|
0
|
%
|
0
|
%
|
0
|
%
|
||||||
|
Fair value:
|
||||||||||||
|
Per Warrant (Canadian Dollar)
|
$
|
0.408
|
$
|
0.418
|
$
|
0.129
|
||||||
|
Total Warrants (Canadian Dollar in thousands)
|
$
|
201
|
$
|
2,208
|
$
|
38
|
||||||
| ● |
maintenance of records in reasonable detail, that accurately and fairly reflect the transactions and dispositions of assets;
|
| ● |
reasonable assurance that transactions are recorded as necessary to permit preparation of financial statements in accordance with applicable IFRS;
|
| ● |
receipts and expenditures are only being made in accordance with authorizations of management or the Board; and
|
| ● |
reasonable assurance regarding prevention or timely detection of unauthorized acquisition, use or disposition of the Company’s assets that could have a material effect on the financial instruments.
|
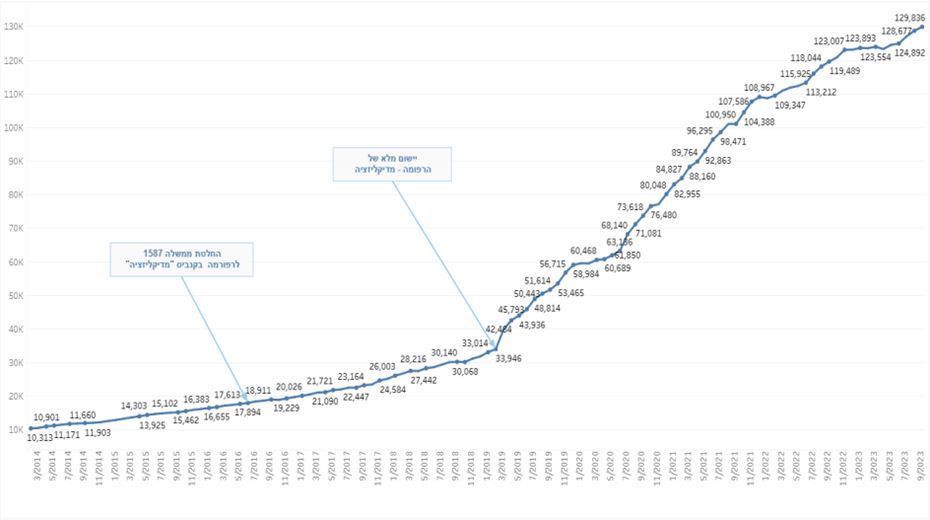
| • |
Cannabi-s flos (3028),
|
| • |
Cannabis extractum siccum (3068),
|
| • |
Cannabis extractum spissum (3069).
|
| (a) |
the Company receiving economic benefits from Focus Medical (and the terms of the contractual agreements between the Company and Focus Medical cannot be changed without the approval of the Company);
|
| (b) |
the Company having the option to purchase the divested 74% interest in Focus Medical held by Oren Shuster, the CEO, director and a promoter of the Company, and Rafael Gabay, a former director and a promoter of the Company;
|
| (c) |
Messrs. Shuster and Gabay each being a director of Focus Medical (while Mr. Shuster concurrently being a CEO, director and substantial shareholder of the Company and Mr. Gabay concurrently being a substantial shareholder of the Company);
and
|
| (d) |
the Company providing management and support activities to Focus Medical through a services agreement.
|
| ● |
the Company’s business objectives and milestones and the anticipated timing of execution;
|
| ● |
the performance of the Company’s business, strategies and operations;
|
| ● |
the intention to expand the business, operations and potential activities of the Company;
|
| ● |
geographic diversification and brand recognition;
|
| ● |
preparations to target, upon legalization, new cannabis markets;
|
| ● |
expectations relating to the number of patients in Israel licensed by the MOH to consume medical cannabis;
|
| ● |
the future impact of the acquisitions of the Israeli Pharmacies and the Panaxia Transaction;
|
| ● |
the expansion of its Israeli sales channels, distribution, delivery and storage capacity, and reach to medical cannabis patients;
|
| ● |
the future product portfolios of the Group and the Company’s ability to export its products, strains and genetics to Israel and Germany;
|
| ● |
the opportunity and ability to expand in Germany and export to new, legal adult-use recreational cannabis markets in Europe;
|
| ● |
the competitive conditions of the cannabis industry and the growth of medical or adult-use recreational cannabis markets in the jurisdictions in which the Company operates;
|
| ● |
The future impact of the Regulations Amendment regarding the transition reform from licenses to prescriptions for medical treatment of cannabis;
|
| ● |
the growth of the Company’s brands in the respective jurisdictions;
|
| ● |
the Company’s retail presence, distribution capabilities and data-driven insights;
|
| ● |
the competitive conditions of the industry, including the Company’s ability to maintain or grow its market share;
|
| ● |
cannabis licensing in the jurisdictions in which the Company operates;
|
| ● |
the anticipated decriminalization or legalization of adult-use recreational cannabis in Israel and Germany;
|
| ● |
expectations regarding the renewal and/or extension of the Group’s licenses;
|
| ● |
the Group’s anticipated operating cash requirements and future financing needs;
|
| ● |
the Group’s expectations regarding its revenue, expenses, profit margins and operations;
|
| ● |
the anticipated Gross Margins, EBITDA and Adjusted EBITDA from the Company’s operations;
|
| ● |
the expected increase in revenue and margins in its Israeli medical cannabis market activities arising from its acquisitions
|
| ● |
statements relating to the Company exiting the Canadian cannabis market to focus Israel, Germany and Europe;
|
| ● |
the Company’s ability to achieve profitability in 2023;
|
| ● |
the continued listing of the Company’s Common Shares on the Nasdaq;
|
| ● |
expectations related to demand and momentum in the Company’s Israeli operations;
|
| ● |
the results of the restructuring of the Trichome Group under CCAA;
|
| ● |
cost savings from restructurings;
|
| ● |
future opportunities for the Company in Israel, particularly in the retail and distribution segments of the cannabis market;
|
| ● |
future expansion and growth opportunities for the Company in Germany and Europe and the timing of such;
|
| ● |
the Group’s reliance on third party suppliers and partners and its ability to enter into additional supply agreements to provide sufficient quantities of medical cannabis to fulfil the Group’s obligations; and
|
| ● |
contractual obligations and commitments.
|
| ● |
the anticipated increase in demand for medical and adult-use recreational cannabis in the markets in which the Company operates;
|
| ● |
the Company’s satisfaction of international demand for its products;
|
| ● |
the Company’s ability to implement its growth strategies and leverage synergies of acquisitions;
|
| ● |
the Company’s ability to reach patients through e-commerce and brick and mortar retail;
|
| ● |
the development and introduction of new products;
|
| ● |
the ability to import and the supply of premium and indoor grown cannabis products from third- party suppliers and partners;
|
| ● |
the changes and trends in the cannabis industry;
|
| ● |
the Company’s ability to maintain and renew or obtain required licenses, permits or authorization related to its domestic and international operations;
|
| ● |
the Company’s ability to rely on the export of, creation and maintenance of and maintain a consistent supply of imported cannabis from suppliers and partners;
|
| ● |
the ability to maintain cost-efficiencies and network of suppliers to maintain purchasing capabilities;
|
| ● |
the effectiveness of its products for medical cannabis patients and adult-use recreational consumers;
|
| ● |
future cannabis pricing and input costs;
|
| ● |
cannabis production yields;
|
| ● |
the Company being able to continue to drive growth from suppliers and partners into Israel, Germany and Europe; and
|
| ● |
the Company’s ability to market its brands and services in Israel, Germany and Europe successfully to its anticipated customers.
|
| ● |
general business risk and liability, including claims or complaints in the normal course of business;
|
| ● |
any failure of the Company to maintain “de facto” control over Focus Medical in accordance with IFRS 10;
|
| ● |
regulatory authorities in Israel viewing the Company as the deemed owner of more than 5% of Focus Medical or licensed entities in contravention of Israeli regulations;
|
| ● |
limitations on stockholdings of the Company in connection with its direct engagement in the Israeli medical cannabis market;
|
| ● |
the ability and/or need to obtain additional financing for continuing operations;
|
| ● |
the lack of control over the Company’s investees;
|
| ● |
the risk of defaulting on existing debt;
|
| ● |
the Company’s ability to continue as a going concern;
|
| ● |
the ability of the Company to access future financing if needed or on terms acceptable to the Company;
|
| ● |
the failure of the Company to comply with applicable regulatory requirements in a highly regulated industry;
|
| ● |
unexpected changes in governmental policies and regulations affecting the production, distribution, manufacture or use of medial cannabis in any jurisdictions in which the Company currently operates or intends to operate;
|
| ● |
the Company’s ability to continue to meet the listing requirements of the CSE and the NASDAQ;
|
| ● |
the Israeli government deciding to abandon the decriminalization or legalization of adult-use recreational cannabis;
|
| ● |
any change in the political environment which would negatively affect the prospect of decriminalization or legalization of adult-use recreational cannabis in Israel;
|
| ● |
any unexpected failure of Focus Medical to maintain in good standing or renew its licenses;
|
| ● |
any adverse outcome of the Construction Proceedings;
|
| ● |
any unexpected failure of Adjupharm to maintain in good standing or renew any of its Adjupharm Licenses;
|
| ● |
the Group’s ability to maintain ancillary business licenses, permits and approvals required to operate effectively;
|
| ● |
the interpretation of Company’s acquisitions of companies or assets by tax authorities or regulatory bodies, including but not limited to the change of control of licensed entities;
|
| ● |
the ability of the Group to deliver on their sales commitments or growth objectives;
|
| ● |
the Group’s reliance on third-party supply agreements and its ability to enter into additional supply agreements to provide sufficient quantities of medical cannabis to fulfil the Group’s obligations;
|
| ● |
the Group’s possible exposure to liability, the perceived level of risk related thereto, and the anticipated results of any litigation or other similar disputes or legal proceedings involving the Group, including but not limited to the
Construction Proceedings and the class action proceedings described herein;
|
| ● |
the impact of increasing competition;
|
| ● |
any lack of merger and acquisition opportunities;
|
| ● |
inconsistent public opinion and perception regarding the use of cannabis;
|
| ● |
engaging in activities considered illegal under US federal law related to cannabis;
|
| ● |
political instability and conflict in the Middle East, Eastern Europe and Ukraine;
|
| ● |
2023 Israel–Hamas war;
|
| ● |
adverse market conditions;
|
| ● |
unexpected disruptions to the operations and businesses of the Group as a result of the COVID-19 global pandemic or other disease outbreaks including a resurgence in the cases of COVID-19;
|
| ● |
the inherent uncertainty of production quantities, qualities and cost estimates and the potential for unexpected costs and expenses;
|
| ● |
the Group’s ability to sell its products;
|
| ● |
currency fluctuations;
|
| ● |
the risk of defaulting on existing debt;
|
| ● |
inflationary risks;
|
| ● |
any change in accounting practices or treatment affecting the consolidation of financial results;
|
| ● |
the costs of inputs;
|
| ● |
reliance on management; and
|
| ● |
the loss of key management and/or employees.
|
| 1. |
Review: I have reviewed the interim financial report and interim MD&A (together, the “interim filings”)
of IM Cannabis Corp. (the “issuer”) for the interim period ended September 30, 2023.
|
| 2. |
No misrepresentations: Based on my knowledge, having exercised reasonable diligence, the interim filings do not contain any
untrue statement of a material fact or omit to state a material fact required to be stated or that is necessary to make a statement not misleading in light of the circumstances under which it was made, with respect to the period covered by
the interim filings.
|
| 3. |
Fair presentation: Based on my knowledge, having exercised reasonable diligence, the interim financial report together
with the other financial information included in the interim filings fairly present in all material respects the financial condition, financial performance and cash flows of the issuer, as of the date of and for the periods presented in the
interim filings.
|
| 4. |
Responsibility: The issuer’s other certifying officer and I are responsible for establishing and maintaining disclosure controls and procedures (DC&P) and internal control over financial reporting (ICFR), as those
terms are defined in National Instrument 52-109 Certification of Disclosure in Issuers’ Annual and Interim Filings, for the issuer.
|
| 5. |
Design: Subject to the limitations, if any, described in paragraphs 5.2 and 5.3, the issuer’s other certifying officer and I have, as at the end of the period covered by the interim filings:
|
| (a) |
designed DC&P, or caused it to be designed under our supervision, to provide reasonable assurance that
|
| (i) |
material information relating to the issuer is made known to us by others, particularly during the period in which the interim filings are being prepared; and
|
| (ii) |
information required to be disclosed by the issuer in its annual filings, interim filings or other reports filed or submitted by it under securities legislation is recorded, processed, summarized and reported within the time periods
specified in securities legislation; and
|
| (b) |
designed ICFR, or caused it to be designed under our supervision, to provide reasonable assurance regarding the reliability of financial reporting and the preparation of financial statements for external purposes in accordance with the
issuer’s GAAP.
|
| 5.1 |
Control framework: The control framework the issuer’s other certifying officer(s) and I used to design the issuer’s ICFR is Internal Control – Integrated Framework (COSO Framework 2013) published by The Committee of
Sponsoring Organization of the Treadway Commission (COSO).
|
| 5.2 |
N/A
|
| (a) |
he fact that the issuer’s other certifying officer(s) and I have limited the scope of our design of DC&P and ICFR to exclude controls, policies and procedures of
|
| (i) |
N/A
|
| (ii) |
N/A
|
| (iii) |
N/A
|
| (b) |
summary financial information about the proportionately consolidated entity, special purpose entity or business that the issuer acquired that has been proportionately consolidated or consolidated in the issuer’s financial statements.
|
| 6. |
Reporting changes in ICFR: The issuer has disclosed in its interim MD&A any change in the issuer’s ICFR that occurred
during the period beginning on July 1, 2023 and ended on September 30, 2023 that has materially affected, or is reasonably likely to materially affect, the issuer’s ICFR.
|
|
”Itay Vago”
Itai Vago
Chief Financial Officer
|
|
| 1. |
Review: I have reviewed the interim financial report and interim MD&A (together, the “interim filings”)
of IM Cannabis Corp. (the “issuer”) for the interim period ended September 30, 2023.
|
| 2. |
No misrepresentations: Based on my knowledge, having exercised reasonable diligence, the interim filings do not contain any untrue statement of a material fact or omit to state a material fact required to be stated or that
is necessary to make a statement not misleading in light of the circumstances under which it was made, with respect to the period covered by the interim filings.
|
| 3. |
Fair presentation: Based on my knowledge, having exercised reasonable diligence, the interim financial report together
with the other financial information included in the interim filings fairly present in all material respects the financial condition, financial performance and cash flows of the issuer, as of the date of and for the periods presented in the
interim filings.
|
| 4. |
Responsibility: The issuer’s other certifying officer and I are responsible for establishing and maintaining disclosure controls and procedures (DC&P) and internal control over financial reporting (ICFR), as those
terms are defined in National Instrument 52-109 Certification of Disclosure in Issuers’ Annual and Interim Filings, for the issuer.
|
| 5. |
Design: Subject to the limitations, if any, described in paragraphs 5.2 and 5.3, the issuer’s other certifying officer and I have, as at the end of the period covered by the interim filings
|
| (a) |
designed DC&P, or caused it to be designed under our supervision, to provide reasonable assurance that
|
| (i) |
material information relating to the issuer is made known to us by others, particularly during the period in which the interim filings are being prepared; and
|
| (ii) |
information required to be disclosed by the issuer in its annual filings, interim filings or other reports filed or submitted by it under securities legislation is recorded, processed, summarized and reported within the time periods
specified in securities legislation; and
|
| (b) |
designed ICFR, or caused it to be designed under our supervision, to provide reasonable assurance regarding the reliability of financial reporting and the preparation of financial statements for external purposes in accordance with the
issuer’s GAAP.
|
| 5.1 |
Control framework: The control framework the issuer’s other certifying officer(s) and I used to design the issuer’s ICFR is Internal Control – Integrated Framework (COSO Framework 2013) published by The Committee of
Sponsoring Organization of the Treadway Commission (COSO).
|
| 5.2 |
N/A
|
| (a) |
the fact that the issuer’s other certifying officer(s) and I have limited the scope of our design of DC&P and ICFR to exclude controls, policies and procedures of
|
| (i) |
N/A
|
| (ii) |
N/A
|
| (iii) |
N/A
|
| (b) |
summary financial information about the proportionately consolidated entity, special purpose entity or business that the issuer acquired that has been proportionately consolidated or consolidated in the issuer’s financial statements
|
| 6. |
Reporting changes in ICFR: The issuer has disclosed in its interim MD&A any change in the issuer’s ICFR that occurred
during the period beginning on July 1, 2023 and ended on September 30, 2023 that has materially affected, or is reasonably likely to materially affect, the issuer’s ICFR.
|
|
Date: November 13, 2023
”Oren Shuster”
Oren Shuster
Chief Executive Officer
|
|
1 Year IM Cannabis Chart |
1 Month IM Cannabis Chart |

It looks like you are not logged in. Click the button below to log in and keep track of your recent history.
Support: +44 (0) 203 8794 460 | support@advfn.com
By accessing the services available at ADVFN you are agreeing to be bound by ADVFN's Terms & Conditions
 Hot Features