ADVFN Logo ADVFN

We could not find any results for:
Make sure your spelling is correct or try broadening your search.

Trending Now

Toplists

It looks like you aren't logged in.
Click the button below to log in and view your recent history.

Hot Features

Registration Strip Icon for monitor Customisable watchlists with full streaming quotes from leading exchanges, such as LSE, NASDAQ, NYSE, AMEX, Bovespa, BIT and more.

HMNF HMN Financial Inc

26.40
-0.05 (-0.19%)
26 Jul 2024 - Closed
Delayed by 15 minutes
Share Name Share Symbol Market Type
HMN Financial Inc NASDAQ:HMNF NASDAQ Common Stock
  Price Change % Change Share Price Bid Price Offer Price High Price Low Price Open Price Shares Traded Last Trade
  -0.05 -0.19% 26.40 10.57 42.25 26.60 26.01 26.48 1,158 23:41:14

HMN Financial, Inc. Announces Second Quarter Results

22/07/2008 4:30am

Business Wire


HMN Financial (NASDAQ:HMNF)
Historical Stock Chart


From Jul 2019 to Jul 2024
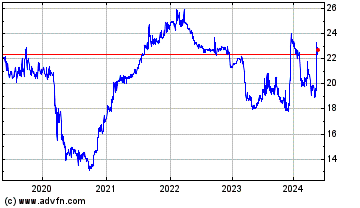
Click Here for more HMN Financial Charts.
HMN Financial, Inc. (NASDAQ:HMNF): Earnings (Loss) Summary         Three months ended Six months ended June 30, June 30, (in thousands) 2008  2007  2008  2007  Net income (loss) $ (2,025 ) 2,450 $ (537 ) 5,718 Diluted earnings (loss) per share (0.56 ) 0.62 (0.15 ) 1.45 Return on average assets (0.75 ) % 0.89 % (0.10 ) % 1.08 % Return on average equity (8.27 ) % 10.09 % (1.10 ) % 11.92 % Book value per share $ 22.81 $ 22.15 $ 22.81 $ 22.15 HMN Financial, Inc. (HMN or the Company) (NASDAQ:HMNF), the $1.1 billion holding company for Home Federal Savings Bank (the Bank), today reported a net loss of $2.0 million for the second quarter of 2008, down $4.5 million, or 182.7%, from net income of $2.5 million for the second quarter of 2007. Diluted loss per common share for the second quarter of 2008 was ($0.56), down $1.18, or 190.3%, from diluted earnings per share of $0.62 for the second quarter of 2007. The decrease for the quarter is primarily the result of a $3.8 million non-cash goodwill impairment charge that was recorded during the quarter. Net income was also adversely affected by a $1.7 million decrease in net interest income in the second quarter of 2008 when compared to the same period of 2007. The goodwill impairment charge, which was required by generally accepted accounting principles as a result of HMN’s stock trading at a discount to book value, has no impact on the Company’s liquidity, cash flows or regulatory capital. Excluding the one time charge for the impairment of goodwill, net operating earnings were $1.8 million, or $0.47 per diluted share for the second quarter of 2008 and $3.3 million, or $0.87 per diluted share for the first six months of 2008. The following table reconciles our determination of operating earnings to our net loss as prepared in accordance with generally accepted accounting principles:   Three Months Ended   Six Months Ended June 30, 2008 June 30, 2008 (dollars in thousands, except per share data) Amount   Diluted pershare Amount   Diluted pershare Reported loss $ (2,025 ) (0.56 ) $ (537 ) (0.15 ) Goodwill impairment 3,801   1.03   3,801   1.02   Operating earnings $ 1,776   0.47   $ 3,264   0.87   The Company is providing operating earnings in addition to reported results prepared in accordance with generally accepted accounting principles in order to provide users of the financial information a clearer indication of the results of the Company’s core business. Second Quarter Results Net Interest Income Net interest income was $8.2 million for the second quarter of 2008, a decrease of $1.7 million, or 17.0%, compared to $9.9 million for the second quarter of 2007. Interest income was $16.3 million for the second quarter of 2008, a decrease of $3.3 million, or 17.2%, from $19.6 million for the same period in 2007. Interest income decreased primarily because of a decrease in the average yields earned on loans and investments. Interest yields decreased primarily because of the 325 basis point decrease in the prime interest rate between the periods. Decreases in the prime rate, which is the rate that banks charge their prime business customers, generally decrease the rates on adjustable rate consumer and commercial loans in the portfolio and on new loans originated. The average yield earned on interest-earning assets was 6.26% for the second quarter of 2008, a decrease of 121 basis points from the 7.47% average yield for the second quarter of 2007. Interest expense was $8.1 million for the second quarter of 2008, a decrease of $1.7 million, or 17.3%, compared to $9.8 million for the second quarter of 2007. Interest expense decreased primarily because of the lower interest rates paid on money market accounts and certificates of deposits. The decreased rates were the result of the 325 basis point decrease in the federal funds rate that occurred between the periods. Decreases in the federal funds rate, which is the rate that banks charge other banks for short term loans, generally have a lagging effect and decrease the rates banks pay for deposits. The lagging effect of deposit rate changes is because many of the Bank’s deposits are in the form of certificates of deposit which do not re-price immediately when the federal funds rate changes. The average interest rate paid on interest-bearing liabilities was 3.33% for the second quarter of 2008, a decrease of 61 basis points from the 3.94% average interest rate paid in the second quarter of 2007. Net interest margin (net interest income divided by average interest earning assets) for the second quarter of 2008 was 3.15%, a decrease of 60 basis points, compared to 3.75% for the second quarter of 2007. Provision for Loan Losses The provision for loan losses was $1.1 million for the second quarter of 2008, an increase of $102,000, or 9.9%, from $1.0 million for the second quarter of 2007. The provision for loan losses increased primarily because of an increase in the allowance required for risk rated commercial real estate loans in the second quarter of 2008 when compared to the same period of 2007. The increase was due primarily to decreases in the estimated value of the real estate collateral supporting the $24.8 million in residential development loans classified as non-performing at June 30, 2008. Total non-performing assets were $48.5 million at June 30, 2008, an increase of $20.3 million, from $28.2 million at March 31, 2008. Non-performing loans increased $20.2 million and foreclosed and repossessed assets increased $88,000 during the period. The non-performing loan activity for the quarter was as follows: classified $23.4 million in loans as non-accruing, received $273,000 in principal payments on non-accruing loans, reclassified $2.3 million in loans as accruing, transferred $409,000 to real estate owned, and charged off $219,000. The increase in non-performing loans during the quarter relates primarily to three residential development loans totaling $13.7 million and one loan secured by a hotel property for $5.0 million that were classified due to lack of performance. The largest of these loans was for $9.1 million and is secured by a residential development located in the Minneapolis/St. Paul metro market. The estimated values of the underlying collateral supporting the residential development loans were determined based on third party appraisals and specific reserves have been established, where required. The following table summarizes the amounts and categories of non-performing assets in the Bank’s portfolio and loan delinquency information as of the end of the three most recently completed quarters.                             June 30,   March 31,   December 31, (Dollars in thousands)     2008       2008       2007 Non-Accruing Loans: One-to-four family real estate $ 1,046 $ 802 $ 1,196 Commercial real estate 39,221 17,983 15,641 Consumer 1,439 1,380 1,094 Commercial business 2,500 3,830 1,723 Total 44,206 23,995 19,654   Other assets 25 34 34 Foreclosed and Repossessed Assets: One-to-four family real estate 2,731 2,852 901 Consumer 19 19 33 Commercial real estate 1,541 1,332 1,313 Total non-performing assets $ 48,522 $ 28,232 $ 21,935 Total as a percentage of total assets 4.49 % 2.56 % 1.96 % Total non-performing loans $ 44,206 $ 23,995 $ 19,654 Total as a percentage of total loans receivable, net 4.94 % 2.73 % 2.27 % Allowance for loan loss to non-performing loans 33.76 % 57.98 % 63.28 %   Delinquency Data: Delinquencies (1) 30+ days $ 2,491 $ 8,203 $ 6,416 90+ days 0 55 0 Delinquencies as a percentage of loan and lease portfolio (1) 30+ days 0.27 % 0.92 % 0.73 % 90+ days 0.00 % 0.01 % 0.00 %                           (1) Excludes non-accrual loans. Non-Interest Income and Expense Non-interest income was $1.8 million for the second quarter of 2008, an increase of $464,000, or 35.9%, from $1.3 million for the same period in 2007. Other non-interest income increased $233,000 primarily because of increased gains recognized on the sale of repossessed and foreclosed assets. Fees and services charges increased $217,000 between the periods primarily because of increased overdraft and debit card fees. Gain on sales of loans increased $39,000 between the periods due primarily to a $31,000 increase in the gains recognized on the sale of government guaranteed commercial loans between the periods. Loan servicing fees decreased $25,000 between the periods because there were fewer mortgage loans being serviced. Non-interest expense was $9.8 million for the second quarter of 2008, an increase of $3.7 million, or 59.4%, from $6.1 million for the same period of 2007. A goodwill impairment charge of $3.8 million was recorded in the second quarter of 2008 as goodwill related to a 1997 acquisition was deemed to be impaired and fully written off due to the trading of the Company’s common stock at a discount to book value. Other non-interest expense increased $150,000 primarily because of increased Federal Deposit Insurance Corporation (FDIC) insurance costs and legal fees primarily related to an ongoing state tax assessment challenge. Data processing costs increased $15,000 due to increases in the internet and other banking services provided by the Bank’s third party processor between the periods. Compensation expense decreased $226,000 between the periods primarily because of decreased employee incentive accruals and pension costs. Advertising expense decreased $103,000 between the periods primarily due to a decrease in event sponsorships and less general advertising. Mortgage servicing rights amortization decreased $35,000 between the periods because there were fewer mortgage loans being serviced. Income tax expense decreased $494,000 between the periods due to a decrease in taxable income and an effective tax rate that decreased from 38.3% for the second quarter of 2007 to 36.6% for the second quarter of 2008 excluding the goodwill impairment charge. The goodwill impairment charge recorded in the second quarter of 2008 is not tax deductible and therefore no tax benefit was realized related to the impairment charge. The decrease in the effective tax rate was primarily the result of decreased pre-tax income and a higher percentage of tax exempt income. Return on Assets and Equity Return on average assets for the second quarter of 2008 was (0.75%), compared to 0.89% for the second quarter of 2007. Return on average equity was (8.27%) for the second quarter of 2008, compared to 10.09% for the same period in 2007. Book value per common share at June 30, 2008 was $22.81, compared to $22.15 at June 30, 2007. Six Month Period Results Net Income (Loss) The net loss was $537,000 for the six month period ended June 30, 2008, a decrease of $6.3 million, or 109.4 %, from $5.7 million in net income for the six month period ended June 30, 2007. Diluted loss per share for the six month period in 2008 was ($0.15), down $1.60, or 110.3%, from $1.45 of diluted earnings per share for the same period in 2007. The decrease in net income for the six month period is primarily the result of a $3.8 million non-cash goodwill impairment charge that was recorded in the second quarter of 2008. Net income was also adversely affected by a $2.8 million decrease in net interest income in the first six months of 2008 when compared to the same period of 2007. Net Interest Income Net interest income was $16.9 million for the first six months of 2008, a decrease of $2.7 million, or 14.2 %, from $19.6 million for the same period in 2007. Interest income was $34.0 million for the six month period ended June 30, 2008, a decrease of $3.9 million, or 10.2%, from $37.9 million for the same six month period in 2007. Interest income decreased primarily because of the 325 basis point decrease in the prime interest rate between the periods. Decreases in the prime rate generally decrease the rates on adjustable rate consumer and commercial loans in the portfolio and on new loans originated. The average yield earned on interest-earning assets was 6.49% for the first six months of 2008, a decrease of 99 basis points from the 7.48% average yield for the first six months of 2007. Interest expense was $17.2 million for the first six months of 2008, a decrease of $1.1 million, or 5.9%, compared to $18.3 million for the first six months of 2007. Interest expense decreased primarily because of the lower interest rates paid on money market accounts and certificates of deposits. The decreased rates were the result of the 325 basis point decrease in the federal funds rate that occurred between the periods. Decreases in the federal funds rate generally have a lagging effect and decrease the rates banks pay for deposits. The lagging effect of deposit rate changes is because many of the Bank’s deposits are in the form of certificates of deposit which do not re-price immediately when the federal funds rate changes. The average interest rate paid on interest-bearing liabilities was 3.52 % for the first six months of 2008, a decrease of 30 basis points from the 3.82% average interest rate paid in the first six months of 2007. Net interest margin (net interest income divided by average interest earning assets) for the first six months of 2008 was 3.21%, a decrease of 67 basis points, compared to 3.88% for the first six months of 2007. Provision for Loan Losses The provision for loan losses was $2.7 million for the first six months of 2008, an increase of $1.2 million, or 81.4%, from the $1.5 million for the same six month period in 2007. The provision for loan losses increased primarily because of an increase in the allowance required for risk rated commercial real estate loans in the first six months of 2008 when compared to the same period of 2007. The increase was due primarily to decreases in the estimated value of the real estate collateral supporting the $24.8 million in residential development loans classified as non-performing at June 30, 2008. Total non-performing assets were $48.5 million at June 30, 2008, an increase of $26.6 million, from $21.9 million at December 31, 2007. Non-performing loans increased $24.6 million and foreclosed and repossessed assets increased $2.0 million during the period. The non-performing loan activity for the first six months of 2008 was as follows: classified $30.4 million in loans as non-accruing, received $1.5 million in principal payments on non-accruing loans, reclassified $2.7 million in loans as accruing, transferred $1.3 million to real estate owned, and charged off $325,000. The increase in non-performing loans was primarily related to three residential development loans totaling $13.7 million, a loan on a commercial manufacturing facility for $5.0 million, and a loan on a hotel property for $5.0 million that were classified during the first six months of 2008 due to lack of performance. The estimated values of the underlying collateral supporting the residential development loans were determined based on third party appraisals and specific reserves have been established, where required. A reconciliation of the Company’s allowance for loan losses for the six month periods ended June 30, 2008 and June 30, 2007 is summarized as follows:               (in thousands) 2008 2007 Balance at January 1, $ 12,438 $ 9,873 Provision 2,690 1,483 Charge offs: Commercial (24 ) (17 ) Commercial real estate (75 ) (70 ) Mortgage loans (60 ) 0 Consumer loans (69 ) (632 ) Recoveries   24     88   Balance at June 30, $ 14,924   $ 10,725             Non-Interest Income and Expense Non-interest income was $3.3 million for the first six months of 2008, a decrease of $86,000, or 2.6%, from $3.4 million for the same period in 2007. Gain on sales of loans decreased $601,000 between the periods primarily because of the $706,000 decrease in the gain recognized on the sale of government guaranteed commercial loans between the periods that was partially offset by an $105,000 increase in the gain recognized on the sale of single family loans. Mortgage servicing fees decreased $54,000 because fewer loans were being serviced. Fees and service charges increased $314,000 between the periods primarily because of increased overdraft and debit card fees. Other non-interest income increased $255,000 primarily because of increased gains recognized on the sale of repossessed and foreclosed assets. Non-interest expense was $16.1 million for the first six months of 2008, an increase of $4.0 million, or 32.7%, from $12.1 million for the same period of 2007. A goodwill impairment charge of $3.8 million was recorded in the second quarter of 2008 as goodwill related to a 1997 acquisition was deemed to be impaired and fully written off due to the trading of the Company’s common stock at a discount to book value. Other non-interest expense increased $362,000 primarily because of increased FDIC insurance costs and legal fees primarily related to an ongoing state tax assessment challenge. Occupancy expense increased $97,000 due primarily to increased real estate taxes and costs associated with the Eagan branch that was opened in the third quarter of 2007. Data processing costs increased $62,000 due to increases in the internet and other banking services provided by the Bank’s third party processor between the periods. Compensation expense decreased $227,000 between the periods primarily because of decreased employee incentive accruals and pension costs. Advertising expense decreased $85,000 between the periods primarily due to a decrease in event sponsorships and less general advertising. Mortgage servicing rights amortization decreased $57,000 between the periods because there were fewer mortgage loans being serviced. Income tax expense decreased $1.8 million between the periods due to a decrease in taxable income and an effective tax rate that decreased from 39.3% for the first six months of 2007 to 37.1% for the first six months of 2008 excluding the goodwill impairment charge. The goodwill impairment charge recorded in the second quarter of 2008 is not tax deductible and therefore no tax benefit was realized related to the impairment charge. The decrease in the effective tax rate was primarily the result of decreased pre-tax income and a higher percentage of tax exempt income. Return on Assets and Equity Return on average assets for the six month period ended June 30, 2008 was (0.10%), compared to 1.08% for the same period in 2007. Return on average equity was (1.10%) for the six month period ended in 2008, compared to 11.92% for the same period in 2007. President’s Statement “The Company was operationally profitable for the first six months of 2008 without the goodwill impairment charge related to a 1997 acquisition,” said HMN President, Mike McNeil. “While we are disappointed in the second quarter results and the level of nonperforming assets, our capital position remains strong and we look forward to improved results.” General Information HMN Financial, Inc. and Home Federal Savings Bank are headquartered in Rochester, Minnesota. The Bank operates ten full service offices in southern Minnesota located in Albert Lea, Austin, Eagan, LaCrescent, Rochester, Spring Valley and Winona, and two full service offices in Iowa located in Marshalltown and Toledo. Home Federal Savings Bank also operates a loan origination office in Sartell, Minnesota. Home Federal Private Banking operates branches in Edina and Rochester, Minnesota. Safe Harbor Statement This press release may contain forward-looking statements within the meaning of the Private Securities Litigation Reform Act of 1995. These statements include, but are not limited to those relating to economic and business trends, loan loss reserves and the Company’s financial expectations for earnings and interest income. A number of factors could cause actual results to differ materially from the Company’s assumptions and expectations. These include but are not limited to possible legislative changes and adverse economic, business and competitive developments such as shrinking interest margins; reduced collateral values; deposit outflows; reduced demand for financial services and loan products; changes in accounting policies and guidelines, or monetary and fiscal policies of the federal government or tax laws; changes in credit or other risks posed by the Company’s loan and investment portfolios; technological, computer-related or operational difficulties; adverse changes in securities markets; results of litigation or other significant uncertainties. Additional factors that may cause actual results to differ from the Company’s assumptions and expectations include those set forth in the Company’s most recent filings on form 10-K and Form 10-Q with the Securities and Exchange Commission. All forward-looking statements are qualified by, and should be considered in conjunction with, such cautionary statements. HMN FINANCIAL, INC. AND SUBSIDIARIES Consolidated Balance Sheets                 June 30,   December 31, (dollars in thousands)     2008   2007 (unaudited) Assets Cash and cash equivalents $ 14,475 23,718 Securities available for sale: Mortgage-backed and related securities(amortized cost $17,063 and $18,786) 16,659 18,468 Other marketable securities(amortized cost $105,468 and $165,430) 107,167   167,720   123,826   186,188     Loans held for sale 3,699 3,261 Loans receivable, net 895,713 865,088 Accrued interest receivable 6,199 6,893 Real estate, net 4,272 2,214 Federal Home Loan Bank stock, at cost 7,460 6,198 Mortgage servicing rights, net 957 1,270 Premises and equipment, net 12,585 12,024 Goodwill 0 3,801 Prepaid expenses and other assets 1,981 1,680 Deferred tax asset 4,996   4,719   Total assets $ 1,076,163   1,117,054       Liabilities and Stockholders’ Equity Deposits $ 832,316 888,118 Federal Home Loan Bank advances 137,900 112,500 Accrued interest payable 6,607 9,515 Customer escrows 965 866 Accrued expenses and other liabilities 3,323   7,927   Total liabilities 981,111   1,018,926   Commitments and contingencies Stockholders’ equity: Serial preferred stock ($.01 par value): authorized 500,000 shares; issued and outstanding none 0 0 Common stock ($.01 par value): authorized 11,000,000; issued shares 9,128,662 91 91 Additional paid-in capital 57,820 58,049 Retained earnings, subject to certain restrictions 108,572 110,943 Accumulated other comprehensive income 766 1,167 Unearned employee stock ownership plan shares (3,867 ) (3,965 ) Treasury stock, at cost 4,960,863 and 4,953,045 shares (68,330 ) (68,157 ) Total stockholders’ equity 95,052   98,128   Total liabilities and stockholders’ equity $ 1,076,163   1,117,054                   HMN FINANCIAL, INC. AND SUBSIDIARIES Consolidated Statements of Income (Loss) (unaudited)               Three Months Ended   Six Months Ended June 30, June 30, (dollars in thousands, except per share data)     2008   2007   2008   2007 Interest income:     Loans receivable $ 14,419 16,629 29,939 32,374 Securities available for sale: Mortgage-backed and related 213 171 437 282 Other marketable 1,507 2,417 3,417 4,313 Cash equivalents 61 279 118 722 Other 53   132 133   216 Total interest income 16,253   19,628 34,044   37,907   Interest expense: Deposits 6,839 8,346 14,709 15,223 Federal Home Loan Bank advances 1,239   1,427 2,476   3,045 Total interest expense 8,078   9,773 17,185   18,268 Net interest income 8,175 9,855 16,859 19,639 Provision for loan losses 1,130   1,028 2,690   1,483 Net interest income after provision for loan losses 7,045   8,827 14,169   18,156   Non-interest income: Fees and service charges 998 781 1,791 1,477 Loan servicing fees 240 265 482 536 Gains on sales of loans 228 189 384 985 Other 290   57 617   362 Total non-interest income 1,756   1,292 3,274   3,360   Non-interest expense: Compensation and benefits 3,036 3,262 6,396 6,623 Occupancy 1,161 1,112 2,293 2,196 Advertising 92 195 216 301 Data processing 336 321 678 616 Amortization of mortgage servicing rights, net 154 189 314 371 Goodwill impairment charge 3,801 0 3,801 0 Other 1,220   1,070 2,354   1,992 Total non-interest expense 9,800   6,149 16,052   12,099 Income (loss) before income tax expense (999 ) 3,970 1,391 9,417 Income tax expense 1,026   1,520 1,928   3,699 Net income (loss) $ (2,025 ) 2,450 (537 ) 5,718 Basic earnings (loss) per share $ (0.56 ) 0.65 (0.15 ) 1.52 Diluted earnings (loss) per share $ (0.56 ) 0.62 (0.15 ) 1.45 HMN FINANCIAL, INC. AND SUBSIDIARIES Selected Consolidated Financial Information (unaudited)                                         Three Months Ended Six Months Ended SELECTED FINANCIAL DATA: June 30, June, 30 (dollars in thousands, except per share data)     2008     2007     2008   2007 I. OPERATING DATA: Interest income $ 16,253 19,628 34,044 37,907 Interest expense 8,078 9,773 17,185 18,268 Net interest income 8,175 9,855 16,859 19,639   II. AVERAGE BALANCES: Assets (1) 1,087,859 1,099,991 1,097,193 1,069,159 Loans receivable, net 882,977 818,905 877,632 803,506 Securities available for sale (1) 136,676 202,442 153,123 180,616 Interest-earning assets (1) 1,044,930 1,053,637 1,054,873 1,021,846 Interest-bearing liabilities 975,017 994,906 983,134 964,485 Equity (1) 98,499 97,390 98,658 96,751   III. PERFORMANCE RATIOS: (1) Return on average assets (annualized) (0.75 ) % 0.89 % (0.10 ) % 1.08 % Interest rate spread information: Average during period 2.92 3.53 2.98 3.66 End of period 3.32 3.45 3.32 3.45 Net interest margin 3.15 3.75 3.21 3.88 Ratio of operating expense to average total assets (annualized) 3.62 2.24 2.94 2.28 Return on average equity (annualized) (8.27 ) 10.09 (1.10 ) 11.92 Efficiency 98.69 55.17 79.73 52.61                     June 30, December 31, June 30,   2008     2007     2007 IV. ASSET QUALITY: Total non-performing assets $ 48,522 21,935 16,365 Non-performing assets to total assets 4.51 % 1.96 % 1.45 % Non-performing loans to total loans receivable, net 4.94 % 2.27 % 1.38 % Allowance for loan losses $ 14,924 12,438 10,725 Allowance for loan losses to total assets 1.39 % 1.11 % 0.95 % Allowance for loan losses to total loans receivable, net 1.67 1.44 1.27 Allowance for loan losses to non-performing loans 33.76 63.28 92.39   V. BOOK VALUE PER SHARE: Book value per share $ 22.81 23.50 22.15                       Six MonthsEndedJune 30,2008     Year EndedDec 31,2007     Six MonthsEndedJune 30,2007 VI. CAPITAL RATIOS: Stockholders’ equity to total assets, at end of period 8.83 % 8.78 % 8.40 % Average stockholders’ equity to average assets (1) 8.99 8.89 9.05 Ratio of average interest-earning assets to average interest-bearing liabilities (1) 107.30 106.33 105.95                     June 30, December 31, June 30,   2008     2007     2007 VII. EMPLOYEE DATA: Number of full time equivalent employees 204 203 210                               (1) Average balances were calculated based upon amortized cost without the market value impact of SFAS 115

1 Year HMN Financial Chart

1 Year HMN Financial Chart

1 Month HMN Financial Chart

1 Month HMN Financial Chart

Your Recent History

Delayed Upgrade Clock