ADVFN Logo ADVFN

We could not find any results for:
Make sure your spelling is correct or try broadening your search.

Trending Now

Toplists

It looks like you aren't logged in.
Click the button below to log in and view your recent history.

Hot Features

Registration Strip Icon for alerts Register for real-time alerts, custom portfolio, and market movers

CHCO City Holding Company

119.81
5.20 (4.54%)
Last Updated: 19:49:28
Delayed by 15 minutes
Share Name Share Symbol Market Type
City Holding Company NASDAQ:CHCO NASDAQ Common Stock
  Price Change % Change Share Price Bid Price Offer Price High Price Low Price Open Price Shares Traded Last Trade
  5.20 4.54% 119.81 119.80 120.10 119.99 114.3204 115.45 48,711 19:49:28

City Holding Company Announces Record Earnings

17/04/2007 10:44pm

PR Newswire (US)


City (NASDAQ:CHCO)
Historical Stock Chart


From Jul 2019 to Jul 2024
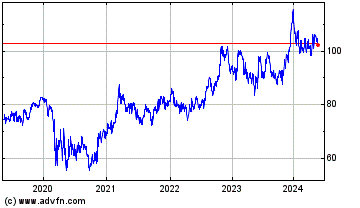
Click Here for more City Charts.
CHARLESTON, W.Va., April 17 /PRNewswire-FirstCall/ -- City Holding Company, "the Company" (NASDAQ:CHCO), a $2.5 billion bank holding company headquartered in Charleston, today announced record net income for the first quarter of $13.2 million or $0.76 per diluted share compared to $12.9 million or $0.71 per diluted share in the first quarter of 2006, or a 7.0% increase. For the first quarter of 2007, the Company achieved a return on assets of 2.10%, a return on equity of 17.1%, a net interest margin of 4.41%, and an efficiency ratio of 44.9%. This compares with a return on assets of 2.06%, a return on equity of 17.4%, a net interest margin of 4.71%, and an efficiency ratio of 45.3% for the comparable period of 2006. As previously announced during the first quarter of 2007, the Company recognized a gain of $1.5 million from the sale of its existing merchant processing agreements to NOVA Information Systems, Inc. (NOVA). Charles Hageboeck, Chief Executive Officer and President, stated, "The Company increased its earnings per share in the first quarter of 2007 as compared to the first quarter of 2006 despite a decrease of over $0.9 million in interest income associated with previously securitized loans (whose balances decreased 49%) and a decrease of $0.6 million due to lower credit card fee income as a result of the sales of the retail and merchant credit card portfolios. As compared to the quarter ended March 31, 2006, profitability as measured by our return on assets was better and our efficiency ratio improved. Excluding charge-offs related to depository overdrafts, the Company experienced net recoveries during the first quarter of 2007. The decline in our charge-offs for the quarter reflects the solid underwriting standards that the Company utilizes in commercial and retail lending as balances of loans written prior to 2002 continue to decline. Non- performing assets as a percentage of loans rose from 25 basis points at December 31, 2006 to 44 basis points at March 31, 2007 due primarily to the bankruptcy of a single residential mortgage customer during the quarter. Overall, the Company's asset quality remains very favorable in comparison to our peer group (bank holding companies with total assets between $1 and $5 billion) and past due loans remain at a very low level. Although 2007 looks to be a challenging year for many banks, we remain positive in our outlook for the year. During the first quarter, we announced plans to open a new branch in Princeton, West Virginia during the fourth quarter of 2007. As a result of the Company's continued accomplishments, on February 28, 2007, our Board of Directors approved an increase of 10% in our quarterly dividends to 31 cents per share. In addition, the Company remains well positioned with a tangible equity to tangible asset ratio of 9.8% at March 31, 2007. We look forward to maintaining our solid performance for the remainder of 2007 on behalf of our shareholders despite the many challenges from the current economic environment." Balance Sheet Trends As compared to December 31, 2006, loans have increased $14.3 million (0.9%) at March 31, 2007 with increases in commercial loans of $14.5 million (2.1%), home equity loans of $2.9 million (0.9%) and installment loans of $1.8 million (4.2%). These increases were partially offset by decreases in previously securitized loans of $2.9 million (see Previously Securitized Loans) and residential real estate loans of $2.1 million. Total average depository balances increased $17.1 million, or 0.9%, from the quarter ended December 31, 2006 to the quarter ended March 31, 2007. This growth was primarily in savings and time deposits, which have increased $13.3 million and $6.9 million, respectively. Net Interest Income The Company's tax equivalent net interest income decreased $1.4 million, or 5.5%, from $26.1 million during the first quarter of 2006 to $24.7 million during the first quarter of 2007. This decrease is attributable to two factors. First, during the third quarter of 2006, the Company sold its retail credit card portfolio. Average credit card loans outstanding were $14.5 million in the first quarter of 2006. This resulted in a decrease in interest income of $0.5 million from the first quarter of 2006. Secondly, the Company experienced a decrease of $0.9 million in interest income from previously securitized loans in the first quarter of 2007 as compared to the first quarter of 2006 as the average balance of these loans decreased 48.7%. The decrease in average balances was partially mitigated by an increase in the yield on these loans from 39.1% for the first quarter of 2006 to 49.5% for the first quarter of 2007 (see Previously Securitized Loans). An increase of $3.3 million in interest income from all other loans (commercial, residential, home equity, and consumer) was essentially offset by an increase of $3.2 million in interest expense on deposits. The Company's net interest margin was 4.41% in the first quarter of 2007 as compared to 4.71% in the first quarter of 2006. The decline in the net interest margin can be largely attributed to lower interest income from previously securitized loans and the loss of interest income due to the sale of the retail credit card portfolio. Excluding these assets, the Company's net interest margin decreased 15 basis points from 4.33% during the first quarter of 2006 to 4.18% for the first quarter of 2007. This compression is due to increased rates paid on interest-bearing liabilities, primarily time deposits. Credit Quality At March 31, 2007, the Allowance for Loan Losses ("ALLL") was $16.1 million or 0.95% of total loans outstanding and 236% of non-performing loans compared to $16.8 million or 1.04% of loans outstanding and 504% of non- performing loans at March 31, 2006, and $15.4 million or 0.92% of loans outstanding and 385% of non-performing loans at December 31, 2006. While the Company's ALLL as a percent of outstanding loans has decreased since March 31, 2006, this decrease can be directly attributed to the sale of the bank's retail credit card portfolio in the third quarter of 2006. In fact, after consideration of the impact of the sale of the retail credit card portfolio, the ALLL (less the portion of the allowance allocated to credit cards) was 0.94% of total loans outstanding (net of credit card loans outstanding) and 373% of non-performing loans (net of non-performing credit card loans) at March 31, 2006. As a result of the Company's quarterly analysis of the adequacy of the ALLL, the Company recorded a provision for loan losses of $0.9 million in the first quarter of 2007 compared to $1.0 million for the comparable period in 2006. The quality of the Company's loan portfolio has continued to improve. Total past due loans have declined 43% from $10.5 million at December 31, 2006 to $6.0 million at March 31, 2007. This improvement has been primarily associated with residential real estate loans (down $2.9 million or 46%) and commercial loans (down $0.9 million or 43%) from December 31, 2006. Changes in the amount of the provision and related allowance are based on the Company's detailed methodology and are directionally consistent with growth and changes in the composition and quality of the Company's loan portfolio. The Company had net charge-offs of $0.2 million for the first quarter of 2007, with depository accounts representing $0.3 million (or approximately 129%) of this total. While charge-offs on depository accounts are appropriately taken against the ALLL, the revenue associated with depository accounts is reflected in service charges and has been steadily growing as the core base of checking accounts has grown. Net charge-offs on residential loans were $0.1 million for the first quarter, while commercial loans experienced net recoveries of $0.1 million during the quarter. The decrease in net charge-offs is attributable to declines in balances of loans originated prior to 2002 (including loans acquired as part of the Classic Bancshares acquisition). At March 31, 2007, balances of loans written subsequent to 2002 comprise approximately 74% of total loan balances. The Company's ratio of non-performing assets to total loans and other real estate owned increased from 0.25% at December 31, 2006 to 0.44% at March 31, 2007 as a result of one residential real estate loan. Our ratio of non- performing assets to total loans compares quite favorably relative to our peer group (bank holding companies with total assets between $1 and $5 billion), which reported average non-performing assets as a percentage of loans and other real estate owned of 0.81% for the most recently reported quarter ended December 31, 2006. The composition of the Company's loan portfolio, which is weighted more heavily toward residential mortgage loans and less towards non- real estate secured commercial loans than peers, has allowed it to maintain a lower allowance in comparison to peers. In addition, the sale of the Company's credit card portfolio resulted in a reduction of the allowance of $1.4 million during 2006. As a result, the Company's ALLL as a percentage of loans outstanding is 0.95% at March 31, 2007. The Company believes its methodology for determining the adequacy of its ALLL adequately provides for probable losses inherent in the loan portfolio and produces a provision and allowance for loan losses that is directionally consistent with changes in asset quality and loss experience. Non-interest Income Net of the gain from the sale of the Company's merchant credit card portfolio, non-interest income increased $0.5 million to $12.9 million in the first quarter of 2007 as compared to $12.4 million in the first quarter of 2006. The largest source of non-interest income is service charges from depository accounts, which increased $0.2 million, or 2.0%, from $9.9 million during the first quarter of 2006 to $10.1 million during the first quarter of 2007. Insurance commission revenues increased $0.4 million, or 64.8% due to the hiring of additional staff by City Insurance to provide worker's compensation insurance to West Virginia businesses. Partially off-setting these increases was a decrease in other income of $0.3 million due to lower credit card fee income due to the sale of the retail credit card portfolio during the third quarter of 2006 and the sale of the merchant credit card portfolio during the first quarter of 2007. Non-interest Expenses Non-interest expenses increased $0.1 million from $17.5 million in the first quarter of 2006 to $17.6 million in the first quarter of 2007. Salaries and employee benefits increased $0.4 million, or 4.9%, from the first quarter of 2006 due in part to additional staffing for new retail locations and insurance personnel to support the introduction of worker's compensation insurance. This increase was partially offset by a $0.3 million charge in the first quarter of 2006 related to the redemption of $2.5 million of the Company's trust preferred securities. The Company's efficiency ratio improved from 45.3% for the quarter ended March 31, 2006 to 44.9% for the quarter ended March 31, 2007, reflecting ongoing strength in managing expenses while increasing revenues. The average efficiency ratio for the Company's peer group for the most recently reported quarter was 59.2%. Previously Securitized Loans At March 31, 2007, the Company reported "Previously Securitized Loans" of $12.7 million compared to $25.9 million and $15.6 million at March 31, 2006 and December 31, 2006, respectively, representing a decrease of 50.8% and 18.3%, respectively. The yield on the previously securitized loans was 49.5% for the quarter ended March 31, 2007, compared to 46.6% for the quarter ended December 31, 2006, and 39.1% for the quarter ended March 31, 2006. The yield on the previously securitized loans has increased due to improved cash flows as net default rates have been less than previously estimated. The default rates have decreased as a result of the Company's assumption of the servicing of all of the pool balances during the second quarter of 2005. Subsequent to our assumption of the servicing of these loans, the Company has averaged net recoveries but does not believe that continued net recoveries can be sustained indefinitely. Capitalization and Liquidity One of the Company's strengths is that it is highly profitable while maintaining strong liquidity and capital. With respect to liquidity, the Company's loan to deposit ratio was 83.0% and the loan to asset ratio was 66.1% at March 31, 2007. The Company maintained investment securities totaling 22.9% of assets as of this date. Further, the Company's deposit mix is weighted heavily toward checking and saving accounts that fund 43.6% of assets at March 31, 2007. Time deposits fund 36.0% of assets at March 31, 2007, but very few of these deposits are in accounts that have balances of more than $150,000, reflecting the core retail orientation of the Company. The Company is also strongly capitalized. With respect to regulatory capital, at March 31, 2007, the Company's Leverage Ratio is 10.68%, the Tier I Capital ratio is 15.31 %, and the Total Risk-Based Capital ratio is 16.25%. These regulatory capital ratios are significantly above levels required to be considered "well capitalized," which is the highest possible regulatory designation. On February 28, 2007 the Board approved a 10% increase in the quarterly cash dividend to 31 cents per share payable April 30, 2007 to shareholders of record as of April 15, 2007. During the quarter ended March 31, 2007, the Company repurchased 274,300 common shares at a weighted average price of $39.71 as part of a one million share repurchase plan authorized by the Board of Directors in December 2006. The Company's tangible equity ratio was 9.8% at March 31, 2007 compared with a tangible equity ratio of 10.0% at December 31, 2006. Due to the Company's strong earnings, the Company was able to both repurchase these shares and increase its cash dividends while maintaining its tangible equity ratio. City Holding Company is the parent company of City National Bank of West Virginia. City National operates 68 branches across West Virginia, Eastern Kentucky and Southern Ohio. Forward-Looking Information This news release contains certain forward-looking statements that are included pursuant to the safe harbor provisions of the Private Securities Litigation Reform Act of 1995. Such information involves risks and uncertainties that could result in the Company's actual results differing from those projected in the forward-looking statements. Important factors that could cause actual results to differ materially from those discussed in such forward-looking statements include, but are not limited to, (1) the Company may incur additional loan loss provision due to negative credit quality trends in the future that may lead to a deterioration of asset quality; (2) the Company may incur increased charge-offs in the future; (3) the Company may experience increases in the default rates on previously securitized loans that would result in impairment losses or lower the yield on such loans; (4) the Company may continue to benefit from strong recovery efforts on previously securitized loans resulting in improved yields on these assets; (5) the Company could have adverse legal actions of a material nature; (6) the Company may face competitive loss of customers; (7) the Company may be unable to manage its expense levels; (8) the Company may have difficulty retaining key employees; (9) changes in the interest rate environment may have results on the Company's operations materially different from those anticipated by the Company's market risk management functions; (10) changes in general economic conditions and increased competition could adversely affect the Company's operating results; (11) changes in other regulations and government policies affecting bank holding companies and their subsidiaries, including changes in monetary policies, could negatively impact the Company's operating results; and (12) the Company may experience difficulties growing loan and deposit balances. Forward-looking statements made herein reflect management's expectations as of the date such statements are made. Such information is provided to assist stockholders and potential investors in understanding current and anticipated financial operations of the Company and is included pursuant to the safe harbor provisions of the Private Securities Litigation Reform Act of 1995. The Company undertakes no obligation to update any forward-looking statement to reflect events or circumstances that arise after the date such statements are made. CITY HOLDING COMPANY AND SUBSIDIARIES Financial Highlights (Unaudited) Three Months Ended March 31 Percent 2007 2006 Change Earnings ($000s, except per share data): Net Interest Income (FTE) $24,671 $26,105 (5.49)% Net Income 13,231 12,866 2.84% Earnings per Basic Share 0.76 0.71 7.04% Earnings per Diluted Share 0.76 0.71 7.04% Key Ratios (percent): Return on Average Assets 2.10% 2.06% 1.92% Return on Average Equity 17.13% 17.37% (1.42)% Net Interest Margin 4.41% 4.71% (6.36)% Efficiency Ratio 44.93% 45.28% (0.77)% Average Shareholders' Equity to Average Assets 12.27% 11.87% 3.39% Consolidated Risk Based Capital Ratios (a): Tier I 15.31% 14.83% 3.24% Total 16.25% 15.80% 2.85% Average Tangible Equity to Average Tangible Assets 9.79% 9.24% 5.87% Common Stock Data: Cash Dividends Declared per Share $0.31 $0.28 10.71% Book Value per Share 17.62 16.17 8.99% Tangible Book Value per Share 14.21 12.84 10.70% Market Value per Share: High 41.54 37.64 10.36% Low 38.04 35.26 7.88% End of Period 40.45 36.79 9.95% Price/Earnings Ratio (b) 13.31 12.95 2.71% (a) March 31, 2007 risk-based capital ratios are estimated. (b) March 31, 2007 price/earnings ratio computed based on annualized first quarter 2007 earnings. Book Value and Market Price Range per Share Market Price Book Value per Share Range per Share March 31 June 30 September 30 December 31 Low High 2003 $10.10 $10.74 $11.03 $11.46 $25.50 $37.15 2004 12.09 11.89 12.70 13.03 27.30 37.58 2005 13.20 15.56 15.99 16.14 27.57 39.21 2006 16.17 16.17 16.99 17.46 34.53 41.87 2007 17.62 38.04 41.54 Earnings per Basic Share Quarter Ended March 31 June 30 September 30 December 31 Year- to-Date 2003 $0.56 $0.73 $0.69 $0.64 $2.62 2004 0.66 0.80 0.66 0.67 2.79 2005 0.70 0.72 0.73 0.72 2.87 2006 0.71 0.78 0.78 0.74 3.00 2007 0.76 0.76 Earnings per Diluted Share Quarter Ended March 31 June 30 September 30 December 31 Year-to-Date 2003 $0.55 $0.72 $0.68 $0.63 $2.58 2004 0.65 0.79 0.65 0.66 2.75 2005 0.69 0.71 0.72 0.72 2.84 2006 0.71 0.77 0.77 0.74 2.99 2007 0.76 0.76 CITY HOLDING COMPANY AND SUBSIDIARIES Consolidated Statements of Income (Unaudited) ($ in 000s, except per share data) Three Months Ended March 31, 2007 2006 Interest Income Interest and fees on loans $31,464 $29,564 Interest on investment securities: Taxable 6,933 7,260 Tax-exempt 427 467 Interest on deposits in depository institutions 117 150 Interest on federal funds sold 257 - Total Interest Income 39,198 37,441 Interest Expense Interest on deposits 12,712 9,201 Interest on short-term borrowings 1,513 1,127 Interest on long-term debt 531 1,260 Total Interest Expense 14,756 11,588 Net Interest Income 24,442 25,853 Provision for loan losses 900 1,000 Net Interest Income After Provision for Loan Losses 23,542 24,853 Non-Interest Income Investment securities gains (losses) - - Service charges 10,063 9,862 Insurance commissions 1,012 614 Trust and investment management fee income 568 566 Bank owned life insurance 696 537 Gain on sale of credit card merchant agreements 1,500 - Other income 532 810 Total Non-Interest Income 14,371 12,389 Non-Interest Expense Salaries and employee benefits 9,057 8,632 Occupancy and equipment 1,637 1,599 Depreciation 1,070 1,050 Professional fees 403 395 Postage, delivery, and statement mailings 777 644 Advertising 852 774 Telecommunications 455 476 Bankcard expenses 518 543 Insurance and regulatory 385 388 Office supplies 455 383 Repossessed asset (gains) losses, net of expenses (14) 4 Loss on early extinguishment of debt - 282 Other expenses 2,021 2,327 Total Non-Interest Expense 17,616 17,497 Income Before Income Taxes 20,297 19,745 Income tax expense 7,066 6,879 Net Income $13,231 $12,866 Basic earnings per share $0.76 $0.71 Diluted earnings per share $0.76 $0.71 Average Common Shares Outstanding: Basic 17,369 18,006 Diluted 17,424 18,067 CITY HOLDING COMPANY AND SUBSIDIARIES Consolidated Statements of Changes in Stockholders' Equity (Unaudited) ($ in 000s) Three Months Ended March 31, 2007 March 31, 2006 Balance at January 1 $305,307 $292,141 Cumulative effect of adopting FIN 48 (125) - Net income 13,231 12,866 Other comprehensive income: Change in unrealized gain on securities available-for-sale 723 (917) Change in unrealized gain/(loss) on interest rate floors 122 (509) Cash dividends declared ($0.31/share) (5,342) - Cash dividends declared ($0.28/share) - (4,988) Issuance of stock award shares, net 264 167 Exercise of 5,300 stock options 82 - Exercise of 26,875 stock options - 357 Excess tax benefits on stock compensation - 173 Purchase of 274,300 common shares of treasury (10,908) - Purchase of 300,572 common shares of treasury - (10,914) Balance at March 31 $303,354 $288,376 CITY HOLDING COMPANY AND SUBSIDIARIES Condensed Consolidated Quarterly Statements of Income (Unaudited) ($ in 000s, except per share data) Quarter Ended March 31 Dec. 31 Sept. 30 June 30 March 31 2007 2006 2006 2006 2006 Interest income $39,198 $39,925 $39,747 $39,010 $37,441 Taxable equivalent adjustment 230 228 236 246 252 Interest income (FTE) 39,428 40,153 39,983 39,256 37,693 Interest expense 14,756 14,820 14,233 13,085 11,588 Net interest income 24,672 25,333 25,750 26,171 26,105 Provision for loan losses 900 901 1,225 675 1,000 Net interest income after provision for loan losses 23,772 24,432 24,525 25,496 25,105 Noninterest income 14,371 13,586 14,766 13,463 12,389 Noninterest expense 17,616 18,099 18,133 17,555 17,497 Income before income taxes 20,527 19,919 21,158 21,404 19,997 Income tax expense 7,066 6,752 7,302 7,397 6,879 Taxable equivalent adjustment 230 228 236 246 252 Net income $13,231 $12,939 $13,620 $13,761 $12,866 Basic earnings per share $0.76 $0.74 $0.78 $0.78 $0.71 Diluted earnings per share 0.76 0.74 0.77 0.77 0.71 Cash dividends declared per share 0.31 0.28 0.28 0.28 0.28 Average Common Share (000s): Outstanding 17,369 17,535 17,557 17,719 18,006 Diluted 17,424 17,601 17,619 17,772 18,067 Net Interest Margin 4.41% 4.43% 4.51% 4.58% 4.71% CITY HOLDING COMPANY AND SUBSIDIARIES Non-Interest Income and Non-Interest Expense (Unaudited) ($ in 000s) Quarter Ended March 31 Dec. 31 Sept. 30 June 30 March 31 2007 2006 2006 2006 2006 Non-Interest Income: Service charges $10,063 $10,962 $10,833 $10,903 $9,862 Insurance commissions 1,012 675 526 521 614 Trust and investment management fee income 568 498 572 504 566 Bank owned life insurance 696 576 561 678 537 Other income 532 803 778 857 810 Subtotal 12,871 13,514 13,270 13,463 12,389 Investment security gains - 72 (2,067) - - Gain on sale of credit card merchant agreements 1,500 - 3,563 - - Total Non-Interest Income $14,371 $13,586 $14,766 $13,463 $12,389 Non-Interest Expense: Salaries and employee benefits $9,057 $8,354 $8,733 $8,764 $8,632 Occupancy and equipment 1,637 1,655 1,602 1,624 1,599 Depreciation 1,070 1,037 1,061 1,071 1,050 Professional fees 403 415 379 571 395 Postage, delivery, and statement mailings 777 735 765 689 644 Advertising 852 876 810 755 774 Telecommunications 455 549 498 525 476 Bankcard expenses 518 478 485 458 543 Insurance and regulatory 385 375 384 381 388 Office supplies 455 408 417 372 383 Repossessed asset (gains) losses, net of expenses (14) 6 20 (129) 4 Loss on early extinguishment of debt - 708 379 - 282 Other expenses 2,021 2,503 2,600 2,474 2,327 Total Non-Interest Expense $17,616 $18,099 $18,133 $17,555 $17,497 Employees (Full Time Equivalent) 791 779 767 779 764 Branch Locations 68 67 67 67 66 CITY HOLDING COMPANY AND SUBSIDIARIES Consolidated Balance Sheets ($ in 000s) March 31 December 31 2007 2006 (Unaudited) Assets Cash and due from banks $53,011 $58,014 Interest-bearing deposits in depository institutions 6,041 27,434 Federal funds sold 20,000 25,000 Cash and cash equivalents 79,052 110,448 Investment securities available-for- sale, at fair value 540,261 472,398 Investment securities held-to- maturity, at amortized cost 46,396 47,500 Total investment securities 586,657 519,898 Gross Loans 1,691,748 1,677,469 Allowance for loan losses (16,082) (15,405) Net loans 1,675,666 1,662,064 Bank owned life insurance 55,687 55,195 Premises and equipment 45,190 44,689 Accrued interest receivable 12,371 12,337 Net deferred tax assets 23,551 23,652 Intangible assets 58,681 58,857 Other assets 22,157 20,667 Total Assets $2,559,012 $2,507,807 Liabilities Deposits: Noninterest-bearing $338,332 $321,038 Interest-bearing: Demand deposits 435,069 422,925 Savings deposits 343,366 321,075 Time deposits 922,384 920,179 Total deposits 2,039,151 1,985,217 Short-term borrowings 156,062 136,570 Long-term debt 21,940 48,069 Other liabilities 38,505 32,644 Total Liabilities 2,255,658 2,202,500 Stockholders' Equity Preferred stock, par value $25 per share: 500,000 shares authorized; none issued - - Common stock, par value $2.50 per share: 50,000,000 shares authorized; 18,499,282 shares issued at March 31, 2007 and December 31, 2006 less 1,278,095 and 1,009,095 shares in treasury, respectively 46,249 46,249 Capital surplus 103,938 104,043 Retained earnings 201,977 194,213 Cost of common stock in treasury (44,126) (33,669) Accumulated other comprehensive (loss) income: Unrealized loss on securities available-for-sale (1,926) (2,649) Unrealized loss on derivative instruments (88) (210) Underfunded pension liability (2,670) (2,670) Total Accumulated Other Comprehensive (Loss) Income (4,684) (5,529) Total Stockholders' Equity 303,354 305,307 Total Liabilities and Stockholders' Equity $2,559,012 $2,507,807 CITY HOLDING COMPANY AND SUBSIDIARIES Loan Portfolio (Unaudited) ($ in 000s) March 31 Dec 31 Sept 30 June 30 March 31 2007 2006 2006 2006 2006 Residential real estate $596,412 $598,502 $604,867 $601,097 $595,093 Home equity 324,653 321,708 318,666 313,301 304,559 Commercial, financial, and agriculture 713,183 698,719 713,933 668,581 643,269 Installment loans to individuals 44,756 42,943 41,215 42,307 54,287 Previously securitized loans 12,744 15,597 18,520 22,253 25,918 Gross Loans $1,691,748 $1,677,469 $1,697,201 $1,647,539 $1,623,126 CITY HOLDING COMPANY AND SUBSIDIARIES Previously Securitized Loans (Unaudited) ($ in millions) Annualized Effective December 31 Interest Annualized Year Ended: Balance (a) Income (a) Yield (a) 2006 $15.6 $9.4 42% 2007 10.0 6.2 50% 2008 7.7 4.6 51% 2009 6.6 3.8 51% 2010 5.7 3.3 51% a - 2006 amounts are based on actual results. 2007 amounts are based on actual results through 3/31/07 and estimated amounts for the remainder of the year. 2008, 2009, and 2010 amounts are based on estimated amounts. Note: The amounts reflected in the table above require management to make significant assumptions based on estimated future default, prepayment, and discount rates. Actual performance could be different from that assumed, which could result in the actual results being materially different from the amounts estimated above. CITY HOLDING COMPANY AND SUBSIDIARIES Consolidated Average Balance Sheets, Yields, and Rates (Unaudited) ($ in 000s) Three Months Ended March 31, 2007 Average Yield/ Balance Interest Rate Assets: Loan portfolio: Residential real estate $594,504 $8,854 6.04% Home equity 322,647 6,242 7.85% Commercial, financial, and agriculture 716,517 13,343 7.55% Installment loans to individuals 42,903 1,269 12.00% Previously securitized loans 14,375 1,756 49.54% Total loans 1,690,946 31,464 7.55% Securities: Taxable 505,585 6,933 5.56% Tax-exempt 40,413 658 6.60% Total securities 545,998 7,591 5.64% Deposits in depository institutions 13,033 117 3.64% Federal funds sold 19,533 256 5.32% Total interest-earning assets 2,269,510 39,428 7.05% Cash and due from banks 50,129 Bank premises and equipment 44,968 Other assets 169,046 Less: Allowance for loan losses (15,636) Total assets $2,518,017 Liabilities: Interest-bearing demand deposits 430,201 1,332 1.26% Savings deposits 330,023 1,307 1.61% Time deposits 921,937 10,074 4.43% Short-term borrowings 146,455 1,512 4.19% Long-term debt 32,434 532 6.65% Total interest-bearing liabilities 1,861,050 14,757 3.22% Noninterest-bearing demand deposits 316,716 Other liabilities 31,234 Stockholders' equity 309,017 Total liabilities and stockholders' equity $2,518,017 Net interest income $24,671 Net yield on earning assets 4.41% Three Months Ended March 31, 2006 Average Yield/ Balance Interest Rate Assets: Loan portfolio: Residential real estate $593,131 $8,380 5.73% Home equity 302,265 5,594 7.51% Commercial, financial, and agriculture 635,249 11,293 7.21% Installment loans to individuals 56,546 1,593 11.43% Previously securitized loans 28,051 2,704 39.09% Total loans 1,615,242 29,564 7.42% Securities: Taxable 574,195 7,260 5.13% Tax-exempt 44,303 719 6.58% Total securities 618,498 7,979 5.23% Deposits in depository institutions 14,888 150 4.09% Federal funds sold - - 0.00% Total interest-earning assets 2,248,628 37,693 6.80% Cash and due from banks 53,252 Bank premises and equipment 42,529 Other assets 168,035 Less: Allowance for loan losses (16,851) Total assets $2,495,593 Liabilities: Interest-bearing demand deposits 444,126 1,259 1.15% Savings deposits 306,314 732 0.97% Time deposits 830,866 7,210 3.52% Short-term borrowings 151,728 1,127 3.01% Long-term debt 95,296 1,260 5.36% Total interest-bearing liabilities 1,828,330 11,588 2.57% Noninterest-bearing demand deposits 342,482 Other liabilities 28,564 Stockholders' equity 296,217 Total liabilities and stockholders' equity $2,495,593 Net interest income $26,105 Net yield on earning assets 4.71% CITY HOLDING COMPANY AND SUBSIDIARIES Analysis of Risk-Based Capital (Unaudited) ($ in 000s) March 31 Dec. 31 Sept. 30 June 30 March 31 2007 (a) 2006 2006 2006 2006 Tier I Capital: Stockholders' equity 303,354 $305,307 $298,327 $284,120 $288,376 Goodwill and other intangibles (58,681) (58,857) (59,038) (59,219) (59,378) Accumulated other comprehensive income 2,014 2,859 4,109 9,762 6,265 Qualifying trust preferred stock 16,000 16,000 22,000 25,500 25,500 Excess deferred tax assets - - - (4,079) (2,254) Total tier I capital $262,687 $265,309 $265,398 $256,084 $258,509 Total Risk-Based Capital: Tier I capital $262,687 $265,309 $265,398 $256,084 $258,509 Qualifying allowance for loan losses 16,082 15,405 15,557 15,268 16,818 Total risk-based capital $278,769 $280,714 $280,955 $271,352 $275,327 Net risk-weighted assets $1,715,664 $1,734,214 $1,770,458 $1,757,720 $1,743,243 Ratios: Average stockholders' equity to average assets 12.27% 12.14% 11.67% 11.51% 11.87% Tangible capital ratio 9.79% 10.06% 9.69% 9.13% 9.24% Risk-based capital ratios: Tier I capital 15.31% 15.30% 14.99% 14.58% 14.83% Total risk-based capital 16.25% 16.19% 15.87% 15.45% 15.80% Leverage capital 10.68% 10.79% 10.81% 10.34% 10.62% (a) March 31, 2007 risk-based capital ratios are estimated. CITY HOLDING COMPANY AND SUBSIDIARIES Intangibles (Unaudited) ($ in 000s) As of and for the Quarter Ended March 31 Dec 31. Sept. 30 June 30 March 31 2007 2006 2006 2006 2006 Intangibles, net $58,681 $58,857 $59,038 $59,219 $59,378 Intangibles amortization expense 176 181 181 181 181 CITY HOLDING COMPANY AND SUBSIDIARIES Summary of Loan Loss Experience (Unaudited) ($ in 000s) Quarter Ended March 31 Dec. 31 Sept. 30 June 30 March 31 2007 2006 2006 2006 2006 Balance at beginning of period $15,405 $15,557 $15,268 $16,818 $16,790 Reduction of allowance for loans sold - - - (1,368) - Charge-offs: Commercial, financial, and agricultural 35 844 207 43 185 Real estate-mortgage 111 230 177 232 296 Installment loans to individuals 84 126 165 239 368 Overdraft deposit accounts 860 892 1,018 955 958 Total charge-offs 1,090 2,092 1,567 1,469 1,807 Recoveries: Commercial, financial, and agricultural 148 101 44 33 32 Real estate-mortgage 15 350 64 56 105 Installment loans to individuals 132 118 131 151 198 Overdraft deposit accounts 573 470 392 372 500 Total recoveries 868 1,039 631 612 835 Net charge-offs 222 1,053 936 857 972 Provision for loan losses 900 901 1,225 675 1,000 Balance at end of period $16,083 $15,405 $15,557 $15,268 $16,818 Loans outstanding $1,691,748 $1,677,469 $1,697,201 $1,647,539 $1,623,126 Average loans outstanding 1,690,946 1,689,846 1,662,929 1,630,454 1,615,242 Allowance as a percent of loans outstanding 0.95% 0.92% 0.92% 0.93% 1.04% Allowance as a percent of non-performing loans 235.75% 384.93% 408.43% 408.02% 503.53% Net charge-offs (annualized) as a percent of average loans outstanding 0.05% 0.25% 0.23% 0.21% 0.24% Net charge-offs, excluding overdraft deposit accounts, (annualized) as a percent of average loans outstanding (0.02)% 0.15% 0.07% 0.07% 0.13% CITY HOLDING COMPANY AND SUBSIDIARIES Summary of Non-Performing Assets (Unaudited) ($ in 000s) March 31 Dec. 31 Sept. 30 June 30 March 31 2007 2006 2006 2006 2006 Nonaccrual loans $6,714 $3,319 $3,359 $3,046 $2,743 Accruing loans past due 90 days or more 108 635 328 573 512 Previously securitized loans past due 90 days or more - 48 122 123 85 Total non-performing loans 6,822 4,002 3,809 3,742 3,340 Other real estate owned, excluding property associated with previously securitized loans 290 161 499 294 403 Other real estate owned associated with previously securitized loans 252 20 20 92 306 Other real estate owned 542 181 519 386 709 Total non-performing assets $7,364 $4,183 $4,328 $4,128 $4,049 Non-performing assets as a percent of loans and other real estate owned 0.44% 0.25% 0.25% 0.25% 0.25% DATASOURCE: City Holding Company CONTACT: Charles R. Hageboeck, Chief Executive Officer and President of City Holding Company, +1-304-769-1102 Web site: http://www.cityholding.com/

Copyright

1 Year City Chart

1 Year City Chart

1 Month City Chart

1 Month City Chart

Your Recent History

Delayed Upgrade Clock