ADVFN Logo ADVFN

We could not find any results for:
Make sure your spelling is correct or try broadening your search.

Trending Now

Toplists

It looks like you aren't logged in.
Click the button below to log in and view your recent history.

Hot Features

Registration Strip Icon for monitor Customisable watchlists with full streaming quotes from leading exchanges, such as LSE, NASDAQ, NYSE, AMEX, Bovespa, BIT and more.

CGEN Compugen Ltd

1.89
-0.02 (-1.05%)
17 Jul 2024 - Closed
Delayed by 15 minutes
Share Name Share Symbol Market Type
Compugen Ltd NASDAQ:CGEN NASDAQ Common Stock
  Price Change % Change Share Price Bid Price Offer Price High Price Low Price Open Price Shares Traded Last Trade
  -0.02 -1.05% 1.89 1.85 1.93 1.94 1.84 1.94 392,094 01:00:00

Compugen Reports First Quarter 2008 Results

14/05/2008 12:00pm

Business Wire


Compugen (NASDAQ:CGEN)
Historical Stock Chart


From Jul 2019 to Jul 2024
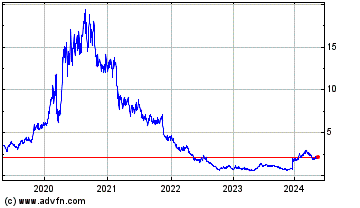
Click Here for more Compugen Charts.
Compugen Ltd. (NASDAQ:CGEN) today reported its results for the first quarter ended March 31, 2008. “The accelerating rate of discovery and initial validation of attractive product candidates in different drug and diagnostic areas reported during recent months is clearly demonstrating that Compugen has established a unique, powerful and broadly applicable capability. In parallel and not surprisingly, we are seeing a substantial increase in interest in both our existing product candidates and our discovery capabilities by leading companies in these industries, and were pleased to add agreements with Merck & Co., Inc., and Roche to our growing list of collaborations,” stated Martin Gerstel, Compugen’s Chairman. “In addition to providing the company with interesting strategic alternatives that we have now begun to explore, we expect these trends to continue as, during the coming months, the values and potential of our approach will be more fully demonstrated through the disclosure of additional discovery platforms and further evidence of the broad applicability and continuous improvement with time and usage of our existing nine 'state of the art' predictive biology based platforms,” Mr. Gerstel concluded. Revenues for the first quarter of 2008 were $281,000 compared to none for the first quarter of 2007. The net loss for the quarter was $2.5 million (including a non-cash expense of $327,000 related to stock based compensation), or $0.09 per share, compared with a net loss of $3.1 million (including a non-cash expenses of $797,000 related to stock based compensation), or $0.11 per share, for the corresponding quarter of 2007. Research and development expenses of $1.9 million for the first quarter of 2008, compared to $2.3 million for the first quarter of 2007, remain the Company’s largest expense, representing approximately 70% of our total expenses for the periods. These amounts are before the deduction of governmental and other grants, which totaled $166,000 for the first quarter in 2008, compared with $297,000 for the corresponding quarter in 2007. Other assets as shown in the Company’s consolidated balance sheets increased from $1.9 million as of December 31, 2007 to $4.2 million as of March 31, 2008. This increase was substantially due to the Company’s holding in Evogene Ltd. As of March 31, 2008, Compugen had $14.8 million in cash, cash equivalents, deposits and marketable securities, a decrease of $2.3 million from December 31, 2007. Conference Call and Web Cast Information To access the conference call, please dial 1-888-407-2553 from the US or +972-3-918-0620 internationally. The call will also be available via live webcast through Compugen’s Website, located at www.cgen.com. A replay of the conference call will be available approximately two hours after the completion of the live conference call. To access the replay, please dial 1-877-456-0009 from the US or +972-3–925-5938. The replay will be available until 12 noon EDT on May 17, 2008. About Compugen Compugen’s mission is to be the world leader in the discovery and licensing of product candidates to the drug and diagnostic industries under milestone and revenue sharing agreements. The Company’s increasing inventory of powerful and proprietary discovery platforms is enabling the predictive discovery – field after field – of numerous therapeutic and diagnostic product candidates. These discovery platforms are based on the Company’s decade-long focus on the predictive understanding of important biological phenomena at the molecular level. Compugen’s current collaborations include Biosite, Medarex, Inc., Merck & Co., Inc., Ortho-Clinical Diagnostics (a Johnson & Johnson company), Roche, Siemens Healthcare Diagnostics, Inc., and Teva Pharmaceutical Industries. In 2002, Compugen established an affiliate – Evogene Ltd. (TASE:EVGN.TA) – to utilize the Company’s in-silico predictive discovery capabilities in the agricultural biotechnology field. For additional information, please visit Compugen's corporate Website at www.cgen.com and Evogene’s corporate Website at www.evogene.com. This press release may contain "forward-looking statements" within the meaning of the Private Securities Litigation Reform Act of 1995. These statements include words such as “may”, “expects”, “anticipates”, “believes”, and “intends”, and describe opinions about future events. These forward-looking statements involve known and unknown risks and uncertainties that may cause the actual results, performance or achievements of Compugen to be materially different from any future results, performance or achievements expressed or implied by such forward-looking statements. Some of these risks are: changes in relationships with collaborators; the impact of competitive products and technological changes; risks relating to the development of new products; and the ability to implement technological improvements. These and other factors are identified and more fully explained under the heading "Risk Factors" in Compugen's annual reports filed with the Securities and Exchange Commission. COMPUGEN LTD. CONDENSED CONSOLIDATED STATEMENTS OF OPERATIONS (U.S. dollars in thousands, except for share and per-share amounts)     Three Months Ended March 31, 2008 Unaudited   2007 Unaudited Revenues 281 -   Cost and Expenses Cost of revenues 7 - Research and development expenses 1,931 2,339 Less: governmental and other grants (166 ) (297 ) Research and development expenses, net 1,765 2,042 Sales and marketing expenses 308 594 General and administrative expenses 814 553 Total operating expenses (1) 2,887 3,189   Operating loss (2,613 ) (3,189 ) Financing income, net 102 276 Other income, net 16 9 Loss before taxes on income (2,495 ) (2,904 ) Taxes on income - - Loss from continuing operations (2,495 ) (2,904 ) Income (Loss) from discontinued operations - (203 ) Net loss (2,495 ) (3,107 ) Basic and diluted net loss per ordinary share from continuing operation (0.09 ) (0.10 ) Basic and diluted loss per ordinary share from discontinuing operation - (0.01 ) Basic and diluted net loss per ordinary share (0.09 ) (0.11 ) Weighted average number of ordinary shares outstanding 28,349,291 28,198,634   (1) Includes stock based compensation COMPUGEN LTD. CONDENSED CONSOLIDATED BALANCE SHEETS DATA (U.S. dollars, in thousands)     March 31, 2008 Unaudited   December 31, 2007 Audited   ASSETS Current assets Cash, cash equivalents, short term deposits and marketable securities 14,831 15,082 Cash held in favor of other consortium partners 64 118 Trade receivables 12 40 Receivables and prepaid expenses 836 950 Assets related to discontinued operation 52 54 Total current assets 15,795 16,244   Long-term investments Long term deposits and marketable securities - 2,080 Other assets 4,196 1,925 Property and equipment, net 1,312 1,417 Total assets 21,303 21,666   LIABILITIES AND SHAREHOLDERS’ EQUITY Current liabilities Accounts payable and accrued expenses 2,268 2,741 Deferred revenues 110 150 Liabilities related to discontinued operations - 4 Total current liabilities 2,378 2,895   Long-term liabilities Accrued severance pay 1,761 1,486 Other long-term liabilities 20 - Total long-term liabilities 1,781 1,486     Total shareholders’ equity 17,144 17,285 Total liabilities and shareholders’ equity 21,303 21,666

1 Year Compugen Chart

1 Year Compugen Chart

1 Month Compugen Chart

1 Month Compugen Chart

Your Recent History

Delayed Upgrade Clock