ADVFN Logo ADVFN

We could not find any results for:
Make sure your spelling is correct or try broadening your search.

Trending Now

Toplists

It looks like you aren't logged in.
Click the button below to log in and view your recent history.

Hot Features

Registration Strip Icon for charts Register for streaming realtime charts, analysis tools, and prices.

BRKR Bruker Corporation

62.45
1.96 (3.24%)
After Hours
Last Updated: 21:01:29
Delayed by 15 minutes
Share Name Share Symbol Market Type
Bruker Corporation NASDAQ:BRKR NASDAQ Common Stock
  Price Change % Change Share Price Bid Price Offer Price High Price Low Price Open Price Shares Traded Last Trade
  1.96 3.24% 62.45 61.46 63.41 62.59 60.40 61.00 1,274,207 21:01:29

Bruker Corporation Reports its Combined Financial Results for the Fourth Quarter and Year 2007, Including the Bruker BioSpin Gro

17/03/2008 10:00am

Business Wire


Bruker (NASDAQ:BRKR)
Historical Stock Chart


From Oct 2019 to Oct 2024
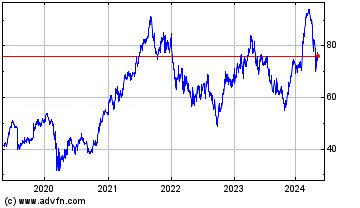
Click Here for more Bruker Charts.
Bruker Corporation (NASDAQ:BRKR) today reported financial results for the fourth quarter and year ended December 31, 2007, now including the results of the Bruker BioSpin Group. On February 26, 2008, Bruker BioSciences Corporation closed its acquisition of the Bruker BioSpin Group, and renamed itself Bruker Corporation. Under US GAAP, this transaction is accounted for as an acquisition of businesses under common control, and as a result all one-time transaction costs are expensed in the period in which they are incurred, rather than being added to goodwill. In addition, after the closing of the transaction all historical consolidated balance sheets, statements of operations, statements of cash flows and notes to the consolidated financial statements in future filings with the Securities and Exchange Commission will be restated by combining the historical consolidated financial statements of Bruker Corporation with those of the Bruker BioSpin Group. The information contained herein will discuss the combined financial results of Bruker Corporation, as it legally exists since the closing on February 26, 2008, and which now include the financial results of the Bruker BioSpin Group (“Combined”). These will be compared in some categories to the historical, standalone financial results of Bruker BioSciences Corporation, as it legally existed on December 31, 2007 (“Standalone”). Combined Financial Results of Bruker Corporation In the fourth quarter of 2007, Combined revenue increased by 31% to $343.1 million, compared to Combined revenue of $261.5 million in the fourth quarter of 2006. Excluding the effects of foreign currency translation, Combined fourth quarter 2007 revenue increased by 22% year-over-year. Combined fourth quarter 2007 revenue of $343.1 million was 87% higher than Standalone fourth quarter 2007 revenue of $183.7 million, as previously reported by Bruker BioSciences Corporation. Combined net income in the fourth quarter of 2007 increased to $37.0 million, or $0.22 per diluted share, compared to Combined net income of $35.6 million, or $0.22 per diluted share, in the fourth quarter of 2006. Included in Combined GAAP net income for the fourth quarter of 2007 were after-tax charges of $6.9 million, or $0.04 per diluted share, for expenses related to the acquisition of the Bruker BioSpin Group. Combined fourth quarter 2007 net income of $37.0 million was 164% higher than Standalone fourth quarter 2007 net income of $14.0 million, as previously reported by Bruker BioSciences Corporation. Combined fourth quarter 2007 earnings per diluted share of $0.22 were 69% higher than Standalone fourth quarter 2007 earnings per diluted share of $0.13, as previously reported by Bruker BioSciences Corporation. For the full year 2007, Combined revenue increased by 21% to $1,032.4 million, compared to Combined revenue of $851.0 million for the full year 2006. Excluding the effects of foreign currency translation, Combined 2007 revenue increased by 15% year-over-year, including 1% growth from acquisitions, and organic growth of 14%. Combined 2007 revenue was 89% higher than Standalone 2007 revenue of $547.6 million, as previously reported by Bruker BioSciences Corporation. Combined net income in 2007 increased 30% to $97.2 million, or $0.59 per diluted share, compared to Combined net income of $74.8 million, or $0.47 per diluted share, in 2006. Included in Combined GAAP net income for 2007 were after-tax charges of $7.4 million, or $0.05 per diluted share, for expenses related to the acquisition of the Bruker BioSpin Group. For comparison, included in Combined GAAP net income for the year 2006 were after-tax charges of $5.0 million, or $0.03 per diluted share, for expenses related to the acquisition of Bruker Optics, which was completed on July 1, 2006. Combined 2007 net income of $97.2 million was 208% higher than the Standalone 2007 net income of $31.5 million, as previously reported by Bruker BioSciences Corporation. Combined 2007 earnings per diluted share of $0.59 were 97% higher than the Standalone 2007 earnings per diluted share of $0.30, as previously reported by Bruker BioSciences Corporation. Combined cash flow from operations in 2007 was $127.1 million, compared to $82.8 million in 2006. Combined free cash flow, defined as operating cash flow less capital expenditures, was $101.8 million during 2007, compared to $61.7 million during 2006. As of December 31, 2007, the Combined Bruker Corporation had net cash of $290.4 million. Comment and Outlook Frank Laukien, President and CEO, commented: “The addition of the Bruker BioSpin Group to Bruker Corporation represents a significant step-up in our combined financial performance. We are extremely pleased that our overall rapid growth has enabled the Combined Bruker to cross the billion-dollar-revenue threshold already in 2007, with Combined, currency-adjusted 2007 revenue growth of 15%. Moreover, we have reached new levels of profitability and cash flow with Combined 2007 Bruker net income of $97 million and free cash flow of $102 million. Our Combined 2007 GAAP EPS of $0.59 was nearly twice the previously reported Standalone 2007 EPS of $0.30 of Bruker BioSciences Corporation.” Bill Knight, CFO, continued with an outlook for the year 2008: “Our markets in 2007 were strong, yet going forward there is considerable economic uncertainty. Under the assumption that the overall market conditions we face will not deteriorate significantly, our financial goals for the full year 2008 include: revenue growth greater than 8%, operating margins greater than 14%, excluding expenses associated with the acquisition of the Bruker BioSpin Group, net income margins greater than 9%, excluding expenses associated with the acquisition of the Bruker BioSpin Group, and improved balance sheet metrics and operating cash flows. It should be kept in mind that with the addition of the Bruker BioSpin Group, we expect that quarterly fluctuations in our financial results will increase.” EARNINGS CONFERENCE CALL Bruker Corporation will host an operator-assisted earnings conference call at 8 a.m. Eastern Time on Monday, March 17, 2008. To listen to the webcast, investors can go to www.bruker.com and click on the live web broadcast symbol. The webcast will be available through the Company web site for 30 days. Investors can also listen and participate on the telephone in the US and Canada by calling 888-339-2688, or 617-847-3007 outside the US and Canada. Investors should refer to the Bruker Corporation Earnings Call. A telephone replay of the conference call will be available one hour after the conference call by dialing 888-286-8010 in the US and Canada, or 617-801-6888 outside the US and Canada, and then entering replay pass code 13763010. ABOUT BRUKER CORPORATION (NASDAQ:BRKR) As of February 26, 2008, Bruker Corporation has become the parent company of the entire Bruker group of companies. Bruker Corporation now operates in two segments, the life science and analytical (LSA) systems segment, and the international advanced superconductor (IAS) segment. For more information, please visit www.bruker.com. CAUTIONARY STATEMENT Any statements contained in this press release that do not describe historical facts may constitute forward-looking statements as that term is defined in the Private Securities Litigation Reform Act of 1995. Any forward-looking statements contained herein are based on current expectations, but are subject to a number of risks and uncertainties. The factors that could cause actual future results to differ materially from current expectations include, but are not limited to, risks and uncertainties relating to the integration of businesses we have acquired or may acquire in the future, changing technologies, product development and market acceptance of our products, the cost and pricing of our products, manufacturing, competition, dependence on collaborative partners and key suppliers, capital spending and government funding policies, changes in governmental regulations, intellectual property rights, litigation, and exposure to foreign currency fluctuations. These and other factors are identified and described in more detail in our filings with the SEC, including, without limitation, our annual report on Form 10-K for the year ended December 31, 2006, our most recent quarterly reports on Form 10-Q and our current reports on Form 8-K. We disclaim any intent or obligation to update these forward-looking statements other than as required by law. Bruker Corporation (including Bruker BioSpin Group)CONDENSED CONSOLIDATED STATEMENTS OF OPERATIONS(in thousands, except per share data)                 Three Months EndedDecember 31, Twelve Months EndedDecember 31,   2007   2006   2007   2006     Product revenue $ 303,875 $ 233,845 $ 913,238 $ 758,532 Service revenue 37,758 25,938 115,419 87,873 Other revenue   1,438     1,762     3,791     4,602   Total revenue 343,071 261,545 1,032,448 851,007   Cost of product revenue 157,207 115,539 489,246 399,182 Cost of service revenue   24,407     15,991     73,591     53,207   Total cost of revenue   181,614     131,530     562,837     452,389     Gross profit margin 161,457 130,015 469,611 398,618 Operating Expenses: Sales and marketing 45,965 39,069 156,783 131,393 General and administrative 17,165 14,739 59,600 51,853 Research and development 30,289 27,227 110,751 102,611 Acquisition related charges   6,868     (105 )   7,412     5,724   Total operating expenses   100,287     80,930     334,546     291,581     Operating income 61,170 49,085 135,065 107,037   Interest and other income (expense), net   1,206     (1,493 )   5,750     4,716     Income before income tax provision and minority interest in consolidated subsidiaries 62,376 47,592 140,815 111,753 Income tax provision   25,378     12,043     43,278     36,927       Income before minority interest in consolidated subsidiaries 36,998 35,549 97,537 74,826 Minority interest in consolidated subsidiaries   44     (67 )   299     8   Net income $ 36,954   $ 35,616   $ 97,238   $ 74,818     Net income per share: Basic $ 0.23   $ 0.22   $ 0.60   $ 0.47   Diluted $ 0.22   $ 0.22   $ 0.59   $ 0.47     Weighted average shares outstanding: Basic   162,053     159,046     161,247     159,057   Diluted   164,725     160,915     164,314     160,106   Bruker Corporation (including Bruker BioSpin Group)CONDENSED CONSOLIDATED BALANCE SHEETS(in thousands)         December 31,   December 31, 2007 2006 ASSETS   Current assets: Cash and short-term investments $ 344,504 $ 325,689 Accounts receivable, net 185,217 147,693 Inventories 447,688 408,892 Other current assets   57,288   46,306 Total current assets 1,034,697 928,580   Property and equipment, net 207,588 190,442 Intangible and other assets   69,346   57,558   Total assets $ 1,311,631 $ 1,176,580 LIABILITIES AND SHAREHOLDERS' EQUITY   Current liabilities: Short-term borrowings $ 34,846 $ 27,190 Accounts payable 52,293 46,407 Other current liabilities   474,052   430,821 Total current liabilities 561,191 504,418   Long-term debt 6,394 26,995 Other long-term liabilities 107,656 71,648 Minority interest in subsidiaries 538 239   Total shareholders' equity   635,852   573,280   Total liabilities and shareholders' equity $ 1,311,631 $ 1,176,580

1 Year Bruker Chart

1 Year Bruker Chart

1 Month Bruker Chart

1 Month Bruker Chart

Your Recent History

Delayed Upgrade Clock