| Share Name | Share Symbol | Market | Type |
|---|---|---|---|
| New Pacific Metals Corporation | AMEX:NEWP | AMEX | Common Stock |
| Price Change | % Change | Share Price | High Price | Low Price | Open Price | Shares Traded | Last Trade | |
|---|---|---|---|---|---|---|---|---|
| 0.02 | 1.69% | 1.20 | 5,500 | 14:04:04 |
UNITED STATES
SECURITIES
AND EXCHANGE COMMISSION
Washington, D.C. 20549
FORM
or
For
the fiscal year ended
Commission
File Number
(Exact name of Registrant as specified in its charter)
(Province or Other Jurisdiction of Incorporation or Organization) | 1040 (Primary Standard Industrial Classification Code) | Not
Applicable (I.R.S. Employer Identification No.) |
(Address and telephone number of Registrant’s principal executive offices)
(Name, address (including zip code) and telephone number (including area code) of agent for service in the United States) |
Securities registered or to be registered pursuant to Section 12(b) of the Act:
| Title of Each Class: | Trading Symbol: | Name of Each Exchange On Which Registered: |
Securities registered pursuant to Section 12(g) of the Act: None
Securities for which there is a reporting obligation pursuant to Section 15(d) of the Act: None
For annual reports, indicate by check mark the information filed with this form:
Indicate
the number of outstanding shares of each of the issuer’s classes of capital or common stock as of the close of the period covered
by the annual report:
Indicate
by check mark whether the Registrant (1) has filed all reports required to be filed by Section 13 or 15(d) of the Exchange Act during
the preceding 12 months (or for such shorter period that the Registrant was required to file such reports) and (2) has been subject to
such filing requirements for the past 90 days. ☒
Indicate
by check mark whether the Registrant has submitted electronically every Interactive Data File required to be submitted pursuant to Rule
405 of Regulation S-T (§232.405 of this chapter) during the preceding 12 months (or for such shorter period that the Registrant
was required to submit and post such files). ☒
Indicate by check mark whether the Registrant is an emerging growth company as defined in Rule 12b-2 of the Exchange Act.
Emerging
Growth Company
If
an emerging growth company that prepares its financial statements in accordance with U.S. GAAP, indicate by check mark if the Registrant
has elected not to use the extended transition period for complying with any new or revised financial accounting standards† provided
pursuant to Section 13(a) of the Exchange Act.
† The term “new or revised financial accounting standard” refers to any update issued by the Financial Accounting Standards Board to its Accounting Standards Codification after April 5, 2012.
Indicate
by check mark whether the Registrant has filed a report on and attestation to its management’s assessment of the effectiveness
of its internal control over financial reporting under Section 404(b) of the Sarbanes-Oxley Act (15 U.S.C. 7262(b)) by the registered
public accounting firm that prepared or issued its audit report.
If
securities are registered pursuant to Section 12(b) of the Act, indicate by check mark whether the financial statements of the registrant
included in the filing reflect the correction of an error to previously issued financial statements. (1)
Indicate by check mark whether any of those error corrections are restatements that required a recovery analysis of incentive-based compensation received by any of the registrant’s executive officers during the relevant recovery period pursuant to §240.10D-1(b).(1) ☐
| (1) | Check boxes are blank until we are required to have a recovery policy under the applicable NYSE American listing standard. |
EXPLANATORY NOTE
New Pacific Metals Corp. (“we”, “us”, “our”, the “Company” or the “issuer”) is a Canadian corporation that is permitted, under a multijurisdictional disclosure system adopted by the United States, to prepare this annual report on Form 40-F (“Annual Report”) pursuant to Section 13 of the Securities Exchange Act of 1934, as amended (the “Exchange Act”), in accordance with disclosure requirements in effect in Canada, which are different from those of the United States.
FORWARD LOOKING STATEMENTS
This Annual Report, including the Exhibits incorporated by reference into Annual Report, contains “forward-looking information” and “forward-looking statements” within the meaning of applicable Canadian and U.S. securities legislation. The forward-looking statements herein are made as of the respective dates set forth in the Exhibits incorporated by reference into this Annual Report, and the Company does not assume any obligation to update or revise them to reflect new information, estimates or opinions, future events or results or otherwise, except as required by applicable law. Often, but not always, forward-looking statements can be identified by the use of words such as “plans”, “expects”, “is expected”, “budgets”, “scheduled”, “estimates”, “forecasts”, “predicts”, “projects”, “intends”, “targets”, “aims”, “anticipates” or “believes” or variations (including negative variations) of such words and phrases or may be identified by statements to the effect that certain actions “may”, “could”, “should”, “would”, “might” or “will” be taken, occur or be achieved. Estimates of mineral reserves and mineral resources are also forward-looking statements because they represent estimates of mineralization that will be encountered if a property is mined, in addition to involving projection relating to future economic conditions. Forward-looking statements and information are based on forecasts of future results, estimates of amounts not yet determinable and assumptions that, while believed by management to be reasonable, are inherently subject to significant business, economic and competitive uncertainties, and contingencies. Forward-looking statements and information are subject to various known and unknown risks and uncertainties, many of which are beyond the ability of the Company to control or predict, that may cause the Company’s actual results, performance or achievements to be materially different from those expressed or implied thereby, and are developed based on assumptions about such risks, uncertainties and other factors set out herein, including but not limited to: the Company’s ability to carry on current and future operations, including: the effects of a public health crisis on our operations and workforce; development and exploration activities; the timing, extent, duration and economic viability of such operations; the accuracy and reliability of estimates, projections, forecasts, studies and assessments; the Company’s ability to meet or achieve estimates, projections and forecasts; the stabilization of the political climate in Bolivia and/or other jurisdictions where the Company operates; the availability and cost of inputs; the price and market for outputs; foreign exchange rates; taxation levels; the timely receipt of necessary approvals or permits, including the ratification and approval of the mining production contract with Corporación Minera de Bolivia by the Plurinational Legislative Assembly of Bolivia; the ability of the Company’s Bolivian partner to convert the exploration licenses at the Carangas project to an administrative mining contract; the ability to meet current and future obligations; the ability to obtain timely financing on reasonable terms when required; the current and future social, economic and political conditions; silver and gold price volatility; uncertainty related to mineral exploration properties; lack of infrastructure at mineral exploration properties; risks and uncertainties relating to the interpretation of drill results and the geology, grade and continuity of mineral deposits; uncertainties related to title to mineral properties and the acquisition of surface rights; risks related to governmental regulations, including environmental laws and regulations and liability and obtaining permits and licenses; future changes to environmental laws and regulations; unknown environmental risks from past activities; commodity price fluctuations; risks related to reclamation activities on mineral properties; risks related to political instability and unexpected regulatory change; currency fluctuations; influence of third party stakeholders; conflicts of interest; risks related to dependence on key individuals; risks related to the involvement of some of the directors and officers of the Company with other natural resource companies; enforceability of claims; the ability to maintain adequate control over financial reporting; disruptions or changes in the credit or security markets; actual results of current exploration activities; mineral reserve and mineral resource estimate risk; actual results of current reclamation activities; conclusions of economic evaluations; changes in project parameters as plans continue to be refined; changes in labour costs or other costs of production; labour disputes and other risks of the mining industry; delays in obtaining governmental approvals or financing or in the completion of development or construction activities; the ability to renew existing licenses or permits or obtain required licenses and permits; increased infrastructure and/or operating costs; risks of not meeting production and cost targets; discrepancies between actual and estimated production; metallurgical recoveries; mining operational and development risk; litigation risks; speculative nature of silver exploration; global economic climate;
dilution; environmental risks; community and nongovernmental actions; regulatory risks; U.S. securities laws; and cyber-security risks; and other assumptions and factors generally associated with the mining industry. The Company undertakes no obligation to update forward-looking information except as required by applicable law. Such forward-looking information represents management’s best judgment based on information currently available. No forward-looking statement can be guaranteed, and actual future results may vary materially. Accordingly, readers are advised not to place undue reliance on forward-looking statements or information. Some of the disclosure in this Annual Report and the Exhibits incorporated by reference to this Annual Report is based on information publicly disclosed by the owners or operators of these properties and information/data available in the public domain as at the date hereof, and none of this information has been independently verified by the Company. Readers are cautioned that forward-looking statements are not guarantees of future performance. All of the forward-looking statements made in this Annual Report and the Exhibits incorporated by reference to this Annual Report are qualified by these cautionary statements.
DIFFERENCES IN UNITED STATES AND CANADIAN REPORTING PRACTICES
The Company is permitted, under a multijurisdictional disclosure system adopted by the United States, to prepare this Annual Report in accordance with Canadian disclosure requirements, which are different from those of the United States. The Company prepares its financial statements, which are filed with this Annual Report in accordance with International Financial Reporting Standards as issued by the International Accounting Standards Board. Therefore, they are not comparable in all respects to financial statements of United States companies that are prepared in accordance with United States generally accepted accounting principles.
MINERAL RESOURCE AND MINERAL RESERVE ESTIMATES
Unless otherwise indicated, all mineral resource and mineral reserve estimates included in the documents incorporated by reference into this Annual Report have been prepared in accordance with Canadian National Instrument 43-101 (“NI 43-101”) and the Canadian Institute of Mining and Metallurgy Classification System. NI 43-101 is a rule developed by the Canadian securities administrators, which establishes standards for all public disclosure an issuer makes of scientific and technical information concerning mineral projects. Canadian standards, including NI 43-101, differ significantly from the requirements of the United States Securities and Exchange Commission (the “SEC”). Accordingly, mineral resource and mineral reserve estimates, and other scientific and technical information, contained in the documents incorporated by reference into this Annual Report may not be comparable to similar information disclosed by U.S. companies.
PRINCIPAL DOCUMENTS
The following documents, filed as Exhibits 99.1, 99.2 and 99.3 to this Annual Report, are hereby incorporated by reference into this Annual Report on Form 40-F:
| (a) | Annual Information Form for the fiscal year ended June 30, 2023; |
| (b) | Management’s Discussion and Analysis for the fiscal year ended June 30, 2023; and |
| (c) | Audited Consolidated Financial Statements for the fiscal year ended June 30, 2023 and notes thereto, together with the report of the independent registered public accounting firm thereon. |
CONTROLS AND PROCEDURES
| (a) | Disclosure Controls and Procedures. See Exhibit 99.2, under the heading “Disclosure Controls and Procedures”. |
| (b) | Management’s Annual Report on Internal Control Over Financial Reporting. See Exhibit 99.2, under the heading “Management’s Report on Internal Control Over Financial Reporting”. |
| (c) | Attestation Report of the Independent Registered Public Accounting Firm. This Annual Report does not include an attestation report of the Company’s registered public accounting firm due to a transition period established by rules of the SEC for emerging growth companies. |
| (d) | Changes in Internal Control Over Financial Reporting. See Exhibit 99.2, under the heading “Changes in Internal Control Over Financial Reporting”. |
NOTICES PURSUANT TO REGULATION BTR
The Company was not required by Rule 104 of Regulation BTR to send any notices to any of its directors or executive officers during the fiscal year ended June 30, 2023.
AUDIT COMMITTEE FINANCIAL EXPERT
See Exhibit 99.1, under the heading “11.3 Relevant Education and Experience”.
CODE OF ETHICS
The Board has adopted a written code of ethics entitled, “Code of Business Conduct and Ethics” (the “Code”), by which it and all officers and employees of the Company, including the Company’s principal executive officer, principal financial officer, principal accounting officer or controller, and persons performing similar functions, are required to abide. There were no amendments to the Code, or waivers of the Code that apply to the Company’s principal executive officer, principal financial officer, principal accounting officer or controller, or persons performing similar functions during the fiscal year ended June 30, 2023.
The Code is also posted on the Company’s website at https://newpacificmetals.com/company/corporate-governance, and a copy of the Code may be obtained, without charge, by contacting the Corporate Secretary of the Company at the address or telephone number indicated on the cover page of this Annual Report. If there is an amendment to the Code, or if a waiver of the Code is granted to any of the Company’s principal executive officer, principal financial officer, principal accounting officer or controller, or persons performing similar functions, the Company intends to disclose any such amendment or waiver by posting such information on the Company’s website. Unless and to the extent specifically referred to herein, the information on the Company’s website shall not be deemed to be incorporated by reference in this Annual Report on Form 40-F.
PRINCIPAL ACCOUNTANT FEES AND SERVICES
See Exhibit 99.1, under the heading “11.6 External Auditor Service Fees”.
AUDIT COMMITTEE PRE-APPROVAL POLICIES AND PROCEDURES
See Exhibit 99.1, under the heading “11.5 Pre-Approval Policies and Procedures”. All audit-related fees, tax fees, or all other fees were approved by the Audit Committee pursuant to Rule 2-01(c)(7)(i) of Regulation S-X. However, none of such fees were approved pursuant to the exemption provided in Rule 2-01(c)(7)(i)(C) of Regulation S-X.
OFF BALANCE ARRANGEMENTS
The Company has no off-balance sheet arrangements.
CONTRACTUAL AND OTHER OBLIGATIONS
Information regarding our contractual and other obligations is included in the Management Discussion and Analysis incorporated herein by reference to Exhibit 99.2, under the heading “Liquidity and Capital Resources” and “Financial Instruments”.
IDENTIFICATION OF THE AUDIT COMMITTEE
The Company’s Board has a separately designated standing Audit Committee established in accordance with Section 3(a)(58)(A) of the Exchange Act. The Company’s Audit Committee is comprised of Maria Tang, Terry Salman and Dickson Hall. The Board has determined that each of the members of the Audit Committee is independent as determined under Rule 10A-3 of the Exchange Act and Section 803 of the NYSE American Company Guide.
MINE SAFETY DISCLOSURE
The Company does not operate any mine in the United States and has no mine safety incidents to report for the year ended June 30, 2023.
DISCLOSURE REGARDING FOREIGN JURISDICTIONS THAT PREVENT INSPECTIONS
Not applicable.
NYSE AMERICAN STATEMENT OF CORPORATE GOVERNANCE DIFFERENCES
The common shares of the Company are listed on the NYSE American. Section 110 of the NYSE American company guide permits NYSE American to consider the laws, customs and practices of foreign issuers in relaxing certain NYSE American listing criteria, and to grant exemptions from NYSE American listing criteria based on these considerations. A description of the significant ways in which the Company’s governance practices differ from those followed by domestic companies pursuant to NYSE American standards is provided on the Company’s website at https://newpacificmetals.com/ company/corporate-governance/.
UNDERTAKINGS
The Company undertakes to make available, in person or by telephone, representatives to respond to inquiries made by the SEC staff, and to furnish promptly, when requested to do so by the SEC staff, information relating to: the securities in relation to which the obligation to file an annual report on Form 40-F arises; or transactions in said securities.
CONSENT TO SERVICE OF PROCESS
The Company has previously filed with the SEC an Appointment of Agent for Service of Process and Undertaking on Form F-X with respect to the class of securities in relation to which the obligation to file this Form 40-F arises. Any change to the name or address of the Company’s agent for service shall be communicated promptly to the SEC by amendment to the Form F-X referencing the file number of the Company.
EXHIBITS
EXHIBIT INDEX
The following documents are being filed with the SEC as exhibits to this Registration Statement on Form 40-F.
SIGNATURES
Pursuant to the requirements of the Exchange Act, the Registrant certifies that it meets all of the requirements for filing on Form 40-F and has duly caused this Annual Report to be signed on its behalf by the undersigned, thereunto duly authorized.
| New Pacific Metals Corp. | |
| /s/ Andrew Williams | |
| Name: Andrew Williams | |
| Title: Chief Executive Officer | |
| Date: September 22, 2023 |
EXHIBIT INDEX
The following documents are being filed with the SEC as exhibits to this Registration Statement on Form 40-F.
Exhibit 99.1
ANNUAL INFORMATION FORM
For the year ended June 30, 2023

Dated as at September 22, 2023
NEW PACIFIC METALS CORP.
Suite 1750 - 1066 West Hastings Street
Vancouver, BC, Canada V6E 3X1
Tel: (604) 633-1368
Fax: (604) 669-9387
Email: info@newpacificmetals.com
Website: www.newpacificmetals.com
Table of Contents
| ITEM 16: | MATERIAL CONTRACTS | 53 |
| ITEM 17: | INTERESTS OF EXPERTS | 53 |
| ITEM 18: | ADDITIONAL INFORMATION | 54 |
| SCHEDULE “A” | 55 | |
| Item 1: | GENERAL |
| 1.1 | Date of Information |
All information in this Annual Information Form (“AIF”) is as of June 30, 2023, unless otherwise indicated.
| 1.2 | Forward-Looking Statements |
Except for statements of historical fact relating to New Pacific Metals Corp. (the “Company” or “New Pacific”), certain statements and information contained in this AIF that are not current or historic factual statements, constitute “forward-looking information” or “forward-looking statements” (collectively, “forward-looking information”) within the meaning of the United States Private Securities Litigation Reform Act of 1995 and applicable Canadian provincial securities laws. Any statements or information that express or involve discussions with respect to predictions, expectations, beliefs, plans, projections, objectives, assumptions or future events or performance (often, but not always, using words or phrases such as “expects”, “is expected”, “anticipates”, “believes”, “plans”, “projects”, “estimates”, “assumes”, “intends”, “strategies”, “targets”, “goals”, “forecasts”, “objectives”, “budgets”, “schedules”, “potential” or variations thereof or stating that certain actions, events or results “may”, “could”, “would”, “might” or “will” be taken, occur or be achieved, or the negative of any of these terms and similar expressions) are not statements of historical fact and may be forward-looking statements or information. Such statements include, but are not limited to: statements regarding anticipated exploration, drilling, development, construction, and other activities or achievements of the Company; inferred, indicated or measured mineral resources or mineral reserves on the Company’s projects; the results of any preliminary economic assessment (“PEA”), pre-feasibility study (“PFS”), mineral resource estimate (“MRE”) and other technical reports; timing of receipt of permits and regulatory approvals, including approvals of mining association contracts; estimates of the Company’s revenues and capital expenditures; the acquisition of other businesses, assets or securities; the growth of Company’s mineral resources through acquisitions and exploration; future securities offerings and use of proceeds therefrom; the terms of the Company’s securities; use of proceeds; capital expenditures; success of exploration activities; government regulation of mining operations; environmental risks; and other forecasts and predictions with respect to the Company and its properties.
Forward-looking statements or information are subject to a variety of known and unknown risks, uncertainties and other factors that could cause actual events or results to differ from those reflected in the forward-looking statements or information, including, without limitation, risks relating to: global economic and social impact of public health crisis (such as a resurgence of the COVID-19 novel coronavirus); fluctuating equity prices, bond prices, commodity prices; calculation of resources, reserves and mineralization, general economic conditions, foreign exchange risks, interest rate risk, foreign investment risk; loss of key personnel; conflicts of interest; dependence on management, uncertainties relating to the availability and costs of financing needed in the future, environmental risks, operations and political conditions, the regulatory environment in Bolivia and Canada, risks associated with community relations and corporate social responsibility, and other factors described under the heading “Risk Factors” in this AIF. This list is not exhaustive of the factors that may affect any of the Company’s forward-looking statements or information.
The forward-looking statements are necessarily based on a number of estimates, assumptions, beliefs, expectations and opinions of management as of the date of this AIF that, while considered reasonable by management, are inherently subject to significant business, economic and competitive uncertainties and contingencies. These estimates, assumptions, beliefs, expectations and options include, but are not limited to, those related to the Company’s ability to carry on current and future operations, including: public health crisis on our operations and workforce; development and exploration activities; the timing, extent, duration and economic viability of such operations; the accuracy and reliability of estimates, projections, forecasts, studies and assessments; the Company’s ability to meet or achieve estimates, projections and forecasts; the stabilization of the political climate in Bolivia; the Company’s ability to obtain and maintain social license at its mineral properties; the availability and cost of inputs; the price and market for outputs; foreign exchange rates; taxation levels; the timely receipt of necessary approvals or permits, including the ratification and approval of the Mining Production Contract (“MPC”) with Corporación Minera de Bolivia (“COMIBOL”), the Bolivian state mining corporation, by the Plurinational Legislative Assembly of Bolivia; the ability of the Company’s Bolivian partner to convert the exploration licenses at the Carangas Project (as defined below) to Administrative Mining Contract (“AMC”); the ability to meet current and future obligations; the ability to obtain timely financing on reasonable terms when required; the current and future social, economic and political conditions; and other assumptions and factors generally associated with the mining industry.
Although the forward-looking statements contained in this AIF are based upon what management believes are reasonable assumptions, there can be no assurance that actual results will be consistent with these forward-looking statements. All forward-looking statements in this AIF are qualified by these cautionary statements. The forward-looking statements contained in this AIF are made as of the date of such document and, accordingly, is subject to change after such date. Accordingly, readers should not place undue reliance on such statements. Other than specifically required by applicable laws, the Company is under no obligation and
4
expressly disclaims any such obligation to update or alter the forward-looking statements whether as a result of new information, future events or otherwise except as may be required by law. These forward-looking statements are made as of the date of this AIF.
| 1.3 | Cautionary Note Regarding Results of Preliminary Economic Assessment |
The results of the independent preliminary economic assessment and technical report prepared in accordance with National Instrument 43-101 – Standards of Disclosure for Mineral Projects (“NI 43-101”) titled “Technical Report – Silver Sand Deposit Preliminary Economic Assessment” dated February 16, 2023 and with an effective date of November 30, 2022 (the “Silver Sand Technical Report”) and prepared by certain qualified persons (as defined in NI 43-101) associated with AMC Mining Consultants (Canada) Ltd. (the “AMC Consultants”) are preliminary in nature and are intended to provide an initial assessment of the Silver Sand Project’s economic potential and development options of the Silver Sand Project (as defined below). The PEA mine schedule and economic assessment includes numerous assumptions and is based on both indicated and inferred mineral resources. Inferred resources are considered too speculative geologically to have the economic considerations applied to them that would enable them to be categorized as mineral reserves, and there is no certainty that the project economic assessments described herein will be achieved or that the PEA results will be realized. The estimate of mineral resources may be materially affected by geology, environmental, permitting, legal, title, socio-political, marketing or other relevant issues. Mineral resources are not mineral reserves and do not have demonstrated economic viability. Additional exploration will be required to potentially upgrade the classification of the inferred mineral resources to be considered in future advanced studies. AMC Consultants (mineral resource, mining, infrastructure and financial analysis) was contracted to conduct the PEA in cooperation with Halyard Inc. (metallurgy and processing), and NewFields Canada Mining & Environment ULC (tailings, water and waste management). The qualified persons for the PEA for the purposes of NI 43-101 are Mr. John Morton Shannon, P.Geo, General Manager and Principal Geologist at AMC Consultants, Mr. Wayne Rogers, P.Eng, and Mr. Mo Molavi, P.Eng, both Principal Mining Engineers with AMC Consultants, Mr. Andrew Holloway P.Eng, Process Director with Halyard Inc., and Mr. Leon Botham P.Eng., Principal Engineer with NewFields Canada Mining & Environment ULC, in addition to Ms. Dinara Nussipakynova, P.Geo., Principal Geologist with AMC Consultants, who estimated the mineral resources (collectively, the “Silver Sand Technical Report Authors”). All qualified persons for the PEA have reviewed the disclosure of the PEA herein. The PEA is based on the mineral resource estimate (the “Silver Sand MRE”), which was reported on November 28, 2022. The effective date of the Silver Sand MRE is October 31, 2022. The cut-off applied for reporting the pit-constrained mineral resources is 30 g/t silver. Assumptions made to derive a cut-off grade included mining costs, processing costs and recoveries and were obtained from comparable industry situations. The model is depleted for historical mining activities. Mineral resources are constrained by optimized pit shells at a silver price of US$22.50 per ounce, silver metallurgical recovery of 91%, silver payability of 99%, open pit mining cost of US$2.6/t, processing cost of US$16/t, G&A cost of US$2/t, and slope angle of 44-47 degrees. Key assumptions used for pit optimization for the PEA mining pit include silver price of US$22.50 per ounce, silver metallurgical recovery of 91%, silver payability of 99%, open pit mining cost of US$2.6/t, incremental mining cost of US$0.04/t (per 10 m bench), processing cost of US$16/t, tailing storage facility operating cost of US$0.7/t, G&A cost of US$2/t, royalty of 6.00%, mining recovery of 92%, dilution of 8%, and cut-off grade of 30 g/t silver.
| 1.4 | Cautionary Note to U.S. Investors Concerning Preparation of Mineral Resource and Mineral Reserve Estimates |
This AIF has been prepared in accordance with the securities laws in effect in Canada which differ from the requirements of the United States of America (“U.S.” or “United States”) securities laws. The technical and scientific information contained herein has been prepared in accordance with NI 43-101, which differs from the standards adopted by the U.S. Securities and Exchange Commission (the “SEC”) under subpart 1300 of Regulation S-K (the “SEC Modernization Rules”). The Company is not currently subject to the SEC Modernization Rules. Accordingly, the Company’s disclosure of mineralization and other technical information herein may differ significantly from the information that would be disclosed had the Company prepared such information under the standards adopted under the SEC Modernization Rules.
Readers are cautioned not to assume that all or any part of mineral resources will ever be converted into reserves. Pursuant to the Canadian Institute of Mining Definition Standards on Mineral Resources and Reserves (the “CIM Standards”), inferred mineral resources are that part of a mineral resource for which quantity and grade or quality are estimated on the basis of limited geological evidence and sampling. Such geological evidence is sufficient to imply but not verify geological and grade or quality continuity. An inferred mineral resource has a lower level of confidence than that applying to an indicated mineral resource and must not be converted to a mineral reserve. However, it is reasonably expected that the majority of inferred mineral resources could be upgraded to indicated mineral resources with continued exploration. Under Canadian rules, estimates of inferred mineral resources may not form the basis of feasibility or pre-feasibility studies, except in rare cases. Investors are cautioned not to assume that all or any part of an inferred mineral resource is economically or legally mineable.
5
| 1.5 | Currency |
All sums of money which are referred to herein are expressed in U.S. dollars, unless otherwise specified. The symbol “CAD$” denotes lawful money of Canada. The following table sets forth, for each of the periods indicated, the year-end exchange rate, the average closing rate and the high and low closing exchange rates for one Canadian dollar expressed in U.S. dollars, as quoted by the Bank of Canada:
|
Year Ended June 30, | |||
|
2023 |
2022 |
2021 | |
| High | 0.7841 | 0.8111 | 0.8306 |
| Low | 0.7217 | 0.7669 | 0.7344 |
| Average | 0.7467 | 0.7902 | 0.7807 |
| Period End | 0.7553 | 0.7760 | 0.8068 |
The exchange rate for one Canadian dollar expressed in U.S. dollars based upon the daily average exchange rate on June 30, 2023 provided by the Bank of Canada was $0.7553.
| Item 2: | CORPORATE STRUCTURE |
| 2.1 | Names, Current Address and Incorporation |
The Company was formed as a special limited company under the Company Act (British Columbia) on April 19, 1972. By special resolution of its shareholders dated July 21, 1983, the Company converted itself from a special limited company to a limited company. Subsequently, on November 6, 1997, the Company continued in Bermuda by way of continuation as a foreign corporation. On November 5, 2003, the Company continued in British Columbia under the Company Act (British Columbia). In 2004, the Company adopted new Articles consistent with the transition to the Business Corporations Act (British Columbia). On July 1, 2016, the Company’s name was changed to “New Pacific Holdings Corp.” On July 20, 2017, the Company’s name was changed back to “New Pacific Metals Corp.” The head office, principal address, and registered and records office of the Company is located at Suite 1750 – 1066 West Hastings Street, Vancouver, British Columbia, Canada V6E 3X1.
The Company is a reporting issuer in British Columbia, Alberta, Saskatchewan, Manitoba, Ontario, Quebec, New Brunswick, Nova Scotia, Prince Edward Island, and Newfoundland. The common shares of the Company (the “Shares”) trade on the Toronto Stock Exchange (“TSX”) under the symbol “NUAG” and on the NYSE American, LLC (the “NYSE American”) under the symbol “NEWP”.
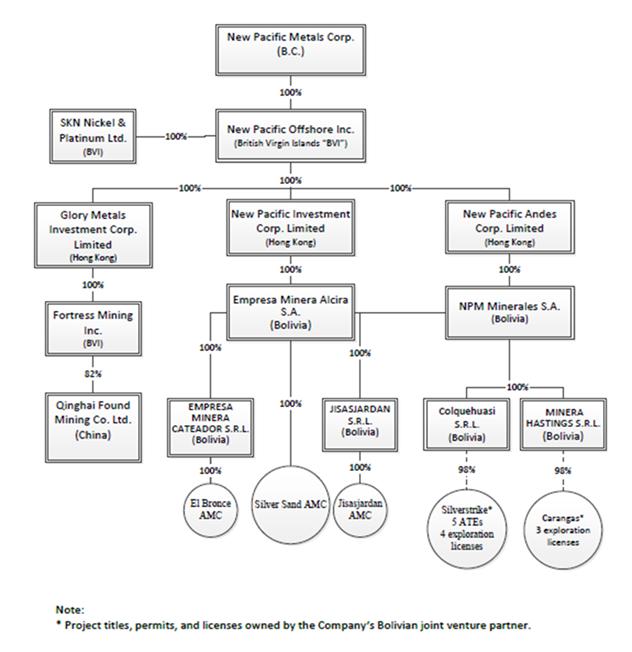
| 2.2 | Intercorporate Relationships |
The corporate structure of the Company and its subsidiaries, as of June 30, 2023, is as follows:
6
| Item 3: | GENERAL DEVELOPMENT OF THE BUSINESS |
| 3.1 | Business of New Pacific |
The Company is a Canadian mining issuer engaged in exploring and developing mineral properties in Bolivia. The Company’s precious metal projects include the flagship Silver Sand project (the “Silver Sand Project”), the Carangas project (the “Carangas Project”) and the Silverstrike project (the “Silverstrike Project”). With experienced management and sufficient technical and financial resources, management believes the Company is well positioned to create shareholder value through exploration and resource development.
| 3.2 | Three Year History |
| (a) | Year ended June 30, 2023 |
7
On September 18, 2023, the Company filed its independent technical report prepared in accordance with NI 43-101 titled “Carangas Silver-Gold Project – Department of Oruro, Bolivia – NI 43-101 Mineral Resource Estimate Technical Report” with an effective date of August 25, 2023 (the “Carangas Technical Report”) and prepared by Anderson Goncalves Candido, FAusIMM, Principal Resource Geologist with RPMGlobal (Canada) Ltd. (“RPM”). The qualified person for section 13 of the Carangas Technical Report is Marcelo del Giudice, FAusIMM, Principal Metallurgist with RPM.
On September 11, 2023, the Company announced the appointment of Mr. Andrew Williams as Chief Executive Officer (“CEO”) and that Dr. Rui Feng, founder of the Company, had stepped down as CEO. The Company also appointed Mr. Paul Simpson as director of the Company.
On September 5, 2023, the Company reported the inaugural independent NI 43-101 mineral resource estimate for its Carangas Project (the “Carangas MRE”). The Carangas MRE was completed by RPM. The effective date of the Carangas MRE is August 25, 2023. Highlights of the Carangas MRE are as follows:
| § | Total indicated mineral resources of 214.9 million tonnes (“Mt”) containing 205.3 million ounces (“Mozs”) of silver (“Ag”), 1,588.2 thousand ounces (“Kozs”) of gold (“Au”), 1,444.9 million pounds (“Mlbs”) of lead (“Pb”), 2,653.7 Mlbs of zinc (“Zn”), and 112.6 Mlbs of copper (“Cu”); or collectively 559.8 Mozs silver equivalent (“AgEq”). |
| § | Total inferred mineral resources of 45.0 Mt containing 47.7 Mozs of silver, 217.7 Kozs of gold, 297.9 Mlbs of lead, 533.7 Mlbs of zinc, and 16.8 Mlbs of copper; or collectively 109.8 Mozs AgEq. |
| § | Carangas is a globally significant Ag-Au polymetallic discovery. |
| § | Mineralization starts at or near surface, potentially allowing for open-pit mining with an average stripping ratio for the conceptual pit of approximately 1.8:1 (tonnes of waste : tonnes of mineral resource). |
| § | Below the pit constraint, substantial gold-dominant mineralization, similar in size and grade to the reported gold domain (as defined below), has the potential for conversion to underground mineable resources pending further evaluation for reasonable prospects of eventual economic extraction. |
| § | Favorable initial metallurgical test work indicates laboratory-based recoveries of up to 90% for silver and 98% for gold based on a combination of flotation and cyanide leaching. |
On August 22, 2023, the Company filed the final short form base shelf prospectus (the “2023 Prospectus”) with the securities regulatory authorities in each of the provinces of Canada and a corresponding shelf registration statement on Form F-10 with the United States Securities and Exchange Commission (the “Registration Statement”). The 2023 Prospectus and the Registration Statement are expected to provide the Company with flexibility and efficiency in future financings, if and when needed, and replaces the Company’s prior base shelf prospectus, which was filed in July 2021 and expired in August 2023.
The 2023 Prospectus and Registration Statement enable the Company to make offerings of up to US$200,000,000 of Shares, preferred shares, debt securities, warrants, units or subscription receipts of the Company, or any combination thereof, from time to time, separately or together, in amounts, at prices and on terms to be determined based on market conditions at the time of the offering and as set out in an accompanying prospectus supplement (each, a “Prospectus Supplement”), during the 25-month period that the 2023 Prospectus is effective.
On July 6, 2023, the Company announced the assay results of the last 18 drill holes from its 2023 dill program at its Carangas Project. The 2023 drill program was completed with 17,623 m in 39 holes. For details of the 2023 drill program, please refer to the Company’s news releases dated July 6, 2023 and May 30, 2023, filed under the Company’s profile on SEDAR+ at www.sedarplus.ca, with the SEC on EDGAR at www.sec.gov/edgar, and on the Company’s website at www.newpacificmetals.com
On April 6, 2023, the Company announced the assay results of the last 29 drill holes from the 2022 drill program at its Carangas Project. The 2022 drill program was completed with 50,368 m drilled in 115 holes. For details of the 2022 drill program, please refer to the Company’s news releases dated April 6, 2023, February 21, 2023, February 1, 2023, January 24, 2023, November 14, 2022, October 19, 2022, August 8, 2022, and July 13, 2022, filed under the Company’s profile on SEDAR+ at www.sedarplus.ca, with the SEC on EDGAR at www.sec.gov/edgar, and on the Company’s website at www.newpacificmetals.com
On February 16, 2023, the Company filed the Silver Sand Technical Report. AMC Consultants (mineral resource, mining, infrastructure and financial analysis) was contracted to conduct the Silver Sand Technical Report in cooperation with Halyard Inc. (metallurgy and processing), and New Fields Canada Mining & Environment ULC (tailings, water and water management). The Silver Sand Technical Report is based on the Silver Sand MRE, which was reported on November 28, 2022. Highlights from the Silver Sand Technical Report, with a base case silver price of $22.50/oz are as follows:
8
| § | pre-tax NPV (5%) of $1.1 billion with an IRR of 52%, and a post-tax NPV (5%) of $726 million with an IRR of 39%; |
| § | using a +/- 20% sensitivity analysis for silver price, a post-tax NPV (5%) of $1,054 million with an IRR of 50% at $27/oz silver, or a post-tax NPV (5%) of $398 million with an IRR of 26% at $18/oz silver; |
| § | 14-year mine life producing approximately 171 million ounces payable silver metal; |
| § | initial capital cost of $308 million, which includes $52 million in contingency cost; |
| § | life-of-mine (“LOM”) total sustaining capital cost of $20 million; |
| § | average LOM operating cash cost of $8.45/oz and total all-in sustaining cost of $10.42/oz silver; and |
| § | annual payable metal production exceeds 15 million ounces of silver in years one through four, with LOM average annual payable metal production exceeding 12 million ounces of silver. |
On January 26, 2023, the Company announced the appointment of Mr. Andrew Williams to the position of President.
On December 2, 2022, the Company approved the appointment of Dr. Peter Megaw and Mr. Dickson Hall to the Board of Directors. Mr. Jack Austin and Mr. David Kong did not stand for re-election as directors.
On November 28, 2022, the Company announced the Silver Sand MRE. The Silver Sand MRE was reported in accordance with NI 43-101 and was completed by AMC Consultants. Highlights of the Silver Sand MRE were as follows:
| § | Mineralization remains open on strike to the North and South and at depth. No feeder zones or source intrusions have been discovered to date. The Company classifies the exploration potential as good to excellent. |
| § | Estimated Measured and Indicated Mineral Resources have increased by 30%, this partly the result of infill drilling upgrading Inferred Mineral Resources. |
| § | Detailed drilling indicates good mineral continuity to provide high confidence – lower technical risk. Measured & Indicated Mineral Resources of 54.26 Mt @ 116 g/t Ag for 201.77 Moz or 94% of the total estimate. |
| § | Mineralization starts at or near-surface and is amenable to potential open-pit mining extraction. Approximately 95% of the reported Mineral Resources are within 200 m of the topographic surface. |
| § | Favorable initial metallurgical test work indicates laboratory-based recoveries of up to 97% for the various oxide – transition and sulphide mineral domains. |
| § | In addition to the currently reported Mineral Resources, there are numerous known satellite mineral occurrences in the district of six kilometers long by two and half kilometers wide. These mineral occurrences demonstrate similar mineralization style and grades to the Silver Sand Project, subjected to extensive artisanal mining starting from Spanish colonial time and bore little modern exploration. The Company believes these satellite occurrences have good resource potential. |
On November 22, 2022, the Company announced the filing of a technical report entitled “Carangas Project Technical Report” with an effective date of June 16, 2022. This report has been superseded by the Carangas Technical Report, and should no longer be relied upon.
On September 19, 2022, the Company announced the receipt of assay results for all of the 86 drill holes completed under the 2022 resource infill and step-out drill program at the Silver Sand Project (the “2022 Silver Sand Drill Program”). The 2022 Silver Sand Drill Program of 19,323 metres (“m”) in 86 drill holes, together with the 55 drill holes completed in 2021, intended to expand and improve the confidence in the geological model and the previous MRE is respect of the Silver Sand Project released in April 2020 and to be used for the Silver Sand Technical Report. For further details, please refer to the Company’s news release dated September 19, 2022, filed under the Company’s profile on SEDAR+ at www.sedarplus.ca, with the SEC on EDGAR at www.sec.gov/edgar, and on the Company’s website at www.newpacificmetals.com
| (b) | Year ended June 30, 2022 |
On June 14, 2022, the Company announced the commencement of a 6,000 m one rig drill program at the Silverstrike Project with the objective to test a broad gold zone identified by the Company and by historical drilling. For further details, please refer to the Company’s news release dated June 14, 2022, filed under the Company’s profile on SEDAR+ at www.sedarplus.ca, with the SEC on EDGAR at www.sec.gov/edgar, and on the Company’s website at www.newpacificmetals.com
On June 7, 2022, the Company announced the commencement of a 2,000 m one rig drill program at the Jisas prospect, a satellite concession located in the north block, approximately 3 kilometres north of the Silver Sand Project. For further details, please refer
9
to the Company’s news release dated June 7, 2022, filed under the Company’s profile on SEDAR+ at www.sedarplus.ca, with the SEC on EDGAR at www.sec.gov/edgar, and on the Company’s website at www.newpacificmetals.com
On May 17, 2022, the Company announced the receipt of assay results for all of the 35 drill holes completed under the Company’s 2021 discovery drill program at the Carangas Project (the “2021 Carangas Drill Program”). Results from the 2021 Carangas Drill Program confirmed the broad silver-rich polymetallic mineralization near surface and intersected a wide zone of gold mineralization below it. For further details, please refer to the Company’s news release dated May 17, 2022, filed under the Company’s profile on SEDAR+ at www.sedarplus.ca, with the SEC on EDGAR at www.sec.gov/edgar, and on the Company’s website at www.newpacificmetals.com
On February 8, 2022, the Company reported on the status and plan for the ongoing work on the PEA study for the Silver Sand Project. To support the development of the MRE and PEA, the Company planned to complete a further 15,000 m of exploration and in-fill drilling, including 2,500 m within the MPC properties and 12,500 m at the Silver Sand Project.
On January 24, 2022, the Company announced that the board of directors (the “Board”) had accepted the resignation of Dr. Mark Cruise as CEO and as a director of New Pacific and that the Board has appointed Dr. Rui Feng as the CEO. Dr. Feng is the founder of the Company and served as CEO until April 27, 2020. Following his appointment as the CEO, Dr. Feng stepped down as the Chairman of the Board and Terry Salman was appointed as the Chairman of the Board.
On October 26, 2021, the Company announced the expansion of its 2021 Carangas Drill Program by adding two drill rigs to complete an additional minimum of 7,500 m of drilling by the end of 2021.
On August 12, 2021, the Company announced that Bolivia’s Autoridad Jurisdictional Administrativa Minera (“AJAM”) granted an AMC for the Silver Sand Project. All required registration, notarization and publication steps to perfect the title of the AMC in favour of Empresa Minera Alcira S.A. (“Alcira”), the Company’s wholly-owned Bolivian subsidiary, were completed. The AMC established a clear title to the Silver Sand Project mineral rights.
On July 27, 2021, the Company announced the commencement of a planned 38,000 m diamond drill program at the Silver Sand Project with the objectives to expand the existing resource, which remains open along strike and at depth, and to complete geotechnical drilling to support the PEA study.
| (c) | Year ended June 30, 2021 |
On June 29, 2021, the Company announced that, following receipt of exploration licenses and environmental permits, it commenced the 2021 Carangas Drill Program.
On July 15, 2021, the Company filed a final short form base shelf prospectus (the “2021 Prospectus”) with the securities regulatory authorities in each of the provinces in Canada and a corresponding registration statement on Form F-10 with the SEC. The 2021 Prospectus expired in the ordinary course on August 15, 2023 and was replaced with the 2023 Prospectus.
On May 20, 2021, the Company’s Shares commenced trading on the NYSE American and ceased trading on the OTCQX Market on May 19, 2021.
On April 12, 2021, the Company signed a mining association agreement with a private Bolivian company to acquire a 98% interest in the Carangas Project.
On November 18, 2020, the Company distributed all of the spin-out shares held by it to the Company’s shareholders on a pro rata basis by way of a plan of arrangement under the Business Corporations Act (British Columbia). Assets and liabilities of Whitehorse Gold Corp. (“Whitehorse Gold”) and the Tagish Lake Gold Project were disposed upon completion of the spin-out (the “Spin-Out”). On November 15, 2020, Whitehorse Gold’s common shares were listed for trading on the TSX Venture Exchange (the “TSX-V”) under the symbol “WHG”. As a result of the Spin-Out, the Company no longer holds an interest in the Tagish Lake Gold Project. Whitehorse Gold later changed its name to Tincorp Metals Inc.
On August 11, 2020, the Company’s Shares graduated from the TSX-V to the TSX.
10
PROJECT OVERVIEW
Bolivian Licence Tenure
A summary of current Bolivian mining laws with respect to the AMC and exploration license is presented below.
Exploration and mining rights in Bolivia are granted by the Ministry of Mines and Metallurgy through the AJAM. Under Bolivian mining laws, tenure is granted as either an AMC or an exploration license. Tenure held under the previous legislation was converted to ATEs (as defined below) which are required to be consolidated into new 25-hectare sized cuadriculas (concessions) and converted to AMCs. AMCs created by conversion recognize existing rights of exploration and/or exploitation and development, including treatment, metal refining, and/or trading. AMCs have a fixed term of 30 years and can be extended for an additional 30 years if certain conditions are met. Each AMC requires ongoing work and the submission of plans to AJAM.
Exploration licenses allow exploration activities only and must be converted to AMCs to conduct exploitation and development activities. Exploration licenses are valid for a maximum of five years and provide the holder with the preferential right to request an AMC. In specific areas, mineral tenure is owned by the COMIBOL. In these areas, development and production agreements can be obtained by entering into a MPC with COMIBOL.
Silver Sand Project
The Silver Sand Project is located in the Colavi District of Potosí Department in southwestern Bolivia at an elevation of 4,072 m above sea level, 33 kilometres (“km”) northeast of Potosí City, the department capital.
The Silver Sand Project is comprised of two claim blocks, the Silver Sand south and north blocks, which covers a total area of 5.42 km2. The Silver Sand south block, covering an area of 3.17 km2 hosts the Silver Sand deposit. On August 12, 2021, the Company announced the receipt of an AMC for the Silver Sand south block from AJAM. The Silver Sand north block covers an area of 2.25 km2 and is comprised of two AMCs (Jisasjardan and Bronce). The AMCs establish a clear title to the Silver Sand Project.
Since acquiring the Silver Sand Project in 2017, the Company has carried out extensive exploration and resource definition drill programs.
In 2021, the Company completed a drill program of 13,313.7 m in 55 holes (the “2021 Silver Sand Drill Program”). The 2021 Silver Sand Drill Program comprised structure orientation drilling, step-out and infill drilling as well as exploration drilling. Assay results of all drill holes have been received. Detailed structural logging and assay of the oriented drill cores confirmed previous understanding of the orientation of mineralized structures and resource model which are dominantly striking in the direction of north and northwest and dipping in direction of west at high angles which are also evidenced at surface outcrops and historical underground workings. Step-out drilling was carried out mainly outside of the major mineralized trends with results indicating the existence of multiple smaller satellite mineralized zones between the major mineralized trends. For details of the 2021 Silver Sand Drill Program, please refer to the Company’s news release dated April 6, 2022 filed under the Company’s profile on SEDAR+ at www.sedarplus.ca, with the SEC on EDGAR at www.sec.gov/edgar, and on the Company’s website at www.newpacificmetals.com
In 2022, the Company conducted a resource infill drilling and step-out drilling program at the Silver Sand south block and completed 19,323 m in 86 drill holes (the “2022 Silver Sand Drill Program”). Assay results for all drill holes have been received. The resource infill drilling aimed to improve the confidence in the continuity of mineralization in the core area of the Silver Sand Project and upgrade resources, while the step-out drilling was designed to test the extension of the mineralized zones up and down dip as well as on strike. The infill and step-out drilling results were included in the Silver Sand MRE update and incorporated into the Silver Sand Technical Report. For details on the 2022 Silver Sand Drill Program, please refer to the Company’s news releases dated September 19, 2022, May 31, 2022, and April 6, 2022 filed under the Company’s profile on SEDAR+ at www.sedarplus.ca, with the SEC on EDGAR at www.sec.gov/edgar, and on the Company’s website at www.newpacificmetals.com
On November 28, 2022, the Company released the Silver Sand MRE update. Based on the Silver Sand MRE, the Silver Sand Project has an estimated measured and indicated mineral resource of 201.77 million oz of silver at head grade of 116 g/t and an estimated inferred mineral resource of 12.95 million oz of silver at 88 g/t. For further details, please refer to the Company’s news release dated November 28, 2022 filed under the Company’s profile on SEDAR+ at www.sedarplus.ca, with the SEC on EDGAR at www.sec.gov/edgar, and on the Company’s website at www.newpacificmetals.com.
11
On February 16, 2023, the Company filed the Silver Sand Technical Report. AMC Consultants (mineral resource, mining, infrastructure and financial analysis) was contracted to conduct the Silver Sand Technical Report in cooperation with Halyard Inc. (metallurgy and processing), and New Fields Canada Mining & Environment ULC (tailings, water and water management). The Silver Sand Technical Report is based on the Silver Sand MRE, which was reported on November 28, 2022. Highlights from the Silver Sand Technical Report, with a base case silver price of $22.50/oz are as follows:
| § | pre-tax NPV (5%) of $1.1 billion with an IRR of 52%, and a post-tax NPV (5%) of $726 million with an IRR of 39%; |
| § | using a +/- 20% sensitivity analysis for silver price, a post-tax NPV (5%) of $1,054 million with an IRR of 50% at $27/oz silver, or a post-tax NPV (5%) of $398 million with an IRR of 26% at $18/oz silver; |
| § | 14-year mine life producing approximately 171 million ounces payable silver metal; |
| § | initial capital cost of $308 million, which includes $52 million in contingency cost; |
| § | LOM total sustaining capital cost of $20 million; |
| § | average LOM operating cash cost of $8.45/oz and total all-in sustaining cost of $10.42/oz silver; and |
| § | annual payable metal production exceeds 15 million ounces of silver in years one through four, with LOM average annual payable metal production exceeding 12 million ounces of silver. |
Please see “Cautionary Note Regarding Results of Preliminary Economic Assessment”. For more details on the Silver Sand Technical Report, please refer to the Company’s news releases dated February 16, 2023 and January 9, 2023 filed under the Company’s profile on SEDAR+ at www.sedarplus.ca, with the SEC on EDGAR at www.sec.gov/edgar, and on the Company’s website at www.newpacificmetals.com.
Mining Production Contract
On January 11, 2019, New Pacific announced that its 100% owned subsidiary, Alcira, entered into an MPC with COMIBOL granting Alcira the right to carry out exploration, development and mining production activities in ATEs and cuadriculas owned by COMIBOL adjoining the Silver Sand Project. An updated to the MPC was made with COMIBOL on January 19, 2022. The MPC is comprised of two areas. The first area is located to the south and west of the Silver Sand Project. The second area includes additional geologically prospective ground to the north, east and south of the Silver Sand Project, wherein COMIBOL is expected to apply for exploration and mining rights with AJAM. Upon granting of the exploration and mining rights, COMIBOL will contribute these additional properties to the MPC.
There are no known economic mineral deposits, nor any previous drilling or exploration discoveries within the MPC area. The MPC presents an opportunity to explore and evaluate the possible extensions and/or satellites of mineralization outside of the currently defined Silver Sand Project.
The MPC remains subject to ratification and approval by the Plurinational Legislative Assembly of Bolivia. As of the date of this AIF, the MPC has not been ratified nor approved by the Plurinational Legislative Assembly of Bolivia. The Company cautions that there is no assurance that the Company will be successful in obtaining ratification of the MPC in a timely manner or at all, or that the ratification of the MPC will be obtained on reasonable terms. The Company cannot predict the Bolivia government’s positions on foreign investment, mining concessions, land tenure, environmental regulation, community relations, taxation or otherwise. A change in the government’s position on these issues could adversely affect the ratification of the MPC and the Company’s business.
Carangas Project
In April 2021, the Company signed an agreement with a private Bolivian company to acquire a 98% interest in the Carangas Project. The Carangas Project is located approximately 180 km southwest of the city of Oruro and within 50 km from Bolivia’s border with Chile. The private Bolivian company is 100% owned by Bolivian nationals and holds title to the three exploration licenses that cover an area of 40.75 km2.
Under the agreement, the Company is required to cover 100% of the future expenditures on exploration, mining, development and production activities for the Carangas Project. The agreement has a term of 30 years and is renewable for another 15 years.
In 2021, the Company completed the 2021 Carangas Drill Program of 13,209 m in 35 drill holes. Assay results of all drill holes have been received. Results from the 2021 Carangas Drill Program confirmed the broad silver-rich polymetallic mineralization near surface and intersected a wide zone of gold mineralization below it. For details of the 2021 Carangas Drill Program, please refer to the Company’s news releases dated May 17, 2022, February 23, 2022, and February 10, 2022 filed under the Company’s profile on SEDAR+ at www.sedarplus.ca, with the SEC on EDGAR at www.sec.gov/edgar, and on the Company’s website at www.newpacificmetals.com
12
Following the success of the 2021 discovery drill program, the Company completed the 2022 resource definition drill program for a total of 50,368 m in 115 drill holes. Assay results of all 115 drill holes have been received and released to date. The assay results continue to indicate that a thick zone of gold mineralization occurs beneath a shallow silver horizon measuring approximately 1,000 m long, 800 m wide, and up to 200 m thick. The 2022 drill results also indicate the gold system is open to the north and northeast directions with these targets being drill tested as part of the Company’s 2023 drill program. For details of the 2022 drill program, please refer to the Company’s news releases dated April 6, 2023, February 21, 2023, February 1, 2023, January 24, 2023, November 14, 2022, October 19, 2022, August 8, 2022, and July 13, 2022 filed under the Company’s profile on SEDAR+ at www.sedarplus.ca, with the SEC on EDGAR at www.sec.gov/edgar, and on the Company’s website at www.newpacificmetals.com.
In 2023, the Company completed its 2023 drill program at the Carangas Project for a total of 17,623 m in 39 drill holes. Assay results of all 39 drill holes have been received and released to date. For details of the 2023 drill program, please refer to the Company’s news releases dated July 6, 2023 and May 30, 2023 filed under the Company’s profile on SEDAR+ at www.sedarplus.ca, with the SEC on EDGAR at www.sec.gov/edgar, and on the Company’s website at www.newpacificmetals.com.
On September 5, 2023, the Company reported the Carangas MRE. The Carangas MRE was completed by RPM with effective date of August 25, 2023. Highlights of the MRE as follows:
| § | Total indicated mineral resources of 214.9 Mt containing 205.3 Mozs of Ag, 1,588.2 Kozs of Au, 1,444.9 Mlbs of Pb, 2,653.7 Mlbs of Zn, and 112.6 Mlbs of Cu; or collectively 559.8 Mozs silver equivalent AgEq. |
| § | Total inferred mineral resources of 45.0 Mt containing 47.7 Mozs of Ag, 217.7 Kozs of Au, 297.9 Mlbs of Pb, 533.7 Mlbs of Zn, and 16.8 Mlbs of Cu; or collectively 109.8 Mozs AgEq. |
| § | The Carangas Project is a globally significant Ag-Au polymetallic discovery. |
| § | Mineralization starts at or near surface, potentially allowing for open-pit mining with an average stripping ratio for the conceptual pit of approximately 1.8:1 (tonnes of waste : tonnes of mineral resource). |
| § | Below the pit constraint, substantial gold-dominant mineralization, similar in size and grade to the reported gold domain (as defined below), has the potential for conversion to underground mineable resources pending further evaluation for reasonable prospects of eventual economic extraction. |
| § | Favorable initial metallurgical test work indicates laboratory-based recoveries of up to 90% for silver and 98% for gold based on a combination of flotation and cyanide leaching. |
Silverstrike Project
The Silverstrike Project is located approximately 140 km southwest of La Paz, Bolivia. In December 2019, the Company signed a mining association agreement and acquired a 98% interest in the Silverstrike Project from a private Bolivian corporation that is owned 100% by Bolivian nationals and holds the title to the nine ATEs (covering an area of approximately 13 km2) that comprise the Silverstrike Project.
Under the mining association agreement, the Company is required to cover 100% of future expenditures, including exploration, contingent on results of development and subsequent mining production activities at the Silverstrike Project. The agreement has a term of 30 years and is renewable for another 15 years.
During 2020, the Company’s exploration team completed reconnaissance and detailed mapping and sampling programs on the northern portion of the Silverstrike Project. The results to date identified near surface broad zones of silver mineralization in altered sandstones to the north, with similarities to that at the Silver Sand Project; and in the Silverstrike Project’s central area, a near surface broad silver zone that occurs near the top of a 900 m diameter volcanic dome of ignimbrite (volcaniclastic sediments) units with intrusion of rhyolite dyke swarm and andesite flows; and a broad gold zone occurs half-way from the top of the dome.
In 2022, the Company completed a 3,200 m drill program at the Silverstrike Project. Assay results for the two drill holes were released in the news releases dated November 1, 2022 and September 12, 2022 filed under the Company’s profile on SEDAR+ at www.sedarplus.ca, with the SEC on EDGAR at www.sec.gov/edgar, and on the Company’s website at www.newpacificmetals.com.
Frontier Area – Carangas and Silverstrike Projects
The Carangas Project and the Silverstrike Project are located within 50 km of the Bolivian border with Chile. In line with many South American countries, Bolivia does not permit foreign entities to own property within 50 km of international borders (the “Frontier Area”). Property owners in the Frontier Area are, however, permitted to enter into mining association agreements with third parties, including foreign entities, for the development of mining activities under Bolivian Law No. 535 on Mining and Metallurgy. Although the Company believes the mining association agreements for the Carangas Project and the Silverstrike Project are legally compliant
13
with the Frontier Area requirements and Bolivian mining laws, there is no assurance that the Company’s Bolivian partners will be successful in obtaining the approval of AJAM to convert the exploration licenses to AMC in the case of the Carangas Project, or that even if approved, that such relationships and structures will not be challenged by other Bolivian organizations or communities.
RZY Project
The Company’s former RZY project (the “RZY Project”), located in Qinghai, China was an early-stage silver-lead-zinc exploration project. The RZY Project was located approximately 237 km from the city of Yushu Tibetan Autonomous Prefecture. In 2016, the Qinghai Government issued a moratorium which suspended exploration for 26 mining projects in the region, including the RZY Project, and classified the region as a National Nature Reserve Area.
During Fiscal 2020, the Company’s subsidiary, Qinghai Found Mining Co., Ltd. (“Qinghai Found”), reached a compensation agreement with the Qinghai Government for the RZY Project. Pursuant to the agreement, Qinghai Found will surrender its title to the RZY Project to the Qinghai Government for one-time cash compensation of $2.99 million (RMB ¥20 million) (the “RZY Compensation Transaction”).
On June 25, 2022, the Qinghai Government completed its approval process of the RZY Compensation Transaction. As a result, the Company disposed its RZY Project for cash consideration of $2,986,188 (RMB ¥20 million), which is included in the receivables balance as of June 30, 2022. As of the date of this AIF, the Company received the cash compensation in full.
| 3.3 | Significant Acquisitions |
The Company made no significant acquisitions in its most recently completed financial year.
| Item 4: | DESCRIPTION OF THE BUSINESS |
| 4.1 | General |
Specialized Skill and Knowledge
All aspects of the Company’s business activities require specialized skills and knowledge. Such skills and knowledge include the fields of geology, mining, metallurgy, engineering, environment issues, permitting, social issues, and accounting. While competition in the resource mining industry has made it more difficult to locate and retain competent employees in such fields, the Company has been successful in finding and retaining experts for its key activities.
Competitive Conditions
Competition in the mineral exploration industry is intense. The Company competes with other mining companies, many of which have greater financial resources and technical facilities for the acquisition and development of mineral concessions, claims, leases and other interests, as well as for the recruitment and retention of qualified employees and consultants.
Business Cycles
The mining business is subject to mineral price and investment climate cycles. The marketability of minerals is also affected by worldwide economic and demand cycles. It is difficult to assess if the current commodity prices are long-term trends, and there is uncertainty as to the recovery, or otherwise, of the world economy. If global economic conditions weaken and commodity prices decline as a consequence, a continuing period of lower prices could significantly affect the economic potential of the Company’s projects.
Economic Dependence
The Company’s business is not substantially dependent on any contract such as a contract to see the major part of its products or services or to purchase the major part of its requirements for goods, services or raw materials, or on any franchise, license or other agreement to use a patent, formula, trade secret, process or trade name upon which its business depends.
14
Bankruptcy and Similar Procedures
There is no bankruptcy, receivership or similar proceedings against the Company, nor is the Company aware of any such pending or threatened proceedings. There have not been any voluntary bankruptcy, receivership or similar proceedings by the Company within the three most recently completed financial years or currently proposed for the current financial year.
Foreign Operations
Our principal operations and assets are located in Bolivia. Our operations are exposed to various levels of political, economic, social and other risks and uncertainties. These risks and uncertainties include, but are not limited to, government regulations (or changes to such regulations) with respect to restrictions on production, export controls, income taxes, expropriation of property, repatriation of profits, environmental legislation, land use, water use, local ownership requirements and land claims of local people, regional and national instability and mine safety. The effect of these factors cannot be accurately predicted. See “Risk Factors”.
Reorganizations
Other than the Spin-Out, there have been no material reorganizations of the Company or its subsidiaries within the three most recently completed financial years nor any material reorganizations proposed for the current financial year.
Social Policies
The Board has adopted a written code of business conduct and ethics (the “Code”). A copy of the Code may be obtained by contacting the Company at the address on the cover of this AIF. Alternatively, a copy of the Code can be found on the Company’s website at www.newpacificmetals.com. When proposed transactions or agreements in which directors or officers may have an interest, material or not, are presented to the Board, the directors are required to disclose any such interest and the persons who have such an interest are excluded from all discussion on the matter and are not permitted to vote on the proposal. All such interests in transactions or agreements involving senior Management are dealt with by the Board, regardless of apparent immateriality.
Employees
As at June 30, 2023, the Company had 64 employees.
| 4.2 | Risk Factors |
Mining Business
An investment in the Shares of the Company involves a significant degree of risk and ought to be considered a highly speculative investment. Shareholders of the Company may lose their entire investment. The market price of the Shares may be affected by many variables not directly related to the corporate performance of the Company, including the market in which it is traded, the strength of the economy generally, the availability and attractiveness of alternative investments and the breadth of the public market for its shares. The effect of these and other factors on the market price of the Shares in the future cannot be predicted. The lack of an active public market could also have a material adverse effect on the price of the Shares.
In addition, risk factors identified in this AIF, as well as risks not currently known to the Company, could materially adversely affect the Company’s future business, operations and financial condition and could cause actual results to differ materially from the estimates described in the forward-looking statements and information relating to the Company.
The Company is currently in the business of acquiring, exploring, and developing mineral properties and is exposed to a number of risks and uncertainties that are common to other mineral exploration companies in the same business. The following is a brief discussion of those factors which may have a material impact on, or constitute risk factors in respect of, the Company’s future financial performance.
No Revenues or Ongoing Mining Operations
The Company is an exploration and development stage mining company that has no revenue from operations and no ongoing mining production of any kind. The Company has not developed or operated any mines and has no operating history upon which an evaluation of the Company’s future success or failure can be made. The Company’s ability to achieve and maintain profitable mining operations is dependent upon a number of factors, including the Company’s ability to successfully obtain essential permits, build and
15
operate mines, processing plants, and related infrastructure. The Company may not successfully establish mining operations or profitably produce metals at its properties. As such, the Company does not know if it will ever generate revenues.
Mineral Deposits Not Economic
The determination of whether any mineral deposits on the Company’s mineral projects are economical is affected by numerous factors beyond the control of the Company. These factors include: (a) the metallurgy of the mineralization forming the mineral deposit; (b) market fluctuations for metal prices; (c) the proximity and capacity of natural resource markets and processing equipment; and (d) government regulations governing prices, taxes, royalties, land tenure, land use, importing and exporting of minerals, and environmental protection.
Political and Economic Risks in Bolivia
The Company’s projects are located in Bolivia and, therefore, the Company’s current and future mineral exploration and mining activities are exposed to various levels of political, economic, and other risks and uncertainties. There has been a significant level of political and social unrest in Bolivia in recent years resulting from a number of factors, including Bolivia’s history of political and economic instability under a variety of governments and high rate of unemployment.
The Company’s exploration and development activities may be affected by changes in government, political instability, and the nature of various government regulations relating to the mining industry. Bolivia’s fiscal regime has historically been favourable to the mining industry, but there is a risk that this could change. The Company cannot predict the government’s positions on foreign investment, mining concessions, land tenure, environmental regulation, or taxation. A change in government positions on these issues could adversely affect the Company’s business and/or its holdings, assets, and operations in Bolivia. Any changes in regulations or shifts in political conditions are beyond the control of the Company. Moreover, protestors and cooperatives have previously targeted foreign companies in the mining sector, and as a result there is no assurance that future social unrest will not have an adverse impact on the Company’s operations. Labour in Bolivia is customarily unionized and there are risks that labour unrest or wage agreements may impact operations.
The Company’s operations in Bolivia may also be adversely affected by economic uncertainty characteristic of developing countries. In addition, operations may be affected in varying degrees by government regulations with respect to restrictions on production, price controls, export controls, currency remittance, income taxes, expropriation of property, foreign investment, maintenance of claims, environmental legislation, land use, land claims of local people, water use, and safety factors.
The MPC remains subject to ratification and approval by the Plurinational Legislative Assembly of Bolivia. As of the date of this AIF, the MPC has not been ratified nor approved by the Plurinational Legislative Assembly of Bolivia. The Company cautions that there is no assurance that the Company will be successful in obtaining ratification of the MPC in a timely manner or at all, or that the ratification of the MPC will be obtained on reasonable terms. The Company cannot predict the new government’s positions on foreign investment, mining concessions, land tenure, environmental regulations, community relations, taxation or otherwise.
Illegal, Artisanal and Small-Scale Mining
Mining by illegal, artisanal and small-scale miners occurs on and near some of the Company’s mineral concessions in Bolivia. These activities could cause disruptions and damages to the Company’s operations, including road blockages, pollution, environmental damage, or personal injury, for which the Company could potentially be held responsible. The presence of illegal, artisanal and small-scale miners can lead to delays and disputes regarding the development of the Company’s projects. Although the Company, with the assistance of both local government authorities and external contractors, has undertaken measures that have reduced the occurrence of illegal artisanal and small scale mining, we cannot provide assurance that these measures will be successful in reducing or eliminating illegal artisanal and small scale mining at our projects in the future including commencing formal legal proceedings in the second half of 2023 for the permanent removal of such illegal, artisanal and small-scale mining operators. Such operators have temporarily restricted us from accessing our properties from time to time and although such restrictions have not had a material adverse effect on our business, results of operations and financial conditions, if we were to be restricted from accessing our projects for a longer duration, such restriction may have a material adverse effect on our business, results of operations and financial conditions.
Community Relations and Social Licence to Operate
Mining companies are increasingly required to operate in a sustainable manner and to provide benefits to affected communities and there are risks associated with the Company failing to acquire and subsequently maintain a “social licence” to operate on its mineral properties. “Social licence” does not refer to a specific permit or licence, but rather is a broad term used to describe community acceptance of a company’s plans and activities related to exploration, development or operations on its mineral projects.
The Company places a high priority on, and dedicates considerable efforts and resources toward, its community relationships and responsibilities. Despite its best efforts, there are factors that may affect the Company’s efforts to establish and maintain social licence at any of its projects, including national or local changes in sentiment toward mining, evolving social concerns, changing economic conditions and challenges, and the influence of third-party opposition toward mining on local support. There can be no guarantee that social licence can be earned by the Company or if established, that social licence can be maintained in the long term, and without strong community support the ability to secure necessary permits, obtain project financing, and/or move a project into
16
development or operation may be compromised or precluded. Delays in projects attributable to a lack of community support or other community-related disruptions or delays can translate directly into a decrease in the value of a project or into an inability to bring the Company’s projects to, or maintain, production. The cost of measures and other issues relating to the sustainable development of mining operations may result in additional operating costs, higher capital expenditures, reputational damage, active community opposition (possibly resulting in delays, disruptions and stoppages), legal suits, regulatory intervention and investor withdrawal.
Frontier Area
The Carangas Project and the Silverstrike Project are located within 50 km of the Bolivian border with Chile. In line with many South American countries, Bolivia does not permit foreign entities to own property within 50 km of international borders. Property owners in the Frontier Area are, however, permitted to enter into mining association agreements with third parties, including foreign entities, for the development of mining activities under Bolivian Law No. 535 on Mining and Metallurgy. While the Company believes the mining association agreements for the Carangas Project and the Silverstrike Project are legally compliant with the Frontier Area requirements and Bolivian mining laws, there is no assurance that the Company’s Bolivian partners will be successful in obtaining the approval of AJAM to convert the exploration licenses to AMC in the case of the Carangas Project, or that even if approved, that such relationships and structures will not be challenged by other Bolivian organizations or communities.
Obstacles Implementing Capital Expenditure Projects
The Company’s mineral projects are subject to a number of risks that may make it less successful than anticipated, including: (a) delays or higher than expected costs in implementing recommendations contained in the Silver Sand Technical Report or other technical reports that may be prepared for the Company’s mineral projects; (b) negative technical results and/or technical results that fail to deliver the required returns to render the ongoing development of the Silver Sand Project or the Company’s other mineral projects; (c) delays in receiving environmental permits and/or social licenses; (d) delays in receiving construction and operating permits; (e) delays or higher than expected costs in obtaining the necessary equipment or services to build and operate the Silver Sand Project and the Company’s other mineral projects; and (f) adverse mining conditions may delay and hamper the ability of the Company to produce the expected quantities of minerals.
General Market Events and Conditions
The unprecedented events in global financial markets in the past several years which have been heightened due to emerging risks relating to the spread of COVID-19 have had a profound impact on the global economy. Many industries, including the mining industry, are impacted by these market conditions. Some of the key impacts of the current financial market turmoil include contraction in credit markets resulting in a widening of credit risk, devaluations, high volatility in global equity, commodity, foreign exchange and precious metal markets, and a lack of market liquidity. A continued or worsened slowdown in the financial markets or other economic conditions, including but not limited to, consumer spending, employment rates, business conditions, inflation, fuel and energy costs, consumer debt levels, lack of available credit, the state of the financial markets, interest rates, and tax rates may adversely affect the Company’s business and industry. A number of issues related to economic conditions could have a material adverse effect on financial condition and results of operations of the Company, specifically: (a) the global credit/liquidity crisis could impact the cost and availability of financing and the Company’s overall liquidity; (b) the volatility of metal prices would impact the revenues, profits, losses and cash flow of the Company; (c) continued recessionary pressures could adversely impact demand for the production from the Company’s mineral projects, if any; and (d) volatile energy, commodity and consumables prices and currency exchange rates would impact the Company’s production costs, if any.
No Known Commercial Mineral Deposits
Neither the Silver Sand Project nor any of the Company’s other mineral projects currently contain known amounts of commercial mineral deposits. The Company’s program is exploratory only and there is no certainty that the expenditures to be made by the Company will result in the development of any commercial mineral deposits.
Changes in Market Price of Metals
The potential of the Company’s mineral projects to be economically mined is significantly affected by changes in the market price of metals. The market price of metals is volatile and is impacted by numerous factors beyond the control of the Company, including: (a) expectations with respect to the rate of inflation; (b) the relative strength of the U.S. dollar and certain other currencies; (c) interest rates; (d) global or regional political or economic conditions; (e) supply and demand for jewellery and industrial products containing metals; and (f) sales by central banks, other holders, speculators, and producers of gold and other metals in response to any of the above factors. A decrease in the market price of metals could make it difficult or impossible to finance the exploration or development of the Company’s mineral projects or cause the Company to determine that it is impractical to continue development of such projects, which would have a material adverse effect on the financial condition and results of operations of the Company. There can be no assurance that the market price of metals will not decrease.
Mining Operations May Not be Established or Profitable
The Company has no history of production and the Company’s mineral projects are currently in the exploration stage. The future development of the Company’s mineral projects will require additional financing, permits, design, construction, processing plant, and related infrastructure. As a result, the Company will be subject to all of the risks associated with establishing new mining operations and business enterprises, including: (a) the timing and cost, which will be considerable, of obtaining all necessary permits including
17
environmental, construction, and operating permits; (b) the timing and cost, which will be considerable, of the construction of mining and processing facilities; (c) the availability and costs of skilled labour, power, water, transportation, and mining equipment; (d) the availability and cost of appropriate smelting and/or refining arrangements; (e) the need to obtain necessary environmental and other governmental approvals and permits, and the timing of those approvals and permits; and (f) the availability of funds to finance construction and development activities.
It is common in new mining operations to experience unexpected problems and delays during permitting, construction, development, and mine start-up. In addition, delays in the commencement of mineral production often occur, and once commenced, the production of a mine may not meet expectations or the estimates set forth in feasibility or other studies. Accordingly, there are no assurances that the Company will successfully establish mining operations or become profitable.
Estimates of Mineralization Figures
The mineralization figures presented in the Silver Sand Technical Report are based upon estimates made by qualified persons. These estimates are imprecise and depend upon interpretation of geologic formations, grade, and metallurgical characteristics and upon statistical inferences drawn from drilling and sampling analysis, any or all of which may prove to be unreliable. Material changes in mineral resources or mineral reserves, grades, stripping ratios, or recovery rates may affect the economic viability of any project. Estimates can also be affected by such factors as environmental permitting regulations and requirements, weather, environmental factors, unforeseen technical difficulties, unusual or unexpected geological formations, and work interruptions. There can be no assurance that: (a) the estimates made by qualified persons upon which the mineralization figures presented in the Silver Sand Technical Report are based will be accurate; (b) mineral resource or other mineralization figures will be accurate; or (c) this mineralization could be mined or processed profitably.
Mineralization estimates for the Silver Sand Project may require adjustments or downward revisions based upon further exploration or development work or the outcome of the MPC ratification and approval by the Plurinational Legislative Assembly of Bolivia. It is possible that the following may be encountered: unusual or unexpected geologic formations or other geological or grade problems, unanticipated changes in metallurgical characteristics and silver recovery, and unanticipated ground or earth conditions. If mining operations are commenced, the grade of mineralization ultimately mined, if any, may differ from that indicated by drilling results. Estimates of mineral recovery rates used in mineral reserve and mineral resource estimates are uncertain and there can be no assurance that mineral recovery rates in small scale tests will be duplicated in large scale tests under on-site conditions or in production scale.
Acquisition and Maintenance of Permits and Government Approvals
Exploration and development of, and production from, any deposit at the Company’s mineral projects require permits from various government authorities. There can be no assurance that any required permits will be obtained in a timely manner or at all, or that they will be obtained on reasonable terms. Delays or failure to obtain, expiry of, or a failure to comply with the terms of such permits could prohibit development of the Company’s mineral projects and have a material adverse impact on the Company.
While the Company believes the contractual relationships and the structures it has in place with private Bolivian companies owned 100% by Bolivian nationals for the Silverstrike Project and the Carangas Project are legally compliant with Bolivian laws related to the Frontier Areas, there is no assurance that the Company’s Bolivian partner will be successful in obtaining approval of AJAM to convert the exploration licenses to AMCs in the case of Carangas Project, or that even if approved, that such contractual relationship and structure will not be challenged by other Bolivian organizations or communities.
The Company’s current and future operations, including development activities and commencement of production, if warranted, require permits from government authorities and such operations are and will be governed by laws and regulations governing prospecting, development, mining, production, exports, taxes, labour standards, occupational health, waste disposal, toxic substances, land use, environmental protection, mine safety, and other matters. Companies engaged in property exploration and the development or operation of mines and related facilities generally experience increased costs and delays in production and other schedules as a result of the need to comply with applicable laws, regulations, and permits. The Company cannot predict if all permits which it may require for continued exploration, development, or construction of mining facilities and conduct of mining operations will be obtainable on reasonable terms, if at all. Time delays and associated costs related to applying for and obtaining permits and licenses may be prohibitive and could delay planned exploration and development activities. Failure to comply with or any violations of the applicable laws, regulations, and permitting requirements may result in enforcement actions, including orders issued by regulatory or judicial authorities causing operations to cease or be curtailed, and may include corrective measures requiring capital expenditures, installation of additional equipment, or remedial actions.
18
Parties engaged in mining operations may be required to compensate those impacted by mining activities and may have civil or criminal fines or penalties imposed for violations of applicable laws or regulations. Amendments to current laws, regulations, and permits governing operations and activities of mining companies, or more stringent implementation thereof, could have a material adverse impact on the Company’s operations and cause increases in capital expenditures or production costs, or reduction in levels of production at producing properties, or require abandonment or delays in the development of new mining properties.
Operations and Exploration Subject to Governmental Regulations
The Company’s operations and exploration and development activities are subject to extensive laws and regulations governing various matters, including: (a) environmental protection; (b) management and use of toxic substances and explosives; (c) management of natural resources; (d) management of tailings and other wastes; (e) mine construction; (f) exploration, development of mines, production and post-closure reclamation; exports; (g) price controls; (h) taxation and mining royalties; (i) regulations concerning business dealings with indigenous groups; (j) labour standards and occupational health and safety, including mine safety; and (k) historic and cultural preservation. Failure to comply with applicable laws and regulations may result in civil or criminal fines or penalties or enforcement actions, including orders issued by regulatory or judicial authorities, enjoining or curtailing operations, or requiring corrective measures, installation of additional equipment, or remedial actions, any of which could result in the Company incurring significant expenditures. The Company may also be required to compensate private parties suffering loss or damage by reason of a breach of such laws, regulations, or permitting requirements. It is also possible that future laws and regulations, or a more stringent enforcement of current laws and regulations by governmental authorities, could cause additional expenses, capital expenditures, restrictions on or suspensions of the Company’s exploration activities, if any, and delays in the development of the Silver Sand Project.
The Company conducts operations in Bolivia. The laws of Bolivia differ significantly from those of Canada and all such laws are subject to change. Mining is subject to potential risks and liabilities associated with environment and disposal of waste products occurring as a result of mineral exploration and production.
Failure to comply with applicable laws and regulations may result in enforcement actions and may also include corrective measures requiring capital expenditures, installation of additional equipment or remedial actions. Parties engaged in mining operations may be required to compensate those suffering loss or damage by reason of mining activities and may have civil or criminal fines or penalties imposed for violations of applicable laws and regulations.
New laws and regulations, amendments to existing laws and regulations, administrative interpretation of existing laws and regulations, or more stringent enforcement of existing laws and regulations could have a material adverse impact on future cash flow, results of operations and the financial condition of the Company.
While the Company believes the contractual relationships and the structures it has in place with private Bolivian companies owned 100% by Bolivian nationals for the Silverstrike Project and the Carangas Project are, or in the case of the Carangas Project, will be certified as, once approved by the AJAM, legally compliant with Bolivian laws related to the Frontier Area, there is no assurance that: (i) Minera Granville S.R.L. (“Granville”) will be successful in obtaining approval of the mining association agreement from AJAM in the case of the Carangas Project or the conversion of the exploration licenses to AMCs in the case of the Carangas Project, or (ii) such contractual relationships and structures will not be challenged by other Bolivian organizations or communities.
Impact of Environmental Laws and Regulations
The Company’s mineral projects are subject to regulation by governmental agencies under various environmental laws. These laws address emissions into the air, discharges into water, management of waste, management of hazardous substances, protection of natural resources, antiquities and endangered species, and reclamation of lands disturbed by mining operations. Compliance with environmental laws and regulations may require significant capital outlays on behalf of the Company and may cause material changes or delays in the Company’s intended activities. There can be no assurance that future changes in environmental regulations will not adversely affect the Company’s business, and it is possible that future changes in these laws or regulations could have a significant adverse impact on some portion of the Company’s business, causing the Company to re-evaluate those activities at that time.
Mining is Inherently Dangerous
The business of mining is subject to a number of risks and hazards including environmental hazards, industrial accidents, labour disputes, cave-ins, pit wall failures, flooding, fires, rock bursts, explosions, power outages, periodic interruptions due to inclement or hazardous weather conditions, and other acts of God or unfavourable operating conditions. Such risks could result in damage to, or
19
destruction of, mineral properties or processing facilities, personal injury or death, loss of key employees, environmental damage, delays in mining, increased production costs, monetary losses, and possible legal liability.
Where considered practical to do so, the Company will maintain insurance against risks in the operation of its business in amounts which it believes to be reasonable. Such insurance, however, contains exclusions and limitations on coverage. There can be no assurance that such insurance will continue to be available, will be available at economically acceptable premiums, or will be adequate to cover any resulting liability. In some cases, coverage is not available or is considered too expensive relative to the perceived risk. The Company may suffer a material adverse effect on its business if it incurs losses related to any significant events that are not covered sufficiently or at all by its insurance policies.
Financing
The continuing development of the Company’s mineral projects will depend upon the Company’s ability to obtain financing on reasonable terms. There is no assurance the Company will be successful in obtaining the required financing. The failure to obtain such financing could have a material adverse effect on the Company’s results of operations and financial condition.
Competition
The mining industry is intensely competitive. The Company will compete with other mining companies, many of which have greater financial resources for the acquisition of mineral claims and concessions, as well as for the recruitment and retention of qualified employees. Increased competition could adversely affect the Company’s ability to attract necessary capital funding.
Specialized Skill and Knowledge
All aspects of the Company’s business activities require specialized skills and knowledge. Such skills and knowledge include the fields of geology, mining, metallurgy, engineering, environment issues, permitting, social issues, and accounting. While competition in the resource mining industry has made it more difficult to locate and retain competent employees in such fields, the Company has been successful in finding and retaining experts for the majority of its key activities in the past.
Environmental Protection
The Company is currently in compliance with all material environmental regulations applicable to its exploration, development, construction and operating activities. The financial and operational effects of environmental protection requirements on capital expenditures, earnings and non-capital expenditures during the most recently completed financial year were not material.
Title to Mineral Properties
Establishing title to mineral properties is a very detailed and time-consuming process. Title to the area of mineral properties may be disputed. While the Company has investigated title to all of its mineral claims and, to the best of its knowledge, title to all of its properties are in good standing, the Company’s mineral properties may be subject to prior unregistered agreements or transfers and title may be affected by such undetected defects. There may be valid challenges to the title of the Company’s properties which, if successful, could impair exploration, development and/or operations. The Company’s mineral properties may be subject to indigenous land claims, prior unregistered agreements or transfers and title may be affected by undetected defects. The Company cannot give any assurance that title to its properties will not be challenged. None of the Company’s mineral properties have been surveyed, and the precise location and extent thereof may be in doubt.
Conflicts of Interest
Certain officers and directors of the Company are also directors, officers, employees, consultants or shareholders of other companies that are engaged in the business of acquiring, developing, and exploiting natural resource properties. Such associations may give rise to conflicts of interest from time to time. Such a conflict poses the risk that the Company may enter into a transaction on terms which place the Company in a worse position than if no conflict existed. The directors are required by law to act honestly and in good faith with a view to the best interest of the Company, and to disclose any interest which they may have in any project or opportunity of the Company. However, each director has a similar obligation to other companies for which such director serves as an officer or director. If a conflict of interest arises at a meeting of the Board, any director in a conflict will disclose his/her interest and abstain from voting on such matter. In determining whether or not the Company will participate in any project or opportunity, the Board will primarily consider the degree of risk to which the Company may be exposed and its financial position at that time.
20
Internal control over financial reporting as per the requirements of the Sarbanes-Oxley Act
Management of the Company is responsible for establishing and maintaining an adequate system of internal control over financial reporting, and used the Internal Control – Integrated Framework (2013) issued by the Committee of Sponsoring Organizations of the Treadway Commission (“COSO”) to evaluate, with the participation of the CEO and CFO, the effectiveness of internal controls. The Company’s internal control over financial reporting includes:
| · | maintaining records, that in reasonable detail, accurately and fairly reflect our transactions and dispositions of the assets of the Company; |
| · | providing reasonable assurance that transactions are recorded as necessary for preparation of our consolidated financial statements in accordance with generally accepted accounting principles; |
| · | providing reasonable assurance that receipts and expenditures are made in accordance with authorizations of management and the directors of the Company; and |
| · | providing reasonable assurance that unauthorized acquisition, use or disposition of Company assets that could have a material effect on the Company’s consolidated financial statements would be prevented or detected on a timely basis. |
Based on this evaluation, management concluded that the Company’s internal control over financial reporting based on the criteria set forth in Internal Control – Integrated Framework (2013) issued by COSO was effective as of June 30, 2023 and provided a reasonable assurance of the reliability of the Company’s financial reporting and preparation of the financial statements.
No matter how well a system of internal control over financial reporting is designed, any system has inherent limitations. Even systems determined to be effective can provide only reasonable assurance of the reliability of financial statement preparation and presentation. Also, controls may become inadequate in the future because of changes in conditions or deterioration in the degree of compliance with the Company’s policies and procedures.
The failure to achieve and maintain the adequacy of our internal control over financial reporting on a timely basis could result in the loss of investor confidence in the reliability of the financial statements, which in turn could harm the business and negatively impact the trading price of shares or market value of other securities. In addition, any failure to implement required new or improved controls, or difficulties encountered in their implementation, could harm the operating results or cause to fail to meet the reporting obligations. There can be no assurance that the Company will be able to remediate material weaknesses, if any, identified in future periods, or maintain all of the controls necessary for continued compliance, and there can be no assurance that the Company will be able to retain sufficient skilled finance and accounting personnel, especially in light of the increased demand for such personnel among publicly traded companies. Future acquisitions of companies may provide the Company with challenges in implementing the required processes, procedures and controls in the acquired operations. Acquired companies may not have disclosure controls and procedures or internal control over financial reporting that are as thorough or effective as those required by securities laws currently applicable to the Company.
Outcome of Future Litigation or Regulatory Actions
Due to the nature of its business, the Company may be subject to regulatory investigations, claims, lawsuits and other proceedings in the ordinary course of its business. The results of these legal proceedings cannot be predicted with certainty due to the uncertainty inherent in litigation, including the discovery of evidence process, the difficulty of predicting decisions of judges and juries and the possibility that decisions may be reversed on appeal. There can be no assurances that these matters will not have a material adverse effect on the Company’s business.
No assurance can be given with respect to the ultimate outcome of future litigation or regulatory proceedings, and the amount of any damages awarded or penalties assessed in such a proceeding could be substantial. In addition to monetary damages and penalties, the allegations made in connection with the proceedings may have a material adverse effect on the reputation of the Company and may impact its ability to conduct operations in the normal course.
Litigation and regulatory proceedings also require significant resources to be expended by the directors, officers and employees of the Company and as a result, the diversion of such resources could materially affect the ability of the Company to conduct its operations in the normal course of business. Significant fees and expenses may be incurred by the Company in connection with the investigation and defense of litigation and regulatory proceedings. The Company may also be obligated to indemnify certain directors, officers, employees and experts for additional legal and other expenses pursuant to such proceedings, which additional costs may be substantial and could have a negative effect on the Company’s future operating results. The Company may be able to recover certain
21
costs and expenses incurred in connection with such matters from its insurer. However, there can be no assurance regarding when or if the insurer will reimburse the Company for such costs and expenses.
Bringing actions and enforcing judgments under U.S. securities laws
Investors in the U.S. or in other jurisdictions outside of Canada may have difficulty bringing actions and enforcing judgments against the Company, its directors, its executive officers and some of the experts named in this AIF based on civil liabilities provisions of the U.S. federal securities laws, other laws in the U.S. state(s) in or the equivalent laws of other jurisdictions of residence.
Foreign Currency Exchange Fluctuations
Operations in Bolivia are subject to foreign currency exchange fluctuations. The Company raises its funds through equity issuances which are priced in Canadian dollars, and the majority of the exploration costs of the Company are denominated in U.S. dollars and/or the Bolivian boliviano. The Company may suffer losses due to adverse foreign currency fluctuations. The Company does not actively hedge against foreign currency fluctuations.
Dependence on Certain Key Personnel
The Company is highly dependent upon its senior management and other key personnel, and the loss of any such individuals could have a materially adverse effect on the business of the Company. In addition, there can be no assurance that the Company will be able to maintain the services of its officers or other key personnel required in the operation of the business. Failure to retain these individuals could adversely impact the Company’s business and prospects.
Recent and Current Market Conditions
Over recent years worldwide securities markets, including those in the U.S. and Canada, have experienced a high level of price and volume volatility. Accordingly, the market price of securities of many mining companies, particularly those considered exploration or development-stage companies, have experienced unprecedented shifts and/or declines in price which have not necessarily been related to the underlying asset values or prospects of such companies. As a consequence, despite the Company’s past success in securing equity financing, market forces may render it difficult or impossible for the Company to secure investors to participate in new share issues at an attractive price for the Company, or at all. Therefore, there can be no assurance that significant fluctuations in the trading price of the Shares will not occur, or that such fluctuations will not have a material adverse impact on the Company’s ability to raise equity funding.
Dividends
To date, the Company has not paid dividends on any of its Shares and the Company is not required to pay any dividends on the Shares in the foreseeable future. Any decision to pay dividends will be made on the basis of the Company’s earnings, financial requirements and other conditions.
Company Risk
Economic factors affecting the Company
Many industries, including the mining industry, are impacted by market conditions. Some of the key impacts of the recent financial market turmoil include emerging risks relating to the spread of COVID-19, contraction in credit markets resulting in a widening of credit risk, devaluations and high volatility in global equity, commodity, foreign exchange and precious metals markets, and a lack of market liquidity. A continued or worsened slowdown in the financial markets or other economic conditions, including but not limited to, consumer spending, employment rates, business conditions, inflation, fuel and energy costs, consumer debt levels, lack of available credit, the state of the financial markets, interest rates, and tax rates may adversely affect the Company’s growth and profitability. Specifically: the volatility of silver, lead and zinc prices may impact the Company’s revenues, profits, losses and cash flow; volatile energy prices, commodity and consumable prices and currency exchange rates would impact the Company’s production costs; and the devaluation and volatility of global stock markets may impact the valuation of the Company’s equity and other securities. These factors could have a material adverse effect on the Company’s financial condition and results of operations.
Loss of Investment Risk
22
An investment in the Company is speculative and may result in the loss of a substantial portion of an investor’s investment. Only potential investors who are experienced in high-risk investments and who can afford to lose a substantial portion of their investment should consider an investment in the Company.
No Guaranteed Return
There is no guarantee that an investment in the Company will earn any positive return in the short term or long term.
Cybersecurity Risks
The Company is subject to cybersecurity risks including unauthorized access to privileged information, destroy data or disable, degrade or sabotage our systems, including through the introduction of computer viruses. Although we take steps to secure our configurations and manage our information system, including our computer systems, internet sites, emails and other telecommunications, and financial/geological data, there can be no assurance that measures we take to ensure the integrity of our systems will provide protection, especially because cyberattack techniques used change frequently or are not recognized until successful. The Company has not experienced any material cybersecurity incident in the past, but there can be no assurance that the Company would not experience in the future. If our systems are compromised, do not operate properly or are disable, we could suffer financial loss, disruption of business, loss of geology data which could affect our ability to conduct effective mine planning and accurate mineral resources estimates, loss of financial data which could affect our ability to provide accurate and timely financial reporting.
| Item 5: | MINERAL PROPERTY |
As at June 30, 2023, the Company considers the Silver Sand Project and Carangas Project to be its material properties for the purposes of NI 43-101.
| 5.1 | Silver Sand Project |
(1) Current Technical Report
The current technical report for the Silver Sand Project is the Silver Sand Technical Report. The Silver Sand Technical Report supersedes all prior technical reports relating to the Silver Sand Project. The qualified persons for the Silver Sand Technical Report are the Silver Sand Technical Report Authors. The Silver Sand Technical Report was prepared in accordance with the requirements of NI 43-101 for filing on SEDAR+.
The disclosure set out below regarding the Silver Sand Project is based on, without material modification or revision, the disclosure in the Silver Sand Technical Report unless otherwise indicated. The Silver Sand Technical Report is available for review under the Company’s SEDAR+ profile at www.sedarplus.ca. The Silver Sand Technical Report contains more detailed information and qualifications than are set out below and readers are encouraged to review the Silver Sand Technical Report. This summary is subject to all of the assumptions, information and qualifications set forth therein.
The Silver Sand Technical Report provides an updated mineral resource estimate and provides the results of a preliminary economic assessment on the Silver Sand Project. The Company, through its wholly-owned subsidiaries, acquired exploration and mining rights over an aggregate area of approximately 60 square km (km2) covering the Silver Sand deposit and its surrounding areas. The Silver Sand area has been intermittently mined for silver from narrow high-grade mineralized veins in the Cretaceous sandstone since early to mid-1500s.
(2) Project Description, Location and Access
The Silver Sand Project is situated in the Colavi District of Potosí Department in southwestern Bolivia, 33 km north-east of Potosí city, the department capital. The approximate geographic center of the Silver Sand Project is 19°22’ 4.97” S latitude and 65°31’ 22.93” W longitude at an elevation of 4,072 m above sea level. The Silver Sand Project is accessed from Sucre and Potosí by travelling along a paved highway to the community of Don Diego, and then north from Don Diego along a 27 km, maintained, all weather gravel road. Don Diego is accessed by driving 129 km to south-west from Sucre, or 29 km to the north east from Potosí along paved Highway 5.
Exploration and mining rights in Bolivia are granted by the Ministry of Mines and Metallurgy through AJAM. Under Mining and Metallurgy Law No. 535 (the “2014 Mining Law”), as modified by the Law No. 845 (the “2016 Mining Law”, together with the 2014
23
Mining Law, the “New Mining Laws”), tenure is granted as either an AMC or an exploration license. Tenure held under previous legislation was converted to Temporary Special Authorizations (“ATEs”), formerly known as “mining concessions”, under the New Mining Laws. These ATEs are required to be consolidated to new 25-hectare sized cuadriculas (concessions) and converted to AMCs. AMCs created by conversion recognize existing rights of exploration and / or exploitation and development, including treatment, foundry refining, and / or trading.
AMCs have a fixed term of 30 years and can be extended for a further 30 years if certain conditions are met. Each contract requires ongoing work and the submission of plans to AJAM.
Exploration licenses are valid for a maximum of five years and provide the holder with the first right of refusal for an AMC.
In specific areas, mineral tenure is owned by the Bolivian state mining corporation, COMIBOL. In these areas development and production agreements can be obtained by entering into a MPC with COMIBOL.
Depending on the nature and scope of the activities to be conducted, the operator may need specific licenses or dispensations from the environmental authorities under the Ministry of Environment and Water or the Departmental Governorships. This applies to projects that may require consultation with a population that could be affected by the Silver Sand Project.
Other than the risk factors described under the heading “Risk Factors” in this AIF, including, but not limited to, the risks factors “Political and Economic Risks in Bolivia”, “Illegal Artisanal and Small-Scale Mining” and “Community Relations and Social License to Operate”, there are no other known significant factors or risks that might affect access or title, or the right or ability to perform work on the Silver Sand Project, including permitting and environmental liabilities to which the Silver Sand Project is subject.
100% Owned New Pacific Tenure
The Silver Sand Project originally comprised 17 ATEs, now converted to a consolidated AMC covering an area of 3.1656 km2. These ATEs were acquired by New Pacific in its original purchase of the interests of Alcira, now New Pacific’s wholly owned subsidiary. They are valid for 30 years and can be extended for an additional 30 years.
In accordance with the 2014 and 2016 Mining Laws, New Pacific (through Alcira) submitted all required documents for the consolidation and conversion of the original 17 ATEs, which comprise the core of the Silver Sand Project, to Cuadriculas and AMC, to AJAM. Conversion was initially approved by AJAM in February 2018. On 6 January 2020, Alcira signed an AMC with AJAM pursuant to which the 17 ATEs were consolidated into one concession named as Arena De Plata (Silver Sand) with an area of 3.1656 km2. This AMC is registered with the mining register with mining registration number 1-05-1500055-0001-21, notary process completed and registration published in the mining gazette on 15 July 2021.
In addition, New Pacific acquired 100% interest in three continuous concessions originally consisting of ATEs called Jisas, Jardan and El Bronce from third party private entities. The Jisas and Jardan concessions have been consolidated into an AMC named as Jisasjardan with an area of 1.75 km2. This AMC is registered by AJAM with registration number 1-05-1500410-0094-22. The El Bronce concession has been consolidated into an AMC named Bronce with an area of 0.5 km2. This AMC is registered by AJAM with registration number 1-05-1501194-0093-22. These two AMCs have been notarized and registration published in the mining gazette on 12 February 2023.
The total area of AMCs under full control of the Company is 5.42 km2 after the consolidation and conversion. The following table summarizes the Silver Sand Project mineral tenure.
Mineral Tenure controlled by New Pacific
| National registry | Name | Concession type |
Size of in km2 |
Titleholder | Duration |
| 1-05-1500055-0001-21 | Arena De Plata | AMC | 3.17 | Empresa Minera Alcira S.A. |
30 years from February 14, 2020 |
| 1-05-1500410-0094-22 | Jisasjardan | AMC | 1.75 |
Empresa Jisas – Jardan SRL |
30 years from December 4, 2020 |
| 1-05-1501194-0093-22 | Bronce | AMC | 0.5 | Empresa El Cateador SRL | 30 years from January 15, 2021 |
| Totals | 5.42 | ||||
24
Mining production contract
The Company, through Alcira, entered into an MPC with COMIBOL on January 11, 2019. An updated MPC was entered with COMIBOL on January 19, 2022. The updated MPC covers 12 ATEs and 196 cuadriculas for a total area of about 55 km2 surrounding the Silver Sand Project core area. The MPC must be ratified by the Congress of Bolivia (“Congress”) to be valid and enforceable.
Once the MPC has been ratified by Congress, the MPC with COMIBOL will be valid for 15 years which may be automatically renewed for an additional 15 year term and potentially, subject to submission of an acceptable work plan, for an additional 15 year term for a total of 45 years. According to the terms of the MPC, the Company will pay COMIBOL a 6% gross sales value if the mineral concessions covered by the MPC are commercially exploited at a future date.
Environmental permits
The Company has successfully obtained environmental permits from local authorities to conduct mineral exploration and drilling activities in the mineral concessions fully owned by the Company and the MPC areas owned by COMIBOL.
Land holding costs
AJAM employs a special tax unit (“STU”), that is indexed to the “Unidad de Fomento a la Vivienda”, to calculate the annual fee which mineral concession holders have to pay to the government. Depending on the type and size of mineral concessions, the number of STUs varies between 375 and 692 STUs per cuadricula. In 2019, each STU was equivalent to two Bolivianos. Note that the STU may change slightly year by year.
The following table provides details of fees paid to the government from 2019 to 2022. In the years 2019 to 2021, fees were paid based on the 17 ATEs. Starting from year 2022, fees are paid based on the consolidated concession of AMCs. For the concessions covered by the MPC with COMIBOL, fees are paid only for 7 ATEs in the year 2019. The Company does not have to pay any fees to the government for the remaining ATEs owned by COMIBOL and covered by the MPC as they are nationalized concessions. The fees were paid for year 2019 only as COMIBOL did not provide account information to make payments for years 2020, 2021, and 2022. For the 196 cuadriculas, according to the terms of MPC, the Company will have to pay the annual fees to the government when COMIBOL is granted mineral concessions by AJAM. In addition, the Company will pay COMIBOL a management fee of $10,000 per month for all the concessions covered by the MPC upon ratification.
Fees paid to government from 2019 to 2022
| Concessions | Title holder | 2019 | 2020 | 2021 | 2022 |
|
17 ATEs Arena de Plata Bronce Jisas Jardan 7 ATEs of MPC |
Empresa Minera Alcira S.A. Empresa Minera Alcira S.A. Empresa El Cateador SRL Empresa Jisas – Jardan SRL Empresa Jisas – Jardan SRL COMIBOL |
11,644
222 4,620 1,848 3,215 |
11,869
226 4,710 1,884 |
12,093
230 4,800 1,920 |
6,140 233 4,850 1,940 |
|
Total Bolivianos Equivalent to US$ |
21,549 $3,096 |
18,689 $2,685 |
19,043 $2,736 |
13,163 $1,891 |
Surface rights
As per the 2014 Mining Law, holders of mining rights may obtain surface rights through administrative agreements entered into with AJAM. In addition, surface rights may be obtained on third-party contract areas and by neighbouring properties by the following means: (i) agreement between parties; (ii) payment of compensation; and (iii) compliance with the regulations and procedures for
25
authorization. Once surface rights are obtained, holders of mining rights may build treatment plants, dams and tailings, infrastructure and other infrastructure necessary to carry out mining activities. The Company has not yet obtained surface land rights.
Royalties and encumbrances
For the MPC, if commercial production commences, the Company will pay COMIBOL a 6% gross sales value of all minerals produced from the MPC areas.
AMCs are subject to the following royalties and duties:
(i) Mining royalty: The royalty is applicable to all mining actors and applies to the exploitation of mineral resources and non-renewable metals pursuant to the New Mining Laws. The royalty is established according to the status of the mineral (raw, refined, etc.), on whether the mineral will be exported, and international mineral prices. The royalty applicable to silver pre-concentrates, concentrates, complexes, precipitates, bullion or molten bar and refined ingot is as shown in the following table.
Royalty applicable to silver in MPC
| Official silver price per troy ounce (US$) | Aliquot (%) |
|
Greater than $8.00 From $4.00 to $8.00 Less than $4.00 |
6 0.75 * official silver price 3 |
(ii) Mining Patent: Is a requirement for the mining operator to continue holding mining rights over the mining area. Patents are calculated according to the size of the area under the exploration license or contract, as set out in the 2014 Mining Law. Failure to pay for the patents will trigger the loss of the underlying exploration or mining rights.
(3) History
Mining activity has been carried out on the Silver Sand Project and adjacent areas by various operators intermittently since the early 16th century. Historical mining activities on the Silver Sand Project mainly targeted high-grade vein structures and records of historical mine production are not available.
Despite the long history of mining on the Silver Sand Project and its adjacent areas, there has been little modern systematic exploration work recorded prior to 2009. In 2009 modern exploration on the Silver Sand Project commenced when Ningde Jungie Mining Industry Co. Ltd. (NJ Mining) purchased Alcira, owner of the Silver Sand Project from Empresa Minera Tirex Ltda, a private Bolivia mining company. New Pacific acquired Alcira from NJ Mining, in mid-2017.
NJ Mining carried out a comprehensive exploration program across the Silver Sand Project. Exploration work comprised geological mapping, surface and underground sampling, trenching, and the drilling of eight diamond drillholes for 2,334 metres (m).
There are no known historical estimates of mineral resources or mineral reserves at the Silver Sand Project, and there has been no documented production from the Silver Sand Project.
(4) Geological Setting, Mineralization and Deposit Types
The Silver Sand Project is located in the south section of the polymetallic tin belt in the Eastern Cordillera of the Central Andes, Bolivia. The oldest rocks observed within the Silver Sand Project comprise Ordovician to Silurian marine, clastic sediments which have been intensely folded and faulted.
Bedrock in the Silver Sand Project area mainly consists of weakly deformed Cretaceous continental sandstone, siltstone, and mudstone and the strongly deformed Paleozoic marine sedimentary rocks. The Cretaceous sedimentary sequence forms an open syncline which plunges gently NNW and is bounded to the SW and NE by NW trending faults.
The Cretaceous sedimentary sequence within the Silver Sand Project is divided into the lower La Puerta Formation and the upper Tarapaya Formation. The La Puerta Formation consists of sandstones and unconformably overlies the highly folded Paleozoic marine sedimentary rocks. The Tarapaya Formation conformably overlies the La Puerta sandstones in the central part of the Silver Sand Project and comprises siltstones and mudstones intercalated with minor sandstone. Both the Cretaceous and Paleozoic sedimentary sequences are intruded by numerous small Miocene subvolcanic dacitic porphyry intrusions.
26
The Silver Sand Project exhibits a variety of geometries and morphology of the mineralized bodies which are controlled and hosted by local structures of tectonic transfer nature. Some are evident in outcrops, but the best examples are observed in drill cores and in underground workings. Mineralized structures usually appear as steps-overs developed between two neighbouring fault / vein segments that exhibit an echelon arrangement and may or may not be connected by lower-ranking faults / vein. These types of structures are of fractal type, which implies that they repeat their geometry, regardless of the observation scale, in arrangements of sigmoid (jogs), echelon, subparallel stepped, relay, horsetails, and extensional nets (swarms).
A total of eleven mineralized prospects have been identified across the Silver Sand Project to date. These include the Silver Sand deposit and the El Fuerte, San Antonio, Aullagas, Snake Hole, Mascota, Esperanza, North Plain, Jisas, Jardan, El Bronce, occurrences. Silver Sand, Snake Hole, Jisas, and El Bronce have been tested by drilling. Another nine prospects were defined by rock chip and grab sampling of ancient and recent artisanal mine workings and dumps. Exploration results from surface outcrops and underground workings defined a silver mineralized belt 7.5 km long and 2 km wide. At the Silver Sand deposit mineralization has been traced for more than 2,000 m along strike, to a maximum width of about 680 m and a dip extension of more than 250 m.
Four mineralization styles have been recognized in the Silver Sand Project, and these in order of importance are: (1) sandstone-hosted silver mineralization, (2) porphyritic dacitic-hosted silver mineralization, (3) diatream breccia-hosted silver mineralization, and (4) manto-type tin and base metal mineralization.
The mineralization in the Silver Sand Project comprises silver-containing sulphosalts and sulphides occurring within sheeted veins, stockworks, veinlets, breccia infill and disseminated within host rocks. The most common silver-bearing minerals include freibergite [(Ag,Cu,Fe)12(Sb,As)4S13], miargyrite [AgSbS2], polybasite [(Ag,Cu)6(Sb,As)2S7] [Ag9CuS4], bournonite [PbCuSbS3] (some lattices of copper may be replaced by silver), andorite [PbAgSb3S6], and boulangerite [Pb5Sb4S11] (some lattices of lead may be replaced by silver). Most silver mineralization is hosted in La Puerta sandstone units with minor amounts in porphyritic dacite diatreme breccia.
The Silver Sand Project is an epithermal silver deposit. Silver mineralization is hosted by faults, fractures, fissures, and crackle breccia zones in the Cretaceous La Puerta (brittle) sandstone and porphyritic dacitic dikes, laccolith, and stocks. In the mineralized sandstone, open spaces are filled with silver-containing sulphosalts and sulphides in forms of sheeted veins, stockworks, and veinlets, as well as breccia fillings and minor disseminations. Most silver mineralization in the Silver Sand Project is structurally controlled with secondary rheological controls. The intensity of mineralization is dependent on the frequency of various mineralized vein structures developed in the brittle host rocks.
Silver and base metal mineralization in the Silver Sand Project was formed during the regional uplifting and erosion process associated with the Tertiary orogenic events in the Eastern Cordillera. The genetic model of silver and tin mineralization in the Silver Sand Project is a magmatic-hydrothermal system related to a deep-seated magmatic centre.
(5) Exploration
Since October 2017, New Pacific has carried out an extensive property-scale reconnaissance investigation program by surface and underground sampling of the mineralization outcrops and the accessible ancient underground mine workings across the Silver Sand Project.
A total of 1,046 rock chip samples were collected from 35 separate outcrops by New Pacific. Continuous chip samples were collected at 1.5 m intervals along lines roughly perpendicular to the strike direction of the mineralization zones. Sample lines covered a total length of 2,863 m. Most of the sampled outcrops are located above or near old mine workings.
New Pacific has also mapped and sampled 65 historical mine workings comprising 5,780 m of underground tunnels. A total of 1,171 continuous chip samples have been collected at 1 – 2 m intervals along walls of available tunnels that cut across the mineralized zones.
Mine dumps from historical mining activities are scattered across a significant portion of the Silver Sand Project. New Pacific has collected a total of 1,408 grab samples from historical mine dumps. The majority of samples collected were remnants of high-grade narrow veins extracted from underground mining activity. Of the 1,408 samples collected from historical mine dumps to date, 439 samples (31%) returned assay results between 30 and 3,290 grams per tonne (g/t) Ag with an average grade of 194 g/t Ag.
Assay results of underground chip samples and surface mine dump grab samples show that silver mineralization widely occurs in the wall rocks of the previously mined-out high-grade veins in the abandoned ancient underground mining works.
27
(6) Drilling
From October 2017 to July 2022, New Pacific conducted intensive diamond drilling programs on the Silver Sand Project totalling 139,920 m in 564 drillholes. A total of 523 HQ diamond holes for a total metreage of 128,074 m was drilled over the Silver Sand core area to define the mineralization. After drilling specific exploration targets, holes were drilled on a 50 m x 50 m grid to delineate the spatial extensions of the major mineralized zones. This was followed up by drilling on a nominal 25 x 25 m grid, infilling defined areas of mineralization. Drilling was halted during 2020 and part 2021 due to COVID-19 protocols and recommenced later in 2021.
All holes were drilled from the surface. Drillholes were drilled up to 545 m deep at inclinations between -45° and -80° towards azimuths of 060° (~NE) and 220° (~SW) to intercept the principal trend of mineralized vein structures perpendicularly.
The drilling programs have covered an area of approximately 1,600 m long in the north-south direction and 800 m wide in the east-west direction and have defined silver mineralization at the Silver Sand deposit over an oblique strike length of 2 km, a collective width of 650 m and to a depth of 250 m below surface.
Drill coring was completed using conventional HQ (64 millimetre (mm) diameter) equipment and 3 m drill rods. Drill collars are surveyed using a Real-Time Kinematic differential global positioning system (GPS), and downhole deviation surveys are completed by the drilling contractor using a REFLEX EZ-SHOT and SPT GyroMaster downhole survey tools. Drillholes are surveyed at a depth of approximately 20 m, and on approximately 30 m intervals as drilling progresses. Upon completion of each drillhole a concrete monument is constructed with the hole details inscribed.
Core is collected by New Pacific personnel and drill core containing visible mineralization is wrapped in paper to minimize disturbance during transport. Logging is both carried out at the rig where a quick log is completed, and after transportation to the Company’s Betanzos core processing facility, which is located approximately 1.5 hours, by road, from the Silver Sand Project. Currently data is directly collected or loaded into MX Deposit a database software from Sequent.
In addition to drilling in the Silver Sand core area, drilling was carried out at Snake Hole (32 drillholes for 7,457 m) and at the northern prospects, (9 drillholes for 4,298 m). These holes were more exploratory in nature but the same procedures as the grid drilling in the core area were employed.
Core recovery from the drill programs varies between 0% (voids and overburden) and 100%, averaging 97%. More than 92% of core intervals have a core recovery of greater than 95%.
(7) Sampling, Analysis and Data Verification
New Pacific has developed and implemented good standard procedures for sample preparation, analytical, and security protocols.
New Pacific manages all aspects of sampling from the collection of samples, to sample delivery to the laboratory. All samples are stored and processed at the Betanzos facility. This facility is surrounded by a brick wall, has a locked gate, and is monitored by video surveillance and security guards 24 hours a day, seven days a week. Within the facility, there are separate and locked areas for core logging, sampling, and storage.
Samples are transported on a weekly basis by New Pacific personnel from the Betanzos facility to the ALS laboratories (“ALS”) in Oruro, Bolivia for sample preparation, and then shipped to ALS in Lima, Peru for geochemical analysis. ALS Oruro and ALS Lima are part of ALS Global – an independent commercial laboratory specializing in analytical geochemistry services, all of which are accredited. in accordance with ISO/IES 17025:2017, and are independent of New Pacific.
All core, chip, and grab samples are prepared using the following procedures: (1) crush to 70% less than 2 mm; (2) riffle split off 250 g; and (3) pulverize split to better than 85% passing a 75-micron sieve.
Sample analysis in 2017 and 2018 comprised an aqua regia digest followed by Inductively Coupled Plasma (“ICP”) Atomic Emission Spectroscopy (AES) analysis of Ag, Pb, and Zn (ALS code OG46). Assay results greater than 1,500 g/t Ag were sent for fire assay and gravimetric finish analysis. In 2019 New Pacific changed its analysis protocol to include systematic multielement analysis for an initial 51 element ICP mass spectroscopy (MS) analysis. Over-limit samples were handled differently for different elements and protocols were further amended for the 2021-2022 drilling.
28
Drill programs have included quality assurance and quality control monitoring programs which have incorporated the insertion of certified reference materials (“CRMs”), blanks, and duplicates into the sample streams, and umpire (check) assays at a separate laboratory at different times.
Four different CRMs have been used throughout the Silver Sand Project history. A total of 4,495 CRMs were submitted between October 2017 and July 2022 representing an average overall insertion rate of 5%. Insertion rates for CRMs have been consistently above 5% on a yearly basis with the exception of 2019.
Blank material from two different quarry sites been used over time and coarse blanks have been inserted consistently at an acceptable insertion rate. While there have been some changes in failure criteria, there has been no evidence of systemic contamination and failures are dealt with by a re-assay protocol. Pulp blank samples have been inserted since 2021, but at a low insertion rate of less than 2.5%. Duplicates are also inserted, comprising field duplicates, coarse duplicates and pulp duplicates. In 2021 and 2022 they have been consistently included but at a rate of between 3.65% and 4.07%. Coarse rejects were also submitted to Actlabs Skyline as umpire samples in the 2017 to 2019 period. Actlabs Skyline is an independent geochemical laboratory certified according to ISO 9001:2015.
The qualified person has reviewed the quality assurance and quality control procedures used by New Pacific including certified reference materials, blank, duplicate and umpire data and has made some recommendations. The qualified person does not consider these to have a material impact on the mineral resource estimate and considers the assay database to be adequate for mineral resource estimation. The qualified person considers sample preparation, security, and analytical procedures employed by New Pacific to be adequate.
New Pacific has established quality assurance and quality control (“QA/QC”) procedures which cover sample collection and processing at the Silver Sand Project. All drilling programs completed on the property incorporate the insertion of CRMs, blanks, and duplicates into the sample stream on a batch-by-batch basis. The qualified person completed a detailed review of QA/QC protocols during a site visit to the Silver Sand Project in 2019 and again in May 2022. The following discussion is based on the qualified person’s findings from the site visit and an independent review of drilling and QA/QC databases associated with the 556 drillholes for which assays have been received at the date of closure of the database for the Mineral Resource.
New Pacific monitors Ag, Au, Pb, Zn, and Cu assay values in CRMs, blanks, and duplicates however only the results of silver are discussed in this report as silver constitutes the majority of the value in the Mineral Resource.
A summary of QA/QC samples from the October 2017 – July 2022 program is presented in the following table.
Silver Sand QA/QC samples by year1 (October 2017 – July 2022)
| Year2 | Drill Samples |
CRMs3 | Coarse Blanks |
Pulp Blanks |
Field duplicates (¼ core) |
Pulp duplicates |
Coarse reject duplicates |
Coarse reject umpire duplicates |
| 2017 | 3,213 | 172 | 31 | 0 | 16 | 0 | 0 | 173 |
| 2018 | 34,638 | 1,747 | 1,684 | 0 | 208 | 0 | 0 | 1,615 |
| 2019 | 30,629 | 1,106 | 1,159 | 0 | 243 | 0 | 0 | 1,063 |
| 2020 | 1,735 | 359 | 422 | 0 | 0 | 0 | 0 | 0 |
| 2021 | 7,688 | 433 | 327 | 141 | 309 | 288 | 312 | 0 |
| 2022 | 12,292 | 678 | 435 | 305 | 496 | 449 | 484 | 0 |
| Total | 90,175 | 4,495 | 4,058 | 446 | 1,272 | 737 | 796 | 2,851 |
Source: AMC Mining Consultants (Canada) Ltd., 2022.
Notes:
| (1) | Based on 556 drillholes with assay results. |
| (2) | Drillhole year based on the date of the Ag assay. |
| (3) | CRM statistics excludes CRMs submitted with umpire duplicate samples. |
The following table summarizes the insertion rate of these QA/QC samples. New Pacific’s QA/QC submission rate protocols are:
| · | CRMs: 5% |
| · | Coarse blanks – 3% |
29
| · | Field duplicates – 2 - 3% |
| · | Coarse reject duplicates – 2 – 3% |
| · | Pulp duplicates – 2 – 3% |
| · | Umpires – 5% |
The QP recommends that insertion rates should be approximately 5% for CRMs and blanks and 6% for duplicates (2% each for field, coarse reject, and pulps duplicates) and 5% for umpires.
Silver Sand QA/QC submission rates1 (October 2017 – July 2022)
| Year2 | CRMs3 | Coarse Blanks |
Pulp Blanks |
Field duplicates (¼ core) |
Pulp duplicates |
Coarse reject duplicates |
Coarse reject umpire duplicates |
Total QA/QC |
| 2017 | 5.4% | 1.0% | 0.0% | 0.5% | 0.0% | 0.0% | 5.4% | 12.2% |
| 2018 | 5.0% | 4.9% | 0.0% | 0.6% | 0.0% | 0.0% | 4.7% | 15.2% |
| 2019 | 3.6% | 3.8% | 0.0% | 0.8% | 0.0% | 0.0% | 3.5% | 11.7% |
| 2020 | 20.7% | 24.3% | 0.0% | 0.0% | 0.0% | 0.0% | 0.0% | 45.0% |
| 2021 | 5.7% | 4.3% | 1.8% | 4.0% | 3.8% | 4.1% | 0.0% | 23.6% |
| 2022 | 5.5% | 3.5% | 2.5% | 4.0% | 3.7% | 4.0% | 0.0% | 23.2% |
| Overall | 5.0% | 4.5% | 0.5% | 1.4% | 0.8% | 0.9% | 3.2% | 16.3% |
Source: AMC Mining Consultants (Canada) Ltd., 2022.
Notes:
| (1) | Based on 550 drillholes with assay results. |
| (2) | Drillhole year based on the date of the Ag assay. |
| (3) | CRM statistics excludes CRMs submitted with umpire duplicate samples. |
(8) Mineral Processing and Metallurgical Testing
Two significant metallurgical testwork programs have been completed since 2018.
The initial (2018/19) program was completed at SGS Mineral Services in Lima, Peru, and examined several metallurgical composites of Oxide, Transition, and Sulphide mineralization from two areas of the Silver Sand deposit. A geometallurgical sampling approach was used and was designed to highlight the effect of differences in silver grade, degree of oxidation, and lithology. Four independent geometallurgical testwork programs (mineral characterization, comminution, froth flotation, and cyanide leaching) were carried out on the different metallurgical composites. Six metallurgical domains were identified for the flotation and leaching testwork and six geological domains were branded for the comminution work.
The second (2020/21) program, also completed at SGS Mineral Services in Lima Peru, maintained the initial geometallurgical definitions and examined a larger and more representative set of metallurgical samples via master composites and high / low grade variants of Oxide, Transition, and Sulphide mineralization. A more comprehensive scope of work was completed in this program, including physical and chemical characterization, heavy liquids separation, mineralogical analysis, particle sorting, flotation, cyanidation, and environmental characterization.
Both metallurgical testing programs demonstrated that good silver recoveries are possible using conventional extraction methods and that further improvements and refinements should be possible in future programs after fine-tuning the various test parameters. Highlights of the two testwork programs are as follows:
| § | An initial assessment of ore sorting showed encouraging results. |
| § | A more comprehensive assessment of physical characteristics of the different oxidation types, indicated that samples are amenable to SAG milling. |
| § | Composite samples were found to be mostly in the soft to medium grindability range with low to medium values of Abrasion Index (Ai). |
30
| § | A larger flotation program culminated in locked cycle testing of new composite samples of Oxide, Transition and Sulphide mineralization, with silver recoveries of 67.4%, 83.2%, and 87.1% respectively at concentrate mass pulls of 0.5%, 2.2%, and 5.0%. Silver recovery is expected to increase with higher concentrate mass pull. |
| § | A more comprehensive cyanidation program included coarse-particle and fine-particle bottle roll leaching, column leaching and leaching of flotation concentrates. Cyanidation of composite samples ground to 80% -75 µm achieved silver extractions of up to 93.9%, 92.5%, and 78.3% for Transitional, Oxide, and Sulphide master composite samples respectively under conditions of sodium cyanide concentration of 2 grams per litre (g/L), dissolved oxygen concentration of 11-15 parts per million (ppm) and retention time of 48 hours. |
| § | Initial testing of cyanide detox amenability raised no concerns and suggests that SO2/Air is able to achieve residual cyanide concentration of 20 ppm WAD cyanide (CN) or less. |
| § | Initial environmental testing of flotation tailing and cyanidation residue was completed, including ABA and TCLP characterization. |
| § | Samples of oxide mineralization were submitted for coarse column (100% passing 12.7 mm) leach cyanidation testing and this achieved up to 88.3% silver extraction after 75 days. |
| § | High recoveries achieved during cyanidation tests indicate that silver-bearing minerals within the sulphide and transition composite samples tested can be considered non-refractory in nature. |
The results of the two testwork programs are consistent and suggest that the mineralized materials from the Silver Sand Project would be amenable to processing using conventional flotation or largescale whole ore cyanidation at atmospheric pressure. A process options trade off study completed in 2022 determined that a flowsheet including crushing, grinding, cyanidation in agitated tanks and Merrill Crowe zinc precipitation can provide a superior balance of costs and revenue, resulting in the highest relative IRR. This flowsheet was carried through to the PEA and is summarized in Section 1.11 and described in Section 17 of this report. There are no known processing factors or deleterious elements that could have a significant effect on potential economic extraction.
(9) Mineral Resources Estimate
The mineral resource estimate was completed using 556 drillholes on the Silver Sand Project comprising 136,220 m of diamond core and 92,164 assays. Grade interpolation was completed for silver, lead, zinc, copper, arsenic, and sulphur. Only silver is reported as it is the only economic metal. All estimation utilized ordinary kriging (OK) except for the 127 small domains which were estimated using the inverse distance squared (ID2 ) method.
The mineralization domains were built by New Pacific using Leapfrog Geo 4.0 software. The mineralization domains were reviewed and accepted by the qualified person with some changes, including separating the main domain into two areas based on vein orientation. The qualified person estimated into these domains and also estimated a background block model that was combined with the domain mineralization to form the final block model.
New Pacific performed 6,297 bulk density measurements on the core drilled on the Silver Sand Project. As the mineralization is hosted in one rock type, after reviewing the density data, the qualified person assigned a single bulk density measurement to the block model of 2.54 t/m3.
The pit-constrained mineral resources are reported for blocks above a conceptual pit shell based on a US$22.50/ounce silver price. There is not a reporting restriction to within the AMC claim boundary as in the technical report prepared in accordance with NI 43-101 titled “Technical Report – Silver Sand Deposit Mineral Resource Report” dated May 25, 2020, as amended on June 3, 2020, and with an effective date of January 16, 2020 and prepared by certain qualified persons associated with AMC Consultants, as an agreement has been reached with COMIBOL in regard to the surrounding MPC.
The cut-off applied for reporting the pit-constrained mineral resources is 30 g/t silver. Assumptions made to derive a cut-off grade (COG) included mining costs, processing costs and recoveries and were obtained from comparable industry situations. The model is depleted for historical mining activities. The assumptions are shown in the following table.
31
Cut-off grade and conceptual pit parameters
Input |
Units | Value |
| Silver Price | US$/oz Ag | 22.50 |
| Silver process recovery | % | 91 |
| Payable silver | % | 99 |
| Mining recovery factor | % | 100 |
| Mining cost | US$/t mined | 2.60 |
| Process cost | US$/t minable material > COG | 16.00 |
| G&A cost | US$/t minable material > COG | 2.00 |
| Slope angle | degrees | 44 - 47 |
Source: AMC Mining Consultants (Canada) Ltd., 2022.
Notes:
| ○ | Sustaining capital cost has not been included. |
| ○ | Measured, indicated and inferred mineral resources included. |
The mineral resources for the Silver Sand deposit has been estimated by Dinara Nussipakynova, P.Geo. Principal Geologist of AMC Consultants, who takes responsibility for the estimate. The effective date of mineral resource estimate is November 30, 2022.
Mineral resources that are not mineral reserves do not have demonstrated economic viability.
Mineral Resource as of October 31, 2022
Resource category |
Tonnes (Mt) | Ag (g/t) | Ag (Moz) |
| Measured | 14.88 | 131 | 62.60 |
| Indicated | 39.38 | 110 | 139.17 |
| Measured & Indicated | 54.26 | 116 | 201.77 |
| Inferred | 4.56 | 88 | 12.95 |
Source: AMC Consultants, 2022
Notes:
| ○ | The CIM Standards were used for reporting the mineral resources. |
| ○ | The qualified person is Dinara Nussipakynova, P.Geo. of AMC Consultants. |
| ○ | Mineral resources are constrained by an optimized pit shell developed at a metal price of US$22.50/oz Ag and recovery of 91% Ag and COG of 30 g/t Ag. |
| ○ | Drilling results up to July 25, 2022. |
| ○ | The numbers may not compute exactly due to rounding. |
| ○ | Mineral resources that are not mineral reserves do not have demonstrated economic viability. |
The qualified person is not aware of any metallurgical, environmental, permitting, legal, title, taxation, socio-economic, marketing, political, and other relevant issues that might affect the estimate of mineral resources, other than as set out below.
In last three years Bolivia experienced a transition from social turmoil to stability. The government of the current President, elected at the end of 2020, supports and encourages private and foreign investments in the economic sectors of the country. New laws were
32
approved by Congress to encourage private investments in the mining sector, for example, Law 1391 (Decree 4579) waives value added tax for import of equipment and vehicles.
Although the country is now generally friendly to private and foreign investments in the mining sector, risks associated with instability of government caused by political polarization and visible divisions in the governing party remains. In addition, local protests and blockages by various social groups may pose unforeseen instability from time to time. Overall, political and social risks are currently manageable in Bolivia.
See also the discussion under the heading “Risk Factors” in this AIF, including, but not limited to, the risks factors “Political and Economic Risks in Bolivia”, “Illegal Artisanal and Small-Scale Mining” and “Community Relations and Social License to Operate”.
There are no mineral reserves on the Silver Sand Project.
(10) Mining Operations
The Silver Sand Project comprises four open pit areas — the Main pit, two small northern satellite pits (NP1 and NP2), and one eastern satellite pit (EP1). The open pits are proposed to be mined using a conventional truck and excavator mining method using 140 t payload trucks and 200 - 260 t excavators. A mining contractor operation is proposed, with ore and waste to be mined on 10 m benches. A mining recovery of 92% and a mining dilution of 8% at zero grade has been assumed.
The Lerchs-Grossmann pit optimization algorithm, as implemented in the Whittle software, was used to define the ultimate pit shell for Silver Sand. The selected pit shells were then used to produce pit designs and the mining schedule. Pit optimization was allowed to extend outside the AMC claim boundary into the MPC area to the NE and SW.
In total four phases have been designed in the Main area (Main 1 to 4) and one for each of the three small satellite pits. Haulage ramps have been designed at 32 m wide for double lane traffic at a 10% gradient. Single lane ramps of 17 m width were designed for the bottom bench access and the small satellite pits.
A single out-of-pit waste dump has been designed immediately south-west of the open pits in a natural depression in the topography. The waste dump has been designed to accommodate the totality of the waste mined from the pits, as well as the disposal of filtered tailings from the plant. Two in-pit dumps have been designed in the main pit to provide flexibility and costs savings for waste placement. Re-sloping the waste dumps, in-pit dumps, and ROM pad and placement of topsoil will be carried out post mine closure.
The open pit contains approximately 55.4 Mt of mineralized material with a grade of 106.6 g/t Ag, and 199.7 Mt of waste material, with an overall waste to mineralized material strip ratio of 3.60 to 1. The open pit operation includes one year of pre-strip (Year -1) and fourteen-years of production.
To optimize the overall value of the Silver Sand Project and the sequence of mining, the value for each pit phase was estimated. The value, defined as the indicative undiscounted cashflow per tonne of mineralized material, accounts for preliminary mining costs, General and Administration (G&A), and processing costs. The projected value from each source and consideration of practical scheduling constraints provided a basis for the order in which the pits are scheduled.
The conceptual process feed schedule is summarized in the following table. In a typical year 4.0 Mt of ore will be delivered to the process plant. The total annual ex pit material mined peaks at 18.5 Mtpa, before dropping to approximately 13 Mtpa at the end of the open pit mine life.
LOM process plant feed schedule
|
Total | Yr - 1 | Yr 1 | Yr 2 | Yr 3 | Yr 4 | Yr 5 | Yr 6 | Yr 7 | Yr 8 | Yr 9 | Yr 10 | Yr 11 | Yr 12 | Yr 13 | Yr 14 |
| Total process feed (Mt) | 55.4 | - | 4.0 | 4.0 | 4.0 | 4.0 | 4.0 | 4.0 | 4.0 | 4.0 | 4.0 | 4.0 | 4.0 | 4.0 | 4.0 | 3.4 |
| Ag (g/t) | 106.6 | - | 135.3 | 135.6 | 131.5 | 139.1 | 103.4 | 96.6 | 74.8 | 72.7 | 102.3 | 93.3 | 113.6 | 113.3 | 102.3 | 74.2 |
| Mine to Process (Mt) | 46.6 | - | 3.0 | 4.0 | 4.0 | 4.0 | 3.2 | 4.0 | 1.3 | 2.0 | 4.0 | 3.5 | 4.0 | 4.0 | 4.0 | 1.6 |
| Ag (g/t) | 116.3 | - | 136.1 | 135.6 | 131.5 | 139.1 | 117.9 | 96.6 | 133.5 | 99.4 | 102.3 | 100.0 | 113.6 | 113.3 | 102.8 | 106.6 |
| Stockpile to Process (Mt) | 8.8 | - | 1.0 | - | - | - | 0.8 | - | 2.7 | 2.0 | - | 0.5 | - | - | - | 1.8 |
| Ag (g/t) | 55.6 | - | 132.7 | - | - | - | 48.3 | - | 45.5 | 45.4 | - | 45.3 | - | - | 45.3 | 45.3 |
33
| Mine to Stockpile (Mt) | 8.8 | 1.6 | 0.8 | 0.8 | 1.1 | 1.5 | 1.0 | 1.2 | 0.1 | - | 0.6 | - | 0.1 | - | - | - |
| Ag (g/t) | 55.6 | 99.9 | 45.4 | 46.0 | 46.1 | 47.3 | 45.5 | 44.5 | 42.5 | - | 45.0 | - | 45.1 | - | - | - |
Source: AMC Consultants, 2022
(11) Processing and Recovery Operations
Results from two recent metallurgical testwork programs have been used to select a processing flowsheet for the Silver Sand Project. Interpretation of the testwork has enabled the completion of a process trade off study, the preparation of preliminary process design criteria and initial equipment selections.
Several processing options were considered for this PEA, including heap leaching, froth flotation, and agitated tank cyanidation (using carbon or zinc precipitation for silver recovery from solution). After preliminary trade-off studies to compare the estimated capital cost, operating cost and metallurgical efficiency of different options, an agitated tank cyanidation process was selected as the PEA base case.
The selected flowsheet represents a very conventional, low-risk approach to silver extraction, and consists of the following unit operations:
| ● | Run-of-mine (ROM) receiving, crushing, and crushed rock storage. |
| ● | Stockpile discharge, grinding via SAG milling, and ball milling. |
| ● | SAG mill pebble crushing via SAG mill pebble ports, scalping screen, recycle conveyors, and cone crusher. • Pre-leach thickening and cyanide leaching using stirred, oxygen sparged tanks. |
| ● | Liquid / solid separation using counter-current decantation (thickeners). |
| ● | Recovery of silver from pregnant leach solution using a zinc precipitation process followed by drying and smelting with fluxes to produce silver doré bars. |
| ● | Thickening and filtration of leach residues. |
| ● | Conveying of filter cake and long-term storage at the tailing storage area. |
The base case flowsheet is expected to recover an average of 91% silver into a doré product for export to international markets.
(12) Infrastructure, Permitting and Compliance Activities
Currently there is no significant infrastructure in place. As a comprehensive greenfield project, the Silver Sand Project will require the development of supporting infrastructure. The Silver Sand Project is accessible from Potosi via a 54 km long road made up of a 27 km stretch of the paved Bolivia National Highway 5 and an all-season gravel road built for mining in the Colavi District.
The Silver Sand Project is estimated to require approximately 25 to 35 megawatts (MW) of power annually. New Pacific has engaged with Bolivia’s national power supply companies CNDC and ENDE. A preliminary power supply plan for the future operations has been discussed and agreed upon. The Company has submitted a power supply application to the Bolivia Ministry of Energy, following the formal procedure in the country. The Ministry of Energy issued an official letter to the Company acknowledging the application.
Water for domestic use can be obtained from a small lake, approximately 3.5 km north-west of the Silver Sand Project. Water for drilling can be sourced from nearby drainages. It is proposed that a water dam will be built up stream from the mine in the narrowest part of the creek to hold the water in a reservoir with a capacity of about 2.6 million cubic metres. This will provide water for the
34
mineral processing plant and mining camp and could supply downstream residents for farming and daily life water requirement if required.
The Filtered Tailings Storage Facility (Filtered TSF of TSF) will be integrated within the waste rock storage area. The TSF will be fully lined to provide protection against release of potentially contaminated water to the local surface and groundwater systems.
Accommodation and other infrastructure such as offices, workshop, warehouse, and laboratory are envisaged to be built close to the processing plant.
New Pacific has successfully obtained environment permits from local authorities to conduct mineral exploration and drilling activities in the mineral concessions fully owned by the Company and the MPC areas owned by COMIBOL.
35
(13) Capital and Operating Costs
The capital and operating costs estimate have been developed by the following contributors:
| ● | Halyard Inc: process plant, and plant infrastructure. |
| ● | NewFields: Tailings storage facility. |
| ● | AMC Consultants: site infrastructure, and open pit operating mining costs. |
| ● | New Pacific: owner’s costs, and general and administration costs. |
Costs are presented in US dollars ($) and are based on prices obtained during the fourth quarter of 2022 (4Q22).
Open pit mining costs are estimated based on contract mining.
G&A costs include camp accommodation, site administration compensation for land use, and mine closure costs.
Operating costs for the Silver Sand Project have been estimated and are summarized in the following table.
Operating costs summary
Description |
LOM average cost (US$/t feed) | Total LOM cost (US$M) |
| Mining cost | 9.55 | 529.7 |
| Processing cost | 14.20 | 787.3 |
| Tailings storage cost | 0.65 | 36.0 |
| G&A cost | 1.86 | 103.1 |
| Total operating cost | 26.26 | 1,456.1 |
Source: AMC Consultants, 2022
Note: Totals may not add up exactly due to rounding. G&A includes mine closure and land use compensation cost.
Capital costs for the Silver Sand Project have been estimated and are summarized in the following table.
Owner’s capital costs include relocation / resettlement, additional studies, permit applications, local community projects, flights, and accommodation.
36
Capital expenditure summary
Description |
Cost (US$M) |
| Open pit pre-striping | 47 |
| Contractor mobilization | 1 |
| Processing plant | 186 |
| Tailings facility | 25 |
| Site infrastructure | 47 |
| Owner’s cost | 21 |
| Total capital cost | 327 |
| Initial capital | 308 |
| Sustaining capital | 20 |
Source: AMC Consultants, 2022
Note: Includes direct, indirect, and contingency costs. Totals may not add up exactly due to rounding.
The cost estimate was prepared with a base date of the second half of Year -2 (1 July) and does not include any escalation beyond this date. For net present value (NPV) estimation, all costs and revenues are discounted at 5% from the base date. The economic model shows the Silver Sand Project under construction for 1.5 years (Year -2 and Year -1), which is considered development and then in production for the balance of the projected cash flows, which is considered operating (Years 1 to 14). Metal prices were selected after discussion with New Pacific and referencing current markets and forecasts in the public domain.
A regular Bolivian corporate income tax rate of 25% is applied. As a mining property, the Silver Sand Project is subject to an additional tax of 12.5%, with a 5% reduction for companies that produce pure metal products (as is the case with the Silver Sand Project producing silver doré onsite). Within the AMC a 6.0% royalty is paid based on gross sales. Most of the mineral resources lie within the AMC. Outside the AMC, an additional 6.0% royalty is to be paid. No other royalties or levies are applicable to the Silver Sand Project.
A high-level economic assessment of the proposed open pit operation was conducted. The Silver Sand Project is projected to generate approximately $1,106 million (M) pre-tax NPV and $726M post-tax NPV at 5% discount rate, pre-tax IRR of 52% and post-tax IRR of 39%. A summary of the potential economic outcome of the Silver Sand Project is presented in the following table.
37
Summary of potential economic results
Description |
Unit | Value |
| Total plant feed | Kt | 55,441 |
| Total waste production | Kt | 199,653 |
| Silver grade | g/t | 106.6 |
| Silver recovery | % | 91 |
| Silver price | US$/oz | 22.50 |
| Discount rate | % | 5 |
| Silver payable | % | 99 |
| Payable silver metal | Moz | 171.2 |
| Total net revenue | US$M | 3,510 |
| Total capital costs | US$M | 327 |
| Total operating costs | US$M | 1,456 |
| Mine operating costs | US$M | 530 |
| Process and tails storage operating costs | US$M | 823 |
| General and administrative costs | US$M | 103 |
| Operating cash cost | US$/oz Ag | 8.45 |
| All in sustaining cost | US$/oz Ag | 10.42 |
| Pre-tax payback period | Yrs | 1.4 |
| Post-tax payback period | Yrs | 1.9 |
| Pre-tax NPV | US$M | 1,106 |
| Pre-tax IRR | % | 52 |
| Post-tax NPV | US$M | 726 |
| Post-tax IRR | % | 39 |
Source: AMC Consultants, 2022
Notes:
| ○ | G&A costs include mine closure and land use compensation cost. |
| ○ | Cash costs include all operating costs and transportation charges. |
| ○ | All-in sustaining costs (AISC) include total cash costs, initial capital expenditures and sustaining capital expenditures. |
The PEA is preliminary in nature and it includes inferred mineral resources that are considered too speculative geologically to have the economic considerations applied to them that would enable them to be categorized as mineral reserves. There is no certainty that the PEA will be realized.
38
(14) Exploration, Development and Production
The Company is currently advancing its Silver Sand Project with a PFS study. This will require advancing the definition and engineering level of all of the mining, processing and infrastructure aspects. Relevant geology and metallurgical testworks are currently underway to facilitate the PFS study.
Besides the PFS study, the Company is under process of obtaining the Environmental Impact Statement (“DIA”) issued by the Ministry of Environmental and Water of Bolivia, which is a license required to start the construction of the mine. To obtain the DIA, the Company need to submit an Environmental Impact Assessment Study (“EEIA”) to the Ministry of Environmental and Water of Bolivia. Key components of the EEIA include:
| § | Technical documents for the Silver Sand Project (PEA or PFS); |
| § | Environmental and social baseline data; |
| § | Socialization and agreements with local communities; |
| § | Historical site study; and |
| § | Minutes of public consultation. |
For additional information on the Silver Sand Project, refer to the Silver Sand Technical Report available under the Company’s profile at www.sedarplus.ca.
| 5.2 | Carangas Project |
(1) Current Technical Report
The current technical report for the Carangas Project is the Carangas Technical Report. The Carangas Technical Report supersedes all prior technical reports relating to the Carangas Project. The qualified persons for the Carangas Technical Report is Anderson Gonçalves Candido, FAusIMM. The qualified person for section 13 of the Carangas Technical Report is Marcelo del Giudice, FAusIMM, Principal Metallurgist with RPM. The Carangas Technical Report was prepared in accordance with the requirements of NI 43-101 for filing on SEDAR+.
The disclosure set out below regarding the Carangas Project is based on, without material modification or revision, the disclosure in the Carangas Technical Report unless otherwise indicated. The Carangas Technical Report is available for review under the Company’s SEDAR+ profile at www.sedarplus.ca. The Carangas Technical Report contains more detailed information and qualifications than are set out below and readers are encouraged to review the Carangas Technical Report. This summary is subject to all of the assumptions, information and qualifications set forth therein.
The Carangas Technical Report provides an inaugural MRE on the Carangas Project. The Company, through its wholly owned subsidiary entered into a joint venture agreement or Mining Association Contract (“MAC”) with Granville (a private Bolivian company which owns the mineral right of the Carangas Project) to acquire 98% economic interest generated from the project by fulfilling the obligations outlined in the MAC.
(2) Project Description and Location
The Carangas Project is located at Carangas, in the western portion of the Oruro Department in Bolivia. It is approximately 190 kilometers (km) southwest of Oruro City. The Carangas Project area is accessible by vehicle from Oruro city, with approximately 197 kilometers of paved national Highway 12 leading to Sabaya, then a flat gravel road of 35 kilometers from Sabaya to Carangas.
The Carangas Project is presently held by Granville, a private Bolivian company, and comprised of three Prospecting and Exploration Licenses (“PELs”), namely Granville I, Granville II, and Colapso, covering a total area of 40.75 km2.
Each of the PELs in the following table has a validity term of five years, with provisions for one extension of three years. Annual costs to maintain the PELs are managed by Granville. As the project is located within 50 kms from international border where foreign companies or foreigners are not permitted to have ownership of land and right of mineral, Granville remains as the holder of all licenses, permits and rights granted to it by Bolivian authorities. See discussion under the heading “Risk Factors - Frontier Area” and “Additional Information - Carangas Project Title”. Other than the foregoing, there are no other royalties, back-in rights, payments, or other agreements and encumbrances to which the Carangas Project is subject.
39
Mining Rights of Carangas Project
| Concession Number | National Registry | Name | Concession type | Size in Km2 (hectares) | Title holder | Expiration Date |
| 2020081 | 4-02-2020081-0009-23 | Granville I | PEL | 2.75 (275) | Minera Granville S.R.L. | 20/11/2027 |
| 2020136 | 4-02-2020136-0088-21 | Granville II | PEL | 3.50 (350) | Minera Granville S.R.L. | 14/03/2026 |
| 2030438 | 4-02-2030438-0008-23 | Collapso | PEL | 34.5 (3450) | Minera Granville S.R.L. | 20/11/2027 |
New Pacific, through its wholly owned subsidiaries, entered into the MAC with Granville to jointly explore and develop the project under applicable Bolivian laws and pursuant to the terms and conditions of the MAC. New Pacific will cover all costs related to the exploration, development and mining of the project and will take 98% of the economic interest generated from the mining production of the project with the remaining 2% of economic interest to be taken by Granville. As the holder of mineral title of the property, Granville will be responsible for permitting matters to keep the property in good standing by applicable Bolivian laws. The MAC has a term of 30 years and is renewable for an additional 15 years.
(3) History
Mining activities in the Carangas district began in the late 16th century in the Spanish colonial era. During that time, mining activities were mainly focused on oxide materials and native silver. Currently, widespread ruins of historical mine workings are visible in the East Dome and the West Dome, historically known as San Antonio and Espiritu Santo hills.
Following the decline of the Spanish colonial era, mining activities in the Carangas area diminished. In 20th century, ownership of the Carangas Project was transferred between various international and Bolivian local mining companies. Notably, in the early 20th century, mining operations were revived by Moritz Hochschild and Federico Alhfeld, a German geologist regarded as the father of Bolivian geology was working on the project in 1923.
There has been a very limited amount of historical mineral exploration at Carangas. The earliest recorded exploration was conducted by COMSUR, a local Bolivian mining company who carried out channel sampling in underground workings of the San Jose, Orcko Tunku, and San Antonio adits in 1985, and collected over 350 samples with an average silver grade of 64 g/t Ag. Llicancabur Mining Ltda., a local Bolivia mining company completed a total of 1,001 meters in 9 reverse circulation holes in 1995 and COMSUR drilled 914.2 meters in 6 diamond drill holes in 2000 (Lopez-Montaño, 2019).
(4) Geology and Mineralization
The Carangas Project sits in the South American Epithermal-Porphyry Belt, featuring a geological sequence that includes Jurassic granites and the volcanic rocks of the Negrillos Formation and the Carangas Formation of Tertiary age. The Negrillos Formation consists of eroded lavas, tuffs, and volcanic breccias from ancient volcanic cones. Above the Negrillos Formation, the Carangas Formation includes rhyolitic to rhyo-dacitic intrusive dykes, lithic tuffs, phreatomagmatic breccias intercalated with fluvial sediments in upper portion and andesitic volcanoclastic rocks in the lower portion.
The Carangas area is interpreted as a grand volcanic caldera system of Tertiary age. The Carangas Project is located at the southwest corner of the Carangas basin, and geomorphologically is comprised of two prominent hills namely the West Dome and the East Dome, and a fluvial valley in between called the Central Valley. In addition, there is a small hill known as South Dome near the south end of the Central Valley. At the surface of the Carangas Project, silver-lead-zinc mineralized vein structures predominantly strike in a West-Northwest direction with steep dips, either sub-vertically or slightly dipping to the south or the north. In addition, there are some vein sets trending in northerly and northeast directions. To depth below the shallow silver-lead-zinc horizon, mineralization is dominated by gold plus minor amount of silver and copper in the lower portion of the mineralized system.
Based on data obtained from drilling, the area of West Dome and Central Valley is interpreted as a diatreme structure with a shape of inverted cone filled with breccias of phreatomagmatic origin and rhyo-dacitic intrusive dykes. On the top of West Dome, unlithified sandy sediments with horizontal beddings intercalated with phreatomagmatic breccias of altered rhyolitic and older volcanoclastic clasts are well exposed on surface, evidencing a volcanic maar environment. The intrusion of magma, once reaching the meteoric water level near surface, led to a series of intense explosive eruption and fracturing, which in turn generated abundant open spaces including cracks and pores in breccias, favorable for the circulation of hydrothermal fluids and the deposition of sulfide minerals of metals.
40
Three zones of mineralization can be recognized as zoning of different metals. The Upper Silver Zone is near surface and dominated by silver plus moderate amount of lead and zinc. Below the upper zone, the Middle Zinc Zone is dominated by zinc plus minor silver and lead. The Lower Gold Zone is dominated by gold plus a small amount of silver, copper, and zinc.
Upper Silver Zone
The Upper Silver Zone is formed in a relatively low temperature and pressure environment approximately within 150 - 200 m from surface in an area of about 1,000 m long in east-west direction by 800 m wide in north-south direction, spanning across the entire area of West Dome-Central Valley-East Dome-South Dome of Carangas Project. It is interpreted as the distal phase of hydrothermal alteration and mineralization system arising from the rhyolitic intrusions at depth of the Central Valley area.
At the top area of West Dome, there is a mineralized horizon of up to 50 m thick, composed of hydrothermal breccia of altered rhyolite clasts cemented by low temperature silica of chalcedony, heterolithic breccia comprised of clasts of various lithologies and a matrix of fine debris of similar lithology as the clasts as well as unlithified loose sandy tuff layers and lenses with sedimentary beddings. These three types of rocks are intercalated with each other. The hydrothermal breccia generally contains higher grade of silver compared to heterolithic breccia and sandy tuff. When the cementing chalcedony of hydrothermal breccia looks grey or dark in color, it may contain silver up to 1,000 ppm. Due to erosion, the current thickness of this silver-lead horizon is from a few meters up to 50 m thick.
Middle Zinc Zone
When temperature and pressure of the hydrothermal system becomes higher at depth below the Upper Silver Zone, grades of silver and lead in mineralization drop while zinc grades rise with low grades of copper and gold locally in the lower portion of the zone.
Mineralization in the Middle Zinc Zone is characterized by dissemination of marmatite and veining of honey sphalerite, galena, chalcopyrite, pyrite, siderite and small amount of silver sulfosalts. This zinc-dominated zone is generally from 150 m below surface with a thickness of tens of meters up to 150 m. The Zinc Zone is interpreted to be the peripheral zone close to the core Gold Zone formed in higher temperature/pressure environment in the vicinity of rhyolitic intrusions.
Lower Gold Zone
The Lower Gold Zone lies below the Middle Zinc Zone. Mineralization in this zone is characterized by dissemination of pyrite and sulfides veining of pyrite and chalcopyrite plus small amount of galena and sphalerite hosted in strongly argillic-sericitic altered phreatic breccia and rhyolite intrusions. This gold zone generally begins from depth from 200 m and extends to depth more than 800 m with a lateral extent up to 400 m wide, mostly confined to the diatreme pipe body and partially extending laterally into surrounding older volcanoclastic rocks. ASMIN lab studies indicate that gold occurs in form of mainly as free electrum, minor amount as native gold and very sparsely as iron (gold) sulfides, gold-silver sulfides and galena (gold). Grade of gold generally gets higher with depth, and highest around elevation of 3,500 m in the middle part of the gold zone. To further depth, gold grade declines but copper grade gets relatively higher than in the upper portion. This zoning of metals is likely induced by the higher temperature/pressure environment of hydrothermal activities at depth.
Gold mineralization is fully controlled by the diatreme pipe structure, which is associated with rhyolitic dyke intrusions, perfectly overlay with the IP chargeability anomaly in the Central Valley area. This coincidence may imply that other IP chargeability anomalies beyond the drilled area could be good targets of additional mineral potential and warrant drill test in the future.
(5) Exploration Status
The Carangas Project underwent a systematic exploration process, beginning with the Company’s reconnaissance mapping and sampling in 2019. This initial phase was followed by detailed surface-underground mapping and sampling throughout 2020-2021. Exploration activities continued intermittently in 2022 and concluded with the sampling and mapping of previously inaccessible historical underground workings.
In 2020, New Pacific collected a total of 383 rock chip samples from 55 outcrops. The samples were taken at two-meter intervals approximately perpendicular to the strike direction of mineralization, covering a total length of 769 meters. Out of these samples, 117 returned grades ranging from 30 to 2,350 g/t Ag, with an average grade of 160 g/t Ag. Additionally, a total of 268 samples were collected from the dumps of historical mining activities. Among these samples, 233 (86.94%) returned assay results within the range of 30 to 1,950 g/t Ag, with an average grade of 270 g/t Ag.
41
The Carangas Project features historical underground mining workings. The company conducted surveys of all safe and accessible tunnels, totaling 2.4 km, which are all developed within the Carangas Formation. To date, a total of 425 samples have been collected. Among these samples, 112 (26.35%) returned assay results ranging from 30 to 1,060 g/t Ag, with an average grade of 122 g/t Ag.
Furthermore, the company implemented systematic geophysical surveying programs, including a ground magnetometry survey and an Offset (3D) Bipole-Dipole Induced Polarization (IP)-Magneto-Telluric (MT) survey, from 2021 to 2023. The known mineralization system responds well to magnetic lows and IP chargeability highs and multiple additional anomalies were identified.
(6) Drilling
The Company started exploration drilling in June 2021 and completed resource definition drilling at the end of April 2023. During that period, as many as five rigs were running at the Carangas Project and a total of 81,145 meters were drilled in 189 holes. Maldonado Exploraciones, a contracted drilling company from La Paz, Bolivia, conducted all drilling which was roughly broken down to four stages.
| § | Phase I drilling: started on June 21, 2021, and concluded on September 24, 2021. Thirteen holes were completed, totalling 3,790.4 meters to verify historical drill results and to test the lateral and depth extent of the known mineralization exposed on surface at West Dome and East Dome. |
| § | Phase II: drilling commenced on October 6, 2021 and completed on December 17, 2021. In this phase, 22 holes were drilled for a total of 9,420 meters with the objective to test mineralization covered by young sediments in the Central Valley area. |
| § | The Phase III: a resource definition drill program, started on February 3, 2022, and completed on December 14, 2022. To rapidly define the mineral resource potential at the Carangas Project, five drill rigs were employed for the drill program. During this period, a total of 50,311 meters were drilled in 115 holes on a drill grid of approximately 50-meter spacing and most holes intersected broad mineralization. |
| § | Phase IV: drilling is a continuation of the 2022 resource definition drill program with the aim to infill areas drilled in 2021-2022 and step out beyond these previously drilled areas. As of the end of April 2023, a total of 39 holes were completed for a total of 17,623.5 meters in this phase of drilling. |
(7) Sample Preparation, Assay, and Data Verification
New Pacific has established a series of working procedures and protocols regarding core logging, sampling, core QA/QC and data validation, which include the regular submission of check samples to umpire Alfred H Knight laboratory in Lima, Peru.
All drill holes were geologically logged and sampled by New Pacific field personnel at the Company’s facilities in Carangas. Geological logging included detailed recording of lithology, alteration, mineralization, structure and RQD measurements. Drill cores are stored at a secure core storage at the Company’s Carangas camp for future check and audit.
The Company’s staff takes custody of drill cores and samples at each step of field exploration and drilling activities and no other people were allowed to enter the working areas and the core storage without pre-approval from the Company’s project manager. The drill cores are stored in plastic core boxes and transported to the core logging shack. After being logged and sampled, the core boxes are shipped to a secure core storage facility on a regular basis for permanent storage. This facility is surrounded by a brick wall with a locked gate. The samples generated from this process are shipped to the ALS preparation laboratory in Oruro.
New Pacific personal oversees the delivery of drill core and rock chip samples from the Carangas camp to the ALS laboratories in Oruro, Bolivia for sample preparation, and then the pulp samples were shipped to ALS in Lima, Peru for geochemical analysis. ALS Oruro and ALS Lima are part of ALS Global, a commercial laboratory specializing in analytical geochemistry services, all of which are accredited in accordance with ISO/IES 17025:2017 and are independent of New Pacific.
Core samples are collected from the drill site at least every 24 hours as part of routine drill site inspections and supervision provided by site geologists. Geological quick logs, portable XRF analyses and photographs of each core box are completed during the site inspection and before core boxes are transported to the core logging and sampling facility. Transportation of sample bags to the laboratory is carried out by New Pacific’s personnel using the company’s truck. The Sample Submission Order is reviewed and signed by ALS staff on arrival, then the lab takes custody of security.
All drill core, rock chip, and grab samples are prepared using the following procedures: (1) crush to 70% less than 2 mm; (2) riffle split of 250 g; and (3) pulverize the split to more than 85% passing a 75-micron sieve.
42
New Pacific has established comprehensive QA/QC procedures and protocols which cover the entire processes of sampling, preparation, and geochemical analysis. All drilling programs completed on the Carangas Project performed with mandatory insertions of CRMs, blanks, and duplicates into normal sample sequences on a batch-by-batch basis. New Pacific monitors Ag, Au, Pb, Zn, and Cu assay values in CRMs, blanks, and duplicates.
New Pacific provided QA/QC data for drilling completed by the company during the 2021 – 2023 exploration drilling campaigns. The QA/QC samples comprise 24% of all Carangas Project’s samples submitted to the laboratory. RPM is of the opinion that adequate QA/QC protocols were in place for entirely drilling used to compile the Mineral Resource estimate.
The QA/QC procedures utilized a variety of control samples which includes CRM, Coarse and Pulp Blanks, Coarse, Field (1/4 core) and Pulp Duplicate samples, and Umpire Pulp Duplicate samples. Detailed statistics of QA/QC control samples is presented in the following table.
QA/QC samples status
| Type | Number of Samples | % of Total Primary Samples |
| Standards (CRMs) | 3,654 | 6% |
| Blanks (Coarse & Pulp) | 3,038 | 5% |
| Duplicates (Coarse, Pulp & Field) | 4,269 | 7% |
| Umpire Pulp | 3,573 | 6% |
| Total | 14,534 | 24% |
Source: compiled by RPMGlobal, 2023
Six different CRMs were used. Standards CDN-GEO-1901 (a certified blank material), CDN-ME-1501 and CDN-ME-1603 were discontinued in 2022. All CRMs were supplied by CDN Resource Laboratories of Langley, British Columbia, Canada with certified values of Ag, Au, Pb, Cu, and Zn. CRM statistics for Ag and Au are presented in the following table.
CRMs of Carangas Project
| CRM | Ag ppm | Au ppm | CRMs inserted | ||
| Certified value | 2SD | Certified value | 2SD | 2021-2023 | |
| CDN-GEO-1901 | 1 | 0.3 | 0.036 | 0.008 | 408 |
| CDN-ME-1501 | 34.6 | 2.3 | 1.38 | 0.11 | 288 |
| CDN-ME-1603 | 86 | 3 | 0.995 | 0.066 | 985 |
| CDN-ME-1707 | 27.9 | 2.9 | 2.02 | 0.214 | 893 |
| CDN-ME-1902 | 349 | 17 | 5.38 | 0.42 | 780 |
| CDN-ME-2003 | 106 | 9 | 1.301 | 0.135 | 300 |
Source: compiled by RPMGLOBAL, 2023
Two types of blank material were inserted into the sample sequence prior to delivery to the lab. Coarse Blank is used to assess the potential contamination during sample preparation and Pulp Blank is used to assess the potential contamination during geochemical analysis.
The Coarse Blank material used at Carangas Project was taken from a quarry located near Oruro city. The rock is fresh andesite with porphyritic texture containing grains of quartz, plagioclase, biotite, and hornblende. The chemical validation of Coarse Blank was developed internally and certified that the material could be used to this purpose. The control limits were developed by the Company after review of the analytical data, removal of outliers, calculation of the analytical mean and standard deviation. The warning limit is set at two standard deviations. The failure limit is set at three standard deviations. Overall, 99.5% of the coarse blanks are within the acceptable limits. Failed results exceeding three standard deviations were documented and investigated.
The Pulp Blank is inserted every 50 samples or at a rate of 2%. A total of 1,031 pulp blank samples were inserted in the period from July 2021 to April 2023, representing an overall insertion rate of 2.3%. Certified pulp blank CRM CDN-GEO-1901 was used between July 2021 and April 2022. Unlike other CRMs, CDN-GEO-1901 didn’t demonstrate high accuracy (-13.57% difference between analytical mean and certified value) for silver analysis. However, 99% of CDN-GEO-1901 samples were within the control limits.
43
Overall, 99.5% of pulp blanks samples for silver are within two standard deviations control limit. It is concluded that there is no systematic contamination during geochemical analysis.
A total of 981 coarse blanks were inserted into the sample sequences for gold fire assays in the period from 2021 to 2023. Only eight coarse blanks returned results beyond failure the limit of Au=0.025 ppm. Every out-of-control event was documented and investigated. 97% of the coarse blank samples analyzed for gold returned with assay results equal or below 0.01 g/t Au (twice the detection limit of 0.005 ppm Au). No contamination was identified during sample preparation and analysis.
Three types of duplicates were used to monitor the quality of the processes of the drill programs from sampling, preparation, and analysis: twin samples or field duplicates, coarse reject duplicates and pulp duplicates. A total of 4,269 duplicate samples were taken during the period from July 2021 to April 2023. The following table provides a statistical summary of the Relative Percent Difference (“RPD”) for the assay pairs between the original and the duplicate of each type of duplicate samples.
Statistical summary for duplicate samples from July 2021 to April 2023
| Ag ppm | ||||
| Sample Type | Number of samples | Correlation Coefficient | < 10% RPD | < 20% RPD |
| Field Duplicate | 1,463 | 0.939 | 50% | 70% |
| Coarse Duplicate | 1,425 | 0.997 | 79% | 89% |
| Pulp Duplicate | 1,381 | 0.997 | 80% | 91% |
| Au ppm | ||||
| Field Duplicate | 683 | 0.95 | 55% | 66% |
| Coarse Duplicate | 670 | 0.982 | 62% | 72% |
| Pulp Duplicate | 671 | 0.984 | 63% | 72% |
Source: compiled by RPM GLOBAL, 2023
Field Duplicates are generated by quarter core to monitor the representativeness of the sampling process. The insertion rate is 2% according to the protocols of quality control and a total of 1,463 quarter core duplicates were taken during the 2021 to 2023 drilling campaigns.
The qualified person is of the opinion that the overall QA/QC process is well established and that the results support the MRE process.
The procedures and protocols employed by the Company regarding sampling, preparation, sample security, and analysis are in accordance with industry best practices. RPM did not identify any material concerns with the geological and analytical procedures as well as the quality of the results at Carangas Project.
The use of different control samples is robust and returns a good variety of verification through the whole process, and the umpire lab check analysis gives a good level of reproducibility of the database.
The insertion rate of control samples is 24%, which is higher than the industry benchmark (15-20%).
During the site visit, RPM identified that the sample preparation procedures and geology core logging are well established and contributed to a robust database. Good operational procedures are in place for core preservation and storage.
(8) Metallurgical Testing
A preliminary metallurgical testwork program was completed by Bureau Veritas Minerals in Richmond, British Columbia, Canada and ALS Metallurgy in Kamloops, British Columbia, Canada between June 2022 and May 2023 involving five composite samples. These five composite samples were prepared using the mineralized materials of assay sample rejects from six drill holes in the West Dome and Central Valley mineralized zones.
Among these five composite samples, two of them were gold mineralized samples (1.8 ~ 4.0 g/t Au). These two samples were subjected to bottle roll cyanide leach testing to recover gold. The results showed that these two samples were very amenable to cyanide leach and the preg-robbing issue was absent. Gold recovery was consistently above 97% under typical cyanide leach conditions. There were signs indicating that coarse gold particles might be present in these two samples.
44
The third sample was collected from the silver/lead/zinc mineralized zone near the surface of the deposit. This sample contained 167 g/t silver, 1.18% lead and 0.019% zinc. 69% of lead minerals in this sample were oxidized. The silver/lead concentrate produced by bulk flotation contained 7,788 g/t silver and 41.6% lead with corresponding 79.7% silver recovery and 60.1% lead recovery. One indicative cyanide leach test showed 96% of silver in this concentrate was leachable in cyanide solution in 24 hours.
The fourth sample was collected from the silver/lead/zinc mineralized zone close to the surface of the deposit. This sample contained 95 g/t silver, 0.85% lead and 0.48% zinc. 39% of lead minerals in this sample were oxidized. The silver/lead concentrate produced by sequential selective flotation contained 5,612 g/t silver and 35.2% lead with corresponding 91.1% silver recovery and 64.2% lead recovery. Further work is needed to produce a marketable zinc concentrate. One indicative cyanide leach test showed 94% of silver in this silver/lead concentrate was leachable in cyanide solution in 24 hours.
The fifth sample was collected at depth in the silver/lead/zinc mineralization zone. This sample contained 143 g/t silver, 0.84% lead and 1.27% zinc. Sequential selective flotation was successful in generating two marketable concentrates. The silver/lead concentrate contained 8,596 g/t silver and 52.1% lead with corresponding 90.9% silver recovery and 94.1% lead recovery, and the zinc concentrate contained 53.3% zinc with 80.4% zinc recovery. One indicative cyanide leach test showed 48% of silver in the silver/lead concentrate was leachable in cyanide solution in 24 hours. When cyanide leach retention time is extended, silver recovery is expected to increase.
(9) Mineral Resources
RPM has independently estimated the Mineral Resources of the Carangas Project, based on the data provided by New Pacific as of June 1, 2023. The Carangas MRE and underlying data comply with the guidelines of the CIM Definition Standards under NI 43-101. RPM considers it suitable for public reporting. The qualified person, Mr. Anderson Goncalves Candido, completed the Carangas MRE. The effective date of the Carangas MRE is August 25, 2023.
Mineral Resources were reported using a cut-off value of 40 g/t AgEq and a conceptual open pit mining constraint, assuming that extraction will be conducted using open pit mining method. The cut-off value was determined using consensus five-year forecast of metal prices made by industry and banks.
The Cutoff Grade calculation was based on assumptions as follows: mining operating cost, onsite milling operating cost, tailings management facility operating cost, G&A cost, royalty cost, selling cost, onsite milling metal recoveries percentages, metal payable percentages, and other variables. The cost assumptions are presented below:
| § | Mining operating cost: 2.00 US$/t |
| § | Onsite process operating cost: 10.50 US$/t |
| § | Tailings management facility operating cost: 0.65 US$/t |
| § | General and administrative cost: 1.50 US$/t |
| § | Royalty cost: 6.0 % |
| § | Selling cost: 0.5 US$/oz AgEq |
| § | Metal processing recoveries percentages: Ag 90%, Au 98%, Pb 83% and Zn 58% |
| § | Metal payable percentages: Ag 83%, Au 99.5%, Pb 83% and Zn 45% |
For resource cutoff calculation purposes, a mining recovery of 100.0% and 0.0% mining dilution were applied.
Three zones of mineralization can be recognized as zoning of different metals. The Upper Silver Zone, the Middle Zinc Zone and the Lower Gold Zone, The Mineral Resources is stated in these three zones. The results of the Mineral Resource estimate for the Carangas Project are presented in the following table.
Carangas Project - Conceptual Pit* Constrained Mineral Resource as of 25 August 2023
| Domain | Category | Tonnage | AgEq | Ag | Au | Pb | Zn | Cu | ||||||
| Mt | g/t | Mozs | g/t | Mozs | g/t | Kozs | % | Mlbs | % | Mlbs | % | Mlbs | ||
| Upper
Silver Zone |
Indicated | 119.18 | 85.3 | 326.8 | 44.7 | 171.2 | 0.1 | 216.4 | 0.3 | 916.6 | 0.7 | 1,729.6 | 0.01 | 34.5 |
| Inferred | 31.30 | 80.3 | 80.8 | 43.0 | 43.3 | 0.1 | 104.6 | 0.3 | 202.4 | 0.5 | 350.0 | 0.01 | 8.9 | |
| Middle
Zinc Zone |
Indicated | 43.42 | 56.0 | 78.1 | 10.8 | 15.0 | 0.1 | 77.4 | 0.4 | 343.6 | 0.8 | 739.4 | 0.01 | 13.7 |
| Inferred | 9.32 | 54.2 | 16.2 | 8.8 | 2.6 | 0.1 | 15.6 | 0.4 | 74.1 | 0.8 | 162.3 | 0.01 | 2.5 | |
45
| Lower Gold Zone | Indicated | 52.28 | 92.1 | 154.9 | 11.4 | 19.1 | 0.8 | 1,294.4 | 0.2 | 184.7 | 0.2 | 184.7 | 0.06 | 64.4 |
| Inferred | 4.37 | 91.1 | 12.8 | 12.6 | 1.8 | 0.7 | 97.5 | 0.2 | 21.4 | 0.2 | 21.4 | 0.06 | 5.4 |
* Notes:
| 1. | The CIM Standards were used for reporting the Mineral Resources. |
| 2. | The qualified person (as defined in NI 43-101) for the purposes of the Carangas MRE is Anderson Candido, FAusIMM, Principal Geologist with RPM. |
| 3. | Mineral Resources are constrained by an optimized pit shell at a metal price of US$23.00/oz Ag, US$1,900.00/oz Au, US$0.95/lb Pb, US$1.25/lb Zn, US$4.00/lb Cu, recovery of 90% Ag, 98% Au, 83% Pb, 58% Zn and Cut-off grade of 40 g/t AgEq and reported as per Section 14. |
| 4. | Mineral Resources are reported inside the claim boundary. |
| 5. | Drilling results up to June 1, 2023. |
| 6. | The numbers may not compute exactly due to rounding. |
| 7. | Mineral Resources are reported on a dry in-situ basis. |
| 8. | Mineral resources are not Mineral Reserves and have not demonstrated economic viability |
Below the conceptual pit constraint, there exists gold-dominated mineralized material of similar size and grade to the reported Mineral Resources of the Gold Domain within the conceptual pit. This mineralized material has the potential to be converted to Mineral Resource for underground mining after further studies in future Preliminary Economic Study stage. Gold mineralization remains open to the north and northeast at depth.
RPM considers that the reported Mineral Resources have reasonable prospects for eventual economic extraction using open pit mining methods.
RPM is not aware of any other factors, including environmental, permitting, legal, title, taxation, socio-economic, marketing and political or other relevant factors, which could materially affect the Mineral Resource.
There are no mineral reserves on the Carangas Project.
(10) Mining Operations
This section is not applicable.
(11) Processing and Recovery Operations
This section is not applicable.
(12) Infrastructure, Permitting and Compliance Operations
This section is not applicable.
(13) Capital and Operation Costs
This section is not applicable.
(14) Exploration, Development and Production
The Company is advancing the Carangas Project with additional exploration drill program to expand its mineral resource and a PEA study to understand the potential economics of the project. Relevant planned works including, but not limited to:
| § | Additional 10,000 m resource infill drilling and step-out drilling as well as regional exploration drilling on the IP chargeability anomalies. |
| § | A 5,000 m geotechnical drilling program. |
| § | Initiate exploration programs of geological mapping and prospecting over the IP chargeability anomalies for refining targets of drilling test. |
| § | Further processing and metallurgy tests to guide the PEA study. |
| § | Conduct underground mining study to investigate the potential of conversion of the mineralized material below the conceptual open pit constraint to Mineral Resources for underground mining. |
46
For additional information on the Carangas Project, refer to the Carangas Technical Report available under the Company’s profile at www.sedarplus.ca.
Additional Information - Carangas Project Title
New Pacific does not have direct title in the Carangas Project, as the Carangas Project is located within 50 kilometers from international border where foreign companies or foreigners are not permitted to have ownership of land and right of mineral. Rather, Granville remains the holder of all licenses, permits and rights granted to it by Bolivian authorities and all operations on the Carangas Project are undertaken by Granville. New Pacific’s interest in the Carangas Project is as a result of the MAC entered into by wholly-owned subsidiaries of the Company and Granville. New Pacific is permitted to enter into the MAC with Granville under Bolivian Law No. 535 on Mining and Metallurgy. In April 2023, Granville initiated the corresponding process to request the authorization and registration of the MAC before AJAM. The Company’s indirect ownership in the Carangas Project will be certified as legally complaint with Bolivian laws related to the Frontier Area once the MAC is approved by the AJAM, registered in the Mining Registry, and published in the Mining Gazette (Bolivia). See also “Risk Factors - Frontier Areas”.
| Item 6: | DIVIDENDS AND DISTRIBUTIONS |
The Company has not paid dividends on its Shares since incorporation. The Company has no present intention of paying dividends on its Shares. Payment of dividends of distributions in the future will be dependent on the earnings and financial condition of the Company and other factors which the directors may deem appropriate at that time.
| Item 7: | DESCRIPTION OF CAPITAL STRUCTURE |
The Company has an authorized capital of an unlimited number of Shares without par value, of which 157,491,172 Shares were issued and outstanding as fully paid and non-assessable as of June 30, 2023. A further 5,854,327 Shares have been reserved and allotted for issuance upon the due and proper exercise of certain incentive options and restricted share units (“RSU”) outstanding as of June 30, 2023. All of Shares rank equally as to dividends, voting powers and participation in assets and in all other respects. Each Share carries one vote per share at meetings of the shareholders of the Company. There are no indentures or agreements limiting the payment of dividends and there are no conversion rights, special liquidation rights, pre-emptive rights or subscription rights attached to the Shares. The Shares presently issued are not subject to any calls or assessments.
The Company’s amended and restated share-based compensation plan (the “Omnibus Plan”) was prepared by the Company in accordance with the applicable stock exchange rules and is in the form of a “rolling 10% plan” reserving for issuance upon the exercise of options granted pursuant to the Omnibus Plan a maximum of 10% of the issued and outstanding Shares. Furthermore, no more than 3,500,000 Shares may be granted in the form of RSUs and no more than 780,000 Shares may be granted in the form of performance share units of the Company (each, a “PSU”). As of June 30, 2023, the Company has (a) stock options outstanding to purchase 3,957,167 Shares at exercise prices ranging from CAD$2.15 to CAD$4.00 per share with original terms of 5 years, with the last options expiring on April 14, 2028; (b) 1,897,160 RSUs issued outstanding; and (c) nil PSUs issued and outstanding.
As at June 30, 2023, the Company had no outstanding warrants.
| Item 8: | MARKET FOR SECURITIES |
| 8.1 | Trading Price and Volume |
The following table provides the high and low prices, and monthly volume for the Shares traded on the TSX for the period indicated (stated in Canadian dollars):
| Period | High | Low | Volume | |||
| Jul 2022 | 4.07 | 3.07 | 887,200 | |||
| Aug 2022 | 4.27 | 3.34 | 706,800 | |||
| Sep 2022 | 3.74 | 2.67 | 1,661,000 | |||
| Oct 2022 | 3.30 | 2.74 | 720,300 | |||
| Nov 2022 | 3.34 | 2.55 | 1,035,200 | |||
| Dec 2022 | 4.14 | 2.86 | 2,121,200 | |||
| Jan 2023 | 3.92 | 3.00 | 952,900 | |||
| Feb 2023 | 3.99 | 3.24 | 1,030,800 | |||
| Mar 2023 | 3.85 | 2.94 | 1,450,800 | |||
| Apr 2023 | 4.02 | 3.25 | 1,935,500 | |||
| May 2023 | 3.59 | 3.06 | 1,279,300 | |||
| Jun 2023 | 3.41 | 2.48 | 1,892,500 |
The following table provides the high and low prices, and average daily volume for the Shares traded on the NYSE American for the period indicated (stated in U.S. dollars):
| Period | High | Low | Volume | |||
| Jul 2022 | 3.16 | 2.36 | 3,169,000 | |||
| Aug 2022 | 3.32 | 2.55 | 1,517,400 |
47
| Sep 2022 | 2.85 | 1.95 | 2,601,700 | |||
| Oct 2022 | 2.42 | 2.02 | 1,839,600 | |||
| Nov 2022 | 2.49 | 1.89 | 2,274,600 | |||
| Dec 2022 | 2.93 | 2.08 | 3,482,500 | |||
| Jan 2023 | 2.93 | 2.20 | 2,634,000 | |||
| Feb 2023 | 2.96 | 2.37 | 1,915,100 | |||
| Mar 2023 | 2.85 | 2.13 | 2,452,100 | |||
| Apr 2023 | 3.04 | 2.40 | 2,053,900 | |||
| May 2023 | 2.69 | 2.23 | 1,986,300 | |||
| Jun 2023 | 2.57 | 1.86 | 3,644,500 | |||
| 8.2 | Prior Sales |
Common Shares
The following table sets forth the date and number of Shares that were issued by the Company during Fiscal 2023:
| Date of Issuance | Number of Shares | Price Per Share | ||
| Feb 28, 2023(1) | 90,090 | CAD$3.33 ($2.45) | ||
| Jul 29, 2022 to Jun 7, 2023(2) | 445,000 | CAD$1.15 ($0.85) to CAD$2.15 ($1.58) |
Notes:
(1) Issued in connection with a private placement.
(2) Issued in connection with the exercise of outstanding Options.
Options
The following table sets forth the date and number of options that were granted by the Company during Fiscal 2023:
| Date of Grant | Number | |
| Jan 19, 2023 | 1,016,000 | |
| Jan 24, 2023 | 120,000 | |
| Apr 14, 2023 | 50,000 |
RSUs
The following table sets forth the date and number of RSUs that were granted by the Company during Fiscal 2023:
| Date of Grant | Number | |
| Jan 19, 2023 | 802,000 | |
| Jan 24, 2023 | 85,000 | |
| Apr 14, 2023 | 80,000 |
PSUs
The Company did not grant any PSUs during Fiscal 2023.
| Item 9: | ESCROWED SECURITIES |
The Company has no securities currently held in escrow.
| Item 10: | DIRECTORS AND OFFICERS |
| 10.1 | Name, Occupation and Security Holding |
The Company’s directors are elected by shareholders at each annual general meeting and typically hold office until the end of the next annual meeting at which time they will be re-elected or replaced. The following table sets out the names of the directors and officers, all offices in the Company each now holds, each person’s principal occupation, business or employment, the period of time
48
during which each has been a director of the Company and the number of Shares beneficially owned by each, directly and indirectly, or over which each exercised control or direction as at the date of this AIF.
| Name,
Position, Province & Country of Residence(1) |
Principal Occupations During Last Five Years(1) | Date
of Appointment as a Director and/or Officer |
Shares Beneficially Owned or Controlled(1) |
| Dr.
Rui Feng Director Beijing, China |
Director of the Company; Chairman, CEO, and Director of Silvercorp Metals Inc. since September 2003; CEO of New Pacific from May 2010 to April 2020 and from January 2022 to September 2023. |
May 12, 2004 | 10,527,400 |
| Terry
Salman Chairman and Director(2)(3)(4) British Columbia, Canada |
Chairman and Director of the Company; President and Chief Executive Officer at Salman Capital Inc. and Salman Partners Inc. the Chairman Emeritus of the Vancouver Public Library Foundation. | December 3, 2021 | 53,400 |
| Dr.
Peter Megaw Director(4) Arizona, United States |
Director of the Company. | December 2, 2022 | - |
| Dickson
Hall Director(2)(3) British Columbia, Canada |
Director of the Company; Partner at Valuestone Advisors Limited; Advisor of Valuestone Global Resource Fund 1; Director of Bunker Hill Mining Corp.; Director of MEC Advisor Limited; Sole manager of Can-China Global Resources Fund. | December 2, 2022 | 19,015 |
| Maria
Tang Director(2)(3) British Columbia, Canada |
President, Chief Financial Officer and Director of HempNova LifeTech Corp.; Directors of Minco Silver Corporation.; Director of Finance at Revery Architect until 2019. |
December 3, 2021 | 19,167 |
| Martin
G. Wafforn Director(4) British Columbia, Canada |
Senior Vice President of Pan American Silver Corp. | November 27, 2017 | 139,733 |
Paul Simpson Director |
Director of the Company; Corporate security and mining lawyer at Armstrong Simpson; Director of Silvercorp Metals Inc. | September 11, 2023 | 391,985(5) |
Andrew Williams Chief
Executive Officer |
Chief Executive Officer of the Company; Portfolio manager at Sun Valley Gold LLC. | September 11, 2023 | 75,075 |
| Jalen
Yuan Chief Financial Officer British Columbia, Canada |
Chief Financial Officer of the Company. | February 7, 2015 | 330,167 |
| Alex
Zhang Vice President, Exploration British Columbia, Canada |
Vice President, Exploration of the Company | June 16, 2016 | 491,200 |
Notes:
| (1) | The information as to residence, principal occupation or employment and Shares beneficially owned, directly or indirectly, or controlled is not within the knowledge of the management of the Company and has been furnished by the respective director or officer. |
| (2) | Denotes member of the audit committee of the Company (the “Audit Committee”). |
| (3) | Denotes member of the compensation committee of the Company. |
49
| (4) | Denotes member of the corporate governance committee of the Company. |
| (5) | Of these Shares, 6,000 are held by 1097550 B.C. Ltd. |
As of the date of this AIF, all of the directors, officers and control persons of the Company, as a group, beneficially own, directly or indirectly, or exercise control or direction over 12,047,142 Shares representing 7.64% of the 157,648,049 Shares issued and outstanding.
| 10.2 | Cease Trade Orders, Bankruptcies, Penalties or Sanctions |
No director or executive officer of the Company, within the 10 years prior to the date of this AIF, is or has been, a director, chief executive officer or chief financial officer of any company (including the Company) that: (a) while that person was acting in that capacity was subject to a cease trade or similar order or an order that denied the relevant company access to any exemption under securities legislation, for a period of more than 30 consecutive days; or (b) was subject to a cease trade or similar order or an order that denied the relevant company access to any exemption under securities legislation, for a period of more than 30 consecutive days that was issued after that person ceased to be a director, chief executive officer or chief financial officer, and which resulted from an event that occurred while that person was acting in that capacity.
No director or executive officer of the Company or a shareholder holding a sufficient number of securities to affect materially the control of the Company, within the 10 years prior to the date of this AIF, is or has been, a director or executive officer of any company (including the Company) that while that person was acting in that capacity or within a year of that person ceasing to act in that capacity, became bankrupt, made a proposal under any legislation relating to bankruptcy or insolvency or was subject to or instituted any proceedings, arrangement or compromise with creditors or had a receiver, receiver manager or trustee appointed to hold its assets.
No director or executive officer of the Company or a shareholder holding a sufficient number of securities to affect materially the control of the Company has, within the 10 years prior to this AIF, become bankrupt, made a proposal under any legislation relating to bankruptcy or insolvency, or become subject to or instituted any proceedings, arrangement or compromise with creditors, or had a receiver, receiver manager or trustee appointed to hold the assets of the director, executive officer or shareholder.
No director or executive officer of the Company or a shareholder holding a sufficient number of securities to affect materially the control of the Company has been subject to: (a) any penalties or sanctions imposed by a court relating to securities legislation or by a securities regulatory authority or has entered into a settlement agreement with a securities regulatory authority; or (b) any other penalties or sanctions imposed by a court or regulatory body that would likely be considered important to a reasonable making an investment decision.
| 10.3 | Conflicts of Interest |
Certain directors and officers of the Company are also directors, officers or shareholders of other companies that are similarly engaged in the business of acquiring and exploiting natural resource properties. These associations to other public companies in the resource sector may give rise to conflicts of interest from time to time. Under the laws of the Province of British Columbia, the directors and senior officers of the Company are required by law to act honestly and in good faith with a view to the best interests of the Company. In the event that such a conflict of interest arises at a meeting of the Company’s directors, a director who has such a conflict will disclose such interest in a contract or transaction and will abstain from voting on any resolution in respect of such contract or transaction. See also “Item 4.2: Risk Factors”.
| Item 11: | AUDIT COMMITTEE |
| 11.1 | Audit Committee Charter |
A copy of the Audit Committee Charter (as defined below) is attached hereto as Schedule “A”. A description of the responsibilities, powers and operation of the Audit Committee can be found therein.
| 11.2 | Composition of the Audit Committee |
The Audit Committee consists of Maria Tang (Chair), Terry Salman, and Dickson Hall. All of the members are considered independent and financially literate pursuant to National Instrument 52-110 Audit Committees. The Audit Committee will be re-constituted after the 2023 annual general meeting.
50
| 11.3 | Relevant Education and Experience |
The Audit Committee currently consists of Maria Tang, (Chair), Terry Salman, and Dickson Hall. The directors of the Company have determined that all members of the Audit Committee are “independent” and “financially literate” for the purposes of applicable laws and the rules of the TSX and NYSE American. The directors of the Company have also determined that Maria Tang, Terry Salman, and Dickson Hall is each an “Audit Committee Financial Expert” for the purposes of applicable laws and the rules of the TSX and NYSE American. The designation of a member of the Audit Committee as an “Audit Committee Financial Expert” does not make the member an “expert” for any purpose, impose any duties, obligations or liability on the member that are greater than those imposed on members of the Board who do not carry this designation or affect the duties, obligations or liability of any other member of the Audit Committee.
The Audit Committee operates under the guidelines of the charter of the Audit Committee (the “Audit Committee Charter”) which is reproduced later in this AIF. The Audit Committee, among other things, reviews the annual financial statements of the Company for recommendation to the Board, reviews and approves the quarterly financial statements, oversees the annual audit process, the Company’s internal accounting controls and the resolution of issues identified by the Company’s auditors, and recommends to the Board the firm of independent auditors to be nominated for appointment by the shareholders at the next annual general meeting. In addition, the Audit Committee meets annually with the Company’s auditors both with and without the presence of any members of the Company’s management.
Maria Tang, Director
Ms. Tang has over 20 years of experience in accounting with focus on the mining industry. She has held a number of executive and board leadership positions within this period. Ms. Tang is the President, Chief Financial Officer and Director of HempNova LifeTech Corp. She sits on the Board of Directors of Minco Silver Corporation. Previously, Ms. Tang served as the Director of Finance at Revery Architect until 2019 as well as the Chief Financial Officer at Silvercorp Metals Inc. and the Chief Financial Officer at New Pacific until 2015. Prior to that, Ms. Tang held positions with Ernst & Young LLP, where she focused on public company audits of mining, pharmaceutical and manufacturing companies.
Ms. Tang holds a Bachelor of Science degree from the Nankai University and the Chartered Accountancy and the American Institute of Certified Public Accountant designations.
Terry Salman, Director
Mr. Salman has over 35 years of experience in exploration and mining finance. He is the President and Chief Executive Officer at Salman Capital Inc. and Salman Partners Inc. At Salman Partners Inc., he raised over $20 billion for over 400 exploration and mining companies. Previously, Mr. Salman held positions with Nesbitt Thomson, subsequently acquired by the Bank of Montreal, where he was an Executive Vice-President and a Director. Mr. Salman was instrumental in forming the mining team at Nesbitt Thomson and its mining conference in the early 1990’s, which subsequently became the BMO Mining and Metals Conference.
He is the Chairman Emeritus of the Vancouver Public Library Foundation. Formerly, he acted as the Chairman of the Investment Dealers Association of Canada and a director or chairman of numerous charities. Mr. Salman was the recipient of the 2016 Murray Pezim Award in recognition of his career in Canadian mining finance and was inducted to the Cambridge House Resource Hall of Fame in 2018. He was appointed to the Order of Canada for his contributions to mining exploration and for his generous philanthropy and community activism.
Mr. Salman is an Honorary Consul-General of the Republic of Singapore and received the Public Service Star from the Office of the President of Singapore in 2021. He served with the United States Marine Corps and is a Vietnam veteran. Mr. Salman received an MBA from the University of Hartford.
Dickson Hall, Director
Mr. Hall has over 40 years of experience in finance and corporate development, with a strong emphasis on the mining sector. He is a Partner at Valuestone Advisors Limited, sole advisor of Valuestone Global Resource Fund 1, a director of Bunker Hill Mining Corp. and MEC Advisors Limited.
He is also the sole manager of Can-China Global Resources Fund and a former consultant for Hunter Dickson Inc. Fluent in Mandarin and well-experienced in Chinese business culture, Mr. Hall has worked with an extensive group of multinationals, trade associations and government organizations with China operations, including British Petroleum, Ranger Petroleum, BC Council of Forest Industries,
51
Government of Canada, Government of British Columbia.
Mr. Hall is a graduate of the University of British Columbia.
| 11.4 | Audit Committee Oversight |
During the last year, recommendations of the Audit Committee to nominate or compensate an external auditor were adopted by the Board.
| 11.5 | Pre-Approval Policies and Procedures |
The Audit Committee has adopted a specific policy and procedure for the engagement of non-audit services as described in Section 4 of the Audit Committee Charter. The Audit Committee must pre-approve all non-audit services to be provided to the Company or its subsidiary entities by the Company’s external auditor.
| 11.6 | External Auditor Service Fees |
The Audit Committee has reviewed the nature and amount of the services provided by Deloitte LLP, auditors to the Company, to ensure independence. Fees billed by external auditors for audit services in the last two fiscal years are outlined below:
| Nature of Services | Year
Ended June 30, 2023 (CAD) |
Year
Ended June 30, 2022 (CAD) | ||
| Audit Fees(1) | $234,000 | $247,000 | ||
| Audit-Related Fees(2) | - | - | ||
| Tax- Fees(3) | - | - | ||
| All Other Fees(4) | - | - | ||
| Total | $234,000 | $247,000 |
Notes:
| (1) | “Audit Fees” include fees necessary to perform the annual audit and quarterly reviews of the Company’s consolidated financial statements. Audit Fees also include audit or other attest services required by legislation or regulation, such as comfort letters, consents, reviews of securities filings and statutory audits. |
| (2) | “Audit-Related Fees” include services that are traditionally performed by the auditor. These audit-related services include employee benefit audits, due diligence assistance, accounting consultations on proposed transactions, internal control reviews and audit or attest services not required by legislation or regulation. |
| (3) | “Tax Fees” include fees for all tax services other than those included in “Audit Fees” and “Audit-Related Fees”. This category includes fees for tax compliance, tax planning and tax advice. Tax planning and tax advice includes assistance with tax audits and appeals, tax advice related to mergers and acquisitions, and requests for rulings or technical advice from tax authorities. |
| (4) | “All Other Fees” include the aggregate fees billed for services provided by the principal accountant, other than the services reported in the above items. |
| Item 12: | PROMOTERS |
The Company did not retain the services of any promoters within the two most recently completed financial years.
| Item 13: | LEGAL PROCEEDINGS AND REGULATORY ACTIONS |
| 13.1 | Legal Proceedings |
The Company is not aware of any actual or pending material legal proceedings to which the Company is or is likely to be party or of which any of its business or property is or is likely to be subject.
| 13.2 | Regulatory Actions |
There are no (a) penalties or sanctions imposed against the Company by a court relating to securities legislation or by a securities regulatory authority during its most recently completed financial year; (b) other penalties or sanctions imposed by a court or regulatory body against the Company that would likely be considered important to a reasonable investor in making an investment decision in the Company; or (c) settlement agreements the Company entered into before a court relating to securities legislation or with a securities regulatory authority during its most recently completed financial year.
52
| Item 14: | INTEREST OF MANAGEMENT AND OTHERS IN MATERIAL TRANSACTIONS |
Except as disclosed in this AIF, during the three most recently completed financial years, no director or executive officer, insider, or any associate or affiliate of such insider, or director, or executive officer has had any material interest, direct or indirect, in any transaction or any proposed transaction which has materially affected or would materially affect the Company or any of its subsidiaries.
The following summarizes the Company’s relationship with related parties since July 1, 2022:
| Transactions with related parties | Year ended June 30, 2023 | |
| Silvercorp Metals Inc. (“Silvercorp”)(1) | $844,949 |
Related Party Transactions are entered into based on normal market conditions at the amounts agreed on by the parties. As at June 30, 2023, the balances with related parties, which are unsecured, non-interest bearing, and due on demand, are as follows:
| Due to related parties | Year ended June 30, 2023 | |
| Silvercorp Metals Inc.(1) | $56,102 |
Note:
| (1) | Silvercorp has one director (Dr. Rui Feng) and one officer (Dr. Rui Feng as Chief Executive Officer) in common with the Company and shares office space with and provides various general and administrative services to the Company. During the year ended June 30, 2023, the Company recorded total expenses of $844,949 (year ended June 30, 2022 - $726,387) for services rendered and expenses incurred by Silvercorp on behalf of the Company. During the year ended June 30, 2022, the Company’s subsidiary Qinghai Found borrowed a loan of $283,688 (RMB ¥1.9 million) from one of Silvercorp’s subsidiaries in China to facilitate the closure of the RZY Compensation Transaction. During the year ended June 30, 2023, the loan plus interest of $23,422 were repaid in full. |
On September 11, 2023, Dr. Rui Feng’s resignation as Chief Executive Officer and Mr. Paul Simpson’s appointment as a director resulted in Silvercorp having two directors in common with the Company and no common officers.
| Item 15: | TRANSFER AGENTS AND REGISTRARS |
The Company’s transfer agent and registrar for the Shares is Computershare Investor Services Inc. of 510 Burrard Street, 3rd Floor, Vancouver, British Columbia V6C 3B9.
| Item 16: | MATERIAL CONTRACTS |
There are no other contracts, other than those herein disclosed in this AIF and other than those entered into in the ordinary course of the Company’s business, that are material to the Company and which were entered into in the most recently completed financial year ended June 30, 2023, or before the most recently completed financial year but are still in effect as of the date of this AIF.
| Item 17: | INTERESTS OF EXPERTS |
Names of Experts
Silver Sand Technical Report
The Silver Sand Technical Report was prepared by Mr. John Morton Shannon, P.Geo, General Manager and Principal Geologist at AMC Consultants, Mr. Wayne Rogers, P.Eng, and Mr. Mo Molavi, P.Eng, both Principal Mining Engineers with AMC Consultants, Mr. Andrew Holloway P.Eng, Process Director with Halyard Inc., and Mr. Leon Botham P.Eng., Principal Engineer with NewFields Canada Mining & Environment ULC, in addition to Ms. Dinara Nussipakynova, P.Geo., Principal Geologist with AMC Consultants, who estimated the mineral resources.
Carangas Technical Report
The Carangas Technical Report was prepared by Mr. Anderson Goncalves Candido, FAusIMM. The qualified person for section 13 of the Carangas Technical Report is Marcelo del Giudice, FAusIMM, Principal Metallurgist with RPM.
53
Interests of Experts
None of the independent consulting geologists and independent “Qualified Persons” named in “Item 17 Names of Experts”, when or after they prepared the statement, report or valuation, has received any registered or beneficial interests, direct or indirect, in any securities or other property of the Company or of one of the Company’s associates or affiliates or is or is expected to be elected, appointed or employed as a director, officer or employee of the Company or of any associate or affiliate of the Company except as disclosed below. This information has been provided to the Company by the individual experts.
The Qualified Persons who were responsible for the preparation of the Silver Sand Technical Report and Carangas Technical Report beneficially own, directly or indirectly, less than 1% of the Shares.
Auditor
Deloitte LLP is the independent registered public accounting firm of the Company and is independent with respect to the Company within the meaning of the Rules of Professional Conduct of the Chartered Professional Accountants of British Columbia and within the meaning of the United States Securities Act of 1933, as amended and the applicable rules and regulations adopted by the SEC and the Public Company Accounting Oversight Board (United States).
| Item 18: | ADDITIONAL INFORMATION |
Additional information on the Company may be found on the Company’s website at www.newpacificmetals.com or under the Company’s profile on SEDAR+ at www.sedarplus.ca. Additional financial information, including directors’ and officers’ remuneration and indebtedness, principal holders of the Company’s securities and securities authorized for issuance under equity compensation plans, if applicable, is contained in the Company’s information circular for its most recent annual meeting of security holders that involved the election of directors.
Additional financial information is provided in the Company’s most recent financial statements and the management discussion and analysis for its most recently completed financial year.
54
CHARTER
FOR THE AUDIT COMMITTEE OF THE BOARD OF DIRECTORS OF
NEW PACIFIC METALS CORP.
| 1.0 | Purpose of the Committee |
| 1.1 | The Audit Committee represents the Board in discharging its responsibility relating to the accounting, reporting and financial practices of the Company and its subsidiaries, and has general responsibility for oversight of internal controls, accounting and auditing activities and legal compliance of the Company and its subsidiaries. |
| 2.0 | Members of the Committee |
| 2.1 | The Audit Committee shall consist of no less than three Directors, each of whom shall be “independent” as defined in accordance with Canadian National Instrument 52-110 and all applicable securities laws and regulations and all applicable stock exchange rules; provided, however, that one or more members of the Committee may be non-independent if permitted by all applicable regulations and stock exchange rules. |
| 2.2 | The members of the Committee shall be selected annually by the Board and serve at the pleasure of the Board. Each member of the Audit Committee shall be “financially literate” as defined under Canadian National Instrument 52-110, be able to read and understand fundamental financial statements and satisfy all applicable financial literacy requirements of all applicable regulations. Additionally, if the Company is subject to applicable requirements, at least one member of the Committee shall: be financially sophisticated, in that he or she shall have past employment experience in finance or accounting, requisite professional certification in accounting, or any other comparable experience or background which results in the individual’s financial sophistication, which may include being or having been a chief executive officer, chief financial officer, or other senior officer with financial oversight responsibilities; and be an “audit committee financial expert” within the meaning of U.S. federal securities laws. |
| 2.3 | None of the members of the Committee may have participated in the preparation of the financial statements of the Company or any current subsidiary of the Company at any time during the past three years. |
| 3.0 | Meeting Requirements |
| 3.1 | The Committee will meet on a regular basis at least once every quarter, and will hold special meetings as it deems necessary or appropriate in its judgment. Meetings may be held in person or telephonically, and shall be at such times and places as the Committee determines. The Committee may also act by unanimous written consent of all members of the Committee. |
| 3.2 | A majority of the members of the Committee shall constitute a quorum. |
| 4.0 | Duties and Responsibilities |
The Audit Committee’s function is one of oversight and shall not relieve the Company’s management of its responsibilities for preparing financial statements which accurately and fairly present the Company’s financial results and conditions or the responsibilities of the external auditors relating to the audit or review of financial statements. Specifically, the Audit Committee will:
| (a) | be directly responsible, subject to any authority reserved by law to the Company’s shareholders, for the appointment, compensation, retention, oversight (including resolution of any disagreements between management and the auditors regarding financial reporting) and discharge of the independent public accountants as auditors of the Company (the “auditors”) who perform the annual audit and any other audit, review or other services for the Company in accordance with applicable securities laws; |
| (b) | review with the auditors the scope of the audit and the results of the annual audit examination by the auditors, including any reports of the auditors prepared in connection with the annual audit; |
| (c) | review information, including written statements from the auditors, concerning any relationships between the auditors and the Company or any other relationships that may adversely affect the independence of the auditors and assess the independence of the auditors; |
| (d) | obtain from the external auditors a formal written statement delineating all relationships between the external auditors and the Company in a manner consistent with the requirements of applicable securities laws and regulations and applicable stock exchange rules; actively engage in a dialogue with the external auditors with respect to any disclosed relationships or services that impact the objectivity and independence of the external auditor; |
| (e) | review and discuss with management and the auditors the Company’s audited financial statements and accompanying Management’s Discussion and Analysis of Financial Conditions (“MD&A”), including a discussion with the auditors of their judgments as to the quality of the Company’s accounting principles and report on them to the Board; |
| (f) | review and discuss with management the Company’s interim financial statements and interim MD&A and report on them to the Board; |
55
| (g) | pre-approve all auditing services and non-audit services provided to the Company by the auditors to the extent and in the manner required by applicable law or regulation. In no circumstances shall the auditors provide any non-audit services to the Company that are prohibited by applicable law or regulation; |
| (h) | evaluate the external auditor’s performance for the preceding fiscal year, reviewing their fees and making recommendations to the Board; |
| (i) | periodically review the adequacy of the Company’s internal controls and ensure that such internal controls are effective; |
| (j) | review changes in the accounting policies of the Company and accounting and financial reporting proposals that are provided by the auditors that may have a significant impact on the Company’s financial reports, and report on them to the Board; |
| (k) | oversee and annually review the Company’s Code of Business Conduct and Ethics; |
| (l) | approve material contracts where the Board of Directors determines that it has a conflict; |
| (m) | establish procedures for the receipt, retention and treatment of complaints received by the Company regarding the auditing matters, internal accounting controls or other accounting matters, and the confidential, anonymous submission by employees of concerns regarding questionable accounting or auditing matters; |
| (n) | engage independent counsel and/or other advisors as it determines necessary to carry out its duties; |
| (o) | satisfy itself that management has put into place procedures that facilitate compliance with the provisions of applicable securities laws and regulation relating to insider trading, continuous disclosure and financial reporting; |
| (p) | review and monitor all related party transactions which may be entered into by the Company; and |
| (q) | annually review the adequacy of its charter and recommending any changes thereto to the Board. |
| 5.0 | Miscellaneous |
| 5.1 | Nothing contained in this Charter is intended to extend applicable standards of liability under statutory or regulatory requirements for the directors of the Company or members of the Committee. The purposes and responsibilities outlined in this Charter are meant to serve as guidelines rather than as inflexible rules and the Committee is encouraged to adopt such additional procedures and standards as it deems necessary from time to time to fulfill its responsibilities. |
| 5.2 | The Company shall provide for appropriate funding, as determined by the Committee, for payment of (a) compensation to any registered public accounting firm engaged for the purposes of preparing or issuing an audit report or performing other audit, review or attest services for the Company; (b) compensation to any advisers employed by the Committee; and (c) ordinary administrative expenses of the Committee that are necessary or appropriate in carrying out its duties. |
56
Exhibit 99.2
![]()
MANAGEMENT’S DISCUSSION AND ANALYSIS
For the year ended June 30, 2023
(Expressed in US Dollars)
NEW PACIFIC METALS CORP.
Management’s Discussion and Analysis
For the year ended June 30, 2023
(Expressed in US dollars, unless otherwise stated)
DATE OF REPORT: August 23, 2023
This management’s discussion and analysis (“MD&A”) for New Pacific Metals Corp. and its subsidiaries (collectively, “New Pacific” or the “Company”) should be read in conjunction with the Company’s audited consolidated financial statements for year ended June 30, 2023 and the related notes contained therein. The Company prepares its financial statements in accordance with International Financial Reporting Standards (“IFRS”) as issued by the International Accounting Standards Board (“IASB”). The Company’s significant accounting policies are set out in Note 2 of the audited consolidated financial statements for the year ended June 30, 2023. All dollar amounts are expressed in United States dollars (“USD”) unless otherwise stated. Certain amounts shown in this MD&A may not add exactly to total amounts due to rounding differences. This MD&A contains “forward-looking statements” that are subject to risk factors set out in a cautionary note contained at the end of this MD&A. All information contained in this MD&A is current and has been approved by the Board of Directors of the Company (the “Board”) as of August 23, 2023.
BUSINESS OVERVIEW AND STRATEGY
The Company is a Canadian mining issuer engaged in exploring and developing mineral properties in Bolivia. The Company’s precious metal projects include the flagship Silver Sand project (the “Silver Sand Project”), the Carangas project (the “Carangas Project”) and the Silverstrike project (the “Silverstrike Project”). With experienced management and sufficient technical and financial resources, management believes the Company is well positioned to create shareholder value through exploration and resource development.
The Company is publicly listed on the Toronto Stock Exchange under the symbol “NUAG” and on the NYSE American stock exchange under the symbol “NEWP”. The head office, registered address and records office of the Company are located at 1066 West Hastings Street, Suite 1750, Vancouver, British Columbia, Canada, V6E 3X1.
FISCAL 2023 HIGHLIGHTS
| § | The Company filed its independent preliminary economic assessment technical report (the “PEA Technical Report”) in respect of the Silver Sand Project on February 16, 2023. The PEA Technical Report shows a post-tax net present value (“NPV”) (at a 5% discount rate) of $726 million with an internal return rate (“IRR”) of 39%, underpinned by a total silver production of 171 million ounces over 14 years of mine life. The PEA Technical Report also includes an updated mineral resource estimate (the “MRE”) with total measured and indicated mineral resource of 201.77 million ounces of silver at a head grade of 116 grams per tonne (“g/t”). Please see “Cautionary Note Regarding Results of Preliminary Economic Assessment”. |
| § | The Company completed the 2023 drill program at the Carangas Project for a total of 17,623 m in 39 drill holes. Assay results of all drill holes have been received and released through two news releases on July 6, 2023 and May 30, 2023, respectively. The Company also completed the 2022 drill program at the Carangas Project for a total of 50,368 m in 115 drill holes. Assay results of all drill holes have been received and released through eight news releases between July 13, 2022 and April 6, 2023. The assay results continue to indicate that a thick zone of gold mineralization occurs beneath a shallow silver horizon measuring approximately 1,000 m long, 800 m wide, and up to 200 m thick. The Company has completed more than 80,000 m in 189 drill holes since 2021. Assay results from these drill holes will be used for an inaugural MRE to be completed later in 2023. |
| Management’s Discussion and Analysis | Page 2 |
NEW PACIFIC METALS CORP.
Management’s Discussion and Analysis
For the year ended June 30, 2023
(Expressed in US dollars, unless otherwise stated)
| § | The Company strengthened the Board and management team by appointing Dr. Peter Megaw and Mr. Dickson Hall as directors and Mr. Andrew Williams as President of the Company. |
PROJECTS OVERVIEW
Bolivian Licence Tenure
A summary of Bolivian mining laws with respect to the Administrative Mining Contract (“AMC”) and exploration license is presented below.
Exploration and mining rights in Bolivia are granted by the Ministry of Mines and Metallurgy through the Autoridad Jurisdictional Administrativa Minera (“AJAM”). Under Bolivian mining laws, tenure is granted as either an AMC or an exploration license. Tenure held under the previous legislation was converted to Autorización Transitoria Especiales (each, and “ATE”) which are required to be consolidated into new 25-hectare sized cuadriculas (concessions) and converted to AMCs. AMCs created by conversion recognize existing rights of exploration and/or exploitation and development, including treatment, metal refining, and/or trading. AMCs have a fixed term of 30 years and can be extended for an additional 30 years if certain conditions are met. Each AMC requires ongoing work and the submission of plans to AJAM.
Exploration licenses allow exploration activities only and must be converted to AMCs to conduct exploitation and development activities. Exploration licenses are valid for a maximum of five years and provide the holder with the preferential right to request an AMC. In specific areas, mineral tenure is owned by the Bolivian state mining corporation, Corporación Minera de Bolivia (“COMIBOL”). In these areas, development and production agreements can be obtained by entering into a Mining Production Contract (“MPC”) with COMIBOL.
Silver Sand Project
The Silver Sand Project is located in the Colavi District of Potosí Department in southwestern Bolivia at an elevation of 4,072 m above sea level, 33 kilometres (“km”) northeast of Potosí City, the department capital.
The Silver Sand Project is comprised of two claim blocks, the Silver Sand south and north blocks, which covers a total area of 5.42 km2. The Silver Sand south block, covering an area of 3.17 km2 hosts the Silver Sand deposit. On August 12, 2021, the Company announced the receipt of an AMC for the Silver Sand south block from AJAM. The Silver Sand north block covers an area of 2.25 km2 and is comprised of two AMCs (Jisasjardan and Bronce). The AMCs establish a clear title to the Silver Sand Project.
Since acquiring the Silver Sand Project in 2017, the Company has carried out extensive exploration and resource definition drill programs.
In 2021, the Company completed a drill program of 13,313.7 m in 55 holes. The 2021 drill program comprised structure orientation drilling, step-out and infill drilling as well as exploration drilling. Assay results of all drill holes have been received. Detailed structural logging and assay of the oriented drill cores confirmed previous understanding of the orientation of mineralized structures and resource model which are dominantly striking in the direction of north and northwest and dipping in direction of west at high angles which are also evidenced at surface outcrops and historical underground workings. Step-out drilling was carried out mainly outside of the major mineralized trends with results indicating the existence of multiple smaller satellite mineralized zones between the major mineralized trends. For details of the 2021
| Management’s Discussion and Analysis | Page 3 |
NEW PACIFIC METALS CORP.
Management’s Discussion and Analysis
For the year ended June 30, 2023
(Expressed in US dollars, unless otherwise stated)
drill program, please refer to the Company’s news release dated April 6, 2022.
In 2022, the Company conducted a resource infill drilling and step-out drilling program at the Silver Sand south block and completed 19,323 m in 86 drill holes. Assay results for all drill holes have been received. The resource infill drilling aimed to improve the confidence in the continuity of mineralization in the core area of the Silver Sand Project and upgrade resources, while the step-out drilling was designed to test the extension of the mineralized zones up and down dip as well as on strike. The infill and step-out drilling results were included in the MRE update and incorporated into the PEA Technical Report. For details on the 2022 drill program, please refer to the Company’s news releases dated September 19, 2022, May 31, 2022, and April 6, 2022.
On November 28, 2022, the Company released the MRE update. Based on the MRE, the Silver Sand Project has an estimated measured and indicated mineral resource of 201.77 million ounces (“oz”) of silver at head grade of 116 g/t and an estimated inferred mineral resource of 12.95 million oz of silver at 88 g/t. For further details, please refer to the Company’s news release dated November 28, 2022.
On February 16, 2023, the Company filed its independent PEA Technical Report for its Silver Sand Project. AMC Mining Consultants (Canada) Ltd. (mineral resource, mining, infrastructure and financial analysis) was contracted to conduct the PEA Technical Report in cooperation with Halyard Inc. (metallurgy and processing), and New Fields Canada Mining & Environment ULC (tailings, water and water management). The PEA Technical Report is based on the MRE, which was reported on November 28, 2022. Highlights from the PEA Technical Report, with a base case silver price of $22.50/oz are as follows:
| § | pre-tax NPV (5%) of $1.1 billion with an IRR of 52%, and a post-tax NPV (5%) of $726 million with an IRR of 39%; |
| § | using a +/- 20% sensitivity analysis for silver price, a post-tax NPV (5%) of $1,054 million with an IRR of 50% at $27/oz silver, or a post-tax NPV (5%) of $398 million with an IRR of 26% at $18/oz silver; |
| § | 14-year mine life producing approximately 171 million ounces payable silver metal; |
| § | initial capital cost of $308 million, which includes $52 million in contingency cost; |
| § | life-of-mine (“LOM”) total sustaining capital cost of $20 million; |
| § | average LOM operating cash cost of $8.45/oz and total all-in sustaining cost of $10.42/oz silver; and |
| § | annual payable metal production exceeds 15 million ounces of silver in years one through four, with LOM average annual payable metal production exceeding 12 million ounces of silver. |
Please see “Cautionary Note Regarding Results of Preliminary Economic Assessment”. For more details on the PEA Technical Report, please refer to the Company’s news releases dated February 16, 2023 and January 9, 2023.
Project Expenditures
For the three months and year ended June 30, 2023, total expenditures of $895,465 and $6,316,500, respectively (three months and year ended June 30, 2022 - $3,198,033 and $7,639,287, respectively) were capitalized under the Silver Sand Project.
| Management’s Discussion and Analysis | Page 4 |
NEW PACIFIC METALS CORP.
Management’s Discussion and Analysis
For the year ended June 30, 2023
(Expressed in US dollars, unless otherwise stated)
Mining Production Contract
On January 11, 2019, New Pacific announced that its 100% owned subsidiary, Minera Alcira S.A. (“Alcira”), entered into an MPC with COMIBOL granting Alcira the right to carry out exploration, development and mining production activities in ATEs and cuadriculas owned by COMIBOL adjoining the Silver Sand Project. An updated to the MPC was made with COMIBOL on January 19, 2022. The MPC is comprised of two areas. The first area is located to the south and west of the Silver Sand Project. The second area includes additional geologically prospective ground to the north, east and south of the Silver Sand Project, wherein COMIBOL is expected to apply for exploration and mining rights with AJAM. Upon granting of the exploration and mining rights, COMIBOL will contribute these additional properties to the MPC.
There are no known economic mineral deposits, nor any previous drilling or exploration discoveries within the MPC area. The MPC presents an opportunity to explore and evaluate the possible extensions and/or satellites of mineralization outside of the currently defined Silver Sand Project.
The MPC remains subject to ratification and approval by the Plurinational Legislative Assembly of Bolivia. As of the date of this MD&A, the MPC has not been ratified nor approved by the Plurinational Legislative Assembly of Bolivia. The Company cautions that there is no assurance that the Company will be successful in obtaining ratification of the MPC in a timely manner or at all, or that the ratification of the MPC will be obtained on reasonable terms. The Company cannot predict the Bolivia government’s positions on foreign investment, mining concessions, land tenure, environmental regulation, community relations, taxation or otherwise. A change in the government’s position on these issues could adversely affect the ratification of the MPC and the Company’s business.
Carangas Project
In April 2021, the Company signed an agreement with a private Bolivian company to acquire a 98% interest in the Carangas Project. The Carangas Project is located approximately 180 km southwest of the city of Oruro and within 50 km from Bolivia’s border with Chile. The private Bolivian company is 100% owned by Bolivian nationals and holds title to the three exploration licenses that cover an area of 40.75 km2.
Under the agreement, the Company is required to cover 100% of the future expenditures on exploration, mining, development and production activities for the Carangas Project. The agreement has a term of 30 years and is renewable for another 15 years.
In 2021, the Company completed an initial discovery drill program of 13,209 m in 35 drill holes. Assay results of all drill holes have been received. Results from the 2021 discovery drill program confirmed the broad silver-rich polymetallic mineralization near surface and intersected a wide zone of gold mineralization below it. For details of the 2021 discovery drill program, please refer to the Company’s news releases dated May 17, 2022, February 23, 2022, and February 10, 2022.
Following the success of the 2021 discovery drill program, the Company completed the 2022 resource definition drill program for a total of 50,368 m in 115 drill holes. Assay results of all 115 drill holes have been received and released to date. The assay results continue to indicate that a thick zone of gold mineralization occurs beneath a shallow silver horizon measuring approximately 1,000 m long, 800 m wide, and up to 200 m thick. The 2022 drill results also indicate the gold system is open to the north and northeast directions with these targets being drill tested as part of the Company’s 2023 drill program. For details of the 2022 drill program, please refer to the Company’s news releases dated April 6, 2023, February 21, 2023,
| Management’s Discussion and Analysis | Page 5 |
NEW PACIFIC METALS CORP.
Management’s Discussion and Analysis
For the year ended June 30, 2023
(Expressed in US dollars, unless otherwise stated)
February 1, 2023, January 24, 2023, November 14, 2022, October 19, 2022, August 8, 2022, and July 13, 2022.
To the date of this MD&A, the Company completed its 2023 drill program at the Carangas Project for a total of 17,623 m in 39 drill holes. Assay results of all 39 drill holes have been received and released to date. For details of the 2023 drill program, please refer to the Company’s news releases dated July 6, 2023 and May 30, 2023. The results from the 2023 drill program, together with the results from 2021 and 2022 drill programs, will be used for an inaugural MRE to be completed later in 2023.
Project Expenditures
For the three months and year ended June 30, 2023, total expenditures of $1,627,199 and $10,817,356, respectively (three months and year ended June 30, 2022- $2,097,824 and $5,224,138, respectively) were capitalized under the project.
Silverstrike Project
The Silverstrike Project is located approximately 140 km southwest of La Paz, Bolivia. In December 2019, the Company signed a mining association agreement and acquired a 98% interest in the Silverstrike Project from a private Bolivian corporation. The private Bolivian corporation is owned 100% by Bolivian nationals and holds the title to the nine ATEs (covering an area of approximately 13 km2) that comprise the SIlverstrike Project.
Under the mining association agreement, the Company is required to cover 100% of future expenditures including exploration, contingent on results of development and subsequent mining production activities at the Silverstrike Project. The agreement has a term of 30 years and is renewable for another 15 years.
During 2020, the Company’s exploration team completed reconnaissance and detailed mapping and sampling programs on the northern portion of the Silverstrike Project. The results to date identified near surface broad zones of silver mineralization in altered sandstones to the north, with similarities to that at the Silver Sand Project; and in the Silverstrike Project’s central area, a near surface broad silver zone that occurs near the top of a 900 m diameter volcanic dome of ignimbrite (volcaniclastic sediments) units with intrusion of rhyolite dyke swarm and andesite flows; and a broad gold zone occurs half way from the top of the dome.
In 2022, the Company completed a 3,200 m drill program at the Silverstrike Project. Assay results for the two drill holes were released in the news releases dated November 1, 2022 and September 12, 2022.
Project Expenditures
For the three months and year ended June 30, 2023, total expenditures of $63,030 and $1,409,101, respectively (three months and year ended June 30, 2021 - $100,677 and $142,078, respectively) were capitalized under the Silverstrike Project.
Frontier Area – Carangas Project and Silverstrike Project
The Carangas Project and the Silverstrike Project are located within 50 km of the Bolivian border with Chile. In line with many South American countries, Bolivia does not permit foreign entities to own property within 50 km of international borders (the “Frontier Area”). Property owners in the Frontier Area are, however,
| Management’s Discussion and Analysis | Page 6 |
NEW PACIFIC METALS CORP.
Management’s Discussion and Analysis
For the year ended June 30, 2023
(Expressed in US dollars, unless otherwise stated)
permitted to enter into mining association agreements with third parties, including foreign entities, for the development of mining activities under Bolivian Law No. 535 on Mining and Metallurgy. While the Company believes the mining association agreements for the Carangas Project and the Silverstrike Project are legally compliant with the Frontier Area requirements and Bolivian mining laws, there is no assurance that the Company’s Bolivian partners will be successful in obtaining the approval of AJAM to convert the exploration licenses to AMC in the case of the Carangas Project, or that even if approved, that such relationships and structures will not be challenged by other Bolivian organizations or communities.
RZY Project
The Company’s former RZY project (the “RZY Project”), located in Qinghai, China was an early stage silver-lead-zinc exploration project. The RZY Project was located approximately 237 km from the city of Yushu Tibetan Autonomous Prefecture. In 2016, the Qinghai Government issued a moratorium which suspended exploration for 26 mining projects in the region, including the RZY Project, and classified the region as a National Nature Reserve Area.
During Fiscal 2020, the Company’s subsidiary, Qinghai Found Mining Co., Ltd. (“Qinghai Found”), reached a compensation agreement with the Qinghai Government for the RZY Project. Pursuant to the agreement, Qinghai Found will surrender its title to the RZY Project to the Qinghai Government for one-time cash compensation of $2.99 million (RMB ¥20 million) (the “RZY Compensation Transaction”).
On June 25, 2022, the Qinghai Government completed its approval process of the RZY Compensation Transaction. As a result, the Company disposed its RZY Project for cash consideration of $2,986,188 (RMB ¥20 million), which is included in the receivables balance as at June 30, 2022 and was received in full during the year ended June 30, 2023. For the year ended June 30, 2022, a loss of $85,052 was recognized upon disposal of the RZY Project.
Overall Expenditure Summary
The continuity schedule of mineral property acquisition costs, deferred exploration and development costs are summarized as follows:
| Cost | Silver Sand | Silverstrike | Carangas | RZY Project | Total | |||||||||||||||
| Balance, July 1, 2021 | $ | 69,245,500 | $ | 3,163,304 | $ | 255,250 | $ | 2,871,368 | $ | 75,535,422 | ||||||||||
| Capitalized exploration expenditures | ||||||||||||||||||||
| Reporting and assessment | 353,109 | 40 | - | - | 353,149 | |||||||||||||||
| Drilling and assaying | 4,990,082 | 1,625 | 3,752,094 | - | 8,743,801 | |||||||||||||||
| Project management and support | 1,917,060 | 45,773 | 1,020,422 | - | 2,983,255 | |||||||||||||||
| Camp service | 364,507 | 61,578 | 443,810 | - | 869,895 | |||||||||||||||
| Geological surveys | - | 25,508 | - | - | 25,508 | |||||||||||||||
| Permit and license | 14,529 | 7,554 | 7,812 | - | 29,895 | |||||||||||||||
| Disposition | - | - | - | (3,071,240 | ) | (3,071,240 | ) | |||||||||||||
| Foreign currency impact | (316,189 | ) | (36,150 | ) | (18,442 | ) | 199,872 | (170,909 | ) | |||||||||||
| Balance, June 30, 2022 | $ | 76,568,598 | $ | 3,269,232 | $ | 5,460,946 | $ | - | $ | 85,298,776 | ||||||||||
| Capitalized exploration expenditures | ||||||||||||||||||||
| Reporting and assessment | 1,008,174 | - | 88,558 | - | 1,096,732 | |||||||||||||||
| Drilling and assaying | 1,925,695 | 977,881 | 8,289,678 | - | 11,193,254 | |||||||||||||||
| Project management and support | 2,719,120 | 256,569 | 1,424,573 | - | 4,400,262 | |||||||||||||||
| Camp service | 467,690 | 174,651 | 1,005,158 | - | 1,647,499 | |||||||||||||||
| Permit and license | 195,821 | - | 9,389 | - | 205,210 | |||||||||||||||
| Foreign currency impact | (201,972 | ) | (24,680 | ) | (8,831 | ) | - | (235,483 | ) | |||||||||||
| Balance, June 30, 2023 | $ | 82,683,126 | $ | 4,653,653 | $ | 16,269,471 | $ | - | $ | 103,606,250 | ||||||||||
| Management’s Discussion and Analysis | Page 7 |
NEW PACIFIC METALS CORP.
Management’s Discussion and Analysis
For the year ended June 30, 2023
(Expressed in US dollars, unless otherwise stated)
FINANCIAL RESULTS
| Selected Annual Information | ||||||||||||
| Fiscal 2023 | Fiscal 2022 | Fiscal 2021 | ||||||||||
| Operating expense | $ | (8,256,075 | ) | $ | (6,777,399 | ) | $ | (5,945,985 | ) | |||
| Income from Investments | 178,046 | 220,112 | 395,543 | |||||||||
| Other (loss) income | (22,103 | ) | 85,619 | (1,023,932 | ) | |||||||
| Net loss | (8,100,132 | ) | (6,471,668 | ) | (6,574,374 | ) | ||||||
| Net loss attributable to equity holders | (8,095,449 | ) | (6,420,885 | ) | (6,566,440 | ) | ||||||
| Basic and diluted loss per share | (0.05 | ) | (0.04 | ) | (0.04 | ) | ||||||
| Total current assets | 7,547,949 | 33,188,094 | 47,452,145 | |||||||||
| Total non-current assets | 110,759,592 | 90,890,161 | 79,366,979 | |||||||||
| Total current liabilities | 2,336,655 | 3,869,300 | 1,094,567 | |||||||||
| Total non-current liabilities | - | - | - | |||||||||
Net loss attributable to equity holders of the Company for the year ended June 30, 2023 was $8,095,449 or $0.05 per share (year ended June 30, 2022 – net loss of $6,420,885 or $0.04 per share).
For the three months ended June 30, 2023, net loss attributable to equity holders of the Company was $1,864,029 or 0.01 per share (three months ended June 30, 2022 - net loss of $2,337,826 or $0.01 per share).
The Company’s net loss attributable to equity holders of the Company for the three months and year ended June 30, 2023 and the respective comparative periods were mainly impacted by its operating expenses and net income from investments. Details of the variance analysis on operating expenses and net income from investments are explained below.
Operating expenses for the three months and year ended June 30, 2023 were $1,892,005 and $8,256,075, respectively (three months and year ended June 30, 2022 - $2,291,704 and $6,777,399, respectively). Items included in operating expenses were as follows:
| (i) | Project evaluation and corporate development expenses for the three months and year ended June 30, 2023 - $120,787 and $460,901, respectively (three months and year ended June 30, 2022 - $92,103 and $582,253, respectively). The decrease in project evaluation and corporate development expenses in the current year was a result of the Company focusing on the exploration and development of its existing projects and not incurring significant expenditures in new project evaluation in recent periods. |
| (ii) | Filing and listing fees for the three months and year ended June 30, 2023 of $41,730 and $306,514, respectively (three months and year ended June 30, 2022 - $90,795 and $296,370, respectively). Filing fees for the current year and comparative year were consistent and incurred in the ordinary course of business. Filing fees for current quarter and comparative quarter varies due to different timing of services incurred and payments made. |
| (iii) | Investor relations expenses for the three months and year ended June 30, 2023 of $80,889 and $576,065, respectively (three months and year ended June 30, 2022 - $348,549 and $698,146, respectively). Investor relation expenses decreased for the current periods was a result of reduced investor relation activities, the Company attended less conferences in current periods. |
| Management’s Discussion and Analysis | Page 8 |
NEW PACIFIC METALS CORP.
Management’s Discussion and Analysis
For the year ended June 30, 2023
(Expressed in US dollars, unless otherwise stated)
| (iv) | Professional fees for the three months and year ended June 30, 2023 of $99,907 and $387,420, respectively (three months and year ended June 30, 2022 - $163,107 and $540,371, respectively). The decrease in professional fees for the current periods was a result of additional professional fees related to the Company’s base shelf prospectus incurred in the comparative periods. |
| (v) | Salaries and benefits expense for the three months and year ended June 30, 2023 of $512,094 and $1,684,063, respectively (three months and year ended June 30, 2022 - $399,650 and $1,828,059, respectively). The decrease in salaries and benefits for the current year was a result of the departure of a few employees during early 2022. The increase in salaries and benefits for the current quarter was a result of recent hirings of a few key management positions. |
| (vi) | Office and administration expenses for the three months and year ended June 30, 2023 of $332,510 and $1,465,132, respectively (three months and year ended June 30, 2022 - $683,606 and $1,716,546, respectively). The decrease in office and administrative expenses for the current periods was a result of reduced administrative activities. |
| (vii) | Share-based compensation for the three months and year ended June 30, 2023 of $647,214 and $3,162,449, respectively (three months and year ended June 30, 2022 - $462,375 and $941,647, respectively). The increase in share-based compensation for the current periods was a result of recent grants of stock options and restricted share units. |
Net income from investments for the year ended June 30, 2023 was $178,046 (year ended June 30, 2022 - $220,112). The decrease in net income from investments for the current year was a result of: (i) a $198,031 loss on the Company’s equity investments for the current year compared to a gain of $19,517 for the comparative year; (ii) a $5,977 gain on bonds compared to a gain of $48,484 for the comparative year; and (iii) offset by $370,100 interest earned from cash accounts compared to $152,111 interest earned in the comparative year.
For the three months ended June 30, 2023, net income from investments was $16,827 (three months ended June 30, 2022 – $11,700 ).
Foreign exchange loss for the year ended June 30, 2023 was $22,103 (year ended June 30, 2022 – gain of $185,475). The Company holds a portion of cash and short-term investments in USD to support its operations in Bolivia. Revaluation of these USD-denominated financial assets to their Canadian dollar (“CAD”) functional currency equivalents resulted in unrealized foreign exchange gain or loss for the relevant reporting periods. For the year ended June 30, 2023, the USD appreciated by 3.0% against the CAD (from 1.2886 to 1.3240) while in the prior year the USD appreciated by 4.0% against the CAD (from 1.2394 to 1.2886).
For the three months ended June 30, 2023, foreign exchange gain was $10,437 (three months ended June 30, 2022 – $21,070).
| Management’s Discussion and Analysis | Page 9 |
NEW PACIFIC METALS CORP.
Management’s Discussion and Analysis
For the year ended June 30, 2023
(Expressed in US dollars, unless otherwise stated)
Selected Quarterly Information
| For the Quarters Ended | ||||||||||||||||
| Jun. 30, 2023 | Mar. 31, 2023 | Dec. 31, 2022 | Sep. 30, 2022 | |||||||||||||
| Operating expense | $ | (1,892,005 | ) | $ | (2,377,480 | ) | $ | (1,927,708 | ) | $ | (2,058,882 | ) | ||||
| Income (loss) from Investments | 16,827 | 119,438 | 83,455 | (41,674 | ) | |||||||||||
| Other income (loss) | 10,437 | (18,683 | ) | (28,750 | ) | 14,893 | ||||||||||
| Net loss | (1,864,741 | ) | (2,276,725 | ) | (1,873,003 | ) | (2,085,663 | ) | ||||||||
| Net loss attributable to equity holders | (1,864,029 | ) | (2,275,519 | ) | (1,870,718 | ) | (2,085,183 | ) | ||||||||
| Basic and diluted loss per share | (0.01 | ) | (0.01 | ) | (0.01 | ) | (0.01 | ) | ||||||||
| Total current assets | 7,547,949 | 12,020,235 | 18,538,490 | 25,537,824 | ||||||||||||
| Total non-current assets | 110,759,592 | 107,788,104 | 102,583,739 | 96,522,875 | ||||||||||||
| Total current liabilities | 2,336,655 | 3,492,542 | 4,128,183 | 4,925,522 | ||||||||||||
| Total non-current liabilities | - | - | - | - | ||||||||||||
| For the Quarters Ended | ||||||||||||||||
| Jun. 30, 2022 | Mar. 31, 2022 | Dec. 31, 2021 | Sep. 30, 2021 | |||||||||||||
| Operating expense | $ | (2,291,704 | ) | $ | (1,524,374 | ) | $ | (1,364,790 | ) | $ | (1,596,531 | ) | ||||
| Income (loss) from Investments | 11,700 | 124,860 | 131,471 | (47,919 | ) | |||||||||||
| Other (loss) income | (78,786 | ) | (36,439 | ) | (63,527 | ) | 264,371 | |||||||||
| Net loss | (2,358,790 | ) | (1,435,953 | ) | (1,296,846 | ) | (1,380,079 | ) | ||||||||
| Net loss attributable to equity holders | (2,337,826 | ) | (1,408,892 | ) | (1,295,940 | ) | (1,378,227 | ) | ||||||||
| Basic and diluted loss per share | (0.01 | ) | (0.01 | ) | (0.01 | ) | (0.01 | ) | ||||||||
| Total current assets | 33,188,094 | 37,075,018 | 40,250,158 | 43,821,937 | ||||||||||||
| Total non-current assets | 90,890,161 | 88,171,122 | 85,318,722 | 82,251,766 | ||||||||||||
| Total current liabilities | 3,869,300 | 2,353,255 | 2,150,602 | 2,165,146 | ||||||||||||
| Total non-current liabilities | - | - | - | - | ||||||||||||
LIQUIDITY AND CAPITAL RESOURCES
Cash Flows
Cash used in operating activities for the three months and year ended June 30, 2023 was $1,150,278 and $5,513,975, respectively (three months and year ended June 30, 2022 - $1,821,805 and $4,563,997, respectively). Cash flow from operating activities are mainly driven by the Company’s operating expenses discussed in the previous sections.
Cash used in investing activities for the year ended June 30, 2023 was $17,030,589 (year ended June 30, 2022 - $13,047,208). Cash flows from investing activities were mainly impacted by: (i) capital expenditures for mineral properties and equipment of $18,118,151 on the exploration projects in Bolivia compared to $11,633,612 in the prior year; (ii) value-added tax of $1,898,626 paid in Bolivia in the current year compared to $1,415,404 paid in the prior year; and (iii) offset by proceeds of $2,986,188 received from the RZY compensation transaction during the current year.
For the three months ended June 30, 2023, cash used in investing activities was $3,475,075 (three months ended June 30, 2022 – cash used in investing activities of $4,157,035) and was mainly impacted by: (i) capital expenditures for mineral properties and equipment of $3,317,241 on the exploration projects in Bolivia compared to $3,600,638 in the comparative quarter; and (ii) value-added tax of $157,834 paid in Bolivia in the current quarter compared to $556,397 paid in the comparative quarter.
Cash provided by financing activities for the year ended June 30, 2023 was $825,116 (year ended June 30,
| Management’s Discussion and Analysis | Page 10 |
NEW PACIFIC METALS CORP.
Management’s Discussion and Analysis
For the year ended June 30, 2023
(Expressed in US dollars, unless otherwise stated)
2022 – $1,782,895) comprised of $604,674 (year ended June 30, 2022 - $1,782,895) proceeds from stock option exercises and $220,442 (year ended June 30, 2022 – nil) proceeds from private placement.
For the three months ended June 30, 2023, cash provided by financing activities was $320,128 (three months ended June 30, 2022 – cash provided by financing activities of $486,687) from proceeds of stock option exercises.
Liquidity and Access to Capital
As of June 30, 2023, the Company had working capital of $5,211,294 (June 30, 2022 – $29,318,794), comprised of cash of $6,296,312 (June 30, 2022 - $29,322,504), short term investments of $198,375 (June 30, 2022 - $192,398), and other current assets of $1,053,262 (June 30, 2022 - $3,673,192) offset by current liabilities of $2,336,655 (June 30, 2022 - $3,869,300). Management believes that the Company has sufficient funds to support its normal exploration and operating requirements on an ongoing basis.
The Company does not have unlimited resources and its future capital requirements will depend on many factors, including, among others, cash flow from interest, dividends, and realized gains on investments. To the extent that its existing resources and the funds generated by future income are insufficient to fund the Company’s operations, the Company may need to raise additional funds through public or private debt or equity financing. If additional funds are raised through the issuance of equity securities, the percentage ownership of current shareholders may be diluted and such equity securities may have rights, preferences or privileges senior to those of the holders of the Company’s common shares. No assurance can be given that additional financing will be available or that, if available, it can be obtained on terms favourable to the Company and its shareholders. If adequate funds are not available, the Company may be required to delay, limit or eliminate some or all of its proposed operations. The Company believes it has sufficient capital to meet its cash needs for the next 12 months, including the costs of compliance with continuing reporting requirements.
Use of Proceeds of Prior Financings
The Company has fully utilized the net proceeds raised from all historical financings prior to the beginning of the current fiscal year.
FINANCIAL INSTRUMENTS
The Company manages its exposure to financial risks, including liquidity risk, foreign exchange rate risk, interest rate risk, credit risk, and equity price risk in accordance with its risk management framework. The Board has overall responsibility for the establishment and oversight of the Company’s risk management framework and reviews the Company’s policies on an ongoing basis.
| (a) | Fair Value |
The Company classifies its fair value measurements within a fair value hierarchy, which reflects the significance of inputs used in making the measurements as defined in IFRS 13 – Fair Value Measurement (“IFRS 13”).
Level 1 – Unadjusted quoted prices at the measurement date for identical assets or liabilities in active markets.
| Management’s Discussion and Analysis | Page 11 |
NEW PACIFIC METALS CORP.
Management’s Discussion and Analysis
For the year ended June 30, 2023
(Expressed in US dollars, unless otherwise stated)
Level 2 – Observable inputs other than quoted prices included in Level 1, such as quoted prices for similar assets and liabilities in active markets; quoted prices for identical or similar assets and liabilities in markets that are not active; or other inputs that are observable or can be corroborated by observable market data.
Level 3 – Unobservable inputs which are supported by little or no market activity.
The following table sets forth the Company’s financial assets that are measured at fair value on a recurring basis by level within the fair value hierarchy as at June 30, 2023 and June 30, 2022 that are not otherwise disclosed. As required by IFRS 13, financial assets are classified in their entirety based on the lowest level of input that is significant to the fair value measurement.
| Fair value as at June 30, 2023 | ||||||||||||||||
| Recurring measurements | Level 1 | Level 2 | Level 3 | Total | ||||||||||||
| Financial Assets | ||||||||||||||||
| Cash | $ | 6,296,312 | $ | - | $ | - | $ | 6,296,312 | ||||||||
| Short-term investments | 198,375 | - | - | 198,375 | ||||||||||||
| Equity investments | 283,081 | - | - | 283,081 | ||||||||||||
| Fair value as at June 30, 2022 | ||||||||||||||||
| Recurring measurements | Level 1 | Level 2 | Level 3 | Total | ||||||||||||
| Financial Assets | ||||||||||||||||
| Cash | $ | 29,322,504 | $ | - | $ | - | $ | 29,322,504 | ||||||||
| Short-term investments | 192,398 | - | - | 192,398 | ||||||||||||
| Equity investments | 496,741 | - | - | 496,741 | ||||||||||||
Fair value of other financial instruments excluded from the table above approximates their carrying amount as of June 30, 2023, and June 30, 2022, respectively, due to the short-term nature of these instruments.
There were no transfers into or out of Level 3 during the year ended June 30, 2023.
| (b) | Liquidity Risk |
The Company has a history of losses and no operating revenues from its operations. Liquidity risk is the risk that the Company will not be able to meet its short term business requirements. As at June 30, 2023, the Company had a working capital position of $5,211,294 and sufficient cash resources to meet the Company’s short-term financial liabilities and its planned exploration expenditures on various projects in Bolivia for, but not limited to, the next 12 months.
In the normal course of business, the Company enters into contracts that give rise to commitments for future minimum payments. The following summarizes the remaining contractual maturities of the Company’s financial liabilities:
| June 30, 2023 | June 30, 2022 | |||||||||||
| Due within a year | Total | Total | ||||||||||
| Accounts payable and accrued liabilities | $ | 2,280,553 | $ | 2,280,553 | $ | 3,492,269 | ||||||
| Due to a related party | 56,102 | 56,102 | 377,031 | |||||||||
| $ | 2,336,655 | $ | 2,336,655 | $ | 3,869,300 | |||||||
| Management’s Discussion and Analysis | Page 12 |
NEW PACIFIC METALS CORP.
Management’s Discussion and Analysis
For the year ended June 30, 2023
(Expressed in US dollars, unless otherwise stated)
| (c) | Foreign Exchange Risk |
The Company is exposed to foreign exchange risk when it undertakes transactions and holds assets and liabilities denominated in foreign currencies other than its functional currencies. The functional currency of the head office, Canadian subsidiaries and all intermediate holding companies is CAD. The functional currency of all Bolivian subsidiaries is USD. The functional currency of the Chinese subsidiary is RMB. The Company currently does not engage in foreign exchange currency hedging. The Company’s exposure to foreign exchange risk that could affect net income is summarized as follows:
| Financial assets denominated in foreign currencies other than relevant functional currency | As at June 30, 2023 | June 30, 2022 | ||||||
| United States dollars | $ | 320,994 | $ | 468,714 | ||||
| Bolivianos | 869,869 | 886,188 | ||||||
| Total | $ | 1,190,863 | $ | 1,354,902 | ||||
| Financial liabilities denominated in foreign currencies other than relevant functional currency | ||||||||
| United States dollars | $ | 73,970 | $ | - | ||||
| Bolivianos | 1,543,889 | 1,619,261 | ||||||
| Total | $ | 1,617,859 | $ | 1,619,261 | ||||
As at June 30, 2023, with other variables unchanged, a 1% strengthening (weakening) of the USD against the CAD would have increased (decreased) net income by approximately $2,500.
As at June 30, 2023, with other variables unchanged, a 1% strengthening (weakening) of the Bolivianos against the USD would have increased (decreased) net income by approximately $6,800.
| (d) | Interest Rate Risk |
Interest rate risk is the risk that the fair value or future cash flows of a financial instrument will fluctuate due to changes in market interest rates. The Company holds a portion of cash in bank accounts that earn variable interest rates. Due to the short-term nature of these financial instruments, fluctuations in market rates do not have significant impact on the fair values of the financial instruments as of June 30, 2023. The Company, from time to time, also owns guaranteed investment certificates (“GICs”) and bonds that earn interest payments at fixed rates to maturity. Fluctuation in market interest rates usually will have an impact on bond’s fair value. An increase in market interest rates will generally reduce bond’s fair value while a decrease in market interest rates will generally increase it. The Company monitors market interest rate fluctuations closely and adjusts the investment portfolio accordingly.
| (e) | Credit Risk |
Credit risk is the risk of financial loss to the Company if the counterparty to a financial instrument fails to meet its contractual obligations. The Company’s exposure to credit risk is primarily associated with cash, bonds, and receivables. The carrying amount of financial assets included on the statement of financial position represents the maximum credit exposure.
The Company has deposits of cash that meet minimum requirements for quality and liquidity as stipulated
| Management’s Discussion and Analysis | Page 13 |
NEW PACIFIC METALS CORP.
Management’s Discussion and Analysis
For the year ended June 30, 2023
(Expressed in US dollars, unless otherwise stated)
by the Board. Management believes the risk of loss to be remote, as the majority of its cash are held with major financial institutions. Bonds by nature are exposed to more credit risk than cash. The Company manages its risk associated with bonds by only investing in large globally recognized corporations from diversified industries. As at June 30, 2023, the Company had a receivables balance of $421,860 (June 30, 2022 - $3,193,926). There were no material amounts in receivables which were past due on June 30, 2023 (June 30, 2022 - $nil).
| (f) | Equity Price Risk |
The Company holds certain marketable securities that will fluctuate in value as a result of trading on global financial markets. Based upon the Company’s portfolio at June 30, 2023, a 10% increase (decrease) in the market price of the securities held, ignoring any foreign exchange effects would have resulted in an increase (decrease) to net income of approximately $30,000.
RELATED PARTY TRANSACTIONS
Related party transactions are made on terms agreed upon by the related parties. The balances with related parties are unsecured, non-interest bearing, and due on demand. Related party transactions not disclosed elsewhere in this MD&A are as follows:
| Due to a related party | June 30, 2023 | June 30, 2022 | ||||||
| Silvercorp Metals Inc. | $ | 56,102 | $ | 377,031 | ||||
(a) Silvercorp Metals Inc. (“Silvercorp”) has one director (Dr. Rui Feng) and one officer (Dr. Rui Feng as Chief Executive Officer) in common with the Company. Silvercorp and the Company share office space and Silvercorp provides various general and administrative services to the Company. The Company expects to continue making payments to Silvercorp in the normal course of business. Office and administrative expenses rendered and incurred by Silvercorp on behalf of the Company for the year ended June 30, 2023 were $844,949 (year ended June 30, 2022 - $726,387).
During the year ended June 30, 2022, the Company’s subsidiary Qinghai Found borrowed a loan of $283,688 (RMB ¥1.9 million) from one of Silvercorp’s subsidiaries in China to help facilitate the closure of the RZY Compensation Transaction. During the year ended June 30, 2023, the loan plus interest of $23,422 were repaid in full.
(b) Compensation of key management personnel
The remuneration of directors and other members of key management personnel for the years ended June 30, 2023 and 2022 are as follows:
| Years ended June 30, | ||||||||
| 2023 | 2022 | |||||||
| Director’s cash compensation | $ | 59,715 | $ | 82,608 | ||||
| Director’s share-based compensation | 624,263 | 338,702 | ||||||
| Key management’s cash compensation | 867,499 | 988,753 | ||||||
| Key management’s share-based compensation | 2,137,888 | 461,947 | ||||||
| $ | 3,689,365 | $ | 1,872,010 | |||||
| Management’s Discussion and Analysis | Page 14 |
NEW PACIFIC METALS CORP.
Management’s Discussion and Analysis
For the year ended June 30, 2023
(Expressed in US dollars, unless otherwise stated)
Other than as disclosed above, the Company does not have any ongoing contractual or other commitments resulting from transactions with related parties.
OFF-BALANCE SHEET ARRANGEMENTS
The Company does not have any off-balance sheet financial arrangements.
PROPOSED TRANSACTIONS
As at the date of this MD&A, there are no proposed acquisitions or disposals of assets or business, other than those in the ordinary course of business, approved by the Board.
CRITICAL ACCOUNTING POLICIES AND ESTIMATES
The preparation of the consolidated financial statements in accordance with IFRS as issued by IASB requires management to make estimates and assumptions that affect the amounts reported on the consolidated financial statements. These critical accounting estimates represent management’s estimates that are uncertain and any changes in these estimates could materially impact the Company’s consolidated financial statements. Management continuously reviews its estimates and assumptions using the most current information available. The Company’s critical accounting policies and estimates are described in Note 2 of the audited consolidated financial statements for the year ended June 30, 2023.
OUTSTANDING SHARE DATA
As at the date of this MD&A, the following securities were outstanding:
| (a) | Share Capital |
| ● | Authorized – unlimited number of common shares without par value. |
| ● | Issued and outstanding – 157,605,340 common shares with a recorded value of $156 million. |
| ● | Shares subject to escrow or pooling agreements – nil. |
| (b) | Options |
The outstanding options as at the date of this MD&A are summarized as follows:
| Options Outstanding | Exercise Price CAD$ | Expiry Date | ||
| 774,167 | 2.15 | February 22, 2024 | ||
| 713,000 | 3.33 | February 4, 2027 | ||
| 10,000 | 3.89 | February 22, 2027 | ||
| 1,347,000 | 4.00 | June 6, 2027 | ||
| 939,000 | 3.42 | January 19, 2028 | ||
| 120,000 | 3.67 | January 24, 2028 | ||
| 50,000 | 3.92 | April 14, 2028 | ||
| 3,953,167 | $ 2.50 |
| Management’s Discussion and Analysis | Page 15 |
NEW PACIFIC METALS CORP.
Management’s Discussion and Analysis
For the year ended June 30, 2023
(Expressed in US dollars, unless otherwise stated)
| (c) | Restricted Share Units (“RSUs”) |
The outstanding RSUs as at the date of this MD&A are summarized as follows:
| Weighted average | ||||||
| grant date closing | ||||||
| RSUs Outstanding | price per share (CAD$) | |||||
| 1,782,992 | $ 3.81 | |||||
RISK FACTORS
The Company is subject to many risks which are outlined in this MD&A, the Company’s Annual Information Form (the “AIF”) and other public filings which are available under the Company’s profile on SEDAR+ at www.sedarplus.ca and on EDGAR at www.sec.gov. In addition, please refer to the “Financial Instruments” section of this MD&A for an analysis of financial risk factors.
Political and Economic Risks in Bolivia
The Company’s projects are located in Bolivia and, therefore, the Company’s current and future mineral exploration and mining activities are exposed to various levels of political, economic, and other risks and uncertainties. There has been a significant level of political and social unrest in Bolivia in recent years resulting from a number of factors, including Bolivia’s history of political and economic instability under a variety of governments and high rate of unemployment.
The Company’s exploration and development activities may be affected by changes in government, political instability, and the nature of various government regulations relating to the mining industry. Bolivia’s fiscal regime has historically been favourable to the mining industry, but there is a risk that this could change. The Company cannot predict the government’s positions on foreign investment, mining concessions, land tenure, environmental regulation, or taxation. A change in government positions on these issues could adversely affect the Company’s business and/or its holdings, assets, and operations in Bolivia. Any changes in regulations or shifts in political conditions are beyond the control of the Company. Moreover, protestors and cooperatives have previously targeted foreign companies in the mining sector, and as a result there is no assurance that future social unrest will not have an adverse impact on the Company’s operations. Labour in Bolivia is customarily unionized and there are risks that labour unrest or wage agreements may impact operations.
The Company’s operations in Bolivia may also be adversely affected by economic uncertainty characteristic of developing countries. In addition, operations may be affected in varying degrees by government regulations with respect to restrictions on production, price controls, export controls, currency remittance, income taxes, expropriation of property, foreign investment, maintenance of claims, environmental legislation, land use, land claims of local people, water use, and safety factors.
The MPC remains subject to ratification and approval by the Plurinational Legislative Assembly of Bolivia. As of the date of this MD&A, the MPC has not been ratified nor approved by the Plurinational Legislative Assembly of Bolivia. The Company cautions that there is no assurance that the Company will be successful in obtaining ratification of the MPC in a timely manner or at all, or that the ratification of the MPC will be obtained on reasonable terms. The Company cannot predict any new government’s positions on foreign
| Management’s Discussion and Analysis | Page 16 |
NEW PACIFIC METALS CORP.
Management’s Discussion and Analysis
For the year ended June 30, 2023
(Expressed in US dollars, unless otherwise stated)
investment, mining concessions, land tenure, environmental regulations, community relations, taxation or otherwise.
Community Relations and Social Licence to Operate
Mining companies are increasingly required to operate in a sustainable manner and to provide benefits to affected communities and there are risks associated with the Company failing to acquire and subsequently maintain a “social licence” to operate on its mineral properties. “Social licence” does not refer to a specific permit or licence, but rather is a broad term used to describe community acceptance of a company’s plans and activities related to exploration, development or operations on its mineral projects.
The Company places a high priority on, and dedicates considerable efforts and resources toward, its community relationships and responsibilities. Despite its best efforts, there are factors that may affect the Company’s efforts to establish and maintain social licence at any of its projects, including national or local changes in sentiment toward mining, evolving social concerns, changing economic conditions and challenges, and the influence of third-party opposition toward mining on local support. There can be no guarantee that social licence can be earned by the Company or if established, that social licence can be maintained in the long term, and without strong community support the ability to secure necessary permits, obtain project financing, and/or move a project into development or operation may be compromised or precluded. Delays in projects attributable to a lack of community support or other community-related disruptions or delays can translate directly into a decrease in the value of a project or into an inability to bring the project to, or maintain, production. The cost of measures and other issues relating to the sustainable development of mining operations may result in additional operating costs, higher capital expenditures, reputational damage, active community opposition (possibly resulting in delays, disruptions and stoppages), legal suits, regulatory intervention and investor withdrawal.
Acquisition and Maintenance of Permits and Governmental Approvals
Exploration and development of, and production from, any deposit at the Company’s mineral projects require permits from various government authorities. There can be no assurance that any required permits will be obtained in a timely manner or at all, or that they will be obtained on reasonable terms. Delays or failure to obtain, expiry of, or a failure to comply with the terms of such permits could prohibit development of the Company’s mineral projects and have a material adverse impact on the Company.
While the Company believes the contractual relationships and the structures it has in place with private Bolivian companies owned 100% by Bolivian nationals for the Silverstrike Project and the Carangas Project are legally compliant with Bolivian laws related to the Frontier Areas, there is no assurance that the Company’s Bolivian partner will be successful in obtaining approval of AJAM to convert the exploration licenses to AMCs in the case of Carangas Project, or that even if approved, that such contractual relationship and structure will not be challenged by other Bolivian organizations or communities.
The Company’s current and future operations, including development activities and commencement of production, if warranted, require permits from government authorities and such operations are and will be governed by laws and regulations governing prospecting, development, mining, production, exports, taxes, labour standards, occupational health, waste disposal, toxic substances, land use, environmental protection, mine safety, and other matters. Companies engaged in property exploration and the development or operation of mines and related facilities generally experience increased costs and delays in production and other schedules as a result of the need to comply with applicable laws, regulations, and permits. The
| Management’s Discussion and Analysis | Page 17 |
NEW PACIFIC METALS CORP.
Management’s Discussion and Analysis
For the year ended June 30, 2023
(Expressed in US dollars, unless otherwise stated)
Company cannot predict if all permits which it may require for continued exploration, development, or construction of mining facilities and conduct of mining operations will be obtainable on reasonable terms, if at all. Time delays and associated costs related to applying for and obtaining permits and licenses may be prohibitive and could delay planned exploration and development activities. Failure to comply with or any violations of the applicable laws, regulations, and permitting requirements may result in enforcement actions, including orders issued by regulatory or judicial authorities causing operations to cease or be curtailed, and may include corrective measures requiring capital expenditures, installation of additional equipment, or remedial actions.
Parties engaged in mining operations may be required to compensate those impacted by mining activities and may have civil or criminal fines or penalties imposed for violations of applicable laws or regulations. Amendments to current laws, regulations, and permits governing operations and activities of mining companies, or more stringent implementation thereof, could have a material adverse impact on the Company’s operations and cause increases in capital expenditures or production costs, or reduction in levels of production at producing properties, or require abandonment or delays in the development of new mining properties.
DISCLOSURE CONTROLS AND PROCEDURES
Disclosure controls and procedures are designed to provide reasonable assurance that material information related to the Company is gathered and reported to senior management, including the Chief Executive Officer (“CEO”) and the Chief Financial Officer (“CFO”), as appropriate, to allow for timely decisions about the Company’s public disclosure.
Management, including the CEO and CFO, has evaluated the effectiveness of the design and operation of the Company’s disclosure controls and procedures, as defined in the rules of the U.S. Securities and Exchange Commission and the national instrument of the Canadian Securities Administrators. The evaluation included documentation review, enquiries and other procedures considered by management to be appropriate in the circumstances. Based on this evaluation, management concluded that as of June 30, 2023, the Company’s disclosure controls and procedures (as defined in Rule 13a-15(e) under the Securities Exchange Act of 1934 and National Instrument 52-109 - Certification of Disclosure in Issuers’ Annual and Interim Filings) are effective.
MANAGEMENT’S REPORT ON INTERNAL CONTROL OVER FINANCIAL REPORTING
| (a) | Internal Control over Financial Reporting |
Management of the Company is responsible for establishing and maintaining an adequate system of internal control over financial reporting and used the Internal Control – Integrated Framework (2013) issued by the Committee of Sponsoring Organizations of the Treadway Commission (“COSO”) to evaluate, with the participation of the CEO and CFO, the effectiveness of the Company’s internal controls. The Company’s internal control over financial reporting includes:
| · | maintaining records, that in reasonable detail, accurately and fairly reflect the transactions and dispositions of the assets of the Company; |
| · | providing reasonable assurance that transactions are recorded as necessary to permit preparation of the consolidated financial statements in accordance with generally accepted accounting principles; |
| Management’s Discussion and Analysis | Page 18 |
NEW PACIFIC METALS CORP.
Management’s Discussion and Analysis
For the year ended June 30, 2023
(Expressed in US dollars, unless otherwise stated)
| · | providing reasonable assurance that receipts and expenditures are made in accordance with authorizations of management and the directors of the Company; and |
| · | providing reasonable assurance that unauthorized acquisition, use or disposition of company assets that could have a material effect on the Company’s consolidated financial statements would be prevented or detected on a timely basis. |
Based on this evaluation, management concluded that as of June 30, 2023, the Company’s internal control over financial reporting based on the criteria set forth in Internal Control – Integrated Framework (2013) issued by COSO was effective and provided a reasonable assurance of the reliability of the Company’s financial reporting and preparation of the financial statements.
No matter how well a system of internal control over financial reporting is designed, any system has inherent limitations. Even systems determined to be effective can provide only reasonable assurance of the reliability of financial statement preparation and presentation. Also, controls may become inadequate in the future because of changes in conditions or deterioration in the degree of compliance with the Company’s policies and procedures.
Emerging growth companies are exempt from Section 404(b) of the Sarbanes-Oxley Act, which generally requires public companies to provide an independent auditor attestation of management’s assessment of the effectiveness of their internal control over financial reporting. The Company qualifies as an emerging growth company and therefore has not included an independent auditor attestation of management’s assessment of the effectiveness of its internal control over financial reporting in its audited annual consolidated financial statements for the year ended June 30, 2023.
| (b) | Changes in Internal Control over Financial Reporting |
There has been no change in the Company’s internal control over financial reporting during the year ended June 30, 2023 that has materially affected or is reasonably likely to materially affect the Company’s internal control over financial reporting.
TECHNICAL INFORMATION
The scientific and technical information contained in this MD&A has been reviewed and approved by Alex Zhang, P. Geo., Vice President of Exploration of the Company, who is a qualified person (as defined in National Instrument 43-101 – Standards of Disclosure for Mineral Projects (“NI 43-101”)) for the purposes of NI 43-101.
CAUTIONARY NOTE REGARDING RESULTS OF PRELIMINARY ECONOMIC ASSESSMENT
The results of the independent preliminary economic assessment (the “PEA”) contained in the PEA Technical Report are preliminary in nature and are intended to provide an initial assessment of the Silver Sand Project’s economic potential and development options. The PEA mine schedule and economic assessment includes numerous assumptions and is based on both indicated and inferred mineral resources. Inferred resources are considered too speculative geologically to have the economic considerations applied to them that would enable them to be categorized as mineral reserves, and there is no certainty that the project economic assessments described herein will be achieved or that the PEA results will be realized. The estimate of mineral resources may be materially affected by geology, environmental, permitting, legal, title, socio-
| Management’s Discussion and Analysis | Page 19 |
NEW PACIFIC METALS CORP.
Management’s Discussion and Analysis
For the year ended June 30, 2023
(Expressed in US dollars, unless otherwise stated)
political, marketing or other relevant issues. Mineral resources are not mineral reserves and do not have demonstrated economic viability. Additional exploration will be required to potentially upgrade the classification of the inferred mineral resources to be considered in future advanced studies. AMC Mining Consultants (Canada) Ltd. (“AMC Consultants”) (mineral resource, mining, infrastructure and financial analysis) was contracted to conduct the PEA in cooperation with Halyard Inc. (metallurgy and processing), and NewFields Canada Mining & Environment ULC (tailings, water and waste management). The qualified persons (as defined in NI 43-101) for the PEA for the purposes of NI 43-101 are Mr. John Morton Shannon, P.Geo, General Manage and Principal Geologist at AMC Consultants, Mr. Wayne Rogers, P.Eng, and Mr. Mo Molavi, P.Eng, both Principal Mining Engineers with AMC Consultants, Mr. Andrew Holloway, P.Eng, Process Director with Halyard Inc., and Mr. Leon Botham, P.Eng., Principal Engineer with NewFields Canada Mining & Environment ULC, in addition to Ms. Dinara Nussipakynova, P.Geo., Principal Geologist with AMC Consultants, who estimated the mineral resources. All qualified persons for the PEA have reviewed the disclosure of the PEA herein. The PEA is based on the MRE, which was reported on November 28, 2022. The effective date of the MRE is October 31, 2022. The cut-off applied for reporting the pit-constrained mineral resources is 30 g/t silver. Assumptions made to derive a cut-off grade included mining costs, processing costs and recoveries and were obtained from comparable industry situations. The model is depleted for historical mining activities. Mineral resources are constrained by optimized pit shells at a silver price of US$22.50 per ounce, silver metallurgical recovery of 91%, silver payability of 99%, open pit mining cost of US$2.6/t, processing cost of US$16/t, G&A cost of US$2/t, and slope angle of 44-47 degrees. Key assumptions used for pit optimization for the PEA mining pit include silver price of US$22.50 per ounce, silver metallurgical recovery of 91%, silver payability of 99%, open pit mining cost of US$2.6/t, incremental mining cost of US$0.04/t (per 10 m bench), processing cost of US$16/t, tailing storage facility operating cost of US$0.7/t, G&A cost of US$2/t, royalty of 6.00%, mining recovery of 92%, dilution of 8%, and cut-off grade of 30 g/t silver.
CAUTIONARY NOTE REGARDING FORWARD-LOOKING INFORMATION
Except for statements of historical facts relating to the Company, certain information contained herein constitutes “forward-looking statements” within the meaning of the United States Private Securities Litigation Reform Act of 1995 and “forward-looking information” within the meaning of applicable Canadian provincial securities laws (collectively, “forward-looking statements”). Forward-looking statements are frequently characterized by words such as “plan”, “expect”, “project”, “intend”, “believe”, “anticipate”, “estimate”, “goals”, “forecast”, “budget”, “potential” or variations thereof and other similar words, or statements that certain events or conditions “may”, “could”, “would”, “might”, “will” or “can” occur. Forward-looking statements include, but are not limited to: statements regarding anticipated exploration, drilling, development, construction, and other activities or achievements of the Company; inferred, indicated or measured mineral resources or mineral reserves on the Company’s projects; the results of the PEA; timing of receipt of permits and regulatory approvals; and estimates of the Company’s revenues and capital expenditures; and the sufficiency of funds to support the Company’s normal exploration, development and operating requirements on an ongoing basis.
Forward-looking statements are based on the opinions and estimates of management on the date the statements are made and are subject to a variety of risks and uncertainties and other factors that could cause actual events or results to differ materially from those projected in the forward-looking statements. These factors include fluctuating equity prices, bond prices and commodity prices; calculation of resources, reserves and mineralization; general economic conditions; foreign exchange risks; interest rate risk; foreign investment risk; loss of key personnel; conflicts of interest; dependence on management; uncertainties relating to the availability and costs of financing needed in the future; environmental risks; operations and
| Management’s Discussion and Analysis | Page 20 |
NEW PACIFIC METALS CORP.
Management’s Discussion and Analysis
For the year ended June 30, 2023
(Expressed in US dollars, unless otherwise stated)
political conditions; the regulatory environment in Bolivia and Canada; risks associated with community relations and corporate social responsibility; and other factors described in this MD&A, under the heading “Risk Factors”, in the AIF and its other public filings. The foregoing is not an exhaustive list of the factors that may affect any of the Company’s forward-looking statements or information.
The forward-looking statements are necessarily based on a number of estimates, assumptions, beliefs, expectations and opinions of management as of the date of this MD&A that, while considered reasonable by management, are inherently subject to significant business, economic and competitive uncertainties and contingencies. These estimates, assumptions, beliefs, expectations and opinions include, but are not limited to, those related to the Company’s ability to carry on current and future operations, including: development and exploration activities; the timing, extent, duration and economic viability of such operations; the accuracy and reliability of estimates, projections, forecasts, studies and assessments; the Company’s ability to meet or achieve estimates, projections and forecasts; the stabilization of the political climate in Bolivia; the availability and cost of inputs; the price and market for outputs; foreign exchange rates; taxation levels; the timely receipt of necessary approvals or permits; including the ratification and approval of the MPC by the Plurinational Legislative Assembly of Bolivia; the ability of the Company’s Bolivian partner to convert the exploration licenses at the Carangas Project to AMC; the completion of an MRE based on the results of the 2023, 2022 and 2021 drill programs; the ability to meet current and future obligations; the ability to obtain timely financing on reasonable terms when required; the current and future social, economic and political conditions; and other assumptions and factors generally associated with the mining industry.
Although the forward-looking statements contained in this MD&A are based upon what management believes are reasonable assumptions, there can be no assurance that actual results will be consistent with these forward-looking statements. All forward-looking statements in this MD&A are qualified by these cautionary statements. Accordingly, readers should not place undue reliance on such statements. Other than specifically required by applicable laws, the Company is under no obligation and expressly disclaims any such obligation to update or alter the forward-looking statements whether as a result of new information, future events or otherwise except as may be required by law. These forward-looking statements are made as of the date of this MD&A.
CAUTIONARY NOTE TO U.S. INVESTORS
This MD&A has been prepared in accordance with the requirements of the securities laws in effect in Canada which differ from the requirements of United States securities laws. All mining terms used herein but not otherwise defined have the meanings set forth in NI 43-101. Unless otherwise indicated, the technical and scientific disclosure herein has been prepared in accordance with NI 43-101, which differs significantly from the requirements adopted by the U.S. Securities and Exchange Commission.
Accordingly, information contained in this MD&A containing descriptions of the Company’s mineral deposits may not be comparable to similar information made public by U.S. companies subject to the reporting and disclosure requirements of United States federal securities laws and the rules and regulations thereunder.
Additional information relating to the Company, including the AIF, can be obtained under the Company’s profile on SEDAR+ at www.sedarplus.ca, on EDGAR at www.sec.gov, and on the Company’s website at www.newpacificmetals.com.
| Management’s Discussion and Analysis | Page 21 |
Exhibit 99.3
![]()
CONSOLIDATED FINANCIAL STATEMENTS
June 30, 2023 and 2022
(Expressed in US Dollars)
REPORT OF INDEPENDENT REGISTERED PUBLIC ACCOUNTING FIRM
To the Shareholders and the Board of Directors of New Pacific Metals Corp.
Opinion on the Financial Statements
We have audited the accompanying consolidated statements of financial position of New Pacific Metals Corp. and subsidiaries (the “Company”) as of June 30, 2023 and 2022, the related consolidated statements of loss, comprehensive loss, changes in equity, and cash flows, for each of the two years in the period ended June 30, 2023, and the related notes (collectively referred to as the "financial statements"). In our opinion, the financial statements present fairly, in all material respects, the financial position of the Company as of June 30, 2023 and 2022, and its financial performance and its cash flows for each of the two years in the period ended June 30, 2023, in accordance with International Financial Reporting Standards as issued by the International Accounting Standards Board.
Basis for Opinion
These financial statements are the responsibility of the Company's management. Our responsibility is to express an opinion on the Company's financial statements based on our audits. We are a public accounting firm registered with the Public Company Accounting Oversight Board (United States) (PCAOB) and are required to be independent with respect to the Company in accordance with the U.S. federal securities laws and the applicable rules and regulations of the Securities and Exchange Commission and the PCAOB.
We conducted our audits in accordance with the standards of the PCAOB. Those standards require that we plan and perform the audit to obtain reasonable assurance about whether the financial statements are free of material misstatement, whether due to error or fraud. The Company is not required to have, nor were we engaged to perform, an audit of its internal control over financial reporting. As part of our audits, we are required to obtain an understanding of internal control over financial reporting but not for the purpose of expressing an opinion on the effectiveness of the Company's internal control over financial reporting. Accordingly, we express no such opinion.
Our audits included performing procedures to assess the risks of material misstatement of the financial statements, whether due to error or fraud, and performing procedures that respond to those risks. Such procedures included examining, on a test basis, evidence regarding the amounts and disclosures in the financial statements. Our audits also included evaluating the accounting principles used and significant estimates made by management, as well as evaluating the overall presentation of the financial statements. We believe that our audits provide a reasonable basis for our opinion.
/s/ Deloitte LLP
Chartered Professional Accountants
Vancouver, Canada
August 23, 2023
We have served as the Company's auditor since 2004.
New Pacific Metals Corp.
Consolidated Statements of Financial Position
(Expressed in US dollars)
| Notes | June 30, 2023 | June 30, 2022 | ||||||||||
| ASSETS | ||||||||||||
| Current Assets | ||||||||||||
| Cash | $ | $ | ||||||||||
| Short-term investments | 3 | |||||||||||
| Receivables | ||||||||||||
| Deposits and prepayments | ||||||||||||
| Non-current Assets | ||||||||||||
| Other tax receivable | 4 | |||||||||||
| Equity investments | 5 | |||||||||||
| Plant and equipment | 7 | |||||||||||
| Mineral property interests | 8 | |||||||||||
| TOTAL ASSETS | $ | $ | ||||||||||
| LIABILITIES AND EQUITY | ||||||||||||
| Current Liabilities | ||||||||||||
| Accounts payable and accrued liabilities | 9 | $ | $ | |||||||||
| Due to a related party | 10 | |||||||||||
| Total Liabilities | ||||||||||||
| Equity | ||||||||||||
| Share capital | 11 | |||||||||||
| Share-based payment reserve | ||||||||||||
| Accumulated other comprehensive income | ||||||||||||
| Deficit | ( | ) | ( | ) | ||||||||
| Total equity attributable to the equity holders of the Company | ||||||||||||
| Non-controlling interests | 12 | ( | ) | ( | ) | |||||||
| Total Equity | ||||||||||||
| TOTAL LIABILITIES AND EQUITY | $ | $ | ||||||||||
| Approved on behalf of the Board: | |
| (Signed) Maria Tang | |
| Director | |
| (Signed) Rui Feng | |
| Director |
See accompanying notes to the consolidated financial statements
Page | 1
New Pacific Metals Corp.
Consolidated Statements of Loss
(Expressed in US dollars)
| Years Ended June 30, | ||||||||||||
| Notes | 2023 | 2022 | ||||||||||
| Operating expense | ||||||||||||
| Project evaluation and corporate development | $ | ( | ) | $ | ( | ) | ||||||
| Depreciation | ( | ) | ( | ) | ||||||||
| Filing and listing | ( | ) | ( | ) | ||||||||
| Investor relations | ( | ) | ( | ) | ||||||||
| Professional fees | ( | ) | ( | ) | ||||||||
| Salaries and benefits | ( | ) | ( | ) | ||||||||
| Office and administration | ( | ) | ( | ) | ||||||||
| Share-based compensation | 11(b) | ( | ) | ( | ) | |||||||
| ( | ) | ( | ) | |||||||||
| Other income (expense) | ||||||||||||
| Net income from investments | 6 | $ | $ | |||||||||
| Loss on disposal of plant and equipment | 7 | ( | ) | |||||||||
| Loss on disposal of mineral property interest | 8(d) | ( | ) | |||||||||
| Foreign exchange (loss) gain | ( | ) | ||||||||||
| Net loss | $ | ( | ) | $ | ( | ) | ||||||
| Attributable to: | ||||||||||||
| Equity holders of the Company | $ | ( | ) | $ | ( | ) | ||||||
| Non-controlling interests | 12 | ( | ) | ( | ) | |||||||
| Net loss | $ | ( | ) | $ | ( | ) | ||||||
| Loss per share attributable to the equity holders of the Company | ||||||||||||
| 11(d) | $ | ( | ) | $ | ( | ) | ||||||
| 11(d) | ||||||||||||
See accompanying notes to the consolidated financial statements
Page | 2
New Pacific Metals Corp.
Consolidated Statements of Comprehensive Loss
(Expressed in US dollars)
| Years Ended June 30, | ||||||||||||
| Notes | 2023 | 2022 | ||||||||||
| Net loss | $ | ( | ) | $ | ( | ) | ||||||
| Other comprehensive loss, net of taxes: | ||||||||||||
| Items that may subsequently be reclassified to net income or loss: | ||||||||||||
| Currency translation adjustment, net of tax of $ | ( | ) | ( | ) | ||||||||
| Other comprehensive loss, net of taxes | $ | ( | ) | $ | ( | ) | ||||||
| Attributable to: | ||||||||||||
| Equity holders of the Company | $ | ( | ) | $ | ( | ) | ||||||
| Non-controlling interests | 12 | ( | ) | ( | ) | |||||||
| Other comprehensive loss, net of taxes | $ | ( | ) | $ | ( | ) | ||||||
| Total comprehensive loss, net of taxes | $ | ( | ) | $ | ( | ) | ||||||
| Attributable to: | ||||||||||||
| Equity holders of the Company | $ | ( | ) | $ | ( | ) | ||||||
| Non-controlling interests | ( | ) | ( | ) | ||||||||
| Total comprehensive loss, net of taxes | $ | ( | ) | $ | ( | ) | ||||||
See accompanying notes to the consolidated financial statements
Page | 3
New Pacific Metals Corp.
Consolidated Statements of Cash Flows
(Expressed in US dollars)
| Years Ended June 30, | ||||||||||||
| Notes | 2023 | 2022 | ||||||||||
| Operating activities | ||||||||||||
| Net loss | $ | ( | ) | $ | ( | ) | ||||||
| Add (deduct) items not affecting cash: | ||||||||||||
| Net income from investments | 6 | ( | ) | ( | ) | |||||||
| Depreciation | ||||||||||||
| Loss on disposal of mineral property interest | 8(d) | - | ||||||||||
| Loss on disposal of plant and equipment | 7 | - | ||||||||||
| Share-based compensation | 11(b) | |||||||||||
| Unrealized foreign exchange loss (gain) | ( | ) | ||||||||||
| Changes in non-cash operating working capital | 17 | ( | ) | |||||||||
| Interest received | ||||||||||||
| Net cash used in operating activities | ( | ) | ( | ) | ||||||||
| Investing activities | ||||||||||||
| Mineral property interest | ||||||||||||
| Capital expenditures | ( | ) | ( | ) | ||||||||
| Proceeds on disposals | - | |||||||||||
| Plant and equipment | ||||||||||||
| Additions | ( | ) | ( | ) | ||||||||
| Proceeds on disposals | 7 | |||||||||||
| Changes in other tax receivable | ( | ) | ( | ) | ||||||||
| Net cash used in investing activities | ( | ) | ( | ) | ||||||||
| Financing activities | ||||||||||||
| Proceeds from issuance of common shares | ||||||||||||
| Net cash provided by financing activities | ||||||||||||
| Effect of exchange rate changes on cash | ( | ) | ( | ) | ||||||||
| Decrease in cash | ( | ) | ( | ) | ||||||||
| Cash, beginning of the year | ||||||||||||
| Cash, end of the year | $ | $ | ||||||||||
| Supplementary cash flow information | 17 | |||||||||||
See accompanying notes to the consolidated financial statements
Page | 4
New Pacific Metals Corp. Consolidated Statements of Changes in Equity |
| (Expressed in US dollars) |
| Share capital | Total equity | |||||||||||||||||||||||||||||||||
| Accumulated | attributable | |||||||||||||||||||||||||||||||||
| Number of | Share-based | other | to the equity | Non- | ||||||||||||||||||||||||||||||
| common | payment | comprehensive | holders of | controlling | ||||||||||||||||||||||||||||||
| Notes | shares issued | Amount | reserve | income | Deficit | the Company | interests | Total equity | ||||||||||||||||||||||||||
| Balance, July 1, 2021 | $ | $ | $ | $ | ( | ) | $ | $ | ( | ) | $ | |||||||||||||||||||||||
| Options exercised | ( | ) | ||||||||||||||||||||||||||||||||
| Restricted share units distributed | ( | ) | ||||||||||||||||||||||||||||||||
| Share-based compensation | - | |||||||||||||||||||||||||||||||||
| Net loss | - | ( | ) | ( | ) | ( | ) | ( | ) | |||||||||||||||||||||||||
| Currency translation adjustment | - | ( | ) | ( | ) | ( | ) | ( | ) | |||||||||||||||||||||||||
| Balance, June 30, 2022 | $ | $ | $ | $ | ( | ) | $ | $ | ( | ) | $ | |||||||||||||||||||||||
| Options exercised | 11(b)(i) | ( | ) | |||||||||||||||||||||||||||||||
| Restricted share units distributed | 11(b)(ii) | ( | ) | |||||||||||||||||||||||||||||||
| Private placement | 11(c) | |||||||||||||||||||||||||||||||||
| Share-based compensation | 11(b) | - | ||||||||||||||||||||||||||||||||
| Net loss | - | ( | ) | ( | ) | ( | ) | ( | ) | |||||||||||||||||||||||||
| Currency translation adjustment | - | ( | ) | ( | ) | ( | ) | ( | ) | |||||||||||||||||||||||||
| Balance, June 30, 2023 | $ | $ | $ | $ | ( | ) | $ | $ | ( | ) | $ | |||||||||||||||||||||||
See accompanying notes to the consolidated financial statements
Page | 5
| New
Pacific Metals Corp. Notes to the Consolidated Financial Statements |
| (Expressed in US dollars) |
1. CORPORATE INFORMATION
New Pacific Metals Corp. along with its subsidiaries (collectively, the “Company” or “New Pacific”) is a Canadian mining issuer engaged in exploring and developing mineral properties in Bolivia. The Company is in the stage of exploring and advancing the development of its mineral properties and has not yet determined if they contain economically recoverable mineral reserves. The underlying value and the recoverability of the amounts shown for mineral property interests are entirely dependent upon the existence of recoverable mineral reserves, the ability of the Company to obtain the necessary financing to complete the exploration and development of the mineral properties, and future profitable production or proceeds from the disposition of the mineral property interests.
The Company is publicly listed on the Toronto Stock Exchange (“TSX”) under the symbol “NUAG” and on the NYSE American stock exchange (“NYSE-A”) under the symbol “NEWP”. The head office, registered address and records office of the Company are located at 1066 Hastings Street, Suite 1750, Vancouver, British Columbia, Canada, V6E 3X1.
2. SIGNIFICANT ACCOUNTING POLICIES
(a) Statement of Compliance
These consolidated financial statements have been prepared in accordance with International Financial Reporting Standards as issued by the International Accounting Standards Board (“IFRS”). The policies applied in these consolidated financial statements are based on IFRS in effect as of June 30, 2023.
These consolidated financial statements have been prepared on a going concern basis.
The consolidated financial statements of the Company as at and for the year ended June 30, 2023 were authorized for issue in accordance with a resolution of the Board of Directors (the “Board”) dated on August 23, 2023.
(b) Basis of Consolidation
These consolidated financial statements include the accounts of the Company and its wholly or partially owned subsidiaries.
Subsidiaries are consolidated from the date on which the Company obtains control up to the date of the disposition of control. Control is achieved when the Company has power over the subsidiary, is exposed or has rights to variable returns from its involvement with the subsidiary; and has the ability to use its power to affect its returns. For non-wholly-owned subsidiaries over which the Company has control, the net assets attributable to outside equity shareholders are presented as “non-controlling interests” in the equity section of the consolidated statements of financial position. Net income or loss for the period that is attributable to the non-controlling interests is calculated based on the ownership of the non-controlling interest shareholders in the subsidiary.
Balances, transactions, income and expenses between the Company and its subsidiaries are eliminated on consolidation.
Page | 6
| New
Pacific Metals Corp. Notes to the Consolidated Financial Statements |
| (Expressed in US dollars) |
| Proportion of ownership interest held | ||||||||||
| Name of subsidiaries | Principal activity | Country of incorporation | June 30, 2023 | June 30, 2022 | Mineral properties | |||||
| New Pacific Offshore Inc. | ||||||||||
| SKN Nickel & Platinum Ltd. | ||||||||||
| Glory Metals Investment Corp. Limited | ||||||||||
| New Pacific Investment Corp. Limited | ||||||||||
| New Pacific Andes Corp. Limited | ||||||||||
| Fortress Mining Inc. | ||||||||||
| New Pacific Success Inc. | ||||||||||
| New Pacific Forward Inc. | ||||||||||
| Minera Alcira S.A. | ||||||||||
| NPM Minerales S.A. | ||||||||||
| Colquehuasi S.R.L. | ||||||||||
| Minera Hastings S.R.L. | ||||||||||
| Qinghai Found Mining Co., Ltd. | ||||||||||
| (i) British Virgin Islands (“BVI”) | ||||||||||
(c) Foreign Currency Translation
The functional currency for each subsidiary of the Company is the currency of the primary economic environment in which the entity operates. The functional currency of the head office, Canadian subsidiaries and all intermediate holding companies is the Canadian dollar (“CAD”). The functional currency of all Bolivian subsidiaries is the US dollar (“USD”). The functional currency of the Chinese subsidiary is the Chinese Renminbi (“RMB”).
Foreign currency monetary assets and liabilities are translated into the functional currency using exchange rates prevailing at the balance sheet date. Foreign currency non-monetary assets are translated using exchange rates prevailing at the transaction date. Foreign exchange gains and losses are included in the determination of net income.
The consolidated financial statements are presented in USD. The financial position and results of the Company’s entities are translated from functional currencies to USD as follows:
| - | assets and liabilities are translated using exchange rates prevailing at the reporting date; |
| - | income and expenses are translated using average exchange rates prevailing during the period; and |
| - | all resulting exchange gains or losses are included in other comprehensive income or loss. |
The Company treats inter-company loan balances, which are not intended to be repaid in the foreseeable future, as part of its net investment. When a foreign entity is sold, the historical exchange differences plus the foreign exchange impact that arises on the transaction are recognized in the consolidated statement of loss as part of the gain or loss on sale.
Page | 7
| New
Pacific Metals Corp. Notes to the Consolidated Financial Statements |
| (Expressed in US dollars) |
(d) Plant and Equipment
Plant and equipment are initially
recorded at cost, including all directly attributable costs to bring the assets to the location and condition necessary for it to be capable
of operating in the manner intended by management. Plant and equipment are subsequently measured at cost less accumulated depreciation
and applicable impairment losses.
| Land | |
| Buildings | |
| Machinery | |
| Motor vehicles | |
| Office equipment and furniture | |
| Computer software |
Subsequent costs that meet the asset recognition criteria are capitalized while costs incurred that do not extend the economic useful life of an asset are considered repair and maintenance, which are accounted for as an expense recognized during the period. The Company conducts an annual assessment of the residual balances, useful lives, and depreciation methods being used for plant and equipment and any changes are applied prospectively.
Assets under construction are capitalized as construction-in-progress. The cost of construction-in-progress comprises its purchase price and any costs directly attributable to bringing it into working condition for its intended use. Construction-in-progress assets are not depreciated until they are completed and available for use.
(e) Mineral Property Interests
The cost of acquiring mineral rights and properties either as an individual asset purchase or as part of a business combination is capitalized and represents the property’s fair value at the date of acquisition. Fair value is determined by estimating the value of the property’s reserves, resources and exploration potential.
Exploration and evaluation costs, incurred associated with specific mineral rights and properties prior to demonstrable technical feasibility and commercial viability of extracting a mineral resource, are capitalized.
The Company determines that a property is in the development stage when its technical feasibility and commercial viability are demonstrable. Costs incurred in the development stage prior to commercial production are capitalized and included in the carrying amount of the related property in the period incurred. Proceeds from sales during this period, if any, are offset against costs capitalized.
(f) Impairment of Long-lived Assets
Long-lived assets, including mineral property interests, plant and equipment are reviewed and tested for impairment when indicators of impairment are considered to exist. Impairment assessments are conducted at the level of cash-generating units (“CGU”) or at the individual asset level, whichever is the lowest level for which identifiable cash inflows are largely independent of the cash flows of other assets. An impairment loss is recognized for any excess of carrying amount of a CGU over its recoverable amount, which is the greater of its fair value less costs to sell and value in use. For mineral properties, the recoverable amount is estimated as the discounted future net cash inflows expected to be derived from expected future
Page | 8
| New
Pacific Metals Corp. Notes to the Consolidated Financial Statements |
| (Expressed in US dollars) |
production, metal prices, and net proceeds from the disposition of assets on retirement, less operating and capital costs. Impairment losses are recognized in the period they are incurred.
For exploration and evaluation assets, indication of impairment includes but is not limited to expiration of the right to explore, substantive expenditures in the specific area are neither budgeted nor planned, and exploration for and evaluation of mineral resources in the specific area have not led to the discovery of commercially viable quantities of mineral resources.
Impairment losses are reversed if there is evidence the loss no longer exists or has decreased. This reversal is recognized in net income in the period the reversal occurs limited by the carrying value that would have been determined, net of any depreciation, had no impairment charge been recognized in prior years.
(g) Share-based Payments
The Company grants share-based awards, including restricted share units (“RSUs”) and stock options to directors, officers, employees, and consultants.
For share-based awards, the fair value is charged to the consolidated statements of loss and credited to equity, on a straight-line basis over the vesting period, after adjusting for the estimated number of awards that are expected to vest. The fair value of share units is determined based on quoted market price of the Company’s common shares at the date of grant. The fair value of the stock options granted to employees, officers, and directors is determined at the date of grant using the Black-Scholes option pricing model with market related input. The fair value of stock options granted to consultants is measured at the fair value of the services delivered unless that fair value cannot be estimated reliably, which then is determined using the Black-Scholes option pricing model. Stock options with graded vesting schedules are accounted for as separate grants with different vesting periods and fair values.
At each statement of financial position date prior to vesting, the cumulative expense representing the extent to which the vesting period has expired and management’s best estimate of the awards that are ultimately expected to vest is computed. The movement in cumulative expense is recognized in the consolidated statements of loss with a corresponding entry within equity. The amount recognized as expense is adjusted to reflect the number of awards for which the related service and non-market vesting conditions are expected to be met.
(h) Income Taxes
Current tax for each taxable entity is based on the local taxable income at the local substantively enacted statutory tax rate at the balance sheet date and includes adjustments to taxes payable or recoverable in respect to previous periods.
Current tax assets and current tax liabilities are only offset if a legally enforceable right exists to set off the amounts, and the Company intends to settle on a net basis, or to realize the asset and settle the liability simultaneously.
Deferred tax is recognized using the liability method on temporary differences at the reporting date between the tax bases of assets and liabilities, and their carrying amounts for financial reporting purposes. Deferred tax assets are recognized for all deductible temporary differences, carry forward of unused tax credits and unused tax losses, to the extent that it is probable that taxable profit will be available against which the deductible temporary differences, and the carry forward of unused tax credits and unused tax losses, can be utilized, except:
Page | 9
| New
Pacific Metals Corp. Notes to the Consolidated Financial Statements |
| (Expressed in US dollars) |
| - | where the deferred tax asset or liability relating to the deductible temporary difference arises from the initial recognition of an asset or liability in a transaction that is not a business combination and, at the time of the transaction, affects neither the accounting profit nor taxable profit or loss; and |
| - | in respect of deductible temporary differences associated with investments in subsidiaries, associates and interests in joint ventures, deferred tax assets are recognized only to the extent that it is probable that the temporary differences will reverse in the foreseeable future and taxable profit will be available against which the temporary differences can be utilized. |
The carrying amount of deferred tax assets is reviewed at the end of each reporting period and reduced to the extent that it is no longer probable that sufficient taxable profit will be available to allow all or part of the deferred tax asset to be utilized. Unrecognized deferred tax assets are reassessed at the end of each reporting period and are recognized to the extent that it has become probable that future taxable profit will be available to allow the deferred tax asset to be recovered.
Deferred tax assets and liabilities are measured at the tax rates that are expected to apply to the year when the asset is realized or the liability is settled, based on tax rates and tax laws that have been substantively enacted by the end of the reporting period.
Deferred tax relating to items recognized outside profit or loss is recognized in other comprehensive income or directly in equity.
Deferred tax assets and deferred tax liabilities are offset, if a legally enforceable right exists to set off current tax assets against current tax liabilities and the deferred taxes relate to the same taxable entity and the same taxation authority.
(i) Earnings (loss) per Share
Earnings (loss) per share is computed by dividing net income (loss) attributable to equity holders of the Company by the weighted average number of common shares outstanding for the period. Diluted earnings per share reflect the potential dilution that could occur if additional common shares are assumed to be issued under securities that entitle their holders to obtain common shares in the future. For vested RSUs, the full outstanding numbers as at the end of the period are included in the calculation of diluted earnings per share. For stock options, the number of additional shares for inclusion in diluted earnings per share calculations is determined when the exercise price is less than the average market price of the Company’s common shares; the stock options are assumed to be exercised and the proceeds are used to repurchase common shares at the average market price for the period. The incremental number of common shares issued under stock options and repurchased from proceeds is included in the calculation of diluted earnings per share. When loss per share is presented in the period, the Company’s calculation of diluted loss per share excludes any incremental shares from the assumed calculation of RSUs and stock options as they would be anti-dilutive.
(j) Financial Instruments
Initial recognition:
On initial recognition, all financial assets and financial liabilities are recorded at fair value adjusted for directly attributable transaction costs except for financial assets and liabilities classified as fair value through profit or loss (“FVTPL”), in which case transaction costs are expensed as incurred.
Subsequent measurement of financial assets:
Subsequent measurement of financial assets depends on the classification of such assets.
Page | 10
New Pacific Metals Corp.
Notes to the Consolidated Financial Statements
(Expressed in US dollars)
| I. | Non-equity instruments: |
IFRS 9 includes a single model that has only two classification categories for financial instruments other than equity instruments: amortized cost and fair value. To qualify for amortized cost accounting, the instrument must meet two criteria:
| i. | The objective of the business model is to hold the financial asset for the collection of the cash flows; and |
| ii. | All contractual cash flows represent only principal and interest on that principal. |
| All other instruments are mandatorily measured at fair value. | ||
| II. | Equity instruments: |
At initial recognition, for equity instruments other than held for trading, the Company may make an irrevocable election to designate it as either FVTPL or fair value through other comprehensive income (“FVTOCI”).
Financial assets classified as amortized cost are measured using the effective interest method. Amortized cost is calculated by taking into account any discount or premiums on acquisition and fees that are an integral part of the effective interest method. Amortization from the effective interest method is included in finance income.
Financial assets classified as FVTPL are measured at fair value with changes in fair values recognized in profit or loss.
Impairment of financial assets carried at amortized cost:
The Company assesses at the end of each reporting period whether there is objective evidence that financial assets or group of financial assets measured at amortized cost are impaired. Impairment losses and reversal of impairment losses, if any, are recognized in profit or loss in the period they are incurred.
Subsequent measurement of financial liabilities:
Financial liabilities classified as amortized cost are measured using the effective interest method. Amortized cost is calculated by taking into account any discount or premiums on acquisition and fees that are an integral part of the effective interest method. Amortization using the effective interest method is included in finance costs.
The Company classifies its financial instruments as follows:
| - | Financial assets classified as FVTPL: cash, short-term investments – bonds, and equity investments; |
| - | Financial assets classified as amortized cost: receivables and short-term investments – guaranteed investment certificates; and |
| - | Financial liabilities classified as amortized cost: trade and other payables, and due to related parties. |
Bonds:
The Company acquired bonds issued by other companies from various industries through the open market. These bonds are held to receive coupon interest payments and to realize potential gains. The bonds may also be disposed on demand through the open market should the Company require funds for other operational or investment needs. Bonds are classified as FVTPL and are measured at fair value on initial recognition and subsequent measurement.
Equity investments:
Equity investments represent equity interests of other publicly-traded or privately-held companies that the Company has acquired through the open market or through private placements. These equity interests consist of common shares and warrants. Equity investments are classified as FVTPL and are measured at
Page | 11
New Pacific Metals Corp.
Notes to the Consolidated Financial Statements
(Expressed in US dollars)
fair value on initial recognition and subsequent measurement. The fair value of warrants was determined using the Black-Scholes pricing model as at the acquisition date as well as at each period end.
Derecognition of financial assets and financial liabilities:
A financial asset is derecognized when:
| - | The rights to receive cash flows from the asset have expired; or |
| - | The Company has transferred its rights to receive cash flows from the asset or has assumed an obligation to pay the received cash flows in full without material delay to a third party under a ‘pass-through’ arrangement; and either (a) the Company has transferred substantially all the risks and rewards of the asset, or (b) the Company has neither transferred nor retained substantially all the risks and rewards of the asset, but has transferred control of the asset. |
Gains and losses on derecognition of financial assets and liabilities classified as amortized cost are recognized in profit or loss when the instrument is derecognized or impaired, as well as through the amortization process.
A financial liability is derecognized when the obligation under the liability is discharged or cancelled or expires. When an existing financial liability is replaced by another from the same lender on substantially different terms, or the terms of an existing liability are substantially modified, such an exchange or modification is treated as a derecognition of the original liability. In this case, a new liability is recognized, and the difference in the respective carrying amounts is recognized in the consolidated statement of income.
Offsetting of financial instruments:
Financial assets and liabilities are offset and the net amount is reported in the consolidated statement of financial position if and only if, there is a currently enforceable legal right to offset the recognized amounts and there is an intention to settle on a net basis, or to realize the assets and settle liabilities simultaneously.
Fair value of financial instruments:
The fair value of financial instruments that are traded in active markets at each reporting date is determined by reference to quoted market prices, without deduction for transaction costs. For financial instruments that are not traded in active markets, the fair value is determined using appropriate valuation techniques, such as using a recent arm’s length market transaction between knowledgeable and willing parties, discounted cash flow analysis, reference to the current fair value of another instrument that is substantially the same, or other valuation models.
| (k) | Significant Judgments and Estimation Uncertainties |
Many amounts included in the consolidated financial statements require management to make judgments and/or estimates. These judgments and estimates are continuously evaluated and are based on management’s experience and knowledge of relevant facts and circumstances. Actual results may differ from the amounts included in the consolidated statement of financial position.
Areas of significant judgment include:
| - | Capitalization of expenditures with respect to exploration, evaluation and development costs to be included in mineral rights and properties; |
| - | Determination of functional currency; |
| - | Recognition, measurement and impairment or impairment reversal assessment for mineral rights and properties; and |
| - | Accounting assessment and classification for equity investments and short-term investments. |
Page | 12
New Pacific Metals Corp.
Notes to the Consolidated Financial Statements
(Expressed in US dollars)
Areas of significant estimates include:
| - | The estimated fair values of CGUs for impairment or impairment reversal tests, including estimates of future costs to produce proven and probable reserves, future commodity prices, discount rates, probabilities of expected cash flows from disposal and salvage value of plant and equipment; |
| - | Valuation input and forfeiture rates used in calculation of share-based compensation; and |
| - | Valuation of securities that do not have a quoted market price. |
The Company estimates its mineral resources based on information compiled by qualified persons as defined in accordance with National Instrument 43-101.
3. SHORT-TERM INVESTMENTS
| June 30, 2023 | June 30, 2022 | |||||||
| Bonds | $ | $ | ||||||
The Company acquired bonds issued by other corporations from various industries through the open market. These bonds were held to receive coupon interest payments and to realize potential gains. The bonds may also be disposed on demand through the open market should the Company require funds for operational or investment needs. The Company accounts for the bonds at fair value at each reporting date.
| Amount | ||||
| Balance, July 1, 2021 | $ | |||
| Gain on fair value change | ||||
| Balance, June 30, 2022 | $ | |||
| Gain on fair value change | ||||
| Balance, June 30, 2023 | $ | |||
4. OTHER TAX RECEIVABLE
Other tax receivable is composed of value-added tax (“VAT”) imposed by the Bolivian government. The Company had VAT outputs through its exploration costs and general expenses incurred in Bolivia. These VAT outputs are deductible against future VAT inputs that will be generated through sales.
5. EQUITY INVESTMENTS
| June 30, 2023 | June 30, 2022 | |||||||
| Common shares | ||||||||
| Public companies | $ | $ | ||||||
| $ | $ | |||||||
Page | 13
|
New Pacific Metals Corp. |
| (Expressed in US dollars) |
| Accumulated mark-to- | ||||||||
| market gain included | ||||||||
| Fair value | in deficit | |||||||
| Balance, July 1, 2022 | $ | $ | ||||||
| Change in fair value | ||||||||
| Foreign exchange impact | ( | ) | ||||||
| Balance, June 30, 2022 | $ | $ | ||||||
| Change in fair value | ( | ) | ( | ) | ||||
| Foreign exchange impact | ( | ) | ||||||
| Balance, June 30, 2023 | $ | $ | ||||||
6. INCOME FROM INVESTMENTS
| Years Ended June 30, | ||||||||
| 2023 | 2022 | |||||||
| Fair value change on equity investments | $ | ( | ) | $ | ||||
| Fair value change on bonds | ||||||||
| Interest income | ||||||||
| Net income from investments | $ | $ | ||||||
7. PLANT AND EQUIPMENT
| Land and | Office equipment | Computer | ||||||||||||||||||||||
| Cost | building | Machinery | Motor vehicles | and furniture | software | Total | ||||||||||||||||||
| Balance, July 1, 2021 | $ | $ | $ | $ | $ | $ | ||||||||||||||||||
| Additions | ||||||||||||||||||||||||
| Disposals | ( | ) | ( | ) | ( | ) | ( | ) | ( | ) | ||||||||||||||
| Reclassifed among asset groups | ( | ) | ||||||||||||||||||||||
| Foreign currency translation impact | ( | ) | ( | ) | ( | ) | ||||||||||||||||||
| Balance, June 30, 2022 | $ | $ | $ | $ | $ | $ | ||||||||||||||||||
| Additions | ||||||||||||||||||||||||
| Disposals | ( | ) | ( | ) | ( | ) | ||||||||||||||||||
| Foreign currency translation impact | ( | ) | ( | ) | ( | ) | ||||||||||||||||||
| Balance, June 30, 2023 | $ | $ | $ | $ | $ | $ | ||||||||||||||||||
| Accumulated depreciation and amortization | ||||||||||||||||||||||||
| Balance, July 1, 2021 | $ | $ | ( | ) | $ | ( | ) | $ | ( | ) | $ | ( | ) | $ | ( | ) | ||||||||
| Depreciation | ( | ) | ( | ) | ( | ) | ( | ) | ( | ) | ||||||||||||||
| Disposals | ||||||||||||||||||||||||
| Foreign currency translation impact | ( | ) | ( | ) | ||||||||||||||||||||
| Balance, June 30, 2022 | $ | $ | ( | ) | $ | ( | ) | $ | ( | ) | $ | ( | ) | $ | ( | ) | ||||||||
| Depreciation | ( | ) | ( | ) | ( | ) | ( | ) | ( | ) | ||||||||||||||
| Disposals | ||||||||||||||||||||||||
| Foreign currency translation impact | ( | ) | ||||||||||||||||||||||
| Balance, June 30, 2023 | $ | $ | ( | ) | $ | ( | ) | $ | ( | ) | $ | ( | ) | $ | ( | ) | ||||||||
| Carrying amount | ||||||||||||||||||||||||
| Balance, June 30, 2022 | $ | $ | $ | $ | $ | $ | ||||||||||||||||||
| Balance, June 30, 2023 | $ | $ | $ | $ | $ | $ | ||||||||||||||||||
Page | 14
|
New Pacific Metals Corp. |
| (Expressed in US dollars) |
During
the year ended June 30, 2023, certain plant and equipment were disposed for proceeds of $ (year ended June 30, 2022, $
8. MINERAL PROPERTY INTERESTS
(a) Silver Sand Project
On
July 20, 2017, the Company acquired the Silver Sand Project. The Project is located in the Colavi District of the Potosí Department,
in Southwestern Bolivia,
For
the year ended June 30, 2023, total expenditures of $
(b) Carangas Project
In
April 2021, the Company signed an agreement with a private Bolivian company to acquire a
Under
the agreement, the Company is required to cover
For
the year ended June 30, 2023, total expenditures of $
(c) Silverstrike Project
In
December 2019, the Company acquired a
For
the year ended June 30, 2023, total expenditures of $
(d) RZY Project
The RZY Project, located in Qinghai, China was an early stage silver-lead-zinc exploration project. The RZY Project is located approximately 237 km from the city of Yushu Tibetan Autonomous Prefecture. In 2016, the Qinghai Government issued a moratorium which suspended exploration for 26 mining projects in the region, including the RZY Project, and classified the region as a National Nature Reserve Area.
During
Fiscal 2020, the Company’s subsidiary, Qinghai Found Mining Co., Ltd. (“Qinghai Found”), reached a compensation agreement
with the Qinghai Government for the RZY Project. Pursuant to the agreement, Qinghai Found will surrender its title to the RZY Project
to the Qinghai Government for one-time cash compensation of $
Page | 15
|
New Pacific Metals Corp. |
| (Expressed in US dollars) |
On
June 25, 2022, the Qinghai Government completed its approval process of the RZY compensation transaction. As a result, the Company
disposed its RZY Project for cash consideration of $
| Cost | Silver Sand | Silverstrike | Carangas | RZY Project | Total | |||||||||||||||
| Balance, July 1, 2021 | $ | $ | $ | $ | $ | |||||||||||||||
| Capitalized exploration expenditures | ||||||||||||||||||||
| Reporting and assessment | ||||||||||||||||||||
| Drilling and assaying | ||||||||||||||||||||
| Project management and support | ||||||||||||||||||||
| Camp service | ||||||||||||||||||||
| Geological surveys | ||||||||||||||||||||
| Permit and license | ||||||||||||||||||||
| Disposition | ( | ) | ( | ) | ||||||||||||||||
| Foreign currency impact | ( | ) | ( | ) | ( | ) | ( | ) | ||||||||||||
| Balance, June 30, 2022 | $ | $ | $ | $ | $ | |||||||||||||||
| Capitalized exploration expenditures | ||||||||||||||||||||
| Reporting and assessment | ||||||||||||||||||||
| Drilling and assaying | ||||||||||||||||||||
| Project management and support | ||||||||||||||||||||
| Camp service | ||||||||||||||||||||
| Permit and license | ||||||||||||||||||||
| Foreign currency impact | ( | ) | ( | ) | ( | ) | ( | ) | ||||||||||||
| Balance, June 30, 2023 | $ | $ | $ | $ | $ | |||||||||||||||
9. TRADE AND OTHER PAYABLES
| June 30, 2023 | June 30, 2022 | |||||||
| Trade payable | $ | $ | ||||||
| Accrued liabilities | ||||||||
| $ | $ | |||||||
10. RELATED PARTY TRANSACTIONS
| Due to a related party | June 30, 2023 | June 30, 2022 | ||||||
| Silvercorp Metals Inc. | $ | $ | ||||||
(a) Silvercorp Metals Inc. (“Silvercorp”) has one director and one officer (June 30, 2022 – two directors and one officer) in common with the Company. Silvercorp and the Company share office space and Silvercorp provides various general and administrative services to the Company. The Company expects to continue making payments to Silvercorp in the normal course of business. Office and administrative
Page | 16
New Pacific Metals Corp.
Notes to the Consolidated Financial Statements
(Expressed in US dollars)
expenses rendered and incurred by
Silvercorp on behalf of the Company for the year ended June 30, 2023 were $
During the year ended June 30, 2022,
the Company’s subsidiary Qinghai Found borrowed a loan of $
| (b) | Compensation of key management personnel |
| Years ended June 30, | ||||||||
| 2023 | 2022 | |||||||
| Director’s cash compensation | $ | $ | ||||||
| Director’s share-based compensation | ||||||||
| Key management’s cash compensation | ||||||||
| Key management’s share-based compensation | ||||||||
| $ | $ | |||||||
Other than as disclosed above, the Company does not have any ongoing contractual or other commitments resulting from transactions with related parties.
11. SHARE CAPITAL
| (a) | Share Capital - authorized share capital |
The Company’s authorized share capital consists of an unlimited number of common shares without par value.
| (b) | Share-based compensation |
The Company has a share-based compensation
plan (the “Plan”) under which the Company may issue stock options and restricted share units (“RSUs”). The maximum
number of common shares to be reserved for issuance on any share-based compensation under the Plan is a rolling
For the year ended June 30, 2023,
a total of $
For the year ended June 30, 2023,
a total of $
For the year ended June 30, 2023,
a total of $
Page | 17
New Pacific Metals Corp.
Notes to the Consolidated Financial Statements
(Expressed in US dollars)
| (i) | Stock options |
| Number of options | Weighted average exercise price (CAD$) | |||||||
| Balance, July 1, 2021 | ||||||||
| Options Granted | ||||||||
| Options exercised | ( | ) | ||||||
| Options forfeited | ( | ) | ||||||
| Balance, June 30, 2022 | ||||||||
| Options Granted | ||||||||
| Options exercised | ( | ) | ||||||
| Options forfeited | ( | ) | ||||||
| Balance, June 30, 2023 | ||||||||
During the year ended June 30, 2023,
| Years ended June 30, | ||||||||
| 2023 | 2022 | |||||||
| Risk free interest rate | % | % | ||||||
| Expected volatility | % | % | ||||||
| Expected life of options in years | ||||||||
| Estimated forfeiture rate | % | % | ||||||
The weighted average grant date
fair value of options granted during the year ended June 30, 2023, was CAD$
| Exercise | Number of options outstanding as at | Weighted average remaining | Number of options exercisable as at | Weighted average | ||||||||||||||
| prices (CAD$) | 2023-06-30 | contractual life (years) | 2023-06-30 | exercise price (CAD$) | ||||||||||||||
| $ | $ | |||||||||||||||||
| $ | $ | |||||||||||||||||
| $ | ||||||||||||||||||
| $ | ||||||||||||||||||
| $ | $ | |||||||||||||||||
| $ | ||||||||||||||||||
| $ | $ | |||||||||||||||||
| $ | $ | |||||||||||||||||
Page | 18
New Pacific Metals Corp.
Notes to the Consolidated Financial Statements
(Expressed in US dollars)
Subsequent to June 30, 2023, a total of
| (ii) | RSUs |
| Number of shares | Weighted average grant date closing price per share (CAD$) | |||||||
| Balance, July 1, 2021 | $ | | ||||||
| Granted | ||||||||
| Forfeited | ( | ) | ||||||
| Distributed | ( | ) | ||||||
| Balance, June 30, 2022 | $ | |||||||
| Granted | ||||||||
| Forfeited | ( | ) | ||||||
| Distributed | ( | ) | ||||||
| Balance, June 30, 2023 | $ | |||||||
During the year ended June 30, 2023,
Subsequent to June 30, 2023, a total
of
| (c) | Private placement |
On February 28, 2023, the Company
closed a private placement to issue a total of
| (d) | Loss per share |
| For the years ended June 30, | ||||||||||||||||||||||||
| 2023 | 2022 | |||||||||||||||||||||||
| Loss | Shares | Per-Share | Income | Shares | Per-Share | |||||||||||||||||||
| (Numerator) | (Denominator) | Amount | (Numerator) | (Denominator) | Amount | |||||||||||||||||||
| Net loss Attributable to equity holders of the Company | $ | ( | ) | $ | ( | ) | ||||||||||||||||||
| Basic loss per share | ( | ) | $ | ( | ) | ( | ) | $ | ( | ) | ||||||||||||||
| Effect of dilutive securities: | ||||||||||||||||||||||||
| Stock options and RSUs | ||||||||||||||||||||||||
| Diluted loss per share | $ | ( | ) | $ | ( | ) | $ | ( | ) | $ | ( | ) | ||||||||||||
Anti-dilutive options that are not included in the diluted loss per share calculation were for the year ended June 30, 2023 (year ended June 30, 2022 – ).
Page | 19
New Pacific Metals Corp.
Notes to the Consolidated Financial Statements
(Expressed in US dollars)
12. NON-CONTROLLING INTEREST
| Qinghai Found | ||||
| Balance, July 1, 2021 | $ | ( | ) | |
| Share of net loss | ( | ) | ||
| Share of other comprehensive loss | ( | ) | ||
| Balance, June 30, 2022 | $ | ( | ) | |
| Share of net loss | ( | ) | ||
| Share of other comprehensive loss | ( | ) | ||
| Balance, June 30, 2023 | $ | ( | ) | |
As at June 30, 2023 and June 30,
2022, the non-controlling interest in the Company’s subsidiary Qinghai Found was
13. FINANCIAL INSTRUMENTS
The Company manages its exposure to financial risks, including liquidity risk, foreign exchange rate risk, interest rate risk, credit risk, and equity price risk in accordance with its risk management framework. The Board of Directors has overall responsibility for the establishment and oversight of the Company’s risk management framework and reviews the Company’s policies on an ongoing basis.
| (a) | Fair Value |
The Company classifies its fair value measurements within a fair value hierarchy, which reflects the significance of inputs used in making the measurements as defined in IFRS 13 – Fair Value Measurement (“IFRS 13”).
Level 1 – Unadjusted quoted prices at the measurement date for identical assets or liabilities in active markets.
Level 2 – Observable inputs other than quoted prices included in Level 1, such as quoted prices for similar assets and liabilities in active markets; quoted prices for identical or similar assets and liabilities in markets that are not active; or other inputs that are observable or can be corroborated by observable market data.
Level 3 – Unobservable inputs which are supported by little or no market activity.
Page | 20
New Pacific Metals Corp.
Notes to the Consolidated Financial Statements
(Expressed in US dollars)
| Fair value as at June 30, 2023 | ||||||||||||||||
| Recurring measurements | Level 1 | Level 2 | Level 3 | Total | ||||||||||||
| Financial Assets | ||||||||||||||||
| Cash | $ | $ | - | $ | - | $ | ||||||||||
| Short-term investments | - | - | ||||||||||||||
| Equity investments | - | - | ||||||||||||||
| Fair value as at June 30, 2022 | ||||||||||||||||
| Recurring measurements | Level 1 | Level 2 | Level 3 | Total | ||||||||||||
| Financial Assets | ||||||||||||||||
| Cash | $ | $ | $ | $ | ||||||||||||
| Short-term investments | ||||||||||||||||
| Equity investments | ||||||||||||||||
Fair value of other financial instruments excluded from the table above approximates their carrying amount as of June 30, 2023, and June 30, 2022, respectively, due to the short-term nature of these instruments.
There were no transfers into or out of Level 3 during the year ended June 30, 2023.
| (b) | Liquidity Risk |
The Company has a history of losses
and no operating revenues from its operations. Liquidity risk is the risk that the Company will not be able to meet its short term business
requirements. As at June 30, 2023, the Company had a working capital position of $
In the normal course of business,
the Company enters into contracts that give rise to commitments for future minimum payments.
| June 30, 2023 | June 30, 2022 | |||||||||||
| Due within a year | Total | Total | ||||||||||
| Accounts payable and accrued liabilities | $ | $ | $ | |||||||||
| Due to a related party | ||||||||||||
| $ | $ | $ | ||||||||||
Page | 21
New Pacific Metals Corp.
Notes to the Consolidated Financial Statements
(Expressed in US dollars)
| (c) | Foreign Exchange Risk |
The Company is exposed to foreign
exchange risk when it undertakes transactions and holds assets and liabilities denominated in foreign currencies other than its functional
currencies. The functional currency of the head office, Canadian subsidiaries and all intermediate holding companies is CAD. The functional
currency of all Bolivian subsidiaries is USD. The functional currency of the Chinese subsidiary is RMB. The Company currently does not
engage in foreign exchange currency hedging.
| Financial assets denominated in foreign currencies other than | ||||||||
| relevant functional currency | As at June 30, 2023 | June 30, 2022 | ||||||
| United States dollars | $ | $ | ||||||
| Bolivianos | ||||||||
| Total | $ | $ | ||||||
| Financial liabilities denominated in foreign currencies other than | ||||||||
| relevant functional currency | ||||||||
| United States dollars | $ | $ | ||||||
| Bolivianos | ||||||||
| Total | $ | $ | ||||||
As at June 30, 2023, with other variables
unchanged, a
As at June 30, 2023, with other
variables unchanged, a
| (d) | Interest Rate Risk |
Interest rate risk is the risk that the fair value or future cash flows of a financial instrument will fluctuate due to changes in market interest rates. The Company holds a portion of cash in bank accounts that earn variable interest rates. Due to the short-term nature of these financial instruments, fluctuations in market rates do not have significant impact on the fair values of the financial instruments as of June 30, 2023. The Company, from time to time, also owns guaranteed investment certificates (“GICs”) and bonds that earn interest payments at fixed rates to maturity. Fluctuation in market interest rates usually will have an impact on bond’s fair value. An increase in market interest rates will generally reduce bond’s fair value while a decrease in market interest rates will generally increase it. The Company monitors market interest rate fluctuations closely and adjusts the investment portfolio accordingly.
| (e) | Credit Risk |
Credit risk is the risk of financial loss to the Company if the counterparty to a financial instrument fails to meet its contractual obligations. The Company’s exposure to credit risk is primarily associated with cash, bonds, and receivables. The carrying amount of financial assets included on the statement of financial position represents the maximum credit exposure.
The Company has deposits of cash that meet minimum requirements for quality and liquidity as stipulated by the Board. Management believes the risk of loss to be remote, as the majority of its cash are held with major financial institutions. Bonds by nature are exposed to more credit risk than cash. The Company manages its risk associated with bonds by only investing in large globally recognized corporations from
Page | 22
|
New Pacific Metals Corp. |
| (Expressed in US dollars) |
diversified industries. As at June
30, 2023, the Company had a receivables balance of $
| (f) | Equity Price Risk |
The Company holds certain marketable
securities that will fluctuate in value as a result of trading on global financial markets. Based upon the Company’s portfolio at
June 30, 2023, a
14. CAPITAL MANAGEMENT
The objectives of the capital management policy are to safeguard the Company’s ability to support exploration and operating requirements on an ongoing basis, continue the investment in high quality assets along with safeguarding the value of its mineral properties, and support any expansionary plans.
The capital of the Company consists of the items included in equity less cash and bonds. Risk and capital management are primarily the responsibility of the Company’s corporate finance function and is monitored by the Board. The Company manages the capital structure and makes adjustments depending on economic conditions. Significant risks are monitored and actions are taken, when necessary, according to the Company’s approved policies.
15. INCOME TAXES
| Years ended June 30, | ||||||||
| 2023 | 2022 | |||||||
| Canadian statutory tax rate | % | % | ||||||
| Loss before income taxes | $ | ( | ) | $ | ( | ) | ||
| Income tax recovery computed at Canadian statutory rates | ( | ) | ( | ) | ||||
| Foreign tax rates different from statutory rate | ( | ) | ||||||
| Permanent items and other | ||||||||
| Change in unrecognized deferred tax assets | ||||||||
| $ | $ | |||||||
Page | 23
|
New Pacific Metals Corp. |
| (Expressed in US dollars) |
Deferred tax assets are recognized
to the extent that the realization of the related tax benefit through future taxable profit is probable. The ability to realize the tax
benefits is dependent upon numerous factors, including the future profitability of operations in the jurisdiction in which the tax benefit
arise.
| June 30, 2023 | June 30, 2022 | |||||||
| Non-capital loss carry forward | $ | $ | ||||||
| Capital loss carry forward | ||||||||
| Plant and equipment | ||||||||
| Equity investments | ||||||||
| Share issuance cost | ||||||||
| $ | $ | |||||||
| Canada | Bolivia | China | ||||||||||
| 2023 | ||||||||||||
| 2024 | ||||||||||||
| 2026 | ||||||||||||
| 2027 | ||||||||||||
| 2028 | ||||||||||||
| 2032 | ||||||||||||
| 2033 | ||||||||||||
| 2041 | ||||||||||||
| 2042 | ||||||||||||
| 2043 | ||||||||||||
| $ | $ | $ | ||||||||||
As at June 30, 2023, the Company
had capital loss carry forward of $
16. SEGMENTED INFORMATION
As at and for the year ended June
30, 2023, the Company operates in
Effective July 1, 2022, the Company revised its reportable segments to reflect recent changes in the CODM’s way of reviewing and assessing the Company’s performance. As a result, the “Silver Sand”, “Carangas”, and “Silverstrike” mineral projects, which were previously included in the “Bolivia” segment, are separately presented. The previously presented “China” reportable segment is now being reported as part of the Corporate segment. The comparative information has been reclassified as a result of these changes.
Page | 24
|
New Pacific Metals Corp. |
| (Expressed in US dollars) |
| (a) |
| June 30, 2023 | ||||||||||||||||||||
| Exploration and Development | ||||||||||||||||||||
| Corporate | Silver Sand | Carangas | Silverstrike | Total | ||||||||||||||||
| Cash | $ | $ | $ | $ | $ | |||||||||||||||
| Short-term investments | ||||||||||||||||||||
| Equity investments | ||||||||||||||||||||
| Plant and equipment | ||||||||||||||||||||
| Mineral property interests | ||||||||||||||||||||
| Other assets | ||||||||||||||||||||
| Total Assets | $ | $ | $ | $ | $ | |||||||||||||||
| Total Liabilities | $ | ( | ) | $ | ( | ) | $ | ( | ) | $ | ( | ) | $ | ( | ) | |||||
| June 30, 2022 | ||||||||||||||||||||
| Exploration and Development | ||||||||||||||||||||
| Corporate | Silver Sand | Carangas | Silverstrike | Total | ||||||||||||||||
| Cash | $ | $ | $ | $ | $ | |||||||||||||||
| Short-term investments | ||||||||||||||||||||
| Equity investments | ||||||||||||||||||||
| Plant and equipment | ||||||||||||||||||||
| Mineral property interests | ||||||||||||||||||||
| Other assets | ||||||||||||||||||||
| Total Assets | $ | $ | $ | $ | $ | |||||||||||||||
| Total Liabilities | $ | ( | ) | $ | ( | ) | $ | ( | ) | $ | ( | ) | $ | ( | ) | |||||
Page | 25
|
New Pacific Metals Corp. |
| (Expressed in US dollars) |
| (b) |
| Year ended June 30, 2023 | ||||||||||||||||||||
| Exploration and Development | ||||||||||||||||||||
| Corporate | Silver Sand | Carangas | Silverstrike | Total | ||||||||||||||||
| Project evaluation and corporate development | $ | ( | ) | $ | $ | $ | ( | ) | ||||||||||||
| Salaries and benefits | ( | ) | ( | ) | ||||||||||||||||
| Share-based compensation | ( | ) | ( | ) | ||||||||||||||||
| Other operating expenses | ( | ) | ( | ) | ( | ) | ( | ) | ( | ) | ||||||||||
| Total operating expense | ( | ) | ( | ) | ( | ) | ( | ) | ( | ) | ||||||||||
| Net income from investments | ||||||||||||||||||||
| Foreign exchange (loss) gain | ( | ) | ( | ) | ||||||||||||||||
| Net loss | $ | ( | ) | $ | ( | ) | $ | ( | ) | $ | ( | ) | $ | ( | ) | |||||
| Attributed to: | ||||||||||||||||||||
| Equity holders of the Company | $ | ( | ) | $ | ( | ) | $ | ( | ) | $ | ( | ) | $ | ( | ) | |||||
| Non-controlling interests | ( | ) | ( | ) | ||||||||||||||||
| Net loss | $ | ( | ) | $ | ( | ) | $ | ( | ) | $ | ( | ) | $ | ( | ) | |||||
| Year ended June 30, 2022 | ||||||||||||||||||||
| Exploration and Development | ||||||||||||||||||||
| Corporate | Silver Sand | Carangas | Silverstrike | Total | ||||||||||||||||
| Project evaluation and corporate development | $ | ( | ) | $ | $ | $ | ( | ) | ||||||||||||
| Salaries and benefits | ( | ) | ( | ) | ||||||||||||||||
| Share-based compensation | ( | ) | ( | ) | ||||||||||||||||
| Other operating expenses | ( | ) | ( | ) | ( | ) | ( | ) | ( | ) | ||||||||||
| Total operating expense | ( | ) | ( | ) | ( | ) | ( | ) | ( | ) | ||||||||||
| Net income from investments | ||||||||||||||||||||
| Loss on disposal of plant and equipment | ( | ) | ( | ) | ||||||||||||||||
| Loss on disposal of mineral property interest | ( | ) | ( | ) | ||||||||||||||||
| Foreign exchange gain | ||||||||||||||||||||
| Net loss | $ | ( | ) | $ | ( | ) | $ | ( | ) | $ | ( | ) | $ | ( | ) | |||||
| Attributed to: | ||||||||||||||||||||
| Equity holders of the Company | $ | ( | ) | $ | ( | ) | $ | ( | ) | $ | ( | ) | $ | ( | ) | |||||
| Non-controlling interests | ( | ) | ( | ) | ||||||||||||||||
| Net loss | $ | ( | ) | $ | ( | ) | $ | ( | ) | $ | ( | ) | $ | ( | ) | |||||
Page | 26
|
New Pacific Metals Corp. |
| (Expressed in US dollars) |
17. SUPPLEMENTARY CASH FLOW INFORMATION
| Changes in non-cash operating working capital: | Years Ended June 30, | |||||||
| 2023 | 2022 | |||||||
| Receivables | $ | ( | ) | $ | ||||
| Deposits and prepayments | ( | ) | ||||||
| Accounts payable and accrued liabilities | ( | ) | ||||||
| Due to a related party | ( | ) | ||||||
| $ | ( | ) | $ | |||||
| Non-cash capital transactions: | Years Ended June 30, | |||||||
| 2023 | 2022 | |||||||
| Addition of capital expenditures of mineral property interest from deposits and prepayments | $ | $ | ||||||
| (Payment) addition of capital expenditures of mineral property interest in accounts payable and accrued liabilities | $ | ( | ) | $ | ||||
Page | 27
CERTIFICATION REQUIRED BY RULE 13a-14(a) OR RULE 15d-14(a), PURSUANT
TO SECTION 302 OF THE SARBANES-OXLEY ACT OF 2002
I, Andrew Williams, certify that:
1. I have reviewed this Annual Report on Form 40-F of New Pacific Metals Corp.;
2. Based on my knowledge, this report does not contain any untrue statement of a material fact or omit to state a material fact necessary to make the statements made, in light of the circumstances under which such statements were made, not misleading with respect to the period covered by this report;
3. Based on my knowledge, the financial statements, and other financial information included in this report, fairly present in all material respects the financial condition, results of operations and cash flows of the issuer as of, and for, the periods presented in this report;
4. The issuer’s other certifying officer and I are responsible for establishing and maintaining disclosure controls and procedures (as defined in Exchange Act Rules 13a-15(e) and 15d-15(e)) and internal control over financial reporting (as defined in Exchange Act Rules 13a-15(f) and 15d-15(f)) for the issuer and have:
(a) designed such disclosure controls and procedures, or caused such disclosure controls and procedures to be designed under our supervision, to ensure that material information relating to the issuer, including its consolidated subsidiaries, is made known to us by others within those entities, particularly during the period in which this report is being prepared;
(b) designed such internal control over financial reporting, or caused such internal control over financial reporting to be designed under our supervision, to provide reasonable assurance regarding the reliability of financial reporting and the preparation of financial statements for external purposes in accordance with generally accepted accounting principles;
(c) evaluated the effectiveness of the issuer’s disclosure controls and procedures and presented in this report our conclusions about the effectiveness of the disclosure controls and procedures, as of the end of the period covered by this report based on such evaluation; and
(d) disclosed in this report any change in the issuer’s internal control over financial reporting that occurred during the period covered by the annual report that has materially affected, or is reasonably likely to materially affect, the issuer’s internal control over financial reporting; and
5. The issuer’s other certifying officer and I have disclosed, based on our most recent evaluation of internal control over financial reporting, to the issuer’s auditors and the audit committee of the issuer’s board of directors (or persons performing the equivalent functions):
(a) all significant deficiencies and material weaknesses in the design or operation of internal control over financial reporting which are reasonably likely to adversely affect the issuer’s ability to record, process, summarize and report financial information; and
(b) any fraud, whether or not material, that involves management or other employees who have a significant role in the issuer’s internal control over financial reporting.
| Date: September 22, 2023 | /s/ "Andrew Williams" | |||
| Name: | Andrew Williams | |||
| Title: | Chief Executive Officer | |||
CERTIFICATION REQUIRED BY RULE 13a-14(a) OR RULE 15d-14(a), PURSUANT
TO SECTION 302 OF THE SARBANES-OXLEY ACT OF 2002
I, Jalen Yuan, certify that:
1. I have reviewed this Annual Report on Form 40-F of New Pacific Metals Corp.;
2. Based on my knowledge, this report does not contain any untrue statement of a material fact or omit to state a material fact necessary to make the statements made, in light of the circumstances under which such statements were made, not misleading with respect to the period covered by this report;
3. Based on my knowledge, the financial statements, and other financial information included in this report, fairly present in all material respects the financial condition, results of operations and cash flows of the issuer as of, and for, the periods presented in this report;
4. The issuer’s other certifying officer and I are responsible for establishing and maintaining disclosure controls and procedures (as defined in Exchange Act Rules 13a-15(e) and 15d-15(e)) and internal control over financial reporting (as defined in Exchange Act Rules 13a-15(f) and 15d-15(f)) for the issuer and have:
(a) designed such disclosure controls and procedures, or caused such disclosure controls and procedures to be designed under our supervision, to ensure that material information relating to the issuer, including its consolidated subsidiaries, is made known to us by others within those entities, particularly during the period in which this report is being prepared;
(b) designed such internal control over financial reporting, or caused such internal control over financial reporting to be designed under our supervision, to provide reasonable assurance regarding the reliability of financial reporting and the preparation of financial statements for external purposes in accordance with generally accepted accounting principles;
(c) evaluated the effectiveness of the issuer’s disclosure controls and procedures and presented in this report our conclusions about the effectiveness of the disclosure controls and procedures, as of the end of the period covered by this report based on such evaluation; and
(d) disclosed in this report any change in the issuer’s internal control over financial reporting that occurred during the period covered by the annual report that has materially affected, or is reasonably likely to materially affect, the issuer’s internal control over financial reporting; and
5. The issuer’s other certifying officer and I have disclosed, based on our most recent evaluation of internal control over financial reporting, to the issuer’s auditors and the audit committee of the issuer’s board of directors (or persons performing the equivalent functions):
(a) all significant deficiencies and material weaknesses in the design or operation of internal control over financial reporting which are reasonably likely to adversely affect the issuer’s ability to record, process, summarize and report financial information; and
(b) any fraud, whether or not material, that involves management or other employees who have a significant role in the issuer’s internal control over financial reporting.
| Date: September 22, 2023 | /s/ "Jalen Yuan" | |||
| Name: | Jalen Yuan | |||
| Title: | Chief Financial Officer | |||
CERTIFICATION PURSUANT TO 18 U.S.C. SECTION 1350,
AS ENACTED PURSUANT TO
SECTION 906 OF THE U.S. SARBANES-OXLEY ACT OF 2002
New Pacific Metals Corp. (the “Company”) is filing with the U.S. Securities and Exchange Commission on the date hereof, its Annual Report on Form 40-F for the fiscal year ended June 30, 2023 (the “Report”).
I, Andrew Williams, Chief Executive Officer of the Company, certify, pursuant to 18 U.S.C. section 1350, as enacted pursuant to section 906 of the U.S. Sarbanes-Oxley Act of 2002, that to the best of my knowledge:
| i. | the Report fully complies with the requirements of section 13(a) or 15(d) of the U.S. Securities Exchange Act of 1934; and | |
| ii. | the information contained in the Report fairly presents, in all material respects, the financial condition and results of operations of the Company. |
| Date: September 22, 2023 | |
| /s/ "Andrew Williams" | |
| Name: Andrew Williams | |
| Title: Chief Executive Officer |
CERTIFICATION PURSUANT TO 18 U.S.C. SECTION 1350,
AS ENACTED PURSUANT TO
SECTION 906 OF THE U.S. SARBANES-OXLEY ACT OF 2002
New Pacific Metals Corp. (the “Company”) is filing with the U.S. Securities and Exchange Commission on the date hereof, its Annual Report on Form 40-F for the fiscal year ended June 30, 2023 (the “Report”).
I, Jalen Yuan, Chief Financial Officer of the Company, certify, pursuant to 18 U.S.C. section 1350, as enacted pursuant to section 906 of the U.S. Sarbanes-Oxley Act of 2002, that, to the best of my knowledge:
| i. | the Report fully complies with the requirements of section 13(a) or 15(d) of the U.S. Securities Exchange Act of 1934; and | |
| ii. | the information contained in the Report fairly presents, in all material respects, the financial condition and results of operations of the Company. |
| Date: September 22, 2023 | |
| /s/ "Jalen Yuan" | |
| Name: Jalen Yuan | |
| Title: Chief Financial Officer |
CONSENT OF INDEPENDENT REGISTERED PUBLIC ACCOUNTING FIRM
We consent to the incorporation by reference in Registration Statement No. 333-273541 on Form F-10 and to the use of our report dated August 23, 2023 relating to the financial statements of New Pacific Metals Corp. appearing in this Annual Report on Form 40-F for the year ended June 30, 2023.
/s/ Deloitte LLP
Chartered Professional Accountants
Vancouver, Canada
September 22, 2023
CONSENT OF EXPERT
The undersigned hereby consents to the use of my name and references to, excerpts from, and summaries of the Technical Report titled “Silver Sand Deposit Preliminary Economic Assessment” dated February 16, 2023 (effective date November 30, 2022), which is included in, or incorporated by reference into, the:
Annual Report on Form 40-F of New Pacific Metals Corp. for the year ended June 30, 2023 being filed with the United States Securities and Exchange Commission; and
Registration Statement on Form F-10 (Registration No. 333-273541) of New Pacific Metals Corp.
| Dated: September 22, 2023 | |
| /s/ John Morton Shannon | |
| John Morton Shannon, P.Geo. |
CONSENT OF EXPERT
The undersigned hereby consents to the use of my name and references to, excerpts from, and summaries of the Technical Report titled “Silver Sand Deposit Preliminary Economic Assessment” dated February 16, 2023 (effective date November 30, 2022), which is included in, or incorporated by reference into, the:
Annual Report on Form 40-F of New Pacific Metals Corp. for the year ended June 30, 2023 being filed with the United States Securities and Exchange Commission; and
Registration Statement on Form F-10 (Registration No. 333-273541) of New Pacific Metals Corp.
| Dated: September 22, 2023 |
| /s/ Wayne Rogers |
| Wayne Rogers, P.Eng. |
CONSENT OF EXPERT
The undersigned hereby consents to the use of my name and references to, excerpts from, and summaries of the Technical Report titled “Silver Sand Deposit Preliminary Economic Assessment” dated February 16, 2023 (effective date November 30, 2022), which is included in, or incorporated by reference into, the:
Annual Report on Form 40-F of New Pacific Metals Corp. for the year ended June 30, 2023 being filed with the United States Securities and Exchange Commission; and
Registration Statement on Form F-10 (Registration No. 333-273541) of New Pacific Metals Corp.
Dated: September 22, 2023
/s/ Mo Molavi
Mo Molavi, P.Eng.
CONSENT OF EXPERT
The undersigned hereby consents to the use of my name and references to, excerpts from, and summaries of the Technical Report titled “Silver Sand Deposit Preliminary Economic Assessment” dated February 16, 2023 (effective date November 30, 2022), which is included in, or incorporated by reference into, the:
Annual Report on Form 40-F of New Pacific Metals Corp. for the year ended June 30, 2023 being filed with the United States Securities and Exchange Commission; and
Registration Statement on Form F-10 (Registration No. 333-273541) of New Pacific Metals Corp.
Dated: September 22, 2023
/s/ Andrew Holloway
Andrew Holloway, P.Eng.
CONSENT OF EXPERT
The undersigned hereby consents to the use of my name and references to, excerpts from, and summaries of the Technical Report titled “Silver Sand Deposit Preliminary Economic Assessment” dated February 16, 2023 (effective date November 30, 2022), which is included in, or incorporated by reference into, the:
Annual Report on Form 40-F of New Pacific Metals Corp. for the year ended June 30, 2023 being filed with the United States Securities and Exchange Commission; and
Registration Statement on Form F-10 (Registration No. 333-273541) of New Pacific Metals Corp.
Dated: September 22, 2023
/s/ Leon Botham
Leon Botham, P.Eng.
CONSENT OF EXPERT
The undersigned hereby consents to the use of my name and references to, excerpts from, and summaries of the Technical Report titled “Silver Sand Deposit Preliminary Economic Assessment” dated February 16, 2023 (effective date November 30, 2022), which is included in, or incorporated by reference into, the:
Annual Report on Form 40-F of New Pacific Metals Corp. for the year ended June 30, 2023 being filed with the United States Securities and Exchange Commission; and
Registration Statement on Form F-10 (Registration No. 333-273541) of New Pacific Metals Corp.
Dated: September 22, 2023
/s/ Dinara Nussipakynova
Dinara Nussipakynova, P.Geo.
CONSENT OF EXPERT
The undersigned hereby consents to the use of my name and references to, excerpts from, and summaries of the Technical Report titled “Carangas Silver-Gold Project – Department of Oruro, Bolivia – NI 43-101 Mineral Resource Estimate Technical Report” (effective date August 25, 2023), which is included in, or incorporated by reference into, the:
Annual Report on Form 40-F of New Pacific Metals Corp. for the year ended June 30, 2023 being filed with the United States Securities and Exchange Commission; and
Registration Statement on Form F-10 (Registration No. 333-273541) of New Pacific Metals Corp.
Dated: September 22, 2023
/s/ Anderson Goncalves Candido
Anderson Goncalves Candido, FAusIMM
CONSENT OF EXPERT
The undersigned hereby consents to the use of my name and references to, excerpts from, and summaries of the Technical Report titled “Carangas Silver-Gold Project – Department of Oruro, Bolivia – NI 43-101 Mineral Resource Estimate Technical Report” (effective date August 25, 2023), which is included in, or incorporated by reference into, the:
Annual Report on Form 40-F of New Pacific Metals Corp. for the year ended June 30, 2023 being filed with the United States Securities and Exchange Commission; and
Registration Statement on Form F-10 (Registration No. 333-273541) of New Pacific Metals Corp.
Dated: September 22, 2023
/s/ Marcelo del Giudice
Marcelo del Giudice, FAusIMM
CONSENT OF ALEX ZHANG
I hereby consent to the use of my name and information attributed to me included or incorporated by reference in the Annual Report on Form 40-F for the year ended June 30, 2023 of New Pacific Metals Corp. and the Registration Statement on Form F-10 (Registration No. 333-273541) of New Pacific Metals Corp. being filed with the United States Securities and Exchange Commission.
Dated: September 22, 2023
/s/ Alex Zhang
Alex Zhang, P.Geo
Consolidated Statements of Financial Position - USD ($) |
Jun. 30, 2023 |
Jun. 30, 2022 |
|---|---|---|
| Current Assets | ||
| Cash | $ 6,296,312 | $ 29,322,504 |
| Short-term investments | 198,375 | 192,398 |
| Receivables | 421,860 | 3,193,926 |
| Deposits and prepayments | 631,402 | 479,266 |
| Current Assets | 7,547,949 | 33,188,094 |
| Non-current Assets | ||
| Other tax receivable | 5,530,422 | 3,631,796 |
| Equity investments | 283,081 | 496,741 |
| Plant and equipment | 1,339,839 | 1,462,848 |
| Mineral property interests | 103,606,250 | 85,298,776 |
| TOTAL ASSETS | 118,307,541 | 124,078,255 |
| Current Liabilities | ||
| Accounts payable and accrued liabilities | 2,280,553 | 3,492,269 |
| Due to a related party | 56,102 | 377,031 |
| Current Liabilities | 2,336,655 | 3,869,300 |
| Total Liabilities | 2,336,655 | 3,869,300 |
| Equity | ||
| Share capital | 155,840,052 | 153,707,576 |
| Share-based payment reserve | 18,636,297 | 15,395,486 |
| Accumulated other comprehensive income | 10,227,980 | 11,704,949 |
| Deficit | (68,623,306) | (60,527,857) |
| Total equity attributable to the equity holders of the Company | 116,081,023 | 120,280,154 |
| Non-controlling interests | (110,137) | (71,199) |
| Total Equity | 115,970,886 | 120,208,955 |
| TOTAL LIABILITIES AND EQUITY | $ 118,307,541 | $ 124,078,255 |
Consolidated Statements of Loss (Parentheticals) - $ / shares |
12 Months Ended | |
|---|---|---|
Jun. 30, 2023 |
Jun. 30, 2022 |
|
| Profit or loss [abstract] | ||
| Loss per share - diluted | $ (0.05) | $ (0.04) |
| Weighted average number of common shares - diluted | 156,991,661 | 155,626,128 |
Consolidated Statements of Comprehensive Loss - USD ($) |
12 Months Ended | |
|---|---|---|
Jun. 30, 2023 |
Jun. 30, 2022 |
|
| Consolidated Statements of Comprehensive Loss Income | ||
| Net loss | $ (8,100,132) | $ (6,471,668) |
| Other comprehensive loss, net of taxes: | ||
| Currency translation adjustment, net of tax of $nil | (1,511,224) | (1,953,256) |
| Other comprehensive loss, net of taxes | (1,511,224) | (1,953,256) |
| Attributable to: | ||
| Equity holders of the Company | (1,476,969) | (1,936,430) |
| Non-controlling interests | (34,255) | (16,826) |
| Other comprehensive loss, net of taxes | (1,511,224) | (1,953,256) |
| Total comprehensive loss, net of taxes | (9,611,356) | (8,424,924) |
| Attributable to: | ||
| Equity holders of the Company | (9,572,418) | (8,357,315) |
| Non-controlling interests | (38,938) | (67,609) |
| Total comprehensive loss, net of taxes | $ (9,611,356) | $ (8,424,924) |
Consolidated Statements of Comprehensive Loss (Parentheticals) - USD ($) |
12 Months Ended | |
|---|---|---|
Jun. 30, 2023 |
Jun. 30, 2022 |
|
| Consolidated Statements of Comprehensive Loss Income | ||
| Net of tax | ||
Consolidated Statements of Changes in Equity - USD ($) |
Share capital |
Share-based payment reserve |
Accumulated other comprehensive income |
Deficit |
Total equity attributable to the equity holders of the Company |
Non- controlling interests |
Total |
|---|---|---|---|---|---|---|---|
| Balance at Jun. 30, 2021 | $ 149,629,543 | $ 16,564,197 | $ 13,641,379 | $ (54,106,972) | $ 125,728,147 | $ (3,590) | $ 125,724,557 |
| Balance (in Shares) at Jun. 30, 2021 | 154,451,263 | ||||||
| Options exercised | $ 2,677,895 | (895,000) | 1,782,895 | 1,782,895 | |||
| Options exercised (in Shares) | 1,838,331 | ||||||
| Restricted share units distributed | $ 1,400,138 | (1,400,138) | |||||
| Restricted share units distributed (in Shares) | 342,233 | ||||||
| Share-based compensation | 1,126,427 | 1,126,427 | 1,126,427 | ||||
| Net loss | (6,420,885) | (6,420,885) | (50,783) | (6,471,668) | |||
| Currency translation adjustment | (1,936,430) | (1,936,430) | (16,826) | (1,953,256) | |||
| Balance at Jun. 30, 2022 | $ 153,707,576 | 15,395,486 | 11,704,949 | (60,527,857) | 120,280,154 | (71,199) | 120,208,955 |
| Balance (in Shares) at Jun. 30, 2022 | 156,631,827 | ||||||
| Options exercised | $ 892,966 | (288,292) | 604,674 | 604,674 | |||
| Options exercised (in Shares) | 445,000 | ||||||
| Restricted share units distributed | $ 1,019,068 | (1,019,068) | |||||
| Restricted share units distributed (in Shares) | 324,255 | ||||||
| Private placement | $ 220,442 | 220,442 | 220,442 | ||||
| Private placement (in Shares) | 90,090 | ||||||
| Share-based compensation | 4,548,171 | 4,548,171 | 4,548,171 | ||||
| Net loss | (8,095,449) | (8,095,449) | (4,683) | (8,100,132) | |||
| Currency translation adjustment | (1,476,969) | (1,476,969) | (34,255) | (1,511,224) | |||
| Balance at Jun. 30, 2023 | $ 155,840,052 | $ 18,636,297 | $ 10,227,980 | $ (68,623,306) | $ 116,081,023 | $ (110,137) | $ 115,970,886 |
| Balance (in Shares) at Jun. 30, 2023 | 157,491,172 |
Corporate Information |
12 Months Ended |
|---|---|
Jun. 30, 2023 | |
| Corporate Information [Abstract] | |
| CORPORATE INFORMATION | 1. CORPORATE INFORMATION
New Pacific Metals Corp. along with its subsidiaries (collectively, the “Company” or “New Pacific”) is a Canadian mining issuer engaged in exploring and developing mineral properties in Bolivia. The Company is in the stage of exploring and advancing the development of its mineral properties and has not yet determined if they contain economically recoverable mineral reserves. The underlying value and the recoverability of the amounts shown for mineral property interests are entirely dependent upon the existence of recoverable mineral reserves, the ability of the Company to obtain the necessary financing to complete the exploration and development of the mineral properties, and future profitable production or proceeds from the disposition of the mineral property interests.
The Company is publicly listed on the Toronto Stock Exchange (“TSX”) under the symbol “NUAG” and on the NYSE American stock exchange (“NYSE-A”) under the symbol “NEWP”. The head office, registered address and records office of the Company are located at 1066 Hastings Street, Suite 1750, Vancouver, British Columbia, Canada, V6E 3X1. |
Significant Accounting Policies |
12 Months Ended | |||||||||||||||||||||||||||||||||||||||||||||||||||||||||||||||||||||||||||||||||||||||||||||||||||||||||||||||||||||||||||||||||||||||||||||||||||||||||||||||||||||||||||||||||||||||||||||||||||||||||||||||||||||||||||||||||||||||||||||||||||||||||
|---|---|---|---|---|---|---|---|---|---|---|---|---|---|---|---|---|---|---|---|---|---|---|---|---|---|---|---|---|---|---|---|---|---|---|---|---|---|---|---|---|---|---|---|---|---|---|---|---|---|---|---|---|---|---|---|---|---|---|---|---|---|---|---|---|---|---|---|---|---|---|---|---|---|---|---|---|---|---|---|---|---|---|---|---|---|---|---|---|---|---|---|---|---|---|---|---|---|---|---|---|---|---|---|---|---|---|---|---|---|---|---|---|---|---|---|---|---|---|---|---|---|---|---|---|---|---|---|---|---|---|---|---|---|---|---|---|---|---|---|---|---|---|---|---|---|---|---|---|---|---|---|---|---|---|---|---|---|---|---|---|---|---|---|---|---|---|---|---|---|---|---|---|---|---|---|---|---|---|---|---|---|---|---|---|---|---|---|---|---|---|---|---|---|---|---|---|---|---|---|---|---|---|---|---|---|---|---|---|---|---|---|---|---|---|---|---|---|---|---|---|---|---|---|---|---|---|---|---|---|---|---|---|---|---|---|---|---|---|---|---|---|---|---|---|---|---|---|---|---|---|
Jun. 30, 2023 | ||||||||||||||||||||||||||||||||||||||||||||||||||||||||||||||||||||||||||||||||||||||||||||||||||||||||||||||||||||||||||||||||||||||||||||||||||||||||||||||||||||||||||||||||||||||||||||||||||||||||||||||||||||||||||||||||||||||||||||||||||||||||||
| Significant Accounting Policies [Abstract] | ||||||||||||||||||||||||||||||||||||||||||||||||||||||||||||||||||||||||||||||||||||||||||||||||||||||||||||||||||||||||||||||||||||||||||||||||||||||||||||||||||||||||||||||||||||||||||||||||||||||||||||||||||||||||||||||||||||||||||||||||||||||||||
| SIGNIFICANT ACCOUNTING POLICIES | 2. SIGNIFICANT ACCOUNTING POLICIES
(a) Statement of Compliance
These consolidated financial statements have been prepared in accordance with International Financial Reporting Standards as issued by the International Accounting Standards Board (“IFRS”). The policies applied in these consolidated financial statements are based on IFRS in effect as of June 30, 2023.
These consolidated financial statements have been prepared on a going concern basis.
The consolidated financial statements of the Company as at and for the year ended June 30, 2023 were authorized for issue in accordance with a resolution of the Board of Directors (the “Board”) dated on August 23, 2023.
(b) Basis of Consolidation
These consolidated financial statements include the accounts of the Company and its wholly or partially owned subsidiaries.
Subsidiaries are consolidated from the date on which the Company obtains control up to the date of the disposition of control. Control is achieved when the Company has power over the subsidiary, is exposed or has rights to variable returns from its involvement with the subsidiary; and has the ability to use its power to affect its returns. For non-wholly-owned subsidiaries over which the Company has control, the net assets attributable to outside equity shareholders are presented as “non-controlling interests” in the equity section of the consolidated statements of financial position. Net income or loss for the period that is attributable to the non-controlling interests is calculated based on the ownership of the non-controlling interest shareholders in the subsidiary.
Balances, transactions, income and expenses between the Company and its subsidiaries are eliminated on consolidation.
Details of the Company’s significant subsidiaries which are consolidated are as follows:
(c) Foreign Currency Translation
The functional currency for each subsidiary of the Company is the currency of the primary economic environment in which the entity operates. The functional currency of the head office, Canadian subsidiaries and all intermediate holding companies is the Canadian dollar (“CAD”). The functional currency of all Bolivian subsidiaries is the US dollar (“USD”). The functional currency of the Chinese subsidiary is the Chinese Renminbi (“RMB”).
Foreign currency monetary assets and liabilities are translated into the functional currency using exchange rates prevailing at the balance sheet date. Foreign currency non-monetary assets are translated using exchange rates prevailing at the transaction date. Foreign exchange gains and losses are included in the determination of net income.
The consolidated financial statements are presented in USD. The financial position and results of the Company’s entities are translated from functional currencies to USD as follows:
The Company treats inter-company loan balances, which are not intended to be repaid in the foreseeable future, as part of its net investment. When a foreign entity is sold, the historical exchange differences plus the foreign exchange impact that arises on the transaction are recognized in the consolidated statement of loss as part of the gain or loss on sale.
(d) Plant and Equipment
Plant and equipment are initially recorded at cost, including all directly attributable costs to bring the assets to the location and condition necessary for it to be capable of operating in the manner intended by management. Plant and equipment are subsequently measured at cost less accumulated depreciation and applicable impairment losses. Depreciation is computed using the straight-line method based on the nature and estimated useful lives as follows:
Subsequent costs that meet the asset recognition criteria are capitalized while costs incurred that do not extend the economic useful life of an asset are considered repair and maintenance, which are accounted for as an expense recognized during the period. The Company conducts an annual assessment of the residual balances, useful lives, and depreciation methods being used for plant and equipment and any changes are applied prospectively.
Assets under construction are capitalized as construction-in-progress. The cost of construction-in-progress comprises its purchase price and any costs directly attributable to bringing it into working condition for its intended use. Construction-in-progress assets are not depreciated until they are completed and available for use.
(e) Mineral Property Interests
The cost of acquiring mineral rights and properties either as an individual asset purchase or as part of a business combination is capitalized and represents the property’s fair value at the date of acquisition. Fair value is determined by estimating the value of the property’s reserves, resources and exploration potential.
Exploration and evaluation costs, incurred associated with specific mineral rights and properties prior to demonstrable technical feasibility and commercial viability of extracting a mineral resource, are capitalized.
The Company determines that a property is in the development stage when its technical feasibility and commercial viability are demonstrable. Costs incurred in the development stage prior to commercial production are capitalized and included in the carrying amount of the related property in the period incurred. Proceeds from sales during this period, if any, are offset against costs capitalized.
(f) Impairment of Long-lived Assets
Long-lived assets, including mineral property interests, plant and equipment are reviewed and tested for impairment when indicators of impairment are considered to exist. Impairment assessments are conducted at the level of cash-generating units (“CGU”) or at the individual asset level, whichever is the lowest level for which identifiable cash inflows are largely independent of the cash flows of other assets. An impairment loss is recognized for any excess of carrying amount of a CGU over its recoverable amount, which is the greater of its fair value less costs to sell and value in use. For mineral properties, the recoverable amount is estimated as the discounted future net cash inflows expected to be derived from expected future
production, metal prices, and net proceeds from the disposition of assets on retirement, less operating and capital costs. Impairment losses are recognized in the period they are incurred.
For exploration and evaluation assets, indication of impairment includes but is not limited to expiration of the right to explore, substantive expenditures in the specific area are neither budgeted nor planned, and exploration for and evaluation of mineral resources in the specific area have not led to the discovery of commercially viable quantities of mineral resources.
Impairment losses are reversed if there is evidence the loss no longer exists or has decreased. This reversal is recognized in net income in the period the reversal occurs limited by the carrying value that would have been determined, net of any depreciation, had no impairment charge been recognized in prior years.
(g) Share-based Payments
The Company grants share-based awards, including restricted share units (“RSUs”) and stock options to directors, officers, employees, and consultants.
For share-based awards, the fair value is charged to the consolidated statements of loss and credited to equity, on a straight-line basis over the vesting period, after adjusting for the estimated number of awards that are expected to vest. The fair value of share units is determined based on quoted market price of the Company’s common shares at the date of grant. The fair value of the stock options granted to employees, officers, and directors is determined at the date of grant using the Black-Scholes option pricing model with market related input. The fair value of stock options granted to consultants is measured at the fair value of the services delivered unless that fair value cannot be estimated reliably, which then is determined using the Black-Scholes option pricing model. Stock options with graded vesting schedules are accounted for as separate grants with different vesting periods and fair values.
At each statement of financial position date prior to vesting, the cumulative expense representing the extent to which the vesting period has expired and management’s best estimate of the awards that are ultimately expected to vest is computed. The movement in cumulative expense is recognized in the consolidated statements of loss with a corresponding entry within equity. The amount recognized as expense is adjusted to reflect the number of awards for which the related service and non-market vesting conditions are expected to be met.
(h) Income Taxes
Current tax for each taxable entity is based on the local taxable income at the local substantively enacted statutory tax rate at the balance sheet date and includes adjustments to taxes payable or recoverable in respect to previous periods.
Current tax assets and current tax liabilities are only offset if a legally enforceable right exists to set off the amounts, and the Company intends to settle on a net basis, or to realize the asset and settle the liability simultaneously.
Deferred tax is recognized using the liability method on temporary differences at the reporting date between the tax bases of assets and liabilities, and their carrying amounts for financial reporting purposes. Deferred tax assets are recognized for all deductible temporary differences, carry forward of unused tax credits and unused tax losses, to the extent that it is probable that taxable profit will be available against which the deductible temporary differences, and the carry forward of unused tax credits and unused tax losses, can be utilized, except:
The carrying amount of deferred tax assets is reviewed at the end of each reporting period and reduced to the extent that it is no longer probable that sufficient taxable profit will be available to allow all or part of the deferred tax asset to be utilized. Unrecognized deferred tax assets are reassessed at the end of each reporting period and are recognized to the extent that it has become probable that future taxable profit will be available to allow the deferred tax asset to be recovered.
Deferred tax assets and liabilities are measured at the tax rates that are expected to apply to the year when the asset is realized or the liability is settled, based on tax rates and tax laws that have been substantively enacted by the end of the reporting period.
Deferred tax relating to items recognized outside profit or loss is recognized in other comprehensive income or directly in equity.
Deferred tax assets and deferred tax liabilities are offset, if a legally enforceable right exists to set off current tax assets against current tax liabilities and the deferred taxes relate to the same taxable entity and the same taxation authority.
(i) Earnings (loss) per Share
Earnings (loss) per share is computed by dividing net income (loss) attributable to equity holders of the Company by the weighted average number of common shares outstanding for the period. Diluted earnings per share reflect the potential dilution that could occur if additional common shares are assumed to be issued under securities that entitle their holders to obtain common shares in the future. For vested RSUs, the full outstanding numbers as at the end of the period are included in the calculation of diluted earnings per share. For stock options, the number of additional shares for inclusion in diluted earnings per share calculations is determined when the exercise price is less than the average market price of the Company’s common shares; the stock options are assumed to be exercised and the proceeds are used to repurchase common shares at the average market price for the period. The incremental number of common shares issued under stock options and repurchased from proceeds is included in the calculation of diluted earnings per share. When loss per share is presented in the period, the Company’s calculation of diluted loss per share excludes any incremental shares from the assumed calculation of RSUs and stock options as they would be anti-dilutive.
(j) Financial Instruments
Initial recognition: On initial recognition, all financial assets and financial liabilities are recorded at fair value adjusted for directly attributable transaction costs except for financial assets and liabilities classified as fair value through profit or loss (“FVTPL”), in which case transaction costs are expensed as incurred. Subsequent measurement of financial assets: Subsequent measurement of financial assets depends on the classification of such assets.
IFRS 9 includes a single model that has only two classification categories for financial instruments other than equity instruments: amortized cost and fair value. To qualify for amortized cost accounting, the instrument must meet two criteria:
At initial recognition, for equity instruments other than held for trading, the Company may make an irrevocable election to designate it as either FVTPL or fair value through other comprehensive income (“FVTOCI”).
Financial assets classified as amortized cost are measured using the effective interest method. Amortized cost is calculated by taking into account any discount or premiums on acquisition and fees that are an integral part of the effective interest method. Amortization from the effective interest method is included in finance income.
Financial assets classified as FVTPL are measured at fair value with changes in fair values recognized in profit or loss.
Impairment of financial assets carried at amortized cost: The Company assesses at the end of each reporting period whether there is objective evidence that financial assets or group of financial assets measured at amortized cost are impaired. Impairment losses and reversal of impairment losses, if any, are recognized in profit or loss in the period they are incurred.
Subsequent measurement of financial liabilities: Financial liabilities classified as amortized cost are measured using the effective interest method. Amortized cost is calculated by taking into account any discount or premiums on acquisition and fees that are an integral part of the effective interest method. Amortization using the effective interest method is included in finance costs.
The Company classifies its financial instruments as follows:
Bonds: The Company acquired bonds issued by other companies from various industries through the open market. These bonds are held to receive coupon interest payments and to realize potential gains. The bonds may also be disposed on demand through the open market should the Company require funds for other operational or investment needs. Bonds are classified as FVTPL and are measured at fair value on initial recognition and subsequent measurement.
Equity investments: Equity investments represent equity interests of other publicly-traded or privately-held companies that the Company has acquired through the open market or through private placements. These equity interests consist of common shares and warrants. Equity investments are classified as FVTPL and are measured at
fair value on initial recognition and subsequent measurement. The fair value of warrants was determined using the Black-Scholes pricing model as at the acquisition date as well as at each period end.
Derecognition of financial assets and financial liabilities: A financial asset is derecognized when:
Gains and losses on derecognition of financial assets and liabilities classified as amortized cost are recognized in profit or loss when the instrument is derecognized or impaired, as well as through the amortization process.
A financial liability is derecognized when the obligation under the liability is discharged or cancelled or expires. When an existing financial liability is replaced by another from the same lender on substantially different terms, or the terms of an existing liability are substantially modified, such an exchange or modification is treated as a derecognition of the original liability. In this case, a new liability is recognized, and the difference in the respective carrying amounts is recognized in the consolidated statement of income.
Offsetting of financial instruments: Financial assets and liabilities are offset and the net amount is reported in the consolidated statement of financial position if and only if, there is a currently enforceable legal right to offset the recognized amounts and there is an intention to settle on a net basis, or to realize the assets and settle liabilities simultaneously.
Fair value of financial instruments: The fair value of financial instruments that are traded in active markets at each reporting date is determined by reference to quoted market prices, without deduction for transaction costs. For financial instruments that are not traded in active markets, the fair value is determined using appropriate valuation techniques, such as using a recent arm’s length market transaction between knowledgeable and willing parties, discounted cash flow analysis, reference to the current fair value of another instrument that is substantially the same, or other valuation models.
Many amounts included in the consolidated financial statements require management to make judgments and/or estimates. These judgments and estimates are continuously evaluated and are based on management’s experience and knowledge of relevant facts and circumstances. Actual results may differ from the amounts included in the consolidated statement of financial position.
Areas of significant judgment include:
Areas of significant estimates include:
The Company estimates its mineral resources based on information compiled by qualified persons as defined in accordance with National Instrument 43-101. |
|||||||||||||||||||||||||||||||||||||||||||||||||||||||||||||||||||||||||||||||||||||||||||||||||||||||||||||||||||||||||||||||||||||||||||||||||||||||||||||||||||||||||||||||||||||||||||||||||||||||||||||||||||||||||||||||||||||||||||||||||||||||||
Short-Term Investments |
12 Months Ended | ||||||||||||||||||||||||||||||||||||||||||||||||
|---|---|---|---|---|---|---|---|---|---|---|---|---|---|---|---|---|---|---|---|---|---|---|---|---|---|---|---|---|---|---|---|---|---|---|---|---|---|---|---|---|---|---|---|---|---|---|---|---|---|
Jun. 30, 2023 | |||||||||||||||||||||||||||||||||||||||||||||||||
| Short-Term Investments [Abstract] | |||||||||||||||||||||||||||||||||||||||||||||||||
| SHORT-TERM INVESTMENTS | 3. SHORT-TERM INVESTMENTS
Short-term investments consist of the following:
The Company acquired bonds issued by other corporations from various industries through the open market. These bonds were held to receive coupon interest payments and to realize potential gains. The bonds may also be disposed on demand through the open market should the Company require funds for operational or investment needs. The Company accounts for the bonds at fair value at each reporting date.
The continuity of short-term investments is summarized as follows:
|
||||||||||||||||||||||||||||||||||||||||||||||||
Other Tax Receivable |
12 Months Ended |
|---|---|
Jun. 30, 2023 | |
| Other Tax Receivable [Abstract] | |
| OTHER TAX RECEIVABLE | 4. OTHER TAX RECEIVABLE
Other tax receivable is composed of value-added tax (“VAT”) imposed by the Bolivian government. The Company had VAT outputs through its exploration costs and general expenses incurred in Bolivia. These VAT outputs are deductible against future VAT inputs that will be generated through sales. |
Equity Investments |
12 Months Ended | ||||||||||||||||||||||||||||||||||||||||||||||||||||||||||||||||||||||||||||||||||||||||||||||||||||||||||||||||||||||||||||||
|---|---|---|---|---|---|---|---|---|---|---|---|---|---|---|---|---|---|---|---|---|---|---|---|---|---|---|---|---|---|---|---|---|---|---|---|---|---|---|---|---|---|---|---|---|---|---|---|---|---|---|---|---|---|---|---|---|---|---|---|---|---|---|---|---|---|---|---|---|---|---|---|---|---|---|---|---|---|---|---|---|---|---|---|---|---|---|---|---|---|---|---|---|---|---|---|---|---|---|---|---|---|---|---|---|---|---|---|---|---|---|---|---|---|---|---|---|---|---|---|---|---|---|---|---|---|---|---|
Jun. 30, 2023 | |||||||||||||||||||||||||||||||||||||||||||||||||||||||||||||||||||||||||||||||||||||||||||||||||||||||||||||||||||||||||||||||
| Equity Investments [Abstract] | |||||||||||||||||||||||||||||||||||||||||||||||||||||||||||||||||||||||||||||||||||||||||||||||||||||||||||||||||||||||||||||||
| EQUITY INVESTMENTS | 5. EQUITY INVESTMENTS
The equity investments are summarized as follows:
The continuity of equity investments is summarized as follows:
|
||||||||||||||||||||||||||||||||||||||||||||||||||||||||||||||||||||||||||||||||||||||||||||||||||||||||||||||||||||||||||||||
Income from Investments |
12 Months Ended | ||||||||||||||||||||||||||||||||||||||||||||||||||||||
|---|---|---|---|---|---|---|---|---|---|---|---|---|---|---|---|---|---|---|---|---|---|---|---|---|---|---|---|---|---|---|---|---|---|---|---|---|---|---|---|---|---|---|---|---|---|---|---|---|---|---|---|---|---|---|---|
Jun. 30, 2023 | |||||||||||||||||||||||||||||||||||||||||||||||||||||||
| Income from Investments [Abstract] | |||||||||||||||||||||||||||||||||||||||||||||||||||||||
| INCOME FROM INVESTMENTS | 6. INCOME FROM INVESTMENTS
Income from investments consist of:
|
||||||||||||||||||||||||||||||||||||||||||||||||||||||
Plant and Equipment |
12 Months Ended | |||||||||||||||||||||||||||||||||||||||||||||||||||||||||||||||||||||||||||||||||||||||||||||||||||||||||||||||||||||||||||||||||||||||||||||||||||||||||||||||||||||||||||||||||||||||||||||||||||||||||||||||||||||||||||||||||||||||||||||||||||||||||||||||||||||||||||||||||||||||||||||||||||||||||||||||||||||||||||||||||||||||||||||||||||||||||||||||||||||||||||||||||||||||||||||||||||||||||||||||||||||||||||||||||||||||||||||||||||||||||||||||||||||||||||||||||||||||||||||||||||||||||||||||||||||||||||||||||||||||||||||||||||||||||||||||||||||||||||||||||||||||||||||||||||||||||||||||||||||||||||||||||||||||||||||||||||||||||||||||||||||||||||||||||||||||||||||||||||
|---|---|---|---|---|---|---|---|---|---|---|---|---|---|---|---|---|---|---|---|---|---|---|---|---|---|---|---|---|---|---|---|---|---|---|---|---|---|---|---|---|---|---|---|---|---|---|---|---|---|---|---|---|---|---|---|---|---|---|---|---|---|---|---|---|---|---|---|---|---|---|---|---|---|---|---|---|---|---|---|---|---|---|---|---|---|---|---|---|---|---|---|---|---|---|---|---|---|---|---|---|---|---|---|---|---|---|---|---|---|---|---|---|---|---|---|---|---|---|---|---|---|---|---|---|---|---|---|---|---|---|---|---|---|---|---|---|---|---|---|---|---|---|---|---|---|---|---|---|---|---|---|---|---|---|---|---|---|---|---|---|---|---|---|---|---|---|---|---|---|---|---|---|---|---|---|---|---|---|---|---|---|---|---|---|---|---|---|---|---|---|---|---|---|---|---|---|---|---|---|---|---|---|---|---|---|---|---|---|---|---|---|---|---|---|---|---|---|---|---|---|---|---|---|---|---|---|---|---|---|---|---|---|---|---|---|---|---|---|---|---|---|---|---|---|---|---|---|---|---|---|---|---|---|---|---|---|---|---|---|---|---|---|---|---|---|---|---|---|---|---|---|---|---|---|---|---|---|---|---|---|---|---|---|---|---|---|---|---|---|---|---|---|---|---|---|---|---|---|---|---|---|---|---|---|---|---|---|---|---|---|---|---|---|---|---|---|---|---|---|---|---|---|---|---|---|---|---|---|---|---|---|---|---|---|---|---|---|---|---|---|---|---|---|---|---|---|---|---|---|---|---|---|---|---|---|---|---|---|---|---|---|---|---|---|---|---|---|---|---|---|---|---|---|---|---|---|---|---|---|---|---|---|---|---|---|---|---|---|---|---|---|---|---|---|---|---|---|---|---|---|---|---|---|---|---|---|---|---|---|---|---|---|---|---|---|---|---|---|---|---|---|---|---|---|---|---|---|---|---|---|---|---|---|---|---|---|---|---|---|---|---|---|---|---|---|---|---|---|---|---|---|---|---|---|---|---|---|---|---|---|---|---|---|---|---|---|---|---|---|---|---|---|---|---|---|---|---|---|---|---|---|---|---|---|---|---|---|---|---|---|---|---|---|---|---|---|---|---|---|---|---|---|---|---|---|---|---|---|---|---|---|---|---|---|---|---|---|---|---|---|---|---|---|---|---|---|---|---|---|---|---|---|---|---|---|---|---|---|---|---|---|---|---|---|---|---|---|---|---|---|---|---|---|---|---|---|---|---|---|---|---|---|---|---|---|---|---|---|---|---|---|---|---|---|---|---|---|---|---|---|---|---|---|---|---|---|---|---|---|---|---|---|---|---|---|---|---|---|---|---|---|---|---|---|---|---|---|---|---|---|---|---|---|---|---|---|---|---|---|---|---|---|---|---|---|---|---|---|---|---|---|---|---|---|---|---|---|---|---|---|---|---|---|---|---|---|---|---|---|---|---|---|---|---|---|---|---|---|---|---|---|---|---|---|---|---|---|---|---|---|---|---|---|---|---|---|
Jun. 30, 2023 | ||||||||||||||||||||||||||||||||||||||||||||||||||||||||||||||||||||||||||||||||||||||||||||||||||||||||||||||||||||||||||||||||||||||||||||||||||||||||||||||||||||||||||||||||||||||||||||||||||||||||||||||||||||||||||||||||||||||||||||||||||||||||||||||||||||||||||||||||||||||||||||||||||||||||||||||||||||||||||||||||||||||||||||||||||||||||||||||||||||||||||||||||||||||||||||||||||||||||||||||||||||||||||||||||||||||||||||||||||||||||||||||||||||||||||||||||||||||||||||||||||||||||||||||||||||||||||||||||||||||||||||||||||||||||||||||||||||||||||||||||||||||||||||||||||||||||||||||||||||||||||||||||||||||||||||||||||||||||||||||||||||||||||||||||||||||||||||||||||||
| Plant and Equipment [Abstract] | ||||||||||||||||||||||||||||||||||||||||||||||||||||||||||||||||||||||||||||||||||||||||||||||||||||||||||||||||||||||||||||||||||||||||||||||||||||||||||||||||||||||||||||||||||||||||||||||||||||||||||||||||||||||||||||||||||||||||||||||||||||||||||||||||||||||||||||||||||||||||||||||||||||||||||||||||||||||||||||||||||||||||||||||||||||||||||||||||||||||||||||||||||||||||||||||||||||||||||||||||||||||||||||||||||||||||||||||||||||||||||||||||||||||||||||||||||||||||||||||||||||||||||||||||||||||||||||||||||||||||||||||||||||||||||||||||||||||||||||||||||||||||||||||||||||||||||||||||||||||||||||||||||||||||||||||||||||||||||||||||||||||||||||||||||||||||||||||||||||
| PLANT AND EQUIPMENT | 7. PLANT AND EQUIPMENT
During the year ended June 30, 2023, certain plant and equipment were disposed for proceeds of $ (year ended June 30, 2022, $1,808) and loss of $ (year ended June 30, 2022, loss of $14,804). |
|||||||||||||||||||||||||||||||||||||||||||||||||||||||||||||||||||||||||||||||||||||||||||||||||||||||||||||||||||||||||||||||||||||||||||||||||||||||||||||||||||||||||||||||||||||||||||||||||||||||||||||||||||||||||||||||||||||||||||||||||||||||||||||||||||||||||||||||||||||||||||||||||||||||||||||||||||||||||||||||||||||||||||||||||||||||||||||||||||||||||||||||||||||||||||||||||||||||||||||||||||||||||||||||||||||||||||||||||||||||||||||||||||||||||||||||||||||||||||||||||||||||||||||||||||||||||||||||||||||||||||||||||||||||||||||||||||||||||||||||||||||||||||||||||||||||||||||||||||||||||||||||||||||||||||||||||||||||||||||||||||||||||||||||||||||||||||||||||||
Mineral Property Interests |
12 Months Ended | ||||||||||||||||||||||||||||||||||||||||||||||||||||||||||||||||||||||||||||||||||||||||||||||||||||||||||||||||||||||||||||||||||||||||||||||||||||||||||||||||||||||||||||||||||||||||||||||||||||||||||||||||||||||||||||||||||||||||||||||||||||||||||||||||||||||||||||||||||||||||||||||||||||||||||||||||||||||||||||||||||||||||||||||||||||||||||||||||||||||||||||||||||||||||||||||||||||||||||||||||||||||||||||||||||||
|---|---|---|---|---|---|---|---|---|---|---|---|---|---|---|---|---|---|---|---|---|---|---|---|---|---|---|---|---|---|---|---|---|---|---|---|---|---|---|---|---|---|---|---|---|---|---|---|---|---|---|---|---|---|---|---|---|---|---|---|---|---|---|---|---|---|---|---|---|---|---|---|---|---|---|---|---|---|---|---|---|---|---|---|---|---|---|---|---|---|---|---|---|---|---|---|---|---|---|---|---|---|---|---|---|---|---|---|---|---|---|---|---|---|---|---|---|---|---|---|---|---|---|---|---|---|---|---|---|---|---|---|---|---|---|---|---|---|---|---|---|---|---|---|---|---|---|---|---|---|---|---|---|---|---|---|---|---|---|---|---|---|---|---|---|---|---|---|---|---|---|---|---|---|---|---|---|---|---|---|---|---|---|---|---|---|---|---|---|---|---|---|---|---|---|---|---|---|---|---|---|---|---|---|---|---|---|---|---|---|---|---|---|---|---|---|---|---|---|---|---|---|---|---|---|---|---|---|---|---|---|---|---|---|---|---|---|---|---|---|---|---|---|---|---|---|---|---|---|---|---|---|---|---|---|---|---|---|---|---|---|---|---|---|---|---|---|---|---|---|---|---|---|---|---|---|---|---|---|---|---|---|---|---|---|---|---|---|---|---|---|---|---|---|---|---|---|---|---|---|---|---|---|---|---|---|---|---|---|---|---|---|---|---|---|---|---|---|---|---|---|---|---|---|---|---|---|---|---|---|---|---|---|---|---|---|---|---|---|---|---|---|---|---|---|---|---|---|---|---|---|---|---|---|---|---|---|---|---|---|---|---|---|---|---|---|---|---|---|---|---|---|---|---|---|---|---|---|---|---|---|---|---|---|---|---|---|---|---|---|---|---|---|---|---|---|---|---|---|---|---|---|---|---|---|---|---|---|---|---|---|---|---|---|---|---|---|---|---|---|---|---|
Jun. 30, 2023 | |||||||||||||||||||||||||||||||||||||||||||||||||||||||||||||||||||||||||||||||||||||||||||||||||||||||||||||||||||||||||||||||||||||||||||||||||||||||||||||||||||||||||||||||||||||||||||||||||||||||||||||||||||||||||||||||||||||||||||||||||||||||||||||||||||||||||||||||||||||||||||||||||||||||||||||||||||||||||||||||||||||||||||||||||||||||||||||||||||||||||||||||||||||||||||||||||||||||||||||||||||||||||||||||||||||
| Mineral Property Interests [Abstract] | |||||||||||||||||||||||||||||||||||||||||||||||||||||||||||||||||||||||||||||||||||||||||||||||||||||||||||||||||||||||||||||||||||||||||||||||||||||||||||||||||||||||||||||||||||||||||||||||||||||||||||||||||||||||||||||||||||||||||||||||||||||||||||||||||||||||||||||||||||||||||||||||||||||||||||||||||||||||||||||||||||||||||||||||||||||||||||||||||||||||||||||||||||||||||||||||||||||||||||||||||||||||||||||||||||||
| MINERAL PROPERTY INTERESTS | 8. MINERAL PROPERTY INTERESTS
(a) Silver Sand Project
On July 20, 2017, the Company acquired the Silver Sand Project. The Project is located in the Colavi District of the Potosí Department, in Southwestern Bolivia, 33 kilometres (“km”) northeast of Potosí City, the department capital. The project covers an area of approximately 5.42 km2 at an elevation of 4,072 metres (“m”) above sea level.
For the year ended June 30, 2023, total expenditures of $6,316,500 (year ended June 30, 2022 - $7,639,287) were capitalized under the project.
(b) Carangas Project
In April 2021, the Company signed an agreement with a private Bolivian company to acquire a 98% interest in the Carangas Project. The project is located approximately 180 km southwest of the city of Oruro and within 50 km from Bolivia’s border with Chile. The private Bolivian company is 100% owned by Bolivian nationals and holds title to the three exploration licenses that cover an area of 40.75 km2.
Under the agreement, the Company is required to cover 100% of the future expenditures on exploration, mining, development, and production activities for the project. The agreement has a term of 30 years and is renewable for an additional 15 years.
For the year ended June 30, 2023, total expenditures of $10,817,356 (year ended June 30, 2022-$5,224,138) were capitalized under the project.
(c) Silverstrike Project
In December 2019, the Company acquired a 98% interest in the Silverstrike Project from a private Bolivian corporation. The project covers an area of approximately 13 km2 and is located approximately 140 km southwest of the city of La Paz, Bolivia.
For the year ended June 30, 2023, total expenditures of $1,409,101 (year ended June 30, 2022 - $142,078) were capitalized under the project.
(d) RZY Project
The RZY Project, located in Qinghai, China was an early stage silver-lead-zinc exploration project. The RZY Project is located approximately 237 km from the city of Yushu Tibetan Autonomous Prefecture. In 2016, the Qinghai Government issued a moratorium which suspended exploration for 26 mining projects in the region, including the RZY Project, and classified the region as a National Nature Reserve Area.
During Fiscal 2020, the Company’s subsidiary, Qinghai Found Mining Co., Ltd. (“Qinghai Found”), reached a compensation agreement with the Qinghai Government for the RZY Project. Pursuant to the agreement, Qinghai Found will surrender its title to the RZY Project to the Qinghai Government for one-time cash compensation of $2.99 million (RMB ¥20 million) (the “RZY compensation transaction”).
On June 25, 2022, the Qinghai Government completed its approval process of the RZY compensation transaction. As a result, the Company disposed its RZY Project for cash consideration of $2,986,188 (RMB ¥20 million), which is included in the receivables balance as at June 30, 2022 and was received in full during the year ended June 30, 2023. For the year ended June 30, 2022, a loss of $85,052 was recognized upon disposal of the RZY Project.
The continuity schedule of mineral property acquisition costs and deferred exploration and development costs is summarized as follows:
|
||||||||||||||||||||||||||||||||||||||||||||||||||||||||||||||||||||||||||||||||||||||||||||||||||||||||||||||||||||||||||||||||||||||||||||||||||||||||||||||||||||||||||||||||||||||||||||||||||||||||||||||||||||||||||||||||||||||||||||||||||||||||||||||||||||||||||||||||||||||||||||||||||||||||||||||||||||||||||||||||||||||||||||||||||||||||||||||||||||||||||||||||||||||||||||||||||||||||||||||||||||||||||||||||||||
Trade and Other Payables |
12 Months Ended | ||||||||||||||||||||||||||||||||||||
|---|---|---|---|---|---|---|---|---|---|---|---|---|---|---|---|---|---|---|---|---|---|---|---|---|---|---|---|---|---|---|---|---|---|---|---|---|---|
Jun. 30, 2023 | |||||||||||||||||||||||||||||||||||||
| Trade and Other Payables [Abstract] | |||||||||||||||||||||||||||||||||||||
| TRADE AND OTHER PAYABLES | 9. TRADE AND OTHER PAYABLES
Trade and other payables consist of:
|
||||||||||||||||||||||||||||||||||||
Related Party Transactions |
12 Months Ended | ||||||||||||||||||||||||||||||||||||||||||||||||||||||||||||||||||||||||||||||||||||
|---|---|---|---|---|---|---|---|---|---|---|---|---|---|---|---|---|---|---|---|---|---|---|---|---|---|---|---|---|---|---|---|---|---|---|---|---|---|---|---|---|---|---|---|---|---|---|---|---|---|---|---|---|---|---|---|---|---|---|---|---|---|---|---|---|---|---|---|---|---|---|---|---|---|---|---|---|---|---|---|---|---|---|---|---|---|
Jun. 30, 2023 | |||||||||||||||||||||||||||||||||||||||||||||||||||||||||||||||||||||||||||||||||||||
| Related Party Transactions [Abstract] | |||||||||||||||||||||||||||||||||||||||||||||||||||||||||||||||||||||||||||||||||||||
| RELATED PARTY TRANSACTIONS | 10. RELATED PARTY TRANSACTIONS
Related party transactions are made on terms agreed upon by the related parties. The balances with related parties are unsecured, non-interest bearing, and due on demand. Related party transactions not disclosed elsewhere in the consolidated financial statements are as follows:
(a) Silvercorp Metals Inc. (“Silvercorp”) has one director and one officer (June 30, 2022 – two directors and one officer) in common with the Company. Silvercorp and the Company share office space and Silvercorp provides various general and administrative services to the Company. The Company expects to continue making payments to Silvercorp in the normal course of business. Office and administrative
expenses rendered and incurred by Silvercorp on behalf of the Company for the year ended June 30, 2023 were $844,949 (year ended June 30, 2022 - $726,387).
During the year ended June 30, 2022, the Company’s subsidiary Qinghai Found borrowed a loan of $283,688 (RMB ¥1.9 million) from one of Silvercorp’s subsidiaries in China to facilitate the closure of the RZY compensation transaction. During the year ended June 30, 2023, the loan plus interest of $23,422 were repaid in full.
The remuneration of directors and other members of key management personnel for the years ended June 30, 2023 and 2022 are as follows:
Other than as disclosed above, the Company does not have any ongoing contractual or other commitments resulting from transactions with related parties. |
||||||||||||||||||||||||||||||||||||||||||||||||||||||||||||||||||||||||||||||||||||
Share Capital |
12 Months Ended | ||||||||||||||||||||||||||||||||||||||||||||||||||||||||||||||||||||||||||||||||||||||||||||||||||||||||||||||||||||||||||||||||||||||||||||||||||||||||||||||||||||||||||||||||||||||||||||||||||||||||||||||||||||||||||||||||||||||||||||||||||||||||||||||||||||||||||||||||||||||||||||||||||||||||||||||||||||||||||||||||||||||||||||||||||||||||||||||||||||||||||||||||||||||||||||||||||||||||||||||||||||||||||||||||||||||||||||||||||||||||||||||||||||||||||||||||||||||||||||||||||||||||||||||||||||||||||||||||||||||||||||||||||||||||||||||||||||||||||||||||||||||||||||||||||||||||||||||||||||||||||||||||||||||||||||||||||||||||||||||||||||||||||||||||||||||||||||||||||||||||||||||||||||
|---|---|---|---|---|---|---|---|---|---|---|---|---|---|---|---|---|---|---|---|---|---|---|---|---|---|---|---|---|---|---|---|---|---|---|---|---|---|---|---|---|---|---|---|---|---|---|---|---|---|---|---|---|---|---|---|---|---|---|---|---|---|---|---|---|---|---|---|---|---|---|---|---|---|---|---|---|---|---|---|---|---|---|---|---|---|---|---|---|---|---|---|---|---|---|---|---|---|---|---|---|---|---|---|---|---|---|---|---|---|---|---|---|---|---|---|---|---|---|---|---|---|---|---|---|---|---|---|---|---|---|---|---|---|---|---|---|---|---|---|---|---|---|---|---|---|---|---|---|---|---|---|---|---|---|---|---|---|---|---|---|---|---|---|---|---|---|---|---|---|---|---|---|---|---|---|---|---|---|---|---|---|---|---|---|---|---|---|---|---|---|---|---|---|---|---|---|---|---|---|---|---|---|---|---|---|---|---|---|---|---|---|---|---|---|---|---|---|---|---|---|---|---|---|---|---|---|---|---|---|---|---|---|---|---|---|---|---|---|---|---|---|---|---|---|---|---|---|---|---|---|---|---|---|---|---|---|---|---|---|---|---|---|---|---|---|---|---|---|---|---|---|---|---|---|---|---|---|---|---|---|---|---|---|---|---|---|---|---|---|---|---|---|---|---|---|---|---|---|---|---|---|---|---|---|---|---|---|---|---|---|---|---|---|---|---|---|---|---|---|---|---|---|---|---|---|---|---|---|---|---|---|---|---|---|---|---|---|---|---|---|---|---|---|---|---|---|---|---|---|---|---|---|---|---|---|---|---|---|---|---|---|---|---|---|---|---|---|---|---|---|---|---|---|---|---|---|---|---|---|---|---|---|---|---|---|---|---|---|---|---|---|---|---|---|---|---|---|---|---|---|---|---|---|---|---|---|---|---|---|---|---|---|---|---|---|---|---|---|---|---|---|---|---|---|---|---|---|---|---|---|---|---|---|---|---|---|---|---|---|---|---|---|---|---|---|---|---|---|---|---|---|---|---|---|---|---|---|---|---|---|---|---|---|---|---|---|---|---|---|---|---|---|---|---|---|---|---|---|---|---|---|---|---|---|---|---|---|---|---|---|---|---|---|---|---|---|---|---|---|---|---|---|---|---|---|---|---|---|---|---|---|---|---|---|---|---|---|---|---|---|---|---|---|---|---|---|---|---|---|---|---|---|---|---|---|---|---|---|---|---|---|---|---|---|---|---|---|---|---|---|---|---|---|---|---|---|---|---|---|---|---|---|---|---|---|---|---|---|---|---|---|---|---|---|---|---|---|---|---|---|---|---|---|---|---|---|---|---|---|---|---|---|---|---|---|---|---|---|---|---|---|---|---|---|---|---|---|---|---|---|---|---|---|---|---|---|---|---|---|---|---|---|---|---|---|---|---|---|---|---|---|---|---|---|---|---|---|---|---|---|---|---|---|---|---|---|---|---|---|---|---|---|---|---|---|---|---|---|---|---|---|---|---|---|---|---|---|---|---|---|---|---|---|---|---|---|---|---|---|---|---|---|---|---|---|---|---|---|---|---|---|---|---|
Jun. 30, 2023 | |||||||||||||||||||||||||||||||||||||||||||||||||||||||||||||||||||||||||||||||||||||||||||||||||||||||||||||||||||||||||||||||||||||||||||||||||||||||||||||||||||||||||||||||||||||||||||||||||||||||||||||||||||||||||||||||||||||||||||||||||||||||||||||||||||||||||||||||||||||||||||||||||||||||||||||||||||||||||||||||||||||||||||||||||||||||||||||||||||||||||||||||||||||||||||||||||||||||||||||||||||||||||||||||||||||||||||||||||||||||||||||||||||||||||||||||||||||||||||||||||||||||||||||||||||||||||||||||||||||||||||||||||||||||||||||||||||||||||||||||||||||||||||||||||||||||||||||||||||||||||||||||||||||||||||||||||||||||||||||||||||||||||||||||||||||||||||||||||||||||||||||||||||||
| Share Capital [Abstract] | |||||||||||||||||||||||||||||||||||||||||||||||||||||||||||||||||||||||||||||||||||||||||||||||||||||||||||||||||||||||||||||||||||||||||||||||||||||||||||||||||||||||||||||||||||||||||||||||||||||||||||||||||||||||||||||||||||||||||||||||||||||||||||||||||||||||||||||||||||||||||||||||||||||||||||||||||||||||||||||||||||||||||||||||||||||||||||||||||||||||||||||||||||||||||||||||||||||||||||||||||||||||||||||||||||||||||||||||||||||||||||||||||||||||||||||||||||||||||||||||||||||||||||||||||||||||||||||||||||||||||||||||||||||||||||||||||||||||||||||||||||||||||||||||||||||||||||||||||||||||||||||||||||||||||||||||||||||||||||||||||||||||||||||||||||||||||||||||||||||||||||||||||||||
| SHARE CAPITAL | 11. SHARE CAPITAL
The Company’s authorized share capital consists of an unlimited number of common shares without par value.
The Company has a share-based compensation plan (the “Plan”) under which the Company may issue stock options and restricted share units (“RSUs”). The maximum number of common shares to be reserved for issuance on any share-based compensation under the Plan is a rolling 10% of the issued and outstanding common shares from time to time.
For the year ended June 30, 2023, a total of $3,162,449 (year ended June 30, 2022 - $941,647) was recorded as share-based compensation expense.
For the year ended June 30, 2023, a total of $82,164 (year ended June 30, 2022 - $19,837) was included in the project evaluation and corporate development expense.
For the year ended June 30, 2023, a total of $1,303,558 (year ended June 30, 2022 - $164,943) was capitalized under mineral property interests.
The continuity schedule of stock options, as at June 30, 2023, is as follows:
During the year ended June 30, 2023, a total of 1,186,000 (year ended June 30, 2022 – 2,702,000) options with a life of five years were granted to directors, officers, and employees at an exercise price of CAD$3.42 to CAD$3.92 (year ended June 30, 2022 – CAD$3.33 to CAD$4.00) per share subject to a vesting schedule over a three-year term with 1/6 of the options vesting every 6 months after the date of grant until fully vested.
The fair value of the options granted during the year ended June 30, 2023 and 2022 were calculated as of the date of grant using the Black-Scholes option pricing model with the following weighted average assumptions:
The weighted average grant date fair value of options granted during the year ended June 30, 2023, was CAD$1.75 (year ended June 30, 2022 – CAD$1.80). Volatility was determined based on the historical volatility of the Company’s shares over the estimated life of stock options.
The following table summarizes information about stock options outstanding as at June 30, 2023:
Subsequent to June 30, 2023, a total of 4,000 options with exercise price of CAD$4.00 were forfeited.
The continuity schedule of RSUs, as at June 30, 2023, is as follows:
During the year ended June 30, 2023, a total of 967,000 (year ended June 30, 2022 – 1,299,000) RSUs were granted to directors, officers, employees, and consultants of the Company at grant date closing price of CAD$3.42 to CAD$3.92 per share (year ended June 30, 2022 – CAD$3.33 to CAD$4.00 per share) subject to a vesting schedule over a three-year term with 1/6 of the RSUs vesting every six months from the date of grant.
Subsequent to June 30, 2023, a total of 114,168 RSUs were vested and distributed.
On February 28, 2023, the Company closed a private placement to issue a total of 90,090 common shares at a price of CAD$3.33 (US$2.45) per share for gross proceeds of $220,442. The Company’s president, Mr. Andrew Williams, subscribed 75,075 common shares and one of the Company’s director, Mr. Dickson Hall, subscribed 15,015 common shares in this private placement.
Anti-dilutive options that are not included in the diluted loss per share calculation were for the year ended June 30, 2023 (year ended June 30, 2022 – ). |
||||||||||||||||||||||||||||||||||||||||||||||||||||||||||||||||||||||||||||||||||||||||||||||||||||||||||||||||||||||||||||||||||||||||||||||||||||||||||||||||||||||||||||||||||||||||||||||||||||||||||||||||||||||||||||||||||||||||||||||||||||||||||||||||||||||||||||||||||||||||||||||||||||||||||||||||||||||||||||||||||||||||||||||||||||||||||||||||||||||||||||||||||||||||||||||||||||||||||||||||||||||||||||||||||||||||||||||||||||||||||||||||||||||||||||||||||||||||||||||||||||||||||||||||||||||||||||||||||||||||||||||||||||||||||||||||||||||||||||||||||||||||||||||||||||||||||||||||||||||||||||||||||||||||||||||||||||||||||||||||||||||||||||||||||||||||||||||||||||||||||||||||||||
Non-Controlling Interest |
12 Months Ended | ||||||||||||||||||||||||||||||||||||||||
|---|---|---|---|---|---|---|---|---|---|---|---|---|---|---|---|---|---|---|---|---|---|---|---|---|---|---|---|---|---|---|---|---|---|---|---|---|---|---|---|---|---|
Jun. 30, 2023 | |||||||||||||||||||||||||||||||||||||||||
| Non-Controlling Interest [Abstract] | |||||||||||||||||||||||||||||||||||||||||
| NON-CONTROLLING INTEREST | 12. NON-CONTROLLING INTEREST
As at June 30, 2023 and June 30, 2022, the non-controlling interest in the Company’s subsidiary Qinghai Found was 18%. |
||||||||||||||||||||||||||||||||||||||||
Financial Instruments |
12 Months Ended | ||||||||||||||||||||||||||||||||||||||||||||||||||||||||||||||||||||||||||||||||||||||||||||||||||||||||||||||||||||||||||||||||||||||||||||||||||||||||||||||||||||||||||||||||||||||||||||||||||||||||||||||||||||||||||||||||||||||||||||||||||||||||||||||||||||||||||||||||||||||||||||||||||||||||||||||||||||||||||||||||||||||||||||||||||||||||||||||||||||||||||||||||||||||||||||||||||
|---|---|---|---|---|---|---|---|---|---|---|---|---|---|---|---|---|---|---|---|---|---|---|---|---|---|---|---|---|---|---|---|---|---|---|---|---|---|---|---|---|---|---|---|---|---|---|---|---|---|---|---|---|---|---|---|---|---|---|---|---|---|---|---|---|---|---|---|---|---|---|---|---|---|---|---|---|---|---|---|---|---|---|---|---|---|---|---|---|---|---|---|---|---|---|---|---|---|---|---|---|---|---|---|---|---|---|---|---|---|---|---|---|---|---|---|---|---|---|---|---|---|---|---|---|---|---|---|---|---|---|---|---|---|---|---|---|---|---|---|---|---|---|---|---|---|---|---|---|---|---|---|---|---|---|---|---|---|---|---|---|---|---|---|---|---|---|---|---|---|---|---|---|---|---|---|---|---|---|---|---|---|---|---|---|---|---|---|---|---|---|---|---|---|---|---|---|---|---|---|---|---|---|---|---|---|---|---|---|---|---|---|---|---|---|---|---|---|---|---|---|---|---|---|---|---|---|---|---|---|---|---|---|---|---|---|---|---|---|---|---|---|---|---|---|---|---|---|---|---|---|---|---|---|---|---|---|---|---|---|---|---|---|---|---|---|---|---|---|---|---|---|---|---|---|---|---|---|---|---|---|---|---|---|---|---|---|---|---|---|---|---|---|---|---|---|---|---|---|---|---|---|---|---|---|---|---|---|---|---|---|---|---|---|---|---|---|---|---|---|---|---|---|---|---|---|---|---|---|---|---|---|---|---|---|---|---|---|---|---|---|---|---|---|---|---|---|---|---|---|---|---|---|---|---|---|---|---|---|---|---|---|---|---|---|---|---|---|---|---|---|---|---|---|---|---|---|---|---|---|---|---|---|---|---|---|---|---|
Jun. 30, 2023 | |||||||||||||||||||||||||||||||||||||||||||||||||||||||||||||||||||||||||||||||||||||||||||||||||||||||||||||||||||||||||||||||||||||||||||||||||||||||||||||||||||||||||||||||||||||||||||||||||||||||||||||||||||||||||||||||||||||||||||||||||||||||||||||||||||||||||||||||||||||||||||||||||||||||||||||||||||||||||||||||||||||||||||||||||||||||||||||||||||||||||||||||||||||||||||||||||||
| Financial Instruments [Abstract] | |||||||||||||||||||||||||||||||||||||||||||||||||||||||||||||||||||||||||||||||||||||||||||||||||||||||||||||||||||||||||||||||||||||||||||||||||||||||||||||||||||||||||||||||||||||||||||||||||||||||||||||||||||||||||||||||||||||||||||||||||||||||||||||||||||||||||||||||||||||||||||||||||||||||||||||||||||||||||||||||||||||||||||||||||||||||||||||||||||||||||||||||||||||||||||||||||||
| FINANCIAL INSTRUMENTS | 13. FINANCIAL INSTRUMENTS
The Company manages its exposure to financial risks, including liquidity risk, foreign exchange rate risk, interest rate risk, credit risk, and equity price risk in accordance with its risk management framework. The Board of Directors has overall responsibility for the establishment and oversight of the Company’s risk management framework and reviews the Company’s policies on an ongoing basis.
The Company classifies its fair value measurements within a fair value hierarchy, which reflects the significance of inputs used in making the measurements as defined in IFRS 13 – Fair Value Measurement (“IFRS 13”).
Level 1 – Unadjusted quoted prices at the measurement date for identical assets or liabilities in active markets.
Level 2 – Observable inputs other than quoted prices included in Level 1, such as quoted prices for similar assets and liabilities in active markets; quoted prices for identical or similar assets and liabilities in markets that are not active; or other inputs that are observable or can be corroborated by observable market data.
Level 3 – Unobservable inputs which are supported by little or no market activity.
The following table sets forth the Company’s financial assets that are measured at fair value on a recurring basis by level within the fair value hierarchy as at June 30, 2023 and June 30, 2022 that are not otherwise disclosed. As required by IFRS 13, financial assets are classified in their entirety based on the lowest level of input that is significant to the fair value measurement.
Fair value of other financial instruments excluded from the table above approximates their carrying amount as of June 30, 2023, and June 30, 2022, respectively, due to the short-term nature of these instruments.
There were no transfers into or out of Level 3 during the year ended June 30, 2023.
The Company has a history of losses and no operating revenues from its operations. Liquidity risk is the risk that the Company will not be able to meet its short term business requirements. As at June 30, 2023, the Company had a working capital position of $5,211,294 and sufficient cash resources to meet the Company’s short-term financial liabilities and its planned exploration and development expenditures on various projects in Bolivia for, but not limited to, the next 12 months.
In the normal course of business, the Company enters into contracts that give rise to commitments for future minimum payments. The following summarizes the remaining contractual maturities of the Company’s financial liabilities:
The Company is exposed to foreign exchange risk when it undertakes transactions and holds assets and liabilities denominated in foreign currencies other than its functional currencies. The functional currency of the head office, Canadian subsidiaries and all intermediate holding companies is CAD. The functional currency of all Bolivian subsidiaries is USD. The functional currency of the Chinese subsidiary is RMB. The Company currently does not engage in foreign exchange currency hedging. The Company’s exposure to foreign exchange risk that could affect net income is summarized as follows:
As at June 30, 2023, with other variables unchanged, a 1% strengthening (weakening) of the USD against the CAD would have increased (decreased) net income by approximately $2,500.
As at June 30, 2023, with other variables unchanged, a 1% strengthening (weakening) of the Bolivianos against the USD would have increased (decreased) net income by approximately $6,800.
Interest rate risk is the risk that the fair value or future cash flows of a financial instrument will fluctuate due to changes in market interest rates. The Company holds a portion of cash in bank accounts that earn variable interest rates. Due to the short-term nature of these financial instruments, fluctuations in market rates do not have significant impact on the fair values of the financial instruments as of June 30, 2023. The Company, from time to time, also owns guaranteed investment certificates (“GICs”) and bonds that earn interest payments at fixed rates to maturity. Fluctuation in market interest rates usually will have an impact on bond’s fair value. An increase in market interest rates will generally reduce bond’s fair value while a decrease in market interest rates will generally increase it. The Company monitors market interest rate fluctuations closely and adjusts the investment portfolio accordingly.
Credit risk is the risk of financial loss to the Company if the counterparty to a financial instrument fails to meet its contractual obligations. The Company’s exposure to credit risk is primarily associated with cash, bonds, and receivables. The carrying amount of financial assets included on the statement of financial position represents the maximum credit exposure.
The Company has deposits of cash that meet minimum requirements for quality and liquidity as stipulated by the Board. Management believes the risk of loss to be remote, as the majority of its cash are held with major financial institutions. Bonds by nature are exposed to more credit risk than cash. The Company manages its risk associated with bonds by only investing in large globally recognized corporations from diversified industries. As at June 30, 2023, the Company had a receivables balance of $421,860 (June 30, 2022 - $3,193,926). There were no material amounts in receivables which were past due on June 30, 2023 (June 30, 2022 - $).
The Company holds certain marketable securities that will fluctuate in value as a result of trading on global financial markets. Based upon the Company’s portfolio at June 30, 2023, a 10% increase (decrease) in the market price of the securities held, ignoring any foreign exchange effects would have resulted in an increase (decrease) to net income of approximately $30,000. |
||||||||||||||||||||||||||||||||||||||||||||||||||||||||||||||||||||||||||||||||||||||||||||||||||||||||||||||||||||||||||||||||||||||||||||||||||||||||||||||||||||||||||||||||||||||||||||||||||||||||||||||||||||||||||||||||||||||||||||||||||||||||||||||||||||||||||||||||||||||||||||||||||||||||||||||||||||||||||||||||||||||||||||||||||||||||||||||||||||||||||||||||||||||||||||||||||
Capital Management |
12 Months Ended |
|---|---|
Jun. 30, 2023 | |
| Capital Management [Abstract] | |
| CAPITAL MANAGEMENT | 14. CAPITAL MANAGEMENT
The objectives of the capital management policy are to safeguard the Company’s ability to support exploration and operating requirements on an ongoing basis, continue the investment in high quality assets along with safeguarding the value of its mineral properties, and support any expansionary plans.
The capital of the Company consists of the items included in equity less cash and bonds. Risk and capital management are primarily the responsibility of the Company’s corporate finance function and is monitored by the Board. The Company manages the capital structure and makes adjustments depending on economic conditions. Significant risks are monitored and actions are taken, when necessary, according to the Company’s approved policies. |
Income Taxes |
12 Months Ended | ||||||||||||||||||||||||||||||||||||||||||||||||||||||||||||||||||||||||||||||||||||||||||||||||||||||||||||||||||||||||||||||||||||||||||||||||||||||||||||||||||||||||||||||||||||||||||||||||||||||||||||||||||||||||||||||||||||||||||||||||||||||||||||||||||||||||||||||||||||||||||||||||||||||||||||||||||||||||||||||
|---|---|---|---|---|---|---|---|---|---|---|---|---|---|---|---|---|---|---|---|---|---|---|---|---|---|---|---|---|---|---|---|---|---|---|---|---|---|---|---|---|---|---|---|---|---|---|---|---|---|---|---|---|---|---|---|---|---|---|---|---|---|---|---|---|---|---|---|---|---|---|---|---|---|---|---|---|---|---|---|---|---|---|---|---|---|---|---|---|---|---|---|---|---|---|---|---|---|---|---|---|---|---|---|---|---|---|---|---|---|---|---|---|---|---|---|---|---|---|---|---|---|---|---|---|---|---|---|---|---|---|---|---|---|---|---|---|---|---|---|---|---|---|---|---|---|---|---|---|---|---|---|---|---|---|---|---|---|---|---|---|---|---|---|---|---|---|---|---|---|---|---|---|---|---|---|---|---|---|---|---|---|---|---|---|---|---|---|---|---|---|---|---|---|---|---|---|---|---|---|---|---|---|---|---|---|---|---|---|---|---|---|---|---|---|---|---|---|---|---|---|---|---|---|---|---|---|---|---|---|---|---|---|---|---|---|---|---|---|---|---|---|---|---|---|---|---|---|---|---|---|---|---|---|---|---|---|---|---|---|---|---|---|---|---|---|---|---|---|---|---|---|---|---|---|---|---|---|---|---|---|---|---|---|---|---|---|---|---|---|---|---|---|---|---|---|---|---|---|---|---|---|---|---|---|---|---|---|---|---|---|---|---|---|---|---|---|---|---|---|
Jun. 30, 2023 | |||||||||||||||||||||||||||||||||||||||||||||||||||||||||||||||||||||||||||||||||||||||||||||||||||||||||||||||||||||||||||||||||||||||||||||||||||||||||||||||||||||||||||||||||||||||||||||||||||||||||||||||||||||||||||||||||||||||||||||||||||||||||||||||||||||||||||||||||||||||||||||||||||||||||||||||||||||||||||||||
| Income Taxes [Abstract] | |||||||||||||||||||||||||||||||||||||||||||||||||||||||||||||||||||||||||||||||||||||||||||||||||||||||||||||||||||||||||||||||||||||||||||||||||||||||||||||||||||||||||||||||||||||||||||||||||||||||||||||||||||||||||||||||||||||||||||||||||||||||||||||||||||||||||||||||||||||||||||||||||||||||||||||||||||||||||||||||
| INCOME TAXES | 15. INCOME TAXES
The provision for income taxes differs from the amount computed by applying the cumulative Canadian federal and provincial income tax rates to the loss before income tax provision due to the following:
Deferred tax assets are recognized to the extent that the realization of the related tax benefit through future taxable profit is probable. The ability to realize the tax benefits is dependent upon numerous factors, including the future profitability of operations in the jurisdiction in which the tax benefit arise. Deductible temporary differences and unused tax losses for which no deferred tax assets have been recognized are attributable to the following:
As of June 30, 2023, the Company has the following net operating losses, expiring various years to 2043 and available to offset future taxable income in Canada, Bolivia and China, respectively:
As at June 30, 2023, the Company had capital loss carry forward of $19,072,271 that can be carried indefinitely in Canada (June 30, 2022 - $19,596,218). |
||||||||||||||||||||||||||||||||||||||||||||||||||||||||||||||||||||||||||||||||||||||||||||||||||||||||||||||||||||||||||||||||||||||||||||||||||||||||||||||||||||||||||||||||||||||||||||||||||||||||||||||||||||||||||||||||||||||||||||||||||||||||||||||||||||||||||||||||||||||||||||||||||||||||||||||||||||||||||||||
Segmented Information |
12 Months Ended | ||||||||||||||||||||||||||||||||||||||||||||||||||||||||||||||||||||||||||||||||||||||||||||||||||||||||||||||||||||||||||||||||||||||||||||||||||||||||||||||||||||||||||||||||||||||||||||||||||||||||||||||||||||||||||||||||||||||||||||||||||||||||||||||||||||||||||||||||||||||||||||||||||||||||||||||||||||||||||||||||||||||||||||||||||||||||||||||||||||||||||||||||||||||||||||||||||||||||||||||||||||||||||||||||||||||||||||||||||||||||||||||||||||||||||||||||||||||||||||||||||||||||||||||||||||||||||||||||||||||||||||||||||||||||||||||||||||||||||||||||||||||||||||||||||||||||||||||||||||||||||||||||||||||||||||||||||||||||||||||||||||||||||||||||||||||||||||||||||||||||||||||||||||||||||||||||||||||||||||||||||||||||||||||||||||||||||||||||||||||||||||||||||||||||||||||||||||||||||||||||||||||||||||||||||||||||||||||||||||||||||||||||||||||||||||||||||||||||||||||||||||||||||||||||||||||||||||||||||||||||||||||||||||||||||||||||||||||||||||||||||||||||||||||||||||||||||||||||||||||
|---|---|---|---|---|---|---|---|---|---|---|---|---|---|---|---|---|---|---|---|---|---|---|---|---|---|---|---|---|---|---|---|---|---|---|---|---|---|---|---|---|---|---|---|---|---|---|---|---|---|---|---|---|---|---|---|---|---|---|---|---|---|---|---|---|---|---|---|---|---|---|---|---|---|---|---|---|---|---|---|---|---|---|---|---|---|---|---|---|---|---|---|---|---|---|---|---|---|---|---|---|---|---|---|---|---|---|---|---|---|---|---|---|---|---|---|---|---|---|---|---|---|---|---|---|---|---|---|---|---|---|---|---|---|---|---|---|---|---|---|---|---|---|---|---|---|---|---|---|---|---|---|---|---|---|---|---|---|---|---|---|---|---|---|---|---|---|---|---|---|---|---|---|---|---|---|---|---|---|---|---|---|---|---|---|---|---|---|---|---|---|---|---|---|---|---|---|---|---|---|---|---|---|---|---|---|---|---|---|---|---|---|---|---|---|---|---|---|---|---|---|---|---|---|---|---|---|---|---|---|---|---|---|---|---|---|---|---|---|---|---|---|---|---|---|---|---|---|---|---|---|---|---|---|---|---|---|---|---|---|---|---|---|---|---|---|---|---|---|---|---|---|---|---|---|---|---|---|---|---|---|---|---|---|---|---|---|---|---|---|---|---|---|---|---|---|---|---|---|---|---|---|---|---|---|---|---|---|---|---|---|---|---|---|---|---|---|---|---|---|---|---|---|---|---|---|---|---|---|---|---|---|---|---|---|---|---|---|---|---|---|---|---|---|---|---|---|---|---|---|---|---|---|---|---|---|---|---|---|---|---|---|---|---|---|---|---|---|---|---|---|---|---|---|---|---|---|---|---|---|---|---|---|---|---|---|---|---|---|---|---|---|---|---|---|---|---|---|---|---|---|---|---|---|---|---|---|---|---|---|---|---|---|---|---|---|---|---|---|---|---|---|---|---|---|---|---|---|---|---|---|---|---|---|---|---|---|---|---|---|---|---|---|---|---|---|---|---|---|---|---|---|---|---|---|---|---|---|---|---|---|---|---|---|---|---|---|---|---|---|---|---|---|---|---|---|---|---|---|---|---|---|---|---|---|---|---|---|---|---|---|---|---|---|---|---|---|---|---|---|---|---|---|---|---|---|---|---|---|---|---|---|---|---|---|---|---|---|---|---|---|---|---|---|---|---|---|---|---|---|---|---|---|---|---|---|---|---|---|---|---|---|---|---|---|---|---|---|---|---|---|---|---|---|---|---|---|---|---|---|---|---|---|---|---|---|---|---|---|---|---|---|---|---|---|---|---|---|---|---|---|---|---|---|---|---|---|---|---|---|---|---|---|---|---|---|---|---|---|---|---|---|---|---|---|---|---|---|---|---|---|---|---|---|---|---|---|---|---|---|---|---|---|---|---|---|---|---|---|---|---|---|---|---|---|---|---|---|---|---|---|---|---|---|---|---|---|---|---|---|---|---|---|---|---|---|---|---|---|---|---|---|---|---|---|---|---|---|---|---|---|---|---|---|---|---|---|---|---|---|---|---|---|---|---|---|---|---|---|---|---|---|---|---|---|---|---|---|---|---|---|---|---|---|---|---|---|---|---|---|---|---|---|---|---|---|---|---|---|---|---|---|---|---|---|---|---|---|---|---|---|---|---|---|---|---|---|---|---|---|---|---|---|---|---|---|---|---|---|---|---|---|---|---|---|---|---|---|---|---|---|---|---|---|---|---|---|---|---|---|---|---|---|---|---|---|---|---|---|---|---|---|---|---|---|---|---|---|---|---|---|---|---|---|---|---|---|---|---|---|---|---|---|---|---|---|---|---|---|---|---|---|---|---|---|---|---|---|---|---|---|---|---|---|---|---|---|---|---|---|---|---|---|---|---|---|---|---|---|---|---|---|---|---|---|---|---|---|---|---|---|---|---|---|---|---|---|---|---|---|---|---|---|---|---|---|---|---|---|---|---|---|---|---|---|---|---|---|---|---|---|---|---|---|---|---|---|---|---|---|---|---|---|---|---|---|---|---|---|---|---|---|---|---|---|---|---|---|---|---|---|---|---|---|---|---|---|---|---|---|---|---|---|---|---|---|---|---|---|---|---|---|---|---|---|---|---|---|---|---|---|---|---|---|---|---|---|---|---|---|---|---|---|---|---|---|---|---|---|---|---|---|---|---|---|---|---|---|---|---|---|---|---|---|---|---|---|---|---|---|---|---|---|---|---|---|---|---|---|---|---|---|---|---|---|---|---|---|---|---|
Jun. 30, 2023 | |||||||||||||||||||||||||||||||||||||||||||||||||||||||||||||||||||||||||||||||||||||||||||||||||||||||||||||||||||||||||||||||||||||||||||||||||||||||||||||||||||||||||||||||||||||||||||||||||||||||||||||||||||||||||||||||||||||||||||||||||||||||||||||||||||||||||||||||||||||||||||||||||||||||||||||||||||||||||||||||||||||||||||||||||||||||||||||||||||||||||||||||||||||||||||||||||||||||||||||||||||||||||||||||||||||||||||||||||||||||||||||||||||||||||||||||||||||||||||||||||||||||||||||||||||||||||||||||||||||||||||||||||||||||||||||||||||||||||||||||||||||||||||||||||||||||||||||||||||||||||||||||||||||||||||||||||||||||||||||||||||||||||||||||||||||||||||||||||||||||||||||||||||||||||||||||||||||||||||||||||||||||||||||||||||||||||||||||||||||||||||||||||||||||||||||||||||||||||||||||||||||||||||||||||||||||||||||||||||||||||||||||||||||||||||||||||||||||||||||||||||||||||||||||||||||||||||||||||||||||||||||||||||||||||||||||||||||||||||||||||||||||||||||||||||||||||||||||||||||||
| Segmented Information [Abstract] | |||||||||||||||||||||||||||||||||||||||||||||||||||||||||||||||||||||||||||||||||||||||||||||||||||||||||||||||||||||||||||||||||||||||||||||||||||||||||||||||||||||||||||||||||||||||||||||||||||||||||||||||||||||||||||||||||||||||||||||||||||||||||||||||||||||||||||||||||||||||||||||||||||||||||||||||||||||||||||||||||||||||||||||||||||||||||||||||||||||||||||||||||||||||||||||||||||||||||||||||||||||||||||||||||||||||||||||||||||||||||||||||||||||||||||||||||||||||||||||||||||||||||||||||||||||||||||||||||||||||||||||||||||||||||||||||||||||||||||||||||||||||||||||||||||||||||||||||||||||||||||||||||||||||||||||||||||||||||||||||||||||||||||||||||||||||||||||||||||||||||||||||||||||||||||||||||||||||||||||||||||||||||||||||||||||||||||||||||||||||||||||||||||||||||||||||||||||||||||||||||||||||||||||||||||||||||||||||||||||||||||||||||||||||||||||||||||||||||||||||||||||||||||||||||||||||||||||||||||||||||||||||||||||||||||||||||||||||||||||||||||||||||||||||||||||||||||||||||||||||
| SEGMENTED INFORMATION | 16. SEGMENTED INFORMATION
As at and for the year ended June 30, 2023, the Company operates in four (as at and for the year ended June 30, 2022 – four) reportable operating segments, one being the corporate segment; the other three being the exploration and development segments based on mineral properties in Bolivia. These reportable segments are components of the Company where separate financial information is available that is evaluated regularly by the Company’s Chief Executive Officer, the chief operating decision maker (“CODM”).
Effective July 1, 2022, the Company revised its reportable segments to reflect recent changes in the CODM’s way of reviewing and assessing the Company’s performance. As a result, the “Silver Sand”, “Carangas”, and “Silverstrike” mineral projects, which were previously included in the “Bolivia” segment, are separately presented. The previously presented “China” reportable segment is now being reported as part of the Corporate segment. The comparative information has been reclassified as a result of these changes.
|
||||||||||||||||||||||||||||||||||||||||||||||||||||||||||||||||||||||||||||||||||||||||||||||||||||||||||||||||||||||||||||||||||||||||||||||||||||||||||||||||||||||||||||||||||||||||||||||||||||||||||||||||||||||||||||||||||||||||||||||||||||||||||||||||||||||||||||||||||||||||||||||||||||||||||||||||||||||||||||||||||||||||||||||||||||||||||||||||||||||||||||||||||||||||||||||||||||||||||||||||||||||||||||||||||||||||||||||||||||||||||||||||||||||||||||||||||||||||||||||||||||||||||||||||||||||||||||||||||||||||||||||||||||||||||||||||||||||||||||||||||||||||||||||||||||||||||||||||||||||||||||||||||||||||||||||||||||||||||||||||||||||||||||||||||||||||||||||||||||||||||||||||||||||||||||||||||||||||||||||||||||||||||||||||||||||||||||||||||||||||||||||||||||||||||||||||||||||||||||||||||||||||||||||||||||||||||||||||||||||||||||||||||||||||||||||||||||||||||||||||||||||||||||||||||||||||||||||||||||||||||||||||||||||||||||||||||||||||||||||||||||||||||||||||||||||||||||||||||||||
Supplementary Cash Flow Information |
12 Months Ended | |||||||||||||||||||||||||||||||||||||||||||||||||||||||||||||||||||||||||||||||||||||||||||||||||||
|---|---|---|---|---|---|---|---|---|---|---|---|---|---|---|---|---|---|---|---|---|---|---|---|---|---|---|---|---|---|---|---|---|---|---|---|---|---|---|---|---|---|---|---|---|---|---|---|---|---|---|---|---|---|---|---|---|---|---|---|---|---|---|---|---|---|---|---|---|---|---|---|---|---|---|---|---|---|---|---|---|---|---|---|---|---|---|---|---|---|---|---|---|---|---|---|---|---|---|---|---|
Jun. 30, 2023 | ||||||||||||||||||||||||||||||||||||||||||||||||||||||||||||||||||||||||||||||||||||||||||||||||||||
| Supplementary Cash Flow Information [Abstract] | ||||||||||||||||||||||||||||||||||||||||||||||||||||||||||||||||||||||||||||||||||||||||||||||||||||
| SUPPLEMENTARY CASH FLOW INFORMATION | 17. SUPPLEMENTARY CASH FLOW INFORMATION
|
|||||||||||||||||||||||||||||||||||||||||||||||||||||||||||||||||||||||||||||||||||||||||||||||||||
Accounting Policies, by Policy (Policies) |
12 Months Ended | ||||||||||||||||||||||||||||||||||||||||||||||||||||||||||||||||||||||||||||||||||||||||||||||||||||||||||||||||||||||||||||||||||||||||||||||||||||||||||||||||||||||||||||||||
|---|---|---|---|---|---|---|---|---|---|---|---|---|---|---|---|---|---|---|---|---|---|---|---|---|---|---|---|---|---|---|---|---|---|---|---|---|---|---|---|---|---|---|---|---|---|---|---|---|---|---|---|---|---|---|---|---|---|---|---|---|---|---|---|---|---|---|---|---|---|---|---|---|---|---|---|---|---|---|---|---|---|---|---|---|---|---|---|---|---|---|---|---|---|---|---|---|---|---|---|---|---|---|---|---|---|---|---|---|---|---|---|---|---|---|---|---|---|---|---|---|---|---|---|---|---|---|---|---|---|---|---|---|---|---|---|---|---|---|---|---|---|---|---|---|---|---|---|---|---|---|---|---|---|---|---|---|---|---|---|---|---|---|---|---|---|---|---|---|---|---|---|---|---|---|---|---|---|
Jun. 30, 2023 | |||||||||||||||||||||||||||||||||||||||||||||||||||||||||||||||||||||||||||||||||||||||||||||||||||||||||||||||||||||||||||||||||||||||||||||||||||||||||||||||||||||||||||||||||
| Significant Accounting Policies [Abstract] | |||||||||||||||||||||||||||||||||||||||||||||||||||||||||||||||||||||||||||||||||||||||||||||||||||||||||||||||||||||||||||||||||||||||||||||||||||||||||||||||||||||||||||||||||
| Statement of Compliance | (a) Statement of Compliance These consolidated financial statements have been prepared in accordance with International Financial Reporting Standards as issued by the International Accounting Standards Board (“IFRS”). The policies applied in these consolidated financial statements are based on IFRS in effect as of June 30, 2023. These consolidated financial statements have been prepared on a going concern basis. The consolidated financial statements of the Company as at and for the year ended June 30, 2023 were authorized for issue in accordance with a resolution of the Board of Directors (the “Board”) dated on August 23, 2023. |
||||||||||||||||||||||||||||||||||||||||||||||||||||||||||||||||||||||||||||||||||||||||||||||||||||||||||||||||||||||||||||||||||||||||||||||||||||||||||||||||||||||||||||||||
| Basis of Consolidation | (b) Basis of Consolidation These consolidated financial statements include the accounts of the Company and its wholly or partially owned subsidiaries. Subsidiaries are consolidated from the date on which the Company obtains control up to the date of the disposition of control. Control is achieved when the Company has power over the subsidiary, is exposed or has rights to variable returns from its involvement with the subsidiary; and has the ability to use its power to affect its returns. For non-wholly-owned subsidiaries over which the Company has control, the net assets attributable to outside equity shareholders are presented as “non-controlling interests” in the equity section of the consolidated statements of financial position. Net income or loss for the period that is attributable to the non-controlling interests is calculated based on the ownership of the non-controlling interest shareholders in the subsidiary. Balances, transactions, income and expenses between the Company and its subsidiaries are eliminated on consolidation.
Details of the Company’s significant subsidiaries which are consolidated are as follows:
|
||||||||||||||||||||||||||||||||||||||||||||||||||||||||||||||||||||||||||||||||||||||||||||||||||||||||||||||||||||||||||||||||||||||||||||||||||||||||||||||||||||||||||||||||
| Foreign Currency Translation | (c) Foreign Currency Translation The functional currency for each subsidiary of the Company is the currency of the primary economic environment in which the entity operates. The functional currency of the head office, Canadian subsidiaries and all intermediate holding companies is the Canadian dollar (“CAD”). The functional currency of all Bolivian subsidiaries is the US dollar (“USD”). The functional currency of the Chinese subsidiary is the Chinese Renminbi (“RMB”). Foreign currency monetary assets and liabilities are translated into the functional currency using exchange rates prevailing at the balance sheet date. Foreign currency non-monetary assets are translated using exchange rates prevailing at the transaction date. Foreign exchange gains and losses are included in the determination of net income. The consolidated financial statements are presented in USD. The financial position and results of the Company’s entities are translated from functional currencies to USD as follows:
The Company treats inter-company loan balances, which are not intended to be repaid in the foreseeable future, as part of its net investment. When a foreign entity is sold, the historical exchange differences plus the foreign exchange impact that arises on the transaction are recognized in the consolidated statement of loss as part of the gain or loss on sale.
|
||||||||||||||||||||||||||||||||||||||||||||||||||||||||||||||||||||||||||||||||||||||||||||||||||||||||||||||||||||||||||||||||||||||||||||||||||||||||||||||||||||||||||||||||
| Plant and Equipment | (d) Plant and Equipment Plant and equipment are initially recorded at cost, including all directly attributable costs to bring the assets to the location and condition necessary for it to be capable of operating in the manner intended by management. Plant and equipment are subsequently measured at cost less accumulated depreciation and applicable impairment losses. Depreciation is computed using the straight-line method based on the nature and estimated useful lives as follows:
Subsequent costs that meet the asset recognition criteria are capitalized while costs incurred that do not extend the economic useful life of an asset are considered repair and maintenance, which are accounted for as an expense recognized during the period. The Company conducts an annual assessment of the residual balances, useful lives, and depreciation methods being used for plant and equipment and any changes are applied prospectively. Assets under construction are capitalized as construction-in-progress. The cost of construction-in-progress comprises its purchase price and any costs directly attributable to bringing it into working condition for its intended use. Construction-in-progress assets are not depreciated until they are completed and available for use. |
||||||||||||||||||||||||||||||||||||||||||||||||||||||||||||||||||||||||||||||||||||||||||||||||||||||||||||||||||||||||||||||||||||||||||||||||||||||||||||||||||||||||||||||||
| Mineral Property Interests | (e) Mineral Property Interests The cost of acquiring mineral rights and properties either as an individual asset purchase or as part of a business combination is capitalized and represents the property’s fair value at the date of acquisition. Fair value is determined by estimating the value of the property’s reserves, resources and exploration potential. Exploration and evaluation costs, incurred associated with specific mineral rights and properties prior to demonstrable technical feasibility and commercial viability of extracting a mineral resource, are capitalized. The Company determines that a property is in the development stage when its technical feasibility and commercial viability are demonstrable. Costs incurred in the development stage prior to commercial production are capitalized and included in the carrying amount of the related property in the period incurred. Proceeds from sales during this period, if any, are offset against costs capitalized. |
||||||||||||||||||||||||||||||||||||||||||||||||||||||||||||||||||||||||||||||||||||||||||||||||||||||||||||||||||||||||||||||||||||||||||||||||||||||||||||||||||||||||||||||||
| Impairment of Long-lived Assets | (f) Impairment of Long-lived Assets Long-lived assets, including mineral property interests, plant and equipment are reviewed and tested for impairment when indicators of impairment are considered to exist. Impairment assessments are conducted at the level of cash-generating units (“CGU”) or at the individual asset level, whichever is the lowest level for which identifiable cash inflows are largely independent of the cash flows of other assets. An impairment loss is recognized for any excess of carrying amount of a CGU over its recoverable amount, which is the greater of its fair value less costs to sell and value in use. For mineral properties, the recoverable amount is estimated as the discounted future net cash inflows expected to be derived from expected future
production, metal prices, and net proceeds from the disposition of assets on retirement, less operating and capital costs. Impairment losses are recognized in the period they are incurred. For exploration and evaluation assets, indication of impairment includes but is not limited to expiration of the right to explore, substantive expenditures in the specific area are neither budgeted nor planned, and exploration for and evaluation of mineral resources in the specific area have not led to the discovery of commercially viable quantities of mineral resources. Impairment losses are reversed if there is evidence the loss no longer exists or has decreased. This reversal is recognized in net income in the period the reversal occurs limited by the carrying value that would have been determined, net of any depreciation, had no impairment charge been recognized in prior years. |
||||||||||||||||||||||||||||||||||||||||||||||||||||||||||||||||||||||||||||||||||||||||||||||||||||||||||||||||||||||||||||||||||||||||||||||||||||||||||||||||||||||||||||||||
| Share-based Payments | (g) Share-based Payments The Company grants share-based awards, including restricted share units (“RSUs”) and stock options to directors, officers, employees, and consultants. For share-based awards, the fair value is charged to the consolidated statements of loss and credited to equity, on a straight-line basis over the vesting period, after adjusting for the estimated number of awards that are expected to vest. The fair value of share units is determined based on quoted market price of the Company’s common shares at the date of grant. The fair value of the stock options granted to employees, officers, and directors is determined at the date of grant using the Black-Scholes option pricing model with market related input. The fair value of stock options granted to consultants is measured at the fair value of the services delivered unless that fair value cannot be estimated reliably, which then is determined using the Black-Scholes option pricing model. Stock options with graded vesting schedules are accounted for as separate grants with different vesting periods and fair values. At each statement of financial position date prior to vesting, the cumulative expense representing the extent to which the vesting period has expired and management’s best estimate of the awards that are ultimately expected to vest is computed. The movement in cumulative expense is recognized in the consolidated statements of loss with a corresponding entry within equity. The amount recognized as expense is adjusted to reflect the number of awards for which the related service and non-market vesting conditions are expected to be met. |
||||||||||||||||||||||||||||||||||||||||||||||||||||||||||||||||||||||||||||||||||||||||||||||||||||||||||||||||||||||||||||||||||||||||||||||||||||||||||||||||||||||||||||||||
| Income Taxes | (h) Income Taxes Current tax for each taxable entity is based on the local taxable income at the local substantively enacted statutory tax rate at the balance sheet date and includes adjustments to taxes payable or recoverable in respect to previous periods. Current tax assets and current tax liabilities are only offset if a legally enforceable right exists to set off the amounts, and the Company intends to settle on a net basis, or to realize the asset and settle the liability simultaneously. Deferred tax is recognized using the liability method on temporary differences at the reporting date between the tax bases of assets and liabilities, and their carrying amounts for financial reporting purposes. Deferred tax assets are recognized for all deductible temporary differences, carry forward of unused tax credits and unused tax losses, to the extent that it is probable that taxable profit will be available against which the deductible temporary differences, and the carry forward of unused tax credits and unused tax losses, can be utilized, except:
The carrying amount of deferred tax assets is reviewed at the end of each reporting period and reduced to the extent that it is no longer probable that sufficient taxable profit will be available to allow all or part of the deferred tax asset to be utilized. Unrecognized deferred tax assets are reassessed at the end of each reporting period and are recognized to the extent that it has become probable that future taxable profit will be available to allow the deferred tax asset to be recovered. Deferred tax assets and liabilities are measured at the tax rates that are expected to apply to the year when the asset is realized or the liability is settled, based on tax rates and tax laws that have been substantively enacted by the end of the reporting period. Deferred tax relating to items recognized outside profit or loss is recognized in other comprehensive income or directly in equity. Deferred tax assets and deferred tax liabilities are offset, if a legally enforceable right exists to set off current tax assets against current tax liabilities and the deferred taxes relate to the same taxable entity and the same taxation authority. |
||||||||||||||||||||||||||||||||||||||||||||||||||||||||||||||||||||||||||||||||||||||||||||||||||||||||||||||||||||||||||||||||||||||||||||||||||||||||||||||||||||||||||||||||
| Earnings (loss) per Share | (i) Earnings (loss) per Share Earnings (loss) per share is computed by dividing net income (loss) attributable to equity holders of the Company by the weighted average number of common shares outstanding for the period. Diluted earnings per share reflect the potential dilution that could occur if additional common shares are assumed to be issued under securities that entitle their holders to obtain common shares in the future. For vested RSUs, the full outstanding numbers as at the end of the period are included in the calculation of diluted earnings per share. For stock options, the number of additional shares for inclusion in diluted earnings per share calculations is determined when the exercise price is less than the average market price of the Company’s common shares; the stock options are assumed to be exercised and the proceeds are used to repurchase common shares at the average market price for the period. The incremental number of common shares issued under stock options and repurchased from proceeds is included in the calculation of diluted earnings per share. When loss per share is presented in the period, the Company’s calculation of diluted loss per share excludes any incremental shares from the assumed calculation of RSUs and stock options as they would be anti-dilutive. |
||||||||||||||||||||||||||||||||||||||||||||||||||||||||||||||||||||||||||||||||||||||||||||||||||||||||||||||||||||||||||||||||||||||||||||||||||||||||||||||||||||||||||||||||
| Financial Instruments | (j) Financial Instruments Initial recognition: On initial recognition, all financial assets and financial liabilities are recorded at fair value adjusted for directly attributable transaction costs except for financial assets and liabilities classified as fair value through profit or loss (“FVTPL”), in which case transaction costs are expensed as incurred. Subsequent measurement of financial assets: Subsequent measurement of financial assets depends on the classification of such assets.
IFRS 9 includes a single model that has only two classification categories for financial instruments other than equity instruments: amortized cost and fair value. To qualify for amortized cost accounting, the instrument must meet two criteria:
At initial recognition, for equity instruments other than held for trading, the Company may make an irrevocable election to designate it as either FVTPL or fair value through other comprehensive income (“FVTOCI”). Financial assets classified as amortized cost are measured using the effective interest method. Amortized cost is calculated by taking into account any discount or premiums on acquisition and fees that are an integral part of the effective interest method. Amortization from the effective interest method is included in finance income. Financial assets classified as FVTPL are measured at fair value with changes in fair values recognized in profit or loss. Impairment of financial assets carried at amortized cost: The Company assesses at the end of each reporting period whether there is objective evidence that financial assets or group of financial assets measured at amortized cost are impaired. Impairment losses and reversal of impairment losses, if any, are recognized in profit or loss in the period they are incurred. Subsequent measurement of financial liabilities: Financial liabilities classified as amortized cost are measured using the effective interest method. Amortized cost is calculated by taking into account any discount or premiums on acquisition and fees that are an integral part of the effective interest method. Amortization using the effective interest method is included in finance costs. The Company classifies its financial instruments as follows:
Bonds: The Company acquired bonds issued by other companies from various industries through the open market. These bonds are held to receive coupon interest payments and to realize potential gains. The bonds may also be disposed on demand through the open market should the Company require funds for other operational or investment needs. Bonds are classified as FVTPL and are measured at fair value on initial recognition and subsequent measurement. Equity investments: Equity investments represent equity interests of other publicly-traded or privately-held companies that the Company has acquired through the open market or through private placements. These equity interests consist of common shares and warrants. Equity investments are classified as FVTPL and are measured at
fair value on initial recognition and subsequent measurement. The fair value of warrants was determined using the Black-Scholes pricing model as at the acquisition date as well as at each period end. Derecognition of financial assets and financial liabilities: A financial asset is derecognized when:
Gains and losses on derecognition of financial assets and liabilities classified as amortized cost are recognized in profit or loss when the instrument is derecognized or impaired, as well as through the amortization process. A financial liability is derecognized when the obligation under the liability is discharged or cancelled or expires. When an existing financial liability is replaced by another from the same lender on substantially different terms, or the terms of an existing liability are substantially modified, such an exchange or modification is treated as a derecognition of the original liability. In this case, a new liability is recognized, and the difference in the respective carrying amounts is recognized in the consolidated statement of income. Offsetting of financial instruments: Financial assets and liabilities are offset and the net amount is reported in the consolidated statement of financial position if and only if, there is a currently enforceable legal right to offset the recognized amounts and there is an intention to settle on a net basis, or to realize the assets and settle liabilities simultaneously. Fair value of financial instruments: The fair value of financial instruments that are traded in active markets at each reporting date is determined by reference to quoted market prices, without deduction for transaction costs. For financial instruments that are not traded in active markets, the fair value is determined using appropriate valuation techniques, such as using a recent arm’s length market transaction between knowledgeable and willing parties, discounted cash flow analysis, reference to the current fair value of another instrument that is substantially the same, or other valuation models. |
||||||||||||||||||||||||||||||||||||||||||||||||||||||||||||||||||||||||||||||||||||||||||||||||||||||||||||||||||||||||||||||||||||||||||||||||||||||||||||||||||||||||||||||||
| Significant Judgments and Estimation Uncertainties |
Many amounts included in the consolidated financial statements require management to make judgments and/or estimates. These judgments and estimates are continuously evaluated and are based on management’s experience and knowledge of relevant facts and circumstances. Actual results may differ from the amounts included in the consolidated statement of financial position. Areas of significant judgment include:
Areas of significant estimates include:
The Company estimates its mineral resources based on information compiled by qualified persons as defined in accordance with National Instrument 43-101. |
||||||||||||||||||||||||||||||||||||||||||||||||||||||||||||||||||||||||||||||||||||||||||||||||||||||||||||||||||||||||||||||||||||||||||||||||||||||||||||||||||||||||||||||||
Significant Accounting Policies (Tables) |
12 Months Ended | ||||||||||||||||||||||||||||||||||||||||||||||||||||||||||||||||||||||||||||||||||||||||||||||||||||||||||||||||||||||||||||||||||||||||||||||||||||||||||||||||||||||||||||||||
|---|---|---|---|---|---|---|---|---|---|---|---|---|---|---|---|---|---|---|---|---|---|---|---|---|---|---|---|---|---|---|---|---|---|---|---|---|---|---|---|---|---|---|---|---|---|---|---|---|---|---|---|---|---|---|---|---|---|---|---|---|---|---|---|---|---|---|---|---|---|---|---|---|---|---|---|---|---|---|---|---|---|---|---|---|---|---|---|---|---|---|---|---|---|---|---|---|---|---|---|---|---|---|---|---|---|---|---|---|---|---|---|---|---|---|---|---|---|---|---|---|---|---|---|---|---|---|---|---|---|---|---|---|---|---|---|---|---|---|---|---|---|---|---|---|---|---|---|---|---|---|---|---|---|---|---|---|---|---|---|---|---|---|---|---|---|---|---|---|---|---|---|---|---|---|---|---|---|
Jun. 30, 2023 | |||||||||||||||||||||||||||||||||||||||||||||||||||||||||||||||||||||||||||||||||||||||||||||||||||||||||||||||||||||||||||||||||||||||||||||||||||||||||||||||||||||||||||||||||
| Significant Accounting Policies [Abstract] | |||||||||||||||||||||||||||||||||||||||||||||||||||||||||||||||||||||||||||||||||||||||||||||||||||||||||||||||||||||||||||||||||||||||||||||||||||||||||||||||||||||||||||||||||
| Schedule of Significant Subsidiaries which are Consolidated | Details of the Company’s significant subsidiaries which
are consolidated are as follows:
|
||||||||||||||||||||||||||||||||||||||||||||||||||||||||||||||||||||||||||||||||||||||||||||||||||||||||||||||||||||||||||||||||||||||||||||||||||||||||||||||||||||||||||||||||
| Schedule of Estimated Useful Lives | Depreciation is computed using the straight-line method based on the nature and estimated useful lives
as follows:
|
||||||||||||||||||||||||||||||||||||||||||||||||||||||||||||||||||||||||||||||||||||||||||||||||||||||||||||||||||||||||||||||||||||||||||||||||||||||||||||||||||||||||||||||||
Short-Term Investments (Tables) |
12 Months Ended | ||||||||||||||||||||||||||||||
|---|---|---|---|---|---|---|---|---|---|---|---|---|---|---|---|---|---|---|---|---|---|---|---|---|---|---|---|---|---|---|---|
Jun. 30, 2023 | |||||||||||||||||||||||||||||||
| Short-Term Investments [Abstract] | |||||||||||||||||||||||||||||||
| Schedule of Short-Term Investments | Short-term investments consist of the following:
|
||||||||||||||||||||||||||||||
| Schedule of Continuity of Short-Term Investments | The continuity of short-term investments
is summarized as follows:
|
||||||||||||||||||||||||||||||
Equity Investments (Tables) |
12 Months Ended | ||||||||||||||||||||||||||||||||||||||||||||||||||||||||||||||||||||||||||||||||||||||||||
|---|---|---|---|---|---|---|---|---|---|---|---|---|---|---|---|---|---|---|---|---|---|---|---|---|---|---|---|---|---|---|---|---|---|---|---|---|---|---|---|---|---|---|---|---|---|---|---|---|---|---|---|---|---|---|---|---|---|---|---|---|---|---|---|---|---|---|---|---|---|---|---|---|---|---|---|---|---|---|---|---|---|---|---|---|---|---|---|---|---|---|---|
Jun. 30, 2023 | |||||||||||||||||||||||||||||||||||||||||||||||||||||||||||||||||||||||||||||||||||||||||||
| Equity Investments [Abstract] | |||||||||||||||||||||||||||||||||||||||||||||||||||||||||||||||||||||||||||||||||||||||||||
| Schedule of Equity Investments | The equity investments are summarized as follows:
|
||||||||||||||||||||||||||||||||||||||||||||||||||||||||||||||||||||||||||||||||||||||||||
| Schedule of Continuity of Equity Investments | The continuity of equity investments is summarized as follows:
|
||||||||||||||||||||||||||||||||||||||||||||||||||||||||||||||||||||||||||||||||||||||||||
Income from Investments (Tables) |
12 Months Ended | ||||||||||||||||||||||||||||||||||||||||||||||||||||||
|---|---|---|---|---|---|---|---|---|---|---|---|---|---|---|---|---|---|---|---|---|---|---|---|---|---|---|---|---|---|---|---|---|---|---|---|---|---|---|---|---|---|---|---|---|---|---|---|---|---|---|---|---|---|---|---|
Jun. 30, 2023 | |||||||||||||||||||||||||||||||||||||||||||||||||||||||
| Income from Investments [Abstract] | |||||||||||||||||||||||||||||||||||||||||||||||||||||||
| Schedule of Income From Investments | Income
from investments consist of:
|
||||||||||||||||||||||||||||||||||||||||||||||||||||||
Plant and Equipment (Tables) |
12 Months Ended | |||||||||||||||||||||||||||||||||||||||||||||||||||||||||||||||||||||||||||||||||||||||||||||||||||||||||||||||||||||||||||||||||||||||||||||||||||||||||||||||||||||||||||||||||||||||||||||||||||||||||||||||||||||||||||||||||||||||||||||||||||||||||||||||||||||||||||||||||||||||||||||||||||||||||||||||||||||||||||||||||||||||||||||||||||||||||||||||||||||||||||||||||||||||||||||||||||||||||||||||||||||||||||||||||||||||||||||||||||||||||||||||||||||||||||||||||||||||||||||||||||||||||||||||||||||||||||||||||||||||||||||||||||||||||||||||||||||||||||||||||||||||||||||||||||||||||||||||||||||||||||||||||||||||||||||||||||||||||||||||||||||||||||||||||||||||||||||||||||
|---|---|---|---|---|---|---|---|---|---|---|---|---|---|---|---|---|---|---|---|---|---|---|---|---|---|---|---|---|---|---|---|---|---|---|---|---|---|---|---|---|---|---|---|---|---|---|---|---|---|---|---|---|---|---|---|---|---|---|---|---|---|---|---|---|---|---|---|---|---|---|---|---|---|---|---|---|---|---|---|---|---|---|---|---|---|---|---|---|---|---|---|---|---|---|---|---|---|---|---|---|---|---|---|---|---|---|---|---|---|---|---|---|---|---|---|---|---|---|---|---|---|---|---|---|---|---|---|---|---|---|---|---|---|---|---|---|---|---|---|---|---|---|---|---|---|---|---|---|---|---|---|---|---|---|---|---|---|---|---|---|---|---|---|---|---|---|---|---|---|---|---|---|---|---|---|---|---|---|---|---|---|---|---|---|---|---|---|---|---|---|---|---|---|---|---|---|---|---|---|---|---|---|---|---|---|---|---|---|---|---|---|---|---|---|---|---|---|---|---|---|---|---|---|---|---|---|---|---|---|---|---|---|---|---|---|---|---|---|---|---|---|---|---|---|---|---|---|---|---|---|---|---|---|---|---|---|---|---|---|---|---|---|---|---|---|---|---|---|---|---|---|---|---|---|---|---|---|---|---|---|---|---|---|---|---|---|---|---|---|---|---|---|---|---|---|---|---|---|---|---|---|---|---|---|---|---|---|---|---|---|---|---|---|---|---|---|---|---|---|---|---|---|---|---|---|---|---|---|---|---|---|---|---|---|---|---|---|---|---|---|---|---|---|---|---|---|---|---|---|---|---|---|---|---|---|---|---|---|---|---|---|---|---|---|---|---|---|---|---|---|---|---|---|---|---|---|---|---|---|---|---|---|---|---|---|---|---|---|---|---|---|---|---|---|---|---|---|---|---|---|---|---|---|---|---|---|---|---|---|---|---|---|---|---|---|---|---|---|---|---|---|---|---|---|---|---|---|---|---|---|---|---|---|---|---|---|---|---|---|---|---|---|---|---|---|---|---|---|---|---|---|---|---|---|---|---|---|---|---|---|---|---|---|---|---|---|---|---|---|---|---|---|---|---|---|---|---|---|---|---|---|---|---|---|---|---|---|---|---|---|---|---|---|---|---|---|---|---|---|---|---|---|---|---|---|---|---|---|---|---|---|---|---|---|---|---|---|---|---|---|---|---|---|---|---|---|---|---|---|---|---|---|---|---|---|---|---|---|---|---|---|---|---|---|---|---|---|---|---|---|---|---|---|---|---|---|---|---|---|---|---|---|---|---|---|---|---|---|---|---|---|---|---|---|---|---|---|---|---|---|---|---|---|---|---|---|---|---|---|---|---|---|---|---|---|---|---|---|---|---|---|---|---|---|---|---|---|---|---|---|---|---|---|---|---|---|---|---|---|---|---|---|---|---|---|---|---|---|---|---|---|---|---|---|---|---|---|---|---|---|---|---|---|---|---|---|---|---|---|---|---|---|---|---|---|---|---|---|---|---|---|---|---|---|---|---|---|---|---|---|---|---|---|---|---|---|
Jun. 30, 2023 | ||||||||||||||||||||||||||||||||||||||||||||||||||||||||||||||||||||||||||||||||||||||||||||||||||||||||||||||||||||||||||||||||||||||||||||||||||||||||||||||||||||||||||||||||||||||||||||||||||||||||||||||||||||||||||||||||||||||||||||||||||||||||||||||||||||||||||||||||||||||||||||||||||||||||||||||||||||||||||||||||||||||||||||||||||||||||||||||||||||||||||||||||||||||||||||||||||||||||||||||||||||||||||||||||||||||||||||||||||||||||||||||||||||||||||||||||||||||||||||||||||||||||||||||||||||||||||||||||||||||||||||||||||||||||||||||||||||||||||||||||||||||||||||||||||||||||||||||||||||||||||||||||||||||||||||||||||||||||||||||||||||||||||||||||||||||||||||||||||||
| Plant and Equipment [Abstract] | ||||||||||||||||||||||||||||||||||||||||||||||||||||||||||||||||||||||||||||||||||||||||||||||||||||||||||||||||||||||||||||||||||||||||||||||||||||||||||||||||||||||||||||||||||||||||||||||||||||||||||||||||||||||||||||||||||||||||||||||||||||||||||||||||||||||||||||||||||||||||||||||||||||||||||||||||||||||||||||||||||||||||||||||||||||||||||||||||||||||||||||||||||||||||||||||||||||||||||||||||||||||||||||||||||||||||||||||||||||||||||||||||||||||||||||||||||||||||||||||||||||||||||||||||||||||||||||||||||||||||||||||||||||||||||||||||||||||||||||||||||||||||||||||||||||||||||||||||||||||||||||||||||||||||||||||||||||||||||||||||||||||||||||||||||||||||||||||||||||
| Schedule of Composition of Property and Equipment and Related Accumulated Depreciation |
|
|||||||||||||||||||||||||||||||||||||||||||||||||||||||||||||||||||||||||||||||||||||||||||||||||||||||||||||||||||||||||||||||||||||||||||||||||||||||||||||||||||||||||||||||||||||||||||||||||||||||||||||||||||||||||||||||||||||||||||||||||||||||||||||||||||||||||||||||||||||||||||||||||||||||||||||||||||||||||||||||||||||||||||||||||||||||||||||||||||||||||||||||||||||||||||||||||||||||||||||||||||||||||||||||||||||||||||||||||||||||||||||||||||||||||||||||||||||||||||||||||||||||||||||||||||||||||||||||||||||||||||||||||||||||||||||||||||||||||||||||||||||||||||||||||||||||||||||||||||||||||||||||||||||||||||||||||||||||||||||||||||||||||||||||||||||||||||||||||||
Mineral Property Interests (Tables) |
12 Months Ended | ||||||||||||||||||||||||||||||||||||||||||||||||||||||||||||||||||||||||||||||||||||||||||||||||||||||||||||||||||||||||||||||||||||||||||||||||||||||||||||||||||||||||||||||||||||||||||||||||||||||||||||||||||||||||||||||||||||||||||||||||||||||||||||||||||||||||||||||||||||||||||||||||||||||||||||||||||||||||||||||||||||||||||||||||||||||||||||||||||||||||||||||||||||||||||||||||||||||||||||||||||||||||||||||||||||
|---|---|---|---|---|---|---|---|---|---|---|---|---|---|---|---|---|---|---|---|---|---|---|---|---|---|---|---|---|---|---|---|---|---|---|---|---|---|---|---|---|---|---|---|---|---|---|---|---|---|---|---|---|---|---|---|---|---|---|---|---|---|---|---|---|---|---|---|---|---|---|---|---|---|---|---|---|---|---|---|---|---|---|---|---|---|---|---|---|---|---|---|---|---|---|---|---|---|---|---|---|---|---|---|---|---|---|---|---|---|---|---|---|---|---|---|---|---|---|---|---|---|---|---|---|---|---|---|---|---|---|---|---|---|---|---|---|---|---|---|---|---|---|---|---|---|---|---|---|---|---|---|---|---|---|---|---|---|---|---|---|---|---|---|---|---|---|---|---|---|---|---|---|---|---|---|---|---|---|---|---|---|---|---|---|---|---|---|---|---|---|---|---|---|---|---|---|---|---|---|---|---|---|---|---|---|---|---|---|---|---|---|---|---|---|---|---|---|---|---|---|---|---|---|---|---|---|---|---|---|---|---|---|---|---|---|---|---|---|---|---|---|---|---|---|---|---|---|---|---|---|---|---|---|---|---|---|---|---|---|---|---|---|---|---|---|---|---|---|---|---|---|---|---|---|---|---|---|---|---|---|---|---|---|---|---|---|---|---|---|---|---|---|---|---|---|---|---|---|---|---|---|---|---|---|---|---|---|---|---|---|---|---|---|---|---|---|---|---|---|---|---|---|---|---|---|---|---|---|---|---|---|---|---|---|---|---|---|---|---|---|---|---|---|---|---|---|---|---|---|---|---|---|---|---|---|---|---|---|---|---|---|---|---|---|---|---|---|---|---|---|---|---|---|---|---|---|---|---|---|---|---|---|---|---|---|---|---|---|---|---|---|---|---|---|---|---|---|---|---|---|---|---|---|---|---|---|---|---|---|---|---|---|---|---|---|---|---|---|---|---|---|
Jun. 30, 2023 | |||||||||||||||||||||||||||||||||||||||||||||||||||||||||||||||||||||||||||||||||||||||||||||||||||||||||||||||||||||||||||||||||||||||||||||||||||||||||||||||||||||||||||||||||||||||||||||||||||||||||||||||||||||||||||||||||||||||||||||||||||||||||||||||||||||||||||||||||||||||||||||||||||||||||||||||||||||||||||||||||||||||||||||||||||||||||||||||||||||||||||||||||||||||||||||||||||||||||||||||||||||||||||||||||||||
| Mineral Property Interests [Abstract] | |||||||||||||||||||||||||||||||||||||||||||||||||||||||||||||||||||||||||||||||||||||||||||||||||||||||||||||||||||||||||||||||||||||||||||||||||||||||||||||||||||||||||||||||||||||||||||||||||||||||||||||||||||||||||||||||||||||||||||||||||||||||||||||||||||||||||||||||||||||||||||||||||||||||||||||||||||||||||||||||||||||||||||||||||||||||||||||||||||||||||||||||||||||||||||||||||||||||||||||||||||||||||||||||||||||
| Schedule of Mineral Property Acquisition Costs and Deferred Exploration and Development Costs | The
continuity schedule of mineral property acquisition costs and deferred exploration and development costs is summarized as follows:
|
||||||||||||||||||||||||||||||||||||||||||||||||||||||||||||||||||||||||||||||||||||||||||||||||||||||||||||||||||||||||||||||||||||||||||||||||||||||||||||||||||||||||||||||||||||||||||||||||||||||||||||||||||||||||||||||||||||||||||||||||||||||||||||||||||||||||||||||||||||||||||||||||||||||||||||||||||||||||||||||||||||||||||||||||||||||||||||||||||||||||||||||||||||||||||||||||||||||||||||||||||||||||||||||||||||
Trade and Other Payables (Tables) |
12 Months Ended | ||||||||||||||||||||||||||||||||||||
|---|---|---|---|---|---|---|---|---|---|---|---|---|---|---|---|---|---|---|---|---|---|---|---|---|---|---|---|---|---|---|---|---|---|---|---|---|---|
Jun. 30, 2023 | |||||||||||||||||||||||||||||||||||||
| Trade and Other Payables [Abstract] | |||||||||||||||||||||||||||||||||||||
| Schedule of Trade and Other Payables | Trade and other payables consist of:
|
||||||||||||||||||||||||||||||||||||
Related Party Transactions (Tables) |
12 Months Ended | |||||||||||||||||||||||||||||||||||||||||||||||||||||||||||||||
|---|---|---|---|---|---|---|---|---|---|---|---|---|---|---|---|---|---|---|---|---|---|---|---|---|---|---|---|---|---|---|---|---|---|---|---|---|---|---|---|---|---|---|---|---|---|---|---|---|---|---|---|---|---|---|---|---|---|---|---|---|---|---|---|---|
Jun. 30, 2023 | ||||||||||||||||||||||||||||||||||||||||||||||||||||||||||||||||
| Related Party Transactions [Abstract] | ||||||||||||||||||||||||||||||||||||||||||||||||||||||||||||||||
| Schedule of Related Party Transactions | Related
party transactions are made on terms agreed upon by the related parties. The balances with related parties are unsecured, non-interest
bearing, and due on demand. Related party transactions not disclosed elsewhere in the consolidated financial statements are as follows:
|
|||||||||||||||||||||||||||||||||||||||||||||||||||||||||||||||
| Schedule of Compensation of Key Management Personnel | The remuneration of directors and other
members of key management personnel for the years ended June 30, 2023 and 2022 are as follows:
|
|||||||||||||||||||||||||||||||||||||||||||||||||||||||||||||||
Share Capital (Tables) |
12 Months Ended | ||||||||||||||||||||||||||||||||||||||||||||||||||||||||||||||||||||||||||||||||||||||||||||||||||||||||||||||||||||||||||||||||||||||||||||||||||||||||||||||||||||||||||||||||||||||||||||||||||||||||||||||||||||||||||||||||||||||||||||||||||||||||||
|---|---|---|---|---|---|---|---|---|---|---|---|---|---|---|---|---|---|---|---|---|---|---|---|---|---|---|---|---|---|---|---|---|---|---|---|---|---|---|---|---|---|---|---|---|---|---|---|---|---|---|---|---|---|---|---|---|---|---|---|---|---|---|---|---|---|---|---|---|---|---|---|---|---|---|---|---|---|---|---|---|---|---|---|---|---|---|---|---|---|---|---|---|---|---|---|---|---|---|---|---|---|---|---|---|---|---|---|---|---|---|---|---|---|---|---|---|---|---|---|---|---|---|---|---|---|---|---|---|---|---|---|---|---|---|---|---|---|---|---|---|---|---|---|---|---|---|---|---|---|---|---|---|---|---|---|---|---|---|---|---|---|---|---|---|---|---|---|---|---|---|---|---|---|---|---|---|---|---|---|---|---|---|---|---|---|---|---|---|---|---|---|---|---|---|---|---|---|---|---|---|---|---|---|---|---|---|---|---|---|---|---|---|---|---|---|---|---|---|---|---|---|---|---|---|---|---|---|---|---|---|---|---|---|---|---|---|---|---|---|---|---|---|---|---|---|---|---|---|---|---|---|
Jun. 30, 2023 | |||||||||||||||||||||||||||||||||||||||||||||||||||||||||||||||||||||||||||||||||||||||||||||||||||||||||||||||||||||||||||||||||||||||||||||||||||||||||||||||||||||||||||||||||||||||||||||||||||||||||||||||||||||||||||||||||||||||||||||||||||||||||||
| Share Capital [Abstract] | |||||||||||||||||||||||||||||||||||||||||||||||||||||||||||||||||||||||||||||||||||||||||||||||||||||||||||||||||||||||||||||||||||||||||||||||||||||||||||||||||||||||||||||||||||||||||||||||||||||||||||||||||||||||||||||||||||||||||||||||||||||||||||
| Schedule of Stock Options | The continuity schedule of stock options,
as at June 30, 2023, is as follows:
|
||||||||||||||||||||||||||||||||||||||||||||||||||||||||||||||||||||||||||||||||||||||||||||||||||||||||||||||||||||||||||||||||||||||||||||||||||||||||||||||||||||||||||||||||||||||||||||||||||||||||||||||||||||||||||||||||||||||||||||||||||||||||||
| Schedule of Options Granted | The fair value of the options granted
during the year ended June 30, 2023 and 2022 were calculated as of the date of grant using the Black-Scholes option pricing model with
the following weighted average assumptions:
|
||||||||||||||||||||||||||||||||||||||||||||||||||||||||||||||||||||||||||||||||||||||||||||||||||||||||||||||||||||||||||||||||||||||||||||||||||||||||||||||||||||||||||||||||||||||||||||||||||||||||||||||||||||||||||||||||||||||||||||||||||||||||||
| Schedule of Information about Stock Options Outstanding | The following table summarizes information
about stock options outstanding as at June 30, 2023:
|
||||||||||||||||||||||||||||||||||||||||||||||||||||||||||||||||||||||||||||||||||||||||||||||||||||||||||||||||||||||||||||||||||||||||||||||||||||||||||||||||||||||||||||||||||||||||||||||||||||||||||||||||||||||||||||||||||||||||||||||||||||||||||
| Schedule of Continuity RSUs | The continuity schedule of RSUs, as at June 30, 2023, is as
follows:
|
||||||||||||||||||||||||||||||||||||||||||||||||||||||||||||||||||||||||||||||||||||||||||||||||||||||||||||||||||||||||||||||||||||||||||||||||||||||||||||||||||||||||||||||||||||||||||||||||||||||||||||||||||||||||||||||||||||||||||||||||||||||||||
| Schedule of Loss Per Share |
|
||||||||||||||||||||||||||||||||||||||||||||||||||||||||||||||||||||||||||||||||||||||||||||||||||||||||||||||||||||||||||||||||||||||||||||||||||||||||||||||||||||||||||||||||||||||||||||||||||||||||||||||||||||||||||||||||||||||||||||||||||||||||||
Non-Controlling Interest (Tables) |
12 Months Ended | ||||||||||||||||||||||||||||||||||||||||
|---|---|---|---|---|---|---|---|---|---|---|---|---|---|---|---|---|---|---|---|---|---|---|---|---|---|---|---|---|---|---|---|---|---|---|---|---|---|---|---|---|---|
Jun. 30, 2023 | |||||||||||||||||||||||||||||||||||||||||
| Non-Controlling Interest [Abstract] | |||||||||||||||||||||||||||||||||||||||||
| Schedule of Non-Controlling Interests |
|
||||||||||||||||||||||||||||||||||||||||
Financial Instruments (Tables) |
12 Months Ended | ||||||||||||||||||||||||||||||||||||||||||||||||||||||||||||||||||||||||||||||||||||||||||||||||||||||||||||||||||||||||||||||||||||||||||||||||||||||||||||||||||||||||||||||||||||||||||||||||||||||||||||
|---|---|---|---|---|---|---|---|---|---|---|---|---|---|---|---|---|---|---|---|---|---|---|---|---|---|---|---|---|---|---|---|---|---|---|---|---|---|---|---|---|---|---|---|---|---|---|---|---|---|---|---|---|---|---|---|---|---|---|---|---|---|---|---|---|---|---|---|---|---|---|---|---|---|---|---|---|---|---|---|---|---|---|---|---|---|---|---|---|---|---|---|---|---|---|---|---|---|---|---|---|---|---|---|---|---|---|---|---|---|---|---|---|---|---|---|---|---|---|---|---|---|---|---|---|---|---|---|---|---|---|---|---|---|---|---|---|---|---|---|---|---|---|---|---|---|---|---|---|---|---|---|---|---|---|---|---|---|---|---|---|---|---|---|---|---|---|---|---|---|---|---|---|---|---|---|---|---|---|---|---|---|---|---|---|---|---|---|---|---|---|---|---|---|---|---|---|---|---|---|---|---|---|---|---|---|
Jun. 30, 2023 | |||||||||||||||||||||||||||||||||||||||||||||||||||||||||||||||||||||||||||||||||||||||||||||||||||||||||||||||||||||||||||||||||||||||||||||||||||||||||||||||||||||||||||||||||||||||||||||||||||||||||||||
| Financial Instruments [Abstract] | |||||||||||||||||||||||||||||||||||||||||||||||||||||||||||||||||||||||||||||||||||||||||||||||||||||||||||||||||||||||||||||||||||||||||||||||||||||||||||||||||||||||||||||||||||||||||||||||||||||||||||||
| Schedule of Financial Assets Measured at Fair Value Level on Recurring Basis | The following table sets forth the
Company’s financial assets that are measured at fair value on a recurring basis by level within the fair value hierarchy as at June
30, 2023 and June 30, 2022 that are not otherwise disclosed. As required by IFRS 13, financial assets are classified in their entirety
based on the lowest level of input that is significant to the fair value measurement.
|
||||||||||||||||||||||||||||||||||||||||||||||||||||||||||||||||||||||||||||||||||||||||||||||||||||||||||||||||||||||||||||||||||||||||||||||||||||||||||||||||||||||||||||||||||||||||||||||||||||||||||||
| Schedule of Remaining Contractual Maturities of Financial Liabilities | The following summarizes the remaining contractual
maturities of the Company’s financial liabilities:
|
||||||||||||||||||||||||||||||||||||||||||||||||||||||||||||||||||||||||||||||||||||||||||||||||||||||||||||||||||||||||||||||||||||||||||||||||||||||||||||||||||||||||||||||||||||||||||||||||||||||||||||
| Schedule of Currency Risk Affect Net Income | The Company’s exposure to foreign exchange risk that could affect net income is summarized
as follows:
|
||||||||||||||||||||||||||||||||||||||||||||||||||||||||||||||||||||||||||||||||||||||||||||||||||||||||||||||||||||||||||||||||||||||||||||||||||||||||||||||||||||||||||||||||||||||||||||||||||||||||||||
Income Taxes (Tables) |
12 Months Ended | ||||||||||||||||||||||||||||||||||||||||||||||||||||||||||||||||||||||||||||||||||||||||||||||||||||||||||||||||||||||||||||||||||||||||||||||||||||||||||||
|---|---|---|---|---|---|---|---|---|---|---|---|---|---|---|---|---|---|---|---|---|---|---|---|---|---|---|---|---|---|---|---|---|---|---|---|---|---|---|---|---|---|---|---|---|---|---|---|---|---|---|---|---|---|---|---|---|---|---|---|---|---|---|---|---|---|---|---|---|---|---|---|---|---|---|---|---|---|---|---|---|---|---|---|---|---|---|---|---|---|---|---|---|---|---|---|---|---|---|---|---|---|---|---|---|---|---|---|---|---|---|---|---|---|---|---|---|---|---|---|---|---|---|---|---|---|---|---|---|---|---|---|---|---|---|---|---|---|---|---|---|---|---|---|---|---|---|---|---|---|---|---|---|---|---|---|---|---|
Jun. 30, 2023 | |||||||||||||||||||||||||||||||||||||||||||||||||||||||||||||||||||||||||||||||||||||||||||||||||||||||||||||||||||||||||||||||||||||||||||||||||||||||||||||
| Income Taxes [Abstract] | |||||||||||||||||||||||||||||||||||||||||||||||||||||||||||||||||||||||||||||||||||||||||||||||||||||||||||||||||||||||||||||||||||||||||||||||||||||||||||||
| Schedule of Provision of Income Tax Rates to Loss Before Income Tax | The provision for income taxes differs
from the amount computed by applying the cumulative Canadian federal and provincial income tax rates to the loss before income tax provision
due to the following:
|
||||||||||||||||||||||||||||||||||||||||||||||||||||||||||||||||||||||||||||||||||||||||||||||||||||||||||||||||||||||||||||||||||||||||||||||||||||||||||||
| Schedule of Temporary Differences and Unused Tax Losses | Deductible temporary differences and unused tax losses for which no deferred tax assets have been recognized are attributable to
the following:
|
||||||||||||||||||||||||||||||||||||||||||||||||||||||||||||||||||||||||||||||||||||||||||||||||||||||||||||||||||||||||||||||||||||||||||||||||||||||||||||
| Schedule of Net Operating Losses Expiring in Various Years | As of June 30, 2023, the Company
has the following net operating losses, expiring various years to 2043 and available to offset future taxable income in Canada, Bolivia
and China, respectively:
|
||||||||||||||||||||||||||||||||||||||||||||||||||||||||||||||||||||||||||||||||||||||||||||||||||||||||||||||||||||||||||||||||||||||||||||||||||||||||||||
Segmented Information (Tables) |
12 Months Ended | ||||||||||||||||||||||||||||||||||||||||||||||||||||||||||||||||||||||||||||||||||||||||||||||||||||||||||||||||||||||||||||||||||||||||||||||||||||||||||||||||||||||||||||||||||||||||||||||||||||||||||||||||||||||||||||||||||||||||||||||||||||||||||||||||||||||||||||||||||||||||||||||||||||||||||||||||||||||||||||||||||||||||||||||||||||||||||||||||||||||||||||||||||||||||||||||||||||||||||||||||||||||||||||||||||||||||||||||||||||||||||||||||||||||||||||||||||||||||||||||||||||||||||||||||||||||||||||||||||||||||||||||||||||||||||||||||||||||||||||||||||||||||||||||||||||||||||||||||||||||||||||||||||||||||||||||||||||||||||||||||||||||||||||||||||||||||||||||||||||||||||||||||||||||||||||||||||||||||||||||||||||||||||||||||||||||||||||||||||||
|---|---|---|---|---|---|---|---|---|---|---|---|---|---|---|---|---|---|---|---|---|---|---|---|---|---|---|---|---|---|---|---|---|---|---|---|---|---|---|---|---|---|---|---|---|---|---|---|---|---|---|---|---|---|---|---|---|---|---|---|---|---|---|---|---|---|---|---|---|---|---|---|---|---|---|---|---|---|---|---|---|---|---|---|---|---|---|---|---|---|---|---|---|---|---|---|---|---|---|---|---|---|---|---|---|---|---|---|---|---|---|---|---|---|---|---|---|---|---|---|---|---|---|---|---|---|---|---|---|---|---|---|---|---|---|---|---|---|---|---|---|---|---|---|---|---|---|---|---|---|---|---|---|---|---|---|---|---|---|---|---|---|---|---|---|---|---|---|---|---|---|---|---|---|---|---|---|---|---|---|---|---|---|---|---|---|---|---|---|---|---|---|---|---|---|---|---|---|---|---|---|---|---|---|---|---|---|---|---|---|---|---|---|---|---|---|---|---|---|---|---|---|---|---|---|---|---|---|---|---|---|---|---|---|---|---|---|---|---|---|---|---|---|---|---|---|---|---|---|---|---|---|---|---|---|---|---|---|---|---|---|---|---|---|---|---|---|---|---|---|---|---|---|---|---|---|---|---|---|---|---|---|---|---|---|---|---|---|---|---|---|---|---|---|---|---|---|---|---|---|---|---|---|---|---|---|---|---|---|---|---|---|---|---|---|---|---|---|---|---|---|---|---|---|---|---|---|---|---|---|---|---|---|---|---|---|---|---|---|---|---|---|---|---|---|---|---|---|---|---|---|---|---|---|---|---|---|---|---|---|---|---|---|---|---|---|---|---|---|---|---|---|---|---|---|---|---|---|---|---|---|---|---|---|---|---|---|---|---|---|---|---|---|---|---|---|---|---|---|---|---|---|---|---|---|---|---|---|---|---|---|---|---|---|---|---|---|---|---|---|---|---|---|---|---|---|---|---|---|---|---|---|---|---|---|---|---|---|---|---|---|---|---|---|---|---|---|---|---|---|---|---|---|---|---|---|---|---|---|---|---|---|---|---|---|---|---|---|---|---|---|---|---|---|---|---|---|---|---|---|---|---|---|---|---|---|---|---|---|---|---|---|---|---|---|---|---|---|---|---|---|---|---|---|---|---|---|---|---|---|---|---|---|---|---|---|---|---|---|---|---|---|---|---|---|---|---|---|---|---|---|---|---|---|---|---|---|---|---|---|---|---|---|---|---|---|---|---|---|---|---|---|---|---|---|---|---|---|---|---|---|---|---|---|---|---|---|---|---|---|---|---|---|---|---|---|---|---|---|---|---|---|---|---|---|---|---|---|---|---|---|---|---|---|---|---|---|---|---|---|---|---|---|---|---|---|---|---|---|---|---|---|---|---|---|---|---|---|---|---|---|---|---|---|---|---|---|---|---|---|---|---|---|---|---|---|---|---|---|---|---|---|---|---|---|---|---|---|---|---|---|---|---|---|---|---|---|---|---|---|---|---|---|---|---|---|---|---|---|---|---|---|---|---|---|---|---|---|---|---|---|---|---|---|---|---|---|---|---|---|---|---|---|---|---|---|---|---|---|---|---|---|---|---|---|---|---|---|---|---|---|---|---|---|---|---|---|---|---|---|---|---|---|---|---|---|---|---|---|---|---|---|---|---|---|---|---|---|---|---|---|---|---|---|---|---|---|---|---|---|---|---|---|---|---|---|---|---|
Jun. 30, 2023 | |||||||||||||||||||||||||||||||||||||||||||||||||||||||||||||||||||||||||||||||||||||||||||||||||||||||||||||||||||||||||||||||||||||||||||||||||||||||||||||||||||||||||||||||||||||||||||||||||||||||||||||||||||||||||||||||||||||||||||||||||||||||||||||||||||||||||||||||||||||||||||||||||||||||||||||||||||||||||||||||||||||||||||||||||||||||||||||||||||||||||||||||||||||||||||||||||||||||||||||||||||||||||||||||||||||||||||||||||||||||||||||||||||||||||||||||||||||||||||||||||||||||||||||||||||||||||||||||||||||||||||||||||||||||||||||||||||||||||||||||||||||||||||||||||||||||||||||||||||||||||||||||||||||||||||||||||||||||||||||||||||||||||||||||||||||||||||||||||||||||||||||||||||||||||||||||||||||||||||||||||||||||||||||||||||||||||||||||||||||
| Segmented Information [Abstract] | |||||||||||||||||||||||||||||||||||||||||||||||||||||||||||||||||||||||||||||||||||||||||||||||||||||||||||||||||||||||||||||||||||||||||||||||||||||||||||||||||||||||||||||||||||||||||||||||||||||||||||||||||||||||||||||||||||||||||||||||||||||||||||||||||||||||||||||||||||||||||||||||||||||||||||||||||||||||||||||||||||||||||||||||||||||||||||||||||||||||||||||||||||||||||||||||||||||||||||||||||||||||||||||||||||||||||||||||||||||||||||||||||||||||||||||||||||||||||||||||||||||||||||||||||||||||||||||||||||||||||||||||||||||||||||||||||||||||||||||||||||||||||||||||||||||||||||||||||||||||||||||||||||||||||||||||||||||||||||||||||||||||||||||||||||||||||||||||||||||||||||||||||||||||||||||||||||||||||||||||||||||||||||||||||||||||||||||||||||||
| Schedule of Segment Information for Assets and Liabilities | Segment information for assets and liabilities are as follows:
|
||||||||||||||||||||||||||||||||||||||||||||||||||||||||||||||||||||||||||||||||||||||||||||||||||||||||||||||||||||||||||||||||||||||||||||||||||||||||||||||||||||||||||||||||||||||||||||||||||||||||||||||||||||||||||||||||||||||||||||||||||||||||||||||||||||||||||||||||||||||||||||||||||||||||||||||||||||||||||||||||||||||||||||||||||||||||||||||||||||||||||||||||||||||||||||||||||||||||||||||||||||||||||||||||||||||||||||||||||||||||||||||||||||||||||||||||||||||||||||||||||||||||||||||||||||||||||||||||||||||||||||||||||||||||||||||||||||||||||||||||||||||||||||||||||||||||||||||||||||||||||||||||||||||||||||||||||||||||||||||||||||||||||||||||||||||||||||||||||||||||||||||||||||||||||||||||||||||||||||||||||||||||||||||||||||||||||||||||||||
| Schedule of Segment Information for Operating Results | Segment information for operating results are as follows:
|
||||||||||||||||||||||||||||||||||||||||||||||||||||||||||||||||||||||||||||||||||||||||||||||||||||||||||||||||||||||||||||||||||||||||||||||||||||||||||||||||||||||||||||||||||||||||||||||||||||||||||||||||||||||||||||||||||||||||||||||||||||||||||||||||||||||||||||||||||||||||||||||||||||||||||||||||||||||||||||||||||||||||||||||||||||||||||||||||||||||||||||||||||||||||||||||||||||||||||||||||||||||||||||||||||||||||||||||||||||||||||||||||||||||||||||||||||||||||||||||||||||||||||||||||||||||||||||||||||||||||||||||||||||||||||||||||||||||||||||||||||||||||||||||||||||||||||||||||||||||||||||||||||||||||||||||||||||||||||||||||||||||||||||||||||||||||||||||||||||||||||||||||||||||||||||||||||||||||||||||||||||||||||||||||||||||||||||||||||||
Supplementary Cash Flow Information (Tables) |
12 Months Ended | |||||||||||||||||||||||||||||||||||||||||||||||||||||||||||||||
|---|---|---|---|---|---|---|---|---|---|---|---|---|---|---|---|---|---|---|---|---|---|---|---|---|---|---|---|---|---|---|---|---|---|---|---|---|---|---|---|---|---|---|---|---|---|---|---|---|---|---|---|---|---|---|---|---|---|---|---|---|---|---|---|---|
Jun. 30, 2023 | ||||||||||||||||||||||||||||||||||||||||||||||||||||||||||||||||
| Supplementary Cash Flow Information [Abstract] | ||||||||||||||||||||||||||||||||||||||||||||||||||||||||||||||||
| Schedule of Change in Non-Cash Operating Working Capital |
|
|||||||||||||||||||||||||||||||||||||||||||||||||||||||||||||||
| Schedule of Non-Cash Capital Transactions |
|
|||||||||||||||||||||||||||||||||||||||||||||||||||||||||||||||
Significant Accounting Policies (Details) - Schedule of Estimated Useful Lives |
12 Months Ended |
|---|---|
Jun. 30, 2023 | |
| Land [Member] | |
| Significant Accounting Policies (Details) - Schedule of Estimated Useful Lives [Line Items] | |
| Estimated useful lives | Not depreciated |
| Buildings [Member] | |
| Significant Accounting Policies (Details) - Schedule of Estimated Useful Lives [Line Items] | |
| Estimated useful lives | 20 years |
| Machinery [Member] | |
| Significant Accounting Policies (Details) - Schedule of Estimated Useful Lives [Line Items] | |
| Estimated useful lives | 5 years |
| Motor vehicles [Member] | |
| Significant Accounting Policies (Details) - Schedule of Estimated Useful Lives [Line Items] | |
| Estimated useful lives | 5 years |
| Office equipment and furniture [Member] | |
| Significant Accounting Policies (Details) - Schedule of Estimated Useful Lives [Line Items] | |
| Estimated useful lives | 5 years |
| Computer software [Member] | |
| Significant Accounting Policies (Details) - Schedule of Estimated Useful Lives [Line Items] | |
| Estimated useful lives | 5 years |
Short-Term Investments (Details) - Schedule of Short-Term Investments - USD ($) |
Jun. 30, 2023 |
Jun. 30, 2022 |
|---|---|---|
| Schedule of Short Term Investments [Abstract] | ||
| Bonds | $ 198,375 | $ 192,398 |
Short-Term Investments (Details) - Schedule of Continuity of Short-Term Investments - USD ($) |
12 Months Ended | |
|---|---|---|
Jun. 30, 2023 |
Jun. 30, 2022 |
|
| Schedule of Continuity of Short Term Investments [Abstract] | ||
| Balance beginning | $ 192,398 | $ 143,914 |
| Gain (Loss) on fair value change | 5,977 | 48,484 |
| Balance ending | $ 198,375 | $ 192,398 |
Equity Investments (Details) - Schedule of Equity Investments - USD ($) |
Jun. 30, 2023 |
Jun. 30, 2022 |
|---|---|---|
| Common shares | ||
| Equity investments | $ 283,081 | $ 496,741 |
| Public companies [Member] | ||
| Common shares | ||
| Equity investments | $ 283,081 | $ 496,741 |
Equity Investments (Details) - Schedule of Continuity of Equity Investments - USD ($) |
12 Months Ended | |
|---|---|---|
Jun. 30, 2023 |
Jun. 30, 2022 |
|
| Fair value [Member] | ||
| Equity Investments (Details) - Schedule of Continuity of Equity Investments [Line Items] | ||
| Balance beginning | $ 496,741 | $ 496,526 |
| Change in fair value | (198,031) | 19,517 |
| Foreign exchange impact | (15,629) | (19,302) |
| Balance, ending | 283,081 | 496,741 |
| Accumulated mark-to- market gain included in deficit [Member] | ||
| Equity Investments (Details) - Schedule of Continuity of Equity Investments [Line Items] | ||
| Balance beginning | 3,990,662 | 3,971,145 |
| Change in fair value | (198,031) | 19,517 |
| Foreign exchange impact | ||
| Balance, ending | $ 3,792,631 | $ 3,990,662 |
Income from Investments (Details) - Schedule of Income From Investments - USD ($) |
12 Months Ended | |
|---|---|---|
Jun. 30, 2023 |
Jun. 30, 2022 |
|
| Schedule of Income From Investments [Abstract] | ||
| Fair value change on equity investments | $ (198,031) | $ 19,517 |
| Fair value change on bonds | 5,977 | 48,484 |
| Interest income | 370,100 | 152,111 |
| Net income from investments | $ 178,046 | $ 220,112 |
Plant and Equipment (Details) - USD ($) |
12 Months Ended | |
|---|---|---|
Jun. 30, 2023 |
Jun. 30, 2022 |
|
| Plant and Equipment [Abstract] | ||
| Proceeds on disposals | $ 1,808 | |
| Loss on disposal of plant and equipment | $ 14,804 | |
Plant and Equipment (Details) - Schedule of Composition of Property and Equipment and Related Accumulated Depreciation - USD ($) |
12 Months Ended | |
|---|---|---|
Jun. 30, 2023 |
Jun. 30, 2022 |
|
| Plant and Equipment (Details) - Schedule of Composition of Property and Equipment and Related Accumulated Depreciation [Line Items] | ||
| Balance | $ 1,462,848 | $ 1,462,848 |
| Balance | 1,339,839 | 1,462,848 |
| Land and Building [Member] | ||
| Plant and Equipment (Details) - Schedule of Composition of Property and Equipment and Related Accumulated Depreciation [Line Items] | ||
| Balance | 630,000 | |
| Balance | 630,000 | |
| Machinery [Member] | ||
| Plant and Equipment (Details) - Schedule of Composition of Property and Equipment and Related Accumulated Depreciation [Line Items] | ||
| Balance | 294,718 | |
| Balance | 314,705 | |
| Motor Vehicles [Member] | ||
| Plant and Equipment (Details) - Schedule of Composition of Property and Equipment and Related Accumulated Depreciation [Line Items] | ||
| Balance | 380,460 | |
| Balance | 282,122 | |
| Office Equipment and Furniture [Member] | ||
| Plant and Equipment (Details) - Schedule of Composition of Property and Equipment and Related Accumulated Depreciation [Line Items] | ||
| Balance | 110,364 | |
| Balance | 89,991 | |
| Computer Software [Member] | ||
| Plant and Equipment (Details) - Schedule of Composition of Property and Equipment and Related Accumulated Depreciation [Line Items] | ||
| Balance | 47,306 | |
| Balance | 23,021 | |
| Cost [Member] | ||
| Plant and Equipment (Details) - Schedule of Composition of Property and Equipment and Related Accumulated Depreciation [Line Items] | ||
| Balance | 2,077,528 | 1,591,805 |
| Additions | 92,835 | 538,550 |
| Disposals | (111,701) | (40,815) |
| Reclassifed among asset groups | ||
| Foreign currency translation impact | (3,223) | (12,012) |
| Balance | 2,055,439 | 2,077,528 |
| Cost [Member] | Land and Building [Member] | ||
| Plant and Equipment (Details) - Schedule of Composition of Property and Equipment and Related Accumulated Depreciation [Line Items] | ||
| Balance | 630,000 | 630,000 |
| Additions | ||
| Disposals | ||
| Reclassifed among asset groups | ||
| Foreign currency translation impact | ||
| Balance | 630,000 | 630,000 |
| Cost [Member] | Machinery [Member] | ||
| Plant and Equipment (Details) - Schedule of Composition of Property and Equipment and Related Accumulated Depreciation [Line Items] | ||
| Balance | 408,358 | 202,247 |
| Additions | 77,259 | 135,450 |
| Disposals | (5,768) | |
| Reclassifed among asset groups | 76,426 | |
| Foreign currency translation impact | 3 | |
| Balance | 485,617 | 408,358 |
| Cost [Member] | Motor Vehicles [Member] | ||
| Plant and Equipment (Details) - Schedule of Composition of Property and Equipment and Related Accumulated Depreciation [Line Items] | ||
| Balance | 579,032 | 242,582 |
| Additions | 349,929 | |
| Disposals | (13,486) | |
| Reclassifed among asset groups | ||
| Foreign currency translation impact | 7 | |
| Balance | 579,032 | 579,032 |
| Cost [Member] | Office Equipment and Furniture [Member] | ||
| Plant and Equipment (Details) - Schedule of Composition of Property and Equipment and Related Accumulated Depreciation [Line Items] | ||
| Balance | 266,364 | 315,241 |
| Additions | 15,576 | 53,171 |
| Disposals | (12,259) | (21,292) |
| Reclassifed among asset groups | (76,426) | |
| Foreign currency translation impact | (2,406) | (4,330) |
| Balance | 267,275 | 266,364 |
| Cost [Member] | Computer Software [Member] | ||
| Plant and Equipment (Details) - Schedule of Composition of Property and Equipment and Related Accumulated Depreciation [Line Items] | ||
| Balance | 193,774 | 201,735 |
| Additions | ||
| Disposals | (99,442) | (269) |
| Reclassifed among asset groups | ||
| Foreign currency translation impact | (817) | (7,692) |
| Balance | 93,515 | 193,774 |
| Accumulated Depreciation and Amortization [Member] | ||
| Plant and Equipment (Details) - Schedule of Composition of Property and Equipment and Related Accumulated Depreciation [Line Items] | ||
| Balance | (614,680) | (473,166) |
| Depreciation | (213,531) | (174,007) |
| Disposals | 111,701 | 24,203 |
| Foreign currency translation impact | 910 | 8,290 |
| Balance | (715,600) | (614,680) |
| Accumulated Depreciation and Amortization [Member] | Land and Building [Member] | ||
| Plant and Equipment (Details) - Schedule of Composition of Property and Equipment and Related Accumulated Depreciation [Line Items] | ||
| Balance | ||
| Depreciation | ||
| Disposals | ||
| Foreign currency translation impact | ||
| Balance | ||
| Accumulated Depreciation and Amortization [Member] | Machinery [Member] | ||
| Plant and Equipment (Details) - Schedule of Composition of Property and Equipment and Related Accumulated Depreciation [Line Items] | ||
| Balance | (113,640) | (72,071) |
| Depreciation | (57,272) | (44,169) |
| Disposals | 2,602 | |
| Foreign currency translation impact | (2) | |
| Balance | (170,912) | (113,640) |
| Accumulated Depreciation and Amortization [Member] | Motor Vehicles [Member] | ||
| Plant and Equipment (Details) - Schedule of Composition of Property and Equipment and Related Accumulated Depreciation [Line Items] | ||
| Balance | (198,572) | (137,584) |
| Depreciation | (98,338) | (66,854) |
| Disposals | 5,869 | |
| Foreign currency translation impact | (3) | |
| Balance | (296,910) | (198,572) |
| Accumulated Depreciation and Amortization [Member] | Office Equipment and Furniture [Member] | ||
| Plant and Equipment (Details) - Schedule of Composition of Property and Equipment and Related Accumulated Depreciation [Line Items] | ||
| Balance | (156,000) | (135,591) |
| Depreciation | (35,170) | (38,907) |
| Disposals | 12,259 | 15,502 |
| Foreign currency translation impact | 1,627 | 2,996 |
| Balance | (177,284) | (156,000) |
| Accumulated Depreciation and Amortization [Member] | Computer Software [Member] | ||
| Plant and Equipment (Details) - Schedule of Composition of Property and Equipment and Related Accumulated Depreciation [Line Items] | ||
| Balance | (146,468) | (127,920) |
| Depreciation | (22,751) | (24,077) |
| Disposals | 99,442 | 230 |
| Foreign currency translation impact | (717) | 5,299 |
| Balance | $ (70,494) | $ (146,468) |
Mineral Property Interests (Details) ¥ in Millions |
1 Months Ended | 12 Months Ended | ||||||
|---|---|---|---|---|---|---|---|---|
|
Apr. 30, 2021
km²
|
Jun. 30, 2023
USD ($)
|
Jun. 30, 2022
USD ($)
|
Jun. 30, 2023
CNY (¥)
|
Jun. 25, 2022
USD ($)
|
Jun. 25, 2022
CNY (¥)
|
Dec. 31, 2019
km²
|
Jul. 20, 2017
km²
SquareMeter
|
|
| Mineral Property Interests (Details) [Line Items] | ||||||||
| Project elevation area (in Square Kilometers) | km² | 40.75 | 5.42 | ||||||
| Acquire interest rate | 98.00% | 98.00% | ||||||
| Ownership percentage | 100.00% | |||||||
| Renewable term | The agreement has a term of 30 years and is renewable for an additional 15 years. | |||||||
| Cash consideration | $ 2,986,188 | ¥ 20 | ||||||
| Loss | $ | $ 85,052 | |||||||
| Top of range [member] | ||||||||
| Mineral Property Interests (Details) [Line Items] | ||||||||
| Project elevation area (in Square Kilometers) | km² | 180 | 140 | ||||||
| Bottom of range [member] | ||||||||
| Mineral Property Interests (Details) [Line Items] | ||||||||
| Project elevation area (in Square Kilometers) | km² | 50 | 13 | ||||||
| Silver Sand [Member] | ||||||||
| Mineral Property Interests (Details) [Line Items] | ||||||||
| Project elevation area (in Square Kilometers) | km² | 33 | |||||||
| Project elevation area (in SquareMeter) | SquareMeter | 4,072 | |||||||
| Capitalized expenditures | $ | 6,316,500 | $ 7,639,287 | ||||||
| Bolivian [Member] | ||||||||
| Mineral Property Interests (Details) [Line Items] | ||||||||
| Ownership percentage | 100.00% | |||||||
| Silverstrike [member] | ||||||||
| Mineral Property Interests (Details) [Line Items] | ||||||||
| Capitalized expenditures | $ | 10,817,356 | 5,224,138 | ||||||
| Carangas [Member] | ||||||||
| Mineral Property Interests (Details) [Line Items] | ||||||||
| Capitalized expenditures | $ | 1,409,101 | $ 142,078 | ||||||
| Qinghai Found Mining Co., Ltd. [Member] | ||||||||
| Mineral Property Interests (Details) [Line Items] | ||||||||
| Cash compensation | $ 2,990,000 | ¥ 20 | ||||||
Mineral Property Interests (Details) - Schedule of Mineral Property Acquisition Costs and Deferred Exploration and Development Costs - USD ($) |
12 Months Ended | |
|---|---|---|
Jun. 30, 2023 |
Jun. 30, 2022 |
|
| Silver Sand [Member] | ||
| Mineral Property Interests (Details) - Schedule of Mineral Property Acquisition Costs and Deferred Exploration and Development Costs [Line Items] | ||
| Balance at beginning | $ 76,568,598 | $ 69,245,500 |
| Capitalized exploration expenditures | ||
| Reporting and assessment | 1,008,174 | 353,109 |
| Drilling and assaying | 1,925,695 | 4,990,082 |
| Project management and support | 2,719,120 | 1,917,060 |
| Camp service | 467,690 | 364,507 |
| Geological surveys | ||
| Permit and license | 195,821 | 14,529 |
| Disposition | ||
| Foreign currency impact | (201,972) | (316,189) |
| Ending at balance | 82,683,126 | 76,568,598 |
| Silverstrike [member] | ||
| Mineral Property Interests (Details) - Schedule of Mineral Property Acquisition Costs and Deferred Exploration and Development Costs [Line Items] | ||
| Balance at beginning | 3,269,232 | 3,163,304 |
| Capitalized exploration expenditures | ||
| Reporting and assessment | 40 | |
| Drilling and assaying | 977,881 | 1,625 |
| Project management and support | 256,569 | 45,773 |
| Camp service | 174,651 | 61,578 |
| Geological surveys | 25,508 | |
| Permit and license | 7,554 | |
| Disposition | ||
| Foreign currency impact | (24,680) | (36,150) |
| Ending at balance | 4,653,653 | 3,269,232 |
| Carangas [Member] | ||
| Mineral Property Interests (Details) - Schedule of Mineral Property Acquisition Costs and Deferred Exploration and Development Costs [Line Items] | ||
| Balance at beginning | 5,460,946 | 255,250 |
| Capitalized exploration expenditures | ||
| Reporting and assessment | 88,558 | |
| Drilling and assaying | 8,289,678 | 3,752,094 |
| Project management and support | 1,424,573 | 1,020,422 |
| Camp service | 1,005,158 | 443,810 |
| Geological surveys | ||
| Permit and license | 9,389 | 7,812 |
| Disposition | ||
| Foreign currency impact | (8,831) | (18,442) |
| Ending at balance | 16,269,471 | 5,460,946 |
| RZY Project [Member] | ||
| Mineral Property Interests (Details) - Schedule of Mineral Property Acquisition Costs and Deferred Exploration and Development Costs [Line Items] | ||
| Balance at beginning | 2,871,368 | |
| Capitalized exploration expenditures | ||
| Reporting and assessment | ||
| Drilling and assaying | ||
| Project management and support | ||
| Camp service | ||
| Geological surveys | ||
| Permit and license | ||
| Disposition | (3,071,240) | |
| Foreign currency impact | 199,872 | |
| Ending at balance | ||
| Total [Member] | ||
| Mineral Property Interests (Details) - Schedule of Mineral Property Acquisition Costs and Deferred Exploration and Development Costs [Line Items] | ||
| Balance at beginning | 85,298,776 | 75,535,422 |
| Capitalized exploration expenditures | ||
| Reporting and assessment | 1,096,732 | 353,149 |
| Drilling and assaying | 11,193,254 | 8,743,801 |
| Project management and support | 4,400,262 | 2,983,255 |
| Camp service | 1,647,499 | 869,895 |
| Geological surveys | 25,508 | |
| Permit and license | 205,210 | 29,895 |
| Disposition | (3,071,240) | |
| Foreign currency impact | (235,483) | (170,909) |
| Ending at balance | $ 103,606,250 | $ 85,298,776 |
Trade and Other Payables (Details) - Schedule of Trade and Other Payables - USD ($) |
Jun. 30, 2023 |
Jun. 30, 2022 |
|---|---|---|
| Schedule of Trade and Other Payables [Abstract] | ||
| Trade payable | $ 1,391,525 | $ 2,087,599 |
| Accrued liabilities | 889,028 | 1,404,670 |
| Total | $ 2,280,553 | $ 3,492,269 |
Related Party Transactions (Details) - Silvercorp [Member] ¥ in Millions |
12 Months Ended | ||
|---|---|---|---|
|
Jun. 30, 2023
USD ($)
|
Jun. 30, 2022
USD ($)
|
Jun. 30, 2022
CNY (¥)
|
|
| Related Party Transactions (Details) [Line Items] | |||
| General and administrative expenses | $ 844,949 | $ 726,387 | |
| Borrowings | $ 283,688 | ¥ 1.9 | |
| Loan interest | $ 23,422 | ||
Related Party Transactions (Details) - Schedule of Related Party Transactions - USD ($) |
Jun. 30, 2023 |
Jun. 30, 2022 |
|---|---|---|
| Silvercorp [Member] | ||
| Related Party Transactions (Details) - Schedule of Related Party Transactions [Line Items] | ||
| Silvercorp Metals Inc. | $ 56,102 | $ 377,031 |
Related Party Transactions (Details) - Schedule of Compensation of Key Management Personnel - USD ($) |
12 Months Ended | |
|---|---|---|
Jun. 30, 2023 |
Jun. 30, 2022 |
|
| Schedule Of Compensation Of Key Management Personnel Abstract | ||
| Director’s cash compensation | $ 59,715 | $ 82,608 |
| Director’s share-based compensation | 624,263 | 338,702 |
| Key management’s cash compensation | 867,499 | 988,753 |
| Key management’s share-based compensation | 2,137,888 | 461,947 |
| Total compensation of key management personnel | $ 3,689,365 | $ 1,872,010 |
Share Capital (Details) |
12 Months Ended | |||||
|---|---|---|---|---|---|---|
|
Feb. 28, 2022
USD ($)
$ / shares
shares
|
Jun. 30, 2023
USD ($)
$ / shares
shares
|
Jun. 30, 2023
$ / shares
|
Jun. 30, 2022
USD ($)
$ / shares
|
Jun. 30, 2022
$ / shares
|
Feb. 28, 2022
$ / shares
|
|
| Share Capital (Details) [Line Items] | ||||||
| Share based payment issued and outstanding percentage | 10.00% | |||||
| Share-based compensation expense | $ | $ 3,162,449 | $ 941,647 | ||||
| Project evaluation and corporate development expense | $ | 82,164 | 19,837 | ||||
| Capitalized under mineral property interests | $ | $ 1,303,558 | $ 164,943 | ||||
| Stock option description | a total of 1,186,000 (year ended June 30, 2022 – 2,702,000) options with a life of five years were granted to directors, officers, and employees at an exercise price of CAD$3.42 to CAD$3.92 (year ended June 30, 2022 – CAD$3.33 to CAD$4.00) per share subject to a vesting schedule over a three-year term with 1/6 of the options vesting every 6 months after the date of grant until fully vested. | |||||
| Weighted average grant date fair value of options granted (in Dollars per share) | $ / shares | $ 1.75 | $ 1.8 | ||||
| Option with exercise price of exercised | 4,000 | |||||
| Option with exercise price of exercised per share (in Dollars per share) | $ / shares | $ 4 | |||||
| Restricted stock units vested and distributed shares (in Shares) | shares | 114,168 | |||||
| Common shares in private placement (in Shares) | shares | 90,090 | |||||
| Private placement per share | (per share) | $ 2.45 | $ 3.33 | ||||
| Gross proceeds | $ | $ 220,442 | |||||
| Diluted loss per share (in Dollars per share) | $ / shares | ||||||
| Mr. Andrew Williams [Member] | ||||||
| Share Capital (Details) [Line Items] | ||||||
| Common shares in private placement (in Shares) | shares | 75,075 | |||||
| Mr. Dickson Hall [Member] | ||||||
| Share Capital (Details) [Line Items] | ||||||
| Common shares in private placement (in Shares) | shares | 15,015 | |||||
| Restricted Stock Units [Member] | ||||||
| Share Capital (Details) [Line Items] | ||||||
| Stock option description | a total of 967,000 (year ended June 30, 2022 – 1,299,000) RSUs were granted to directors, officers, employees, and consultants of the Company at grant date closing price of CAD$3.42 to CAD$3.92 per share (year ended June 30, 2022 – CAD$3.33 to CAD$4.00 per share) subject to a vesting schedule over a three-year term with 1/6 of the RSUs vesting every six months from the date of grant. | |||||
Share Capital (Details) - Schedule of Stock Options - Stock options [Member] - $ / shares |
12 Months Ended | |
|---|---|---|
Jun. 30, 2023 |
Jun. 30, 2022 |
|
| Share Capital (Details) - Schedule of Stock Options [Line Items] | ||
| Number of options, Balance | 3,662,167 | 3,115,832 |
| Weighted average exercise price, Balance | $ 3.18 | $ 1.56 |
| Number of options, Options Granted | 1,186,000 | 2,702,000 |
| Weighted average exercise price, Options Granted | $ 3.47 | $ 3.72 |
| Number of options, Options exercised | (445,000) | (1,838,331) |
| Weighted average exercise price, Options exercised | $ 1.82 | $ 1.23 |
| Number of options, Options forfeited | (446,000) | (317,334) |
| Weighted average exercise price, Options forfeited | $ 3.66 | $ 3.13 |
| Number of options, Balance | 3,957,167 | 3,662,167 |
| Weighted average exercise price, Balance | $ 3.37 | $ 3.18 |
Share Capital (Details) - Schedule of Options Granted - Black-Scholes option [Member] |
12 Months Ended | |
|---|---|---|
Jun. 30, 2023 |
Jun. 30, 2022 |
|
| Share Capital (Details) - Schedule of Options Granted [Line Items] | ||
| Risk free interest rate | 3.31% | 2.33% |
| Expected volatility | 79.79% | 76.40% |
| Expected life of options in years | 2 years 9 months | 2 years 9 months |
| Estimated forfeiture rate | 14.40% | 14.10% |
Share Capital (Details) - Schedule of Information about Stock Options Outstanding |
12 Months Ended |
|---|---|
|
Jun. 30, 2023
$ / shares
| |
| Share Capital (Details) - Schedule of Information about Stock Options Outstanding [Line Items] | |
| Number of options outstanding | 3,957,167 |
| Weighted average remaining contractual life (Years) | 3 years 4 months 28 days |
| Number of options exercisable | 1,468,166 |
| Weighted average exercise price | $ 2.92 |
| Bottom of Range [Member] | |
| Share Capital (Details) - Schedule of Information about Stock Options Outstanding [Line Items] | |
| Exercise price | 2.15 |
| Top of Range [Member] | |
| Share Capital (Details) - Schedule of Information about Stock Options Outstanding [Line Items] | |
| Exercise price | 4 |
| 2.15 [Member] | |
| Share Capital (Details) - Schedule of Information about Stock Options Outstanding [Line Items] | |
| Exercise price | $ 2.15 |
| Number of options outstanding | 774,167 |
| Weighted average remaining contractual life (Years) | 7 months 24 days |
| Number of options exercisable | 774,167 |
| Weighted average exercise price | $ 2.15 |
| 3.33 [Member] | |
| Share Capital (Details) - Schedule of Information about Stock Options Outstanding [Line Items] | |
| Exercise price | $ 3.33 |
| Number of options outstanding | 713,000 |
| Weighted average remaining contractual life (Years) | 3 years 7 months 6 days |
| Number of options exercisable | 237,667 |
| Weighted average exercise price | $ 3.33 |
| 3.42 [Member] | |
| Share Capital (Details) - Schedule of Information about Stock Options Outstanding [Line Items] | |
| Exercise price | $ 3.42 |
| Number of options outstanding | 939,000 |
| Weighted average remaining contractual life (Years) | 4 years 6 months 21 days |
| Number of options exercisable | |
| Weighted average exercise price | |
| 3.67 [Member] | |
| Share Capital (Details) - Schedule of Information about Stock Options Outstanding [Line Items] | |
| Exercise price | $ 3.67 |
| Number of options outstanding | 120,000 |
| Weighted average remaining contractual life (Years) | 4 years 6 months 25 days |
| Number of options exercisable | |
| Weighted average exercise price | |
| 3.89 [Member] | |
| Share Capital (Details) - Schedule of Information about Stock Options Outstanding [Line Items] | |
| Exercise price | $ 3.89 |
| Number of options outstanding | 10,000 |
| Weighted average remaining contractual life (Years) | 3 years 7 months 24 days |
| Number of options exercisable | 3,334 |
| Weighted average exercise price | $ 3.89 |
| 3.92 [Member] | |
| Share Capital (Details) - Schedule of Information about Stock Options Outstanding [Line Items] | |
| Exercise price | $ 3.92 |
| Number of options outstanding | 50,000 |
| Weighted average remaining contractual life (Years) | 4 years 9 months 14 days |
| Number of options exercisable | |
| Weighted average exercise price | |
| 4.00 [Member] | |
| Share Capital (Details) - Schedule of Information about Stock Options Outstanding [Line Items] | |
| Exercise price | $ 4 |
| Number of options outstanding | 1,351,000 |
| Weighted average remaining contractual life (Years) | 3 years 11 months 4 days |
| Number of options exercisable | 452,998 |
| Weighted average exercise price | $ 4 |
Share Capital (Details) - Schedule of Continuity RSUs - Restricted stock units [Member] |
12 Months Ended | |
|---|---|---|
|
Jun. 30, 2023
$ / shares
|
Jun. 30, 2022
$ / shares
|
|
| Share Capital (Details) - Schedule of Continuity RSUs [Line Items] | ||
| Number of shares, Balance | 1,477,216 | 794,900 |
| Weighted average exercise price, Balance | $ 4.11 | $ 5.48 |
| Number of shares, Granted | 967,000 | 1,299,000 |
| Weighted average exercise price, Granted | $ 3.48 | $ 3.8 |
| Number of shares, Forfeited | (222,801) | (274,451) |
| Weighted average exercise price, Forfeited | $ 4.01 | $ 5.25 |
| Number of shares, Distributed | (324,255) | (342,233) |
| Weighted average exercise price, Distributed | $ 4.2 | $ 5.21 |
| Number of shares, Balance | 1,897,160 | 1,477,216 |
| Weighted average exercise price, Balance | $ 3.79 | $ 4.11 |
Share Capital (Details) - Schedule of Loss Per Share - USD ($) |
12 Months Ended | |
|---|---|---|
Jun. 30, 2023 |
Jun. 30, 2022 |
|
| Schedule of Loss Per Share [Abstract] | ||
| Net loss Attributable to equity holders of the Company | $ (8,095,449) | $ (6,420,885) |
| Basic loss per share, Loss/Income | $ (8,095,449) | $ (6,420,885) |
| Basic loss per share, Shares | 156,991,661 | 155,626,128 |
| Basic loss per share, Per-Share | $ (0.05) | $ (0.04) |
| Effect of dilutive securities: | ||
| Stock options and RSUs, Shares | ||
| Diluted loss per share, Loss/Income | $ (8,095,449) | $ (6,420,885) |
| Diluted loss per share, Shares | 156,991,661 | 155,626,128 |
| Diluted loss per share, Per-Share | $ (0.05) | $ (0.04) |
Non-Controlling Interest (Details) |
12 Months Ended | |
|---|---|---|
Jun. 30, 2023 |
Jun. 30, 2022 |
|
| Non-Controlling Interest [Abstract] | ||
| Percentage of non-controlling interests | 18.00% | 18.00% |
Non-Controlling Interest (Details) - Schedule of Non-Controlling Interests - Qinghai Found [Member] - USD ($) |
12 Months Ended | |
|---|---|---|
Jun. 30, 2023 |
Jun. 30, 2022 |
|
| Non-Controlling Interest (Details) - Schedule of Non-Controlling Interests [Line Items] | ||
| Balance, Beginning | $ (71,199) | $ (3,590) |
| Share of net loss | (4,683) | (50,783) |
| Share of other comprehensive loss | (34,255) | (16,826) |
| Balance, Ending | $ (110,137) | $ (71,199) |
Financial Instruments (Details) - USD ($) |
12 Months Ended | |
|---|---|---|
Jun. 30, 2023 |
Jun. 30, 2022 |
|
| Financial Instruments (Details) [Line Items] | ||
| Working capital | $ 5,211,294 | |
| Other variables percentage | 1.00% | |
| Net income | $ 2,500 | |
| Trade and other receivables | $ 421,860 | $ 3,193,926 |
| Increase (decrease) in the market price of the securities held | 10.00% | |
| Increase (decrease) to net income | $ 30,000 | |
| Bolivianos [Member] | ||
| Financial Instruments (Details) [Line Items] | ||
| Other variables percentage | 1.00% | |
| Net income | $ 6,800 | |
| Trade and other receivables |
Financial Instruments (Details) - Schedule of Financial Assets Measured at Fair Value Level on Recurring Basis - USD ($) |
Jun. 30, 2023 |
Jun. 30, 2022 |
|---|---|---|
| Cash [Member] | ||
| Financial Assets | ||
| Financial Assets | $ 6,296,312 | $ 29,322,504 |
| Short-term investments [Member] | ||
| Financial Assets | ||
| Financial Assets | 198,375 | 192,398 |
| Equity investments [Member] | ||
| Financial Assets | ||
| Financial Assets | 283,081 | 496,741 |
| Level 1 [Member] | Cash [Member] | ||
| Financial Assets | ||
| Financial Assets | 6,296,312 | 29,322,504 |
| Level 1 [Member] | Short-term investments [Member] | ||
| Financial Assets | ||
| Financial Assets | 198,375 | 192,398 |
| Level 1 [Member] | Equity investments [Member] | ||
| Financial Assets | ||
| Financial Assets | 283,081 | 496,741 |
| Level 2 [Member] | Cash [Member] | ||
| Financial Assets | ||
| Financial Assets | ||
| Level 2 [Member] | Short-term investments [Member] | ||
| Financial Assets | ||
| Financial Assets | ||
| Level 2 [Member] | Equity investments [Member] | ||
| Financial Assets | ||
| Financial Assets | ||
| Level 3 [Member] | Cash [Member] | ||
| Financial Assets | ||
| Financial Assets | ||
| Level 3 [Member] | Short-term investments [Member] | ||
| Financial Assets | ||
| Financial Assets | ||
| Level 3 [Member] | Equity investments [Member] | ||
| Financial Assets | ||
| Financial Assets |
Financial Instruments (Details) - Schedule of Remaining Contractual Maturities of Financial Liabilities - USD ($) |
Jun. 30, 2023 |
Jun. 30, 2022 |
|---|---|---|
| Financial Instruments (Details) - Schedule of Remaining Contractual Maturities of Financial Liabilities [Line Items] | ||
| Accounts payable and accrued liabilities | $ 2,280,553 | $ 3,492,269 |
| Due to a related party | 56,102 | 377,031 |
| Total financial liabilities | 2,336,655 | $ 3,869,300 |
| Due Within A Year [Member] | ||
| Financial Instruments (Details) - Schedule of Remaining Contractual Maturities of Financial Liabilities [Line Items] | ||
| Accounts payable and accrued liabilities | 2,280,553 | |
| Due to a related party | 56,102 | |
| Total financial liabilities | $ 2,336,655 |
Financial Instruments (Details) - Schedule of Currency Risk Affect Net Income - USD ($) |
Jun. 30, 2023 |
Jun. 30, 2022 |
|---|---|---|
| Financial Instruments (Details) - Schedule of Currency Risk Affect Net Income [Line Items] | ||
| Financial assets | $ 1,190,863 | $ 1,354,902 |
| Financial liabilities | 1,617,859 | 1,619,261 |
| United States Dollars [Member] | ||
| Financial Instruments (Details) - Schedule of Currency Risk Affect Net Income [Line Items] | ||
| Financial assets | 320,994 | 468,714 |
| Financial liabilities | 73,970 | |
| Bolivianos [Member] | ||
| Financial Instruments (Details) - Schedule of Currency Risk Affect Net Income [Line Items] | ||
| Financial assets | 869,869 | 886,188 |
| Financial liabilities | $ 1,543,889 | $ 1,619,261 |
Income Taxes (Details) - USD ($) |
12 Months Ended | |
|---|---|---|
Jun. 30, 2023 |
Jun. 30, 2022 |
|
| Income Taxes [Abstract] | ||
| Operating losses, expiring year | 2043 | |
| Capital loss carry forward | $ 19,072,271 | $ 19,596,218 |
Income Taxes (Details) - Schedule of Provision of Income Tax Rates to Loss Before Income Tax - USD ($) |
12 Months Ended | |
|---|---|---|
Jun. 30, 2023 |
Jun. 30, 2022 |
|
| Schedule of Provision of Income Tax Rates to Loss Before Income Tax [Abstract] | ||
| Canadian statutory tax rate | 27.00% | 27.00% |
| Loss before income taxes | $ (8,100,132) | $ (6,471,668) |
| Income tax recovery computed at Canadian statutory rates | (2,187,036) | (1,747,348) |
| Foreign tax rates different from statutory rate | (178,193) | 234,160 |
| Permanent items and other | 1,169,318 | 459,813 |
| Change in unrecognized deferred tax assets | 1,195,911 | 1,053,375 |
| Income tax expense | ||
Income Taxes (Details) - Schedule of Temporary Differences and Unused Tax Losses - USD ($) |
Jun. 30, 2023 |
Jun. 30, 2022 |
|---|---|---|
| Income Taxes (Details) - Schedule of Temporary Differences and Unused Tax Losses [Line Items] | ||
| Deferred tax asset | $ 37,292,382 | $ 34,870,573 |
| Non-capital loss carry forward [Member] | ||
| Income Taxes (Details) - Schedule of Temporary Differences and Unused Tax Losses [Line Items] | ||
| Deferred tax asset | 16,926,886 | 13,633,304 |
| Capital loss carry forward [Member] | ||
| Income Taxes (Details) - Schedule of Temporary Differences and Unused Tax Losses [Line Items] | ||
| Deferred tax asset | 19,072,271 | 19,596,218 |
| Plant and equipment [Member] | ||
| Income Taxes (Details) - Schedule of Temporary Differences and Unused Tax Losses [Line Items] | ||
| Deferred tax asset | 217,340 | 190,799 |
| Equity investments [Member] | ||
| Income Taxes (Details) - Schedule of Temporary Differences and Unused Tax Losses [Line Items] | ||
| Deferred tax asset | 568,995 | 408,622 |
| Share issuance cost [Member] | ||
| Income Taxes (Details) - Schedule of Temporary Differences and Unused Tax Losses [Line Items] | ||
| Deferred tax asset | $ 506,890 | $ 1,041,630 |
Income Taxes (Details) - Schedule of Net Operating Losses Expiring in Various Years |
12 Months Ended |
|---|---|
|
Jun. 30, 2023
USD ($)
| |
| Canada [Member] | |
| Income Taxes (Details) - Schedule of Net Operating Losses Expiring in Various Years [Line Items] | |
| Net operating losses | $ 12,648,854 |
| Canada [Member] | 2023 [Member] | |
| Income Taxes (Details) - Schedule of Net Operating Losses Expiring in Various Years [Line Items] | |
| Net operating losses | |
| Canada [Member] | 2024 [Member] | |
| Income Taxes (Details) - Schedule of Net Operating Losses Expiring in Various Years [Line Items] | |
| Net operating losses | |
| Canada [Member] | 2026 [Member] | |
| Income Taxes (Details) - Schedule of Net Operating Losses Expiring in Various Years [Line Items] | |
| Net operating losses | |
| Canada [Member] | 2027 [Member] | |
| Income Taxes (Details) - Schedule of Net Operating Losses Expiring in Various Years [Line Items] | |
| Net operating losses | |
| Canada [Member] | 2028 [Member] | |
| Income Taxes (Details) - Schedule of Net Operating Losses Expiring in Various Years [Line Items] | |
| Net operating losses | |
| Canada [Member] | 2032 [Member] | |
| Income Taxes (Details) - Schedule of Net Operating Losses Expiring in Various Years [Line Items] | |
| Net operating losses | |
| Canada [Member] | 2033 [Member] | |
| Income Taxes (Details) - Schedule of Net Operating Losses Expiring in Various Years [Line Items] | |
| Net operating losses | |
| Canada [Member] | 2041 [Member] | |
| Income Taxes (Details) - Schedule of Net Operating Losses Expiring in Various Years [Line Items] | |
| Net operating losses | 3,251,360 |
| Canada [Member] | 2042 [Member] | |
| Income Taxes (Details) - Schedule of Net Operating Losses Expiring in Various Years [Line Items] | |
| Net operating losses | 3,496,560 |
| Canada [Member] | 2043 [Member] | |
| Income Taxes (Details) - Schedule of Net Operating Losses Expiring in Various Years [Line Items] | |
| Net operating losses | 5,900,934 |
| Bolivia [Member] | |
| Income Taxes (Details) - Schedule of Net Operating Losses Expiring in Various Years [Line Items] | |
| Net operating losses | 4,002,057 |
| Bolivia [Member] | 2023 [Member] | |
| Income Taxes (Details) - Schedule of Net Operating Losses Expiring in Various Years [Line Items] | |
| Net operating losses | 22,571 |
| Bolivia [Member] | 2024 [Member] | |
| Income Taxes (Details) - Schedule of Net Operating Losses Expiring in Various Years [Line Items] | |
| Net operating losses | 115,876 |
| Bolivia [Member] | 2026 [Member] | |
| Income Taxes (Details) - Schedule of Net Operating Losses Expiring in Various Years [Line Items] | |
| Net operating losses | 763,735 |
| Bolivia [Member] | 2027 [Member] | |
| Income Taxes (Details) - Schedule of Net Operating Losses Expiring in Various Years [Line Items] | |
| Net operating losses | 1,312,466 |
| Bolivia [Member] | 2028 [Member] | |
| Income Taxes (Details) - Schedule of Net Operating Losses Expiring in Various Years [Line Items] | |
| Net operating losses | 1,787,409 |
| Bolivia [Member] | 2032 [Member] | |
| Income Taxes (Details) - Schedule of Net Operating Losses Expiring in Various Years [Line Items] | |
| Net operating losses | |
| Bolivia [Member] | 2033 [Member] | |
| Income Taxes (Details) - Schedule of Net Operating Losses Expiring in Various Years [Line Items] | |
| Net operating losses | |
| Bolivia [Member] | 2041 [Member] | |
| Income Taxes (Details) - Schedule of Net Operating Losses Expiring in Various Years [Line Items] | |
| Net operating losses | |
| Bolivia [Member] | 2042 [Member] | |
| Income Taxes (Details) - Schedule of Net Operating Losses Expiring in Various Years [Line Items] | |
| Net operating losses | |
| Bolivia [Member] | 2043 [Member] | |
| Income Taxes (Details) - Schedule of Net Operating Losses Expiring in Various Years [Line Items] | |
| Net operating losses | |
| China [Member] | |
| Income Taxes (Details) - Schedule of Net Operating Losses Expiring in Various Years [Line Items] | |
| Net operating losses | 275,975 |
| China [Member] | 2023 [Member] | |
| Income Taxes (Details) - Schedule of Net Operating Losses Expiring in Various Years [Line Items] | |
| Net operating losses | |
| China [Member] | 2024 [Member] | |
| Income Taxes (Details) - Schedule of Net Operating Losses Expiring in Various Years [Line Items] | |
| Net operating losses | |
| China [Member] | 2026 [Member] | |
| Income Taxes (Details) - Schedule of Net Operating Losses Expiring in Various Years [Line Items] | |
| Net operating losses | |
| China [Member] | 2027 [Member] | |
| Income Taxes (Details) - Schedule of Net Operating Losses Expiring in Various Years [Line Items] | |
| Net operating losses | |
| China [Member] | 2028 [Member] | |
| Income Taxes (Details) - Schedule of Net Operating Losses Expiring in Various Years [Line Items] | |
| Net operating losses | |
| China [Member] | 2032 [Member] | |
| Income Taxes (Details) - Schedule of Net Operating Losses Expiring in Various Years [Line Items] | |
| Net operating losses | 251,040 |
| China [Member] | 2033 [Member] | |
| Income Taxes (Details) - Schedule of Net Operating Losses Expiring in Various Years [Line Items] | |
| Net operating losses | 24,935 |
| China [Member] | 2041 [Member] | |
| Income Taxes (Details) - Schedule of Net Operating Losses Expiring in Various Years [Line Items] | |
| Net operating losses | |
| China [Member] | 2042 [Member] | |
| Income Taxes (Details) - Schedule of Net Operating Losses Expiring in Various Years [Line Items] | |
| Net operating losses | |
| China [Member] | 2043 [Member] | |
| Income Taxes (Details) - Schedule of Net Operating Losses Expiring in Various Years [Line Items] | |
| Net operating losses |
Segmented Information (Details) |
12 Months Ended | |
|---|---|---|
Jun. 30, 2023 |
Jun. 30, 2022 |
|
| Exploration and Development [Member] | ||
| Segmented Information (Details) [Line Items] | ||
| Number of reportable operating segments | 3 | 4 |
| Corporate Segment [Member] | ||
| Segmented Information (Details) [Line Items] | ||
| Number of reportable operating segments | 1 | |
| Operating Segments [Member] | ||
| Segmented Information (Details) [Line Items] | ||
| Number of reportable operating segments | 4 | |
Segmented Information (Details) - Schedule of Segment Information for Assets and Liabilities - Segmented Information [Member] - USD ($) |
Jun. 30, 2023 |
Jun. 30, 2022 |
|---|---|---|
| Segmented Information (Details) - Schedule of Segment Information for Assets and Liabilities [Line Items] | ||
| Cash | $ 6,296,312 | $ 29,322,504 |
| Short-term investments | 198,375 | 192,398 |
| Equity investments | 283,081 | 496,741 |
| Plant and equipment | 1,339,839 | 1,462,848 |
| Mineral property interests | 103,606,250 | 85,298,776 |
| Other assets | 6,583,684 | 7,304,988 |
| Total Assets | 118,307,541 | 124,078,255 |
| Total Liabilities | (2,336,655) | (3,869,300) |
| Corporate [Member] | ||
| Segmented Information (Details) - Schedule of Segment Information for Assets and Liabilities [Line Items] | ||
| Cash | 6,232,985 | 27,721,156 |
| Short-term investments | 198,375 | 192,398 |
| Equity investments | 283,081 | 496,741 |
| Plant and equipment | 104,450 | 86,901 |
| Mineral property interests | ||
| Other assets | 908,823 | 3,507,076 |
| Total Assets | 7,727,714 | 32,004,272 |
| Total Liabilities | (1,307,795) | (1,693,443) |
| Exploration and Development [Member] | Silver Sand [Member] | ||
| Segmented Information (Details) - Schedule of Segment Information for Assets and Liabilities [Line Items] | ||
| Cash | 58,497 | 1,008,477 |
| Short-term investments | ||
| Equity investments | ||
| Plant and equipment | 517,065 | 665,207 |
| Mineral property interests | 82,683,126 | 76,568,598 |
| Other assets | 3,563,256 | 3,168,832 |
| Total Assets | 86,821,944 | 81,411,114 |
| Total Liabilities | (228,966) | (1,076,469) |
| Exploration and Development [Member] | Carangas [Member] | ||
| Segmented Information (Details) - Schedule of Segment Information for Assets and Liabilities [Line Items] | ||
| Cash | 260 | 584,375 |
| Short-term investments | ||
| Equity investments | ||
| Plant and equipment | 58,212 | 40,275 |
| Mineral property interests | 16,269,471 | 5,460,946 |
| Other assets | 1,888,293 | 559,763 |
| Total Assets | 18,216,236 | 6,645,359 |
| Total Liabilities | (795,379) | (1,092,415) |
| Exploration and Development [Member] | Silverstrike [Member] | ||
| Segmented Information (Details) - Schedule of Segment Information for Assets and Liabilities [Line Items] | ||
| Cash | 4,570 | 8,496 |
| Short-term investments | ||
| Equity investments | ||
| Plant and equipment | 660,112 | 670,465 |
| Mineral property interests | 4,653,653 | 3,269,232 |
| Other assets | 223,312 | 69,317 |
| Total Assets | 5,541,647 | 4,017,510 |
| Total Liabilities | $ (4,515) | $ (6,973) |
Segmented Information (Details) - Schedule of Segment Information for Operating Results - Segment Information [Member] - USD ($) |
12 Months Ended | |
|---|---|---|
Jun. 30, 2023 |
Jun. 30, 2022 |
|
| Segmented Information (Details) - Schedule of Segment Information for Operating Results [Line Items] | ||
| Project evaluation and corporate development | $ (460,901) | $ (582,253) |
| Salaries and benefits | (1,684,063) | (1,828,059) |
| Share-based compensation | (3,162,449) | (941,647) |
| Other operating expenses | (2,948,662) | (3,425,440) |
| Total operating expense | (8,256,075) | (6,777,399) |
| Net income from investments | 178,046 | 220,112 |
| Loss on disposal of plant and equipment | (14,804) | |
| Loss on disposal of mineral property interest | (85,052) | |
| Foreign exchange (loss) gain | (22,103) | 185,475 |
| Net loss | (8,100,132) | (6,471,668) |
| Equity holders of the Company | (8,095,449) | (6,420,885) |
| Non-controlling interests | (4,683) | (50,783) |
| Corporate [Member] | ||
| Segmented Information (Details) - Schedule of Segment Information for Operating Results [Line Items] | ||
| Project evaluation and corporate development | (460,901) | (582,253) |
| Salaries and benefits | (1,684,063) | (1,828,059) |
| Share-based compensation | (3,162,449) | (941,647) |
| Other operating expenses | (2,560,859) | (3,094,578) |
| Total operating expense | (7,868,272) | (6,446,537) |
| Net income from investments | 178,046 | 220,112 |
| Loss on disposal of plant and equipment | (14,804) | |
| Loss on disposal of mineral property interest | (85,052) | |
| Foreign exchange (loss) gain | (41,304) | 185,475 |
| Net loss | (7,731,530) | (6,140,806) |
| Equity holders of the Company | (7,726,847) | (6,090,023) |
| Non-controlling interests | (4,683) | (50,783) |
| Exploration and Development [Member] | Silver Sand [Member] | ||
| Segmented Information (Details) - Schedule of Segment Information for Operating Results [Line Items] | ||
| Project evaluation and corporate development | ||
| Salaries and benefits | ||
| Share-based compensation | ||
| Other operating expenses | (294,361) | (270,102) |
| Total operating expense | (294,361) | (270,102) |
| Net income from investments | ||
| Loss on disposal of plant and equipment | ||
| Loss on disposal of mineral property interest | ||
| Foreign exchange (loss) gain | 4,296 | |
| Net loss | (290,065) | (270,102) |
| Equity holders of the Company | (290,065) | (270,102) |
| Non-controlling interests | ||
| Exploration and Development [Member] | Carangas [Member] | ||
| Segmented Information (Details) - Schedule of Segment Information for Operating Results [Line Items] | ||
| Project evaluation and corporate development | ||
| Salaries and benefits | ||
| Share-based compensation | ||
| Other operating expenses | (71,971) | (50,459) |
| Total operating expense | (71,971) | (50,459) |
| Net income from investments | ||
| Loss on disposal of plant and equipment | ||
| Loss on disposal of mineral property interest | ||
| Foreign exchange (loss) gain | 13,620 | |
| Net loss | (58,351) | (50,459) |
| Equity holders of the Company | (58,351) | (50,459) |
| Non-controlling interests | ||
| Exploration and Development [Member] | Silverstrike [Member] | ||
| Segmented Information (Details) - Schedule of Segment Information for Operating Results [Line Items] | ||
| Project evaluation and corporate development | ||
| Salaries and benefits | ||
| Share-based compensation | ||
| Other operating expenses | (21,471) | (10,301) |
| Total operating expense | (21,471) | (10,301) |
| Net income from investments | ||
| Loss on disposal of plant and equipment | ||
| Loss on disposal of mineral property interest | ||
| Foreign exchange (loss) gain | 1,285 | |
| Net loss | (20,186) | (10,301) |
| Equity holders of the Company | (20,186) | (10,301) |
| Non-controlling interests | ||
Supplementary Cash Flow Information (Details) - Schedule of Change in Non-Cash Operating Working Capital - USD ($) |
12 Months Ended | |
|---|---|---|
Jun. 30, 2023 |
Jun. 30, 2022 |
|
| Schedule of Change in Non Cash Operating Working Capital [Abstract] | ||
| Receivables | $ (215,425) | $ 30,117 |
| Deposits and prepayments | (306,662) | 27,796 |
| Accounts payable and accrued liabilities | (256,447) | 551,707 |
| Due to a related party | (307,610) | 316,180 |
| Total changes in non-cash operating working capital | $ (1,086,144) | $ 925,800 |
Supplementary Cash Flow Information (Details) - Schedule of Non-Cash Capital Transactions - USD ($) |
12 Months Ended | |
|---|---|---|
Jun. 30, 2023 |
Jun. 30, 2022 |
|
| Schedule of Non-Cash Capital Transactions [Abstract] | ||
| Addition of capital expenditures of mineral property interest from deposits and prepayments | $ 143,495 | |
| (Payment) addition of capital expenditures of mineral property interest in accounts payable and accrued liabilities | $ (929,408) | $ 1,910,439 |
1 Year New Pacific Metals Chart |
1 Month New Pacific Metals Chart |

It looks like you are not logged in. Click the button below to log in and keep track of your recent history.
Support: +44 (0) 203 8794 460 | support@advfn.com
By accessing the services available at ADVFN you are agreeing to be bound by ADVFN's Terms & Conditions

 Hot Features


