We could not find any results for:
Make sure your spelling is correct or try broadening your search.
| Share Name | Share Symbol | Market | Type |
|---|---|---|---|
| abrdn Asiapacific Income Fund Inc | AMEX:FAX | AMEX | Common Stock |
| Price Change | % Change | Share Price | High Price | Low Price | Open Price | Shares Traded | Last Trade | |
|---|---|---|---|---|---|---|---|---|
| -0.015 | -0.57% | 2.605 | 2.62 | 2.59 | 2.60 | 448,452 | 17:50:48 |
UNITED STATES
SECURITIES AND EXCHANGE COMMISSION
Washington, D.C. 20549
FORM N-CSR
CERTIFIED SHAREHOLDER REPORT OF REGISTERED MANAGEMENT INVESTMENT COMPANIES
| Investment Company Act file number: | 811-04611 |
| Exact name of registrant as specified in charter: | abrdn Asia-Pacific Income Fund, Inc. |
| Address of principal executive offices: | 1900 Market Street, Suite 200 |
| Philadelphia, PA 19103 | |
| Name and address of agent for service: | Sharon Ferrari |
| abrdn Inc. | |
| 1900 Market Street, Suite 200 | |
| Philadelphia, PA 19103 | |
| Registrant’s telephone number, including area code: | 1-800-522-5465 |
| Date of fiscal year end: | October 31 |
| Date of reporting period: | April 30, 2023 |
Item 1. Reports to Stockholders.
(a) A copy of the report transmitted to shareholders pursuant to Rule 30e-1 under the Investment Company Act of 1940 (the “1940 Act”) is filed herewith.
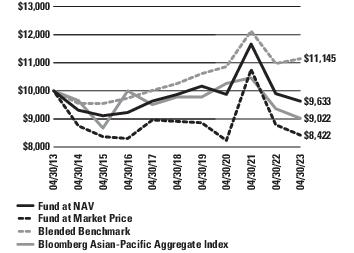
| 1 | Past performance is no guarantee of future results. Investment returns and principal value will fluctuate and shares, when sold, may be worth more or less than original cost. Current performance may be lower or higher than the performance quoted. Net asset value return data includes investment management fees, custodial charges and administrative fees (such as Director and legal fees) and assumes the reinvestment of all distributions. |
| 2 | Assuming the reinvestment of dividends and distributions. |
| 3 | The Fund’s total return is based on the reported NAV for each financial reporting period end and may differ from what is reported on the Financial Highlights due to financial statement rounding or adjustments. |
| 4 | Blended Benchmark as defined in Total Investment Return section on Page 6. |
| abrdn Asia-Pacific Income Fund, Inc. | 1 |
| * | S&P’s ratings are expressed as letter grades that range from ‘AAA’ to ‘D’ to communicate the agency’s opinion of relative level of credit risk. Ratings from ‘AA’ to ‘CCC’ may be modified by the addition of a plus (+) or minus (-) sign to show relative standing within the major rating categories. The investment grade category is a rating from ‘AAA’ to ‘BBB-’. |
| ** | Moody’s is an independent, unaffiliated research company that rates fixed income securities. Moody’s assigns ratings on the basis of risk and the borrower’s ability to make interest payments. Typically, securities are assigned a rating from ‘Aaa’ to ‘C’, with ‘Aaa’ being the highest quality and ‘C’ the lowest quality. |
| *** | Fitch is an international credit rating agency. Fitch ratings range from AAA (reliable and stable) to D (high risk). |
| 2 | abrdn Asia-Pacific Income Fund, Inc. |
| • | Visit: https://www.abrdn.com/en-us/cefinvestorcenter |
| • | Email: Investor.Relations@abrdn.com; or |
| • | Call: 1-800-522-5465 (toll free in the U.S.). |
| abrdn Asia-Pacific Income Fund, Inc. | 3 |
| 4 | abrdn Asia-Pacific Income Fund, Inc. |
| abrdn Asia-Pacific Income Fund, Inc. | 5 |
| 6 Months | 1 Year | 3 Years | 5 Years | 10 Years | |
| Net Asset Value (NAV) | 17.69% | -2.70% | -0.82% | -0.48% | -0.37% |
| Market Price | 21.09% | -4.78% | 0.55% | -1.24% | -1.76% |
| Blended Benchmark* | 12.43% | 8.19% | -0.50% | 2.77% | 3.38% |
| Bloomberg Asian-Pacific Aggregate Index1 | 8.99% | -3.64% | -4.21% | -1.61% | -1.02% |
| * | The blended benchmark is summarized in the table below: |
| Weight | |
| Bloomberg AusBond Composite Index2 | 10.0% |
| Markit iBoxx Asian Local Bond Index3 | 40.0% |
| J.P. Morgan Asian Credit Diversified Index4 | 35.0% |
| J.P. Morgan EMBI Global Diversified Index5 | 15.0% |
| 1 | The Bloomberg Asian-Pacific Aggregate Index contains fixed-rate, investment-grade securities denominated in Australian dollar, Chinese yuan, Hong Kong dollar, Indonesian rupiah, Japanese yen, Malaysian ringgit, New Zealand dollar, Singapore dollar, South Korean won and Thai baht. The index is composed primarily of local currency sovereign debt, but also includes government-related, corporate and securitized bonds. |
| 2 | The Bloomberg AusBond Composite Bond Index includes investment grade fixed interest bonds of all maturities issued in the Australian debt market under Australian law. |
| 3 | The Markit iBoxx Asia Local Bond Index (“iBoxx ALBI”) is designed to reflect the performance of local currency bonds from 11 Asian local currency bond markets. |
| 4 | The J.P. Morgan Asian Credit Diversified Index is a variant of the JP Morgan Asia Credit Index ("JACI") that focuses on reducing concentration risk of the JACI index to any particular market. The JACI is a broad-based securities market index which consists of liquid US dollar-denominated debt securities issued out of the Asia ex-Japan region. |
| 5 | The J.P. Morgan EMBI Global Diversified Index is a comprehensive global local emerging markets index comprising liquid, fixed rate, domestic currency government bonds. |
| 6 | abrdn Asia-Pacific Income Fund, Inc. |
| abrdn Asia-Pacific Income Fund, Inc. | 7 |
| Date | AAA/Aaa % | AA/Aa % | A % | BBB/Baa % | BB/Ba* % | B* % | CCC/CC/C* % | NR** % |
| April 30, 2023 | 3.6 | 6.0 | 8.0 | 56.3 | 12.7 | 5.7 | 2.9 | 4.8 |
| October 31, 2022 | 2.4 | 3.9 | 7.3 | 32.1 | 12.3 | 6.2 | 2.1 | 34.3 |
| April 30, 2022 | 4.4 | 4.6 | 5.8 | 28.0 | 11.6 | 8.1 | 1.8 | 36.3 |
| * | Below investment grade |
| ** | Not Rated |
| (1) | For financial reporting purposes, credit quality ratings shown above reflect the lowest rating assigned by either S&P, Moody’s or Fitch if ratings differ. These rating agencies are independent, nationally recognized statistical rating organizations and are widely used. Investment grade ratings are credit ratings of BBB/Baa or higher. Below investment grade ratings are credit ratings of BB/Ba or lower. Investments designated NR are not rated by these rating agencies. Unrated investments do not necessarily indicate low credit quality. Credit quality ratings are subject to change. The Investment Manager evaluates the credit quality of unrated investments based upon, but not limited to, credit ratings for similar investments. |
| Date | Asia (including NZ) % | Latin America % | Australia % | Europe % | Other, < 5 % |
| April 30, 2023 | 75.5 | 7.5 | 7.4 | 2.0 | 7.6 |
| October 31, 2022 | 76.2 | 6.4 | 7.3 | 5.2 | 4.9 |
| April 30, 2022 | 74.8 | 5.2 | 11.0 | 4.5 | 4.5 |
| Date | U.S. Dollar % | Asian Currencies (including NZ Dollar) % | Latin American Currencies % | Australian Dollar % | Other, < 5 % |
| April 30, 2023 | 45.6 | 41.2 | 7.5 | 5.2 | 0.5 |
| October 31, 2022 | 57.2 | 35.2 | 6.4 | 0.9 | 0.3 |
| April 30, 2022 | 37.8 | 47.7 | 5.2 | 9.0 | 0.3 |
| 8 | abrdn Asia-Pacific Income Fund, Inc. |
| Date | Under 3 Years % | 3 to 5 Years % | 5 to 10 Years % | 10 Years & Over % |
| April 30, 2023 | 48.2 | 32.9 | 18.9 | - |
| October 31, 2022 | 24.4 | 16.0 | 39.9 | 19.7 |
| April 30, 2022 | 28.0 | 15.9 | 36.3 | 19.8 |
| * | Modified duration is a measure of the sensitivity of the price of a bond to the fluctuations in interest rates. |
| abrdn Asia-Pacific Income Fund, Inc. | 9 |
| Apr–23 | Oct–22 | Apr-22 | ||
| Australia | 90 day Bank Bills | 3.68% | 3.09% | 0.70% |
| 10 yr bond | 0.00% | 3.14% | 1.83% | |
| currency local per 1USD | $1.51 | $1.56 | $1.41 | |
| South Korea | 90 day commercial paper | 3.52% | 3.96% | 1.72% |
| 10 yr bond | 3.37% | 4.23% | 3.24% | |
| currency local per 1USD | ₩1,338.40 | ₩1,424.45 | ₩1,256.00 | |
| Thailand | 3 months deposit rate | 0.85% | 0.55% | 0.38% |
| 10 yr bond | 2.53% | 3.19% | 2.71% | |
| currency local per 1USD | ฿34.15 | ฿38.06 | ฿34.25 | |
| Philippines | 90 day T-Bills | 5.82% | 3.75% | 1.25% |
| 10 yr bond | 6.12% | 7.46% | 6.00% | |
| currency local per 1USD | ₱55.39 | ₱57.95 | ₱52.21 | |
| Malaysia | 3-month T-Bills | 2.85% | 2.71% | 1.80% |
| 10 yr bond | 3.73% | 4.37% | 4.38% | |
| currency local per 1USD | RM4.46 | RM4.37 | RM4.35 | |
| Singapore | 3-month T-Bills | 3.94% | 4.05% | 1.29% |
| 10 yr bond | 2.76% | 3.43% | 2.53% | |
| currency local per 1USD | S$1.33 | S$1.42 | S$1.38 | |
| India | 3-month T-Bills | 6.78% | 6.42% | 4.04% |
| 10 yr bond | 7.11% | 7.45% | 7.14% | |
| currency local per 1USD | ₹81.84 | ₹82.78 | ₹76.44 | |
| Indonesia | 3 months deposit rate | 3.94% | 3.55% | 3.26% |
| 10 yr bond | 6.51% | 7.51% | 6.97% | |
| currency local per 1USD | Rp14,670.00 | Rp15,597.50 | Rp14,497.00 | |
| China Onshore | 3-month Bill Yield | 2.00% | 1.60% | 1.84% |
| 10 yr bond | 2.78% | 2.64% | 2.84% | |
| currency local per 1USD | ¥6.93 | ¥7.30 | ¥6.59 | |
| Sri Lanka | 3-month Generic Govt Yield | 25.06% | 31.84% | 20.33% |
| 10 yr bond | 23.37% | 27.68% | 17.26% | |
| currency local per 1USD | Rs320.86 | Rs365.50 | Rs351.32 | |
| USD Denominated Bonds | Indonesia (3 months) | 4.44% | 5.88% | 4.01% |
| Sri Lanka (3 Months) | 34.68% | 0.00% | 24.45% |
| 10 | abrdn Asia-Pacific Income Fund, Inc. |
| abrdn Asia-Pacific Income Fund, Inc. | 11 |
| 12 | abrdn Asia-Pacific Income Fund, Inc. |
| abrdn Asia-Pacific Income Fund, Inc. | 13 |
| 14 | abrdn Asia-Pacific Income Fund, Inc. |
| abrdn Asia-Pacific Income Fund, Inc. | 15 |
| At April 30, 2023, the Fund held the following futures contracts: |
| Futures Contracts | Number of Contracts Long/(Short) | Expiration Date | Notional Amount | Market Value | Unrealized Appreciation/ (Depreciation) |
| Long Contract Positions | |||||
| Korea Treasury Bond - 10 year | 404 | 6/20/2023 | $34,371,996 | $34,329,737 | $(42,259) |
| United States Treasury Bond | 265 | 6/21/2023 | 35,658,739 | 37,472,656 | 1,813,917 |
| United States Treasury Note 6%—5 year | 283 | 6/30/2023 | 30,347,744 | 31,057,039 | 709,295 |
| $2,480,953 | |||||
| Short Contract Positions | |||||
| United States Treasury Note 6%—10 year | (417) | 6/21/2023 | $(2,800,837) | $(3,225,687) | $(424,850) |
| United States Treasury Note 6%—5 year | (283) | 6/30/2023 | (30,346,521) | (31,057,039) | (710,518) |
| $(1,135,368) | |||||
| $1,345,585 |
| At April 30, 2023, the Fund held the following forward foreign currency contracts: |
| Purchase Contracts Settlement Date* | Counterparty | Currency Purchased | Amount Purchased | Currency Sold | Amount Sold | Fair Value | Unrealized Appreciation/ (Depreciation) | |
| Chinese Yuan Renminbi Offshore/United States Dollar | ||||||||
| 07/12/2023 | UBS AG | CNH | 344,887,172 | USD | 50,414,804 | $50,066,124 | $(348,680) | |
| Philippine Peso/United States Dollar | ||||||||
| 05/02/2023 | Citibank N.A. | PHP | 154,740,378 | USD | 2,785,857 | 2,793,903 | 8,046 | |
| 05/02/2023 | Citibank N.A. | PHP | 51,580,126 | USD | 941,346 | 931,301 | (10,045) | |
| 07/25/2023 | Citibank N.A. | PHP | 180,095,126 | USD | 3,215,929 | 3,251,826 | 35,897 | |
| Singapore Dollar/United States Dollar | ||||||||
| 05/19/2023 | Citibank N.A. | SGD | 44,367,832 | USD | 33,245,949 | 33,267,901 | 21,952 | |
| South Korean Won/United States Dollar | ||||||||
| 06/15/2023 | Citibank N.A. | KRW | 16,212,275,845 | USD | 12,346,160 | 12,152,688 | (193,472) | |
| 06/15/2023 | Royal Bank of Canada | KRW | 3,548,799,000 | USD | 2,664,329 | 2,660,172 | (4,157) | |
| Thai Baht/United States Dollar | ||||||||
| 05/30/2023 | UBS AG | THB | 1,076,894,529 | USD | 30,882,238 | 31,621,080 | 738,842 | |
| $136,744,995 | $248,383 | |||||||
| Sale Contracts Settlement Date* | Counterparty | Currency Purchased | Amount Purchased | Currency Sold | Amount Sold | Fair Value | Unrealized Appreciation/ (Depreciation) | |
| United States Dollar/Chinese Renminbi | ||||||||
| 07/12/2023 | State Street Bank & Trust Co. | USD | 6,413,753 | CNY | 43,959,000 | $6,386,832 | $26,921 | |
| United States Dollar/Indian Rupee | ||||||||
| 06/01/2023 | HSBC Bank PLC | USD | 4,270,573 | INR | 350,816,000 | 4,287,096 | (16,523) | |
| 06/01/2023 | UBS AG | USD | 1,930,713 | INR | 160,405,611 | 1,960,213 | (29,500) | |
| 16 | abrdn Asia-Pacific Income Fund, Inc. |
| Sale Contracts Settlement Date* | Counterparty | Currency Purchased | Amount Purchased | Currency Sold | Amount Sold | Fair Value | Unrealized Appreciation/ (Depreciation) | |
| United States Dollar/Indonesian Rupiah | ||||||||
| 06/26/2023 | Citibank N.A. | USD | 4,195,343 | IDR | 62,720,369,732 | $4,274,416 | $(79,073) | |
| 06/26/2023 | HSBC Bank PLC | USD | 7,162,698 | IDR | 105,177,354,000 | 7,167,874 | (5,176) | |
| United States Dollar/Malaysian Ringgit | ||||||||
| 06/16/2023 | BNP Paribas S.A. | USD | 8,404,669 | MYR | 37,162,000 | 8,356,805 | 47,864 | |
| 06/16/2023 | Standard Chartered Bank | USD | 25,276,012 | MYR | 111,165,703 | 24,998,388 | 277,624 | |
| United States Dollar/Philippine Peso | ||||||||
| 05/02/2023 | Citibank N.A. | USD | 941,346 | PHP | 51,580,126 | 931,301 | 10,045 | |
| 05/02/2023 | Citibank N.A. | USD | 2,785,857 | PHP | 154,740,378 | 2,793,903 | (8,046) | |
| 07/25/2023 | Citibank N.A. | USD | 925,354 | PHP | 51,580,126 | 931,339 | (5,985) | |
| United States Dollar/Singapore Dollar | ||||||||
| 05/19/2023 | Citibank N.A. | USD | 8,733,736 | SGD | 11,566,000 | 8,672,421 | 61,315 | |
| 05/19/2023 | Royal Bank of Canada | USD | 3,214,920 | SGD | 4,298,000 | 3,222,728 | (7,808) | |
| $73,983,316 | $271,658 | |||||||
| Unrealized appreciation on forward foreign currency exchange contracts | $1,228,506 | |||||||
| Unrealized depreciation on forward foreign currency exchange contracts | $(708,465) | |||||||
| * | Certain contracts with different trade dates and like characteristics have been shown net. |
| At April 30, 2023, the Fund held the following centrally cleared interest rate swaps: |
| Currency | Notional Amount | Expiration Date | Counterparty | Receive (Pay) Floating Rate | Floating Rate Index | Fixed Rate | Frequency of Paid Payments Made | Premiums Paid (Received) | Value | Unrealized Appreciation/ (Depreciation) |
| USD | 25,000,000 | 03/17/2033 | UBS AG | Receive | 12-month SOFR | 3.38% | Annually | $- | $(391,862) | $(391,862) |
| USD | 20,000,000 | 03/17/2030 | UBS AG | Receive | 12-month SOFR | 3.46% | Annually | - | (249,897) | (249,897) |
| USD | 20,000,000 | 03/17/2032 | UBS AG | Receive | 12-month SOFR | 3.40% | Annually | - | (299,076) | (299,076) |
| $- | $(940,835) | $(940,835) | ||||||||
| abrdn Asia-Pacific Income Fund, Inc. | 17 |
| Assets | |
| Investments, at value (cost $1,245,267,303) | $1,076,024,918 |
| Short-term investments, at value (cost $39,473,909) | 39,473,909 |
| Foreign currency, at value (cost $7,624,391) | 7,531,218 |
| Cash | 398,682 |
| Cash at broker for interest rate swaps | 3,332,282 |
| Cash at broker for futures contracts | 3,488,736 |
| Cash at broker for forward foreign currency contracts | 300,000 |
| Receivable for investments sold | 4,758,826 |
| Interest receivable | 19,610,256 |
| Unrealized appreciation on forward foreign currency exchange contracts | 1,228,506 |
| Variation margin receivable for futures contracts | 4,877,922 |
| Variation margin receivable for centrally cleared swaps | 659,516 |
| Prepaid expenses in connection with revolving credit facility, senior secured notes, term loans and Series A Mandatory Redeemable Preferred Shares (Note 9) | 1,497,180 |
| Prepaid expenses and other assets | 21,366 |
| Total assets | 1,163,203,317 |
| Liabilities | |
| Senior secured notes payable (Note 8) | 250,000,000 |
| Revolving credit facility payable (Note 9) | 65,000,000 |
| Series A Mandatory Redeemable Preferred Shares ($25.00liquidation value per share,2,000,000shares outstanding) (Note 7) | 50,000,000 |
| Payable for investments purchased | 9,661,007 |
| Interest payable on revolving credit facility and senior secured notes | 3,249,805 |
| Unrealized depreciation on forward foreign currency exchange contracts | 708,465 |
| Investment management fees payable (Note 3) | 538,423 |
| Deferred foreign capital gains tax (Note 2i) | 336,188 |
| Cash collateral due to broker | 323,425 |
| Dividend payable on Series A Mandatory Redeemable Preferred Shares | 252,084 |
| Administration fees payable (Note 3) | 115,082 |
| Investor relations fees payable (Note 3) | 84,551 |
| Other accrued expenses | 985,793 |
| Total liabilities | 381,254,823 |
| Net Assets Applicable to Common Shareholders | $781,948,494 |
| Composition of Net Assets | |
| Common stock (par value $0.01 per share) (Note 5) | $2,476,958 |
| Paid-in capital in excess of par | 1,088,987,942 |
| Distributable accumulated loss | (309,516,406) |
| Net Assets Applicable to Common Shareholders | $781,948,494 |
| Net asset value per share based on 247,695,769 shares issued and outstanding | $3.16 |
| 18 | abrdn Asia-Pacific Income Fund, Inc. |
| Net Investment Income | |
| Investment Income: | |
| Interest and amortization of discount and premium and other income (net of foreign withholding taxes of $796,988) | $34,777,651 |
| Total investment income | 34,777,651 |
| Expenses: | |
| Investment management fee (Note 3) | 3,233,505 |
| Administration fee (Note 3) | 691,331 |
| Bank loan fees and expenses | 376,730 |
| Custodian’s fees and expenses | 261,831 |
| Investor relations fees and expenses (Note 3) | 126,656 |
| Directors' fees and expenses | 105,502 |
| Reports to shareholders and proxy solicitation | 104,505 |
| Legal fees and expenses | 101,703 |
| Transfer agent’s fees and expenses | 55,740 |
| Independent auditors’ fees and expenses | 49,847 |
| Insurance expense | 41,982 |
| Miscellaneous | 56,075 |
| Total operating expenses, excluding interest expense | 5,205,407 |
| Interest expense (Notes 8 & 9) | 6,576,195 |
| Distributions to Series A Mandatory Redeemable Preferred Shares (Note 7) | 1,036,979 |
| Net operating expenses | 12,818,581 |
| Net investment income applicable to common shareholders | 21,959,070 |
| Net Realized/Unrealized Gain/(Loss) from Investments and Foreign Currency Related Transactions: | |
| Net realized gain/(loss) from: | |
| Investment transactions (including $480 capital gains tax) | (13,903,617) |
| Futures contracts | 1,070,217 |
| Interest rate swaps | 3,711 |
| Forward foreign currency exchange contracts | (4,689,825) |
| Foreign currency transactions | (6,010,085) |
| (23,529,599) | |
| Net change in unrealized appreciation/(depreciation) on: | |
| Investments (including change in deferred capital gains tax of $310,166) | 79,873,243 |
| Interest rate swaps | (940,835) |
| Futures contracts | 2,852,229 |
| Forward foreign currency exchange contracts | 3,146,667 |
| Foreign currency translation | 33,525,105 |
| 118,456,409 | |
| Net realized and unrealized gain from investments, interest rate swaps, futures contracts, forward foreign currency exchange contracts and foreign currencies | 94,926,810 |
| Change in Net Assets Applicable to Common Shareholders Resulting from Operations | $116,885,880 |
| abrdn Asia-Pacific Income Fund, Inc. | 19 |
| For the Six-Month Period Ended April 30, 2023 (unaudited) | For the Year Ended October 31, 2022 | |
| Increase/(Decrease) in Net Assets Applicable to Common Shareholders: | ||
| Operations: | ||
| Net investment income | $21,959,070 | $43,323,611 |
| Net realized loss from investments, interest rate swaps, futures contracts, forward foreign currency exchange contracts and foreign currency transactions | (23,529,599) | (80,291,810) |
| Net change in unrealized appreciation/(depreciation) on investments, interest rate swaps, futures contracts, forward foreign currency exchange contracts and foreign currency translation | 118,456,409 | (260,743,719) |
| Net increase/(decrease) in net assets applicable to common shareholders resulting from operations | 116,885,880 | (297,711,918) |
| Distributions to Common Shareholders From: | ||
| Distributable earnings | (40,869,813) | (22,362,158) |
| Return of capital | – | (59,377,467) |
| Net decrease in net assets applicable to common shareholders from distributions | (40,869,813) | (81,739,625) |
| Change in net assets applicable to common shareholders | 76,016,067 | (379,451,543) |
| Net Assets Applicable to Common Shareholders: | ||
| Beginning of period | 705,932,427 | 1,085,383,970 |
| End of period | $781,948,494 | $705,932,427 |
| 20 | abrdn Asia-Pacific Income Fund, Inc. |
| Cash flows from operating activities: | |
| Net increase/(decrease) in net assets resulting from operations | $116,885,880 |
| Adjustments to reconcile net increase in net assets resulting from operations to net cash provided by operating activities: | |
| Investments purchased | (166,803,967) |
| Investments sold and principal repayments | 219,608,879 |
| Increase in short-term investments, excluding foreign government | (16,546,429) |
| Net amortization/accretion of premium (discount) | (1,510,668) |
| Increase in cash due to broker | 323,425 |
| Increase in interest and dividends receivable | (92,247) |
| Net change unrealized appreciation on forward foreign currency exchange contracts | (3,146,667) |
| Decrease in prepaid expenses | 176,616 |
| Increase in interest payable on bank loan | 17,875 |
| Decrease in accrued investment management fees payable | (6,760) |
| Increase in other accrued expenses | 538,284 |
| Increase/(decrease) in variation margin payable for futures contracts | (2,326,232) |
| Net change in unrealized appreciation of investments | (79,873,243) |
| Net change in unrealized appreciation on foreign currency translations | (33,525,105) |
| Net realized loss on investments transactions | 13,903,617 |
| Total Cash flows from operating activities | 47,623,258 |
| Cash flows from financing activities: | |
| Increase (decrease) in payable to custodian | $(327,329) |
| Distributions paid to shareholders | (40,869,813) |
| Net cash paid (received) for swap contracts | (659,516) |
| Net cash used in financing activities | (41,856,658) |
| Effect of exchange rate on cash | 12,187 |
| Net change in cash | 5,778,787 |
| Unrestricted and restricted cash and foreign currency, beginning of year | 9,272,131 |
| Unrestricted and restricted cash and foreign currency, end of year | $15,050,918 |
| Supplemental disclosure of cash flow information: | |
| Cash paid for interest and fees on borrowing | 6,558,320 |
| abrdn Asia-Pacific Income Fund, Inc. | 21 |
| Reconciliation of unrestricted and restricted cash to the statements of assets and liabilities | ||
| Six-Month Period Ended April 30, 2023 (unaudited) | Year Ended October 31, 2022 | |
| Cash | $398,682 | $– |
| Foreign currency, at value | 7,531,218 | 2,381,409 |
| Cash at broker for interest rate swaps | 3,332,282 | – |
| Cash at broker for futures contracts | 3,488,736 | 5,149,531 |
| Cash at broker for forward foreign currency contracts | 300,000 | 1,660,000 |
| Due from broker | – | 81,191 |
| $15,050,918 | $9,272,131 |
| 22 | abrdn Asia-Pacific Income Fund, Inc. |
| For the Six-Months Ended April 30, | For the Fiscal Years Ended October 31, | |||||
| 2023 (unaudited) | 2022 | 2021 | 2020 | 2019 | 2018 | |
| PER SHARE OPERATING PERFORMANCE(a): | ||||||
| Net asset value per common share, beginning of period | $2.85 | $4.38 | $4.65 | $4.88 | $4.59 | $5.43 |
| Net investment income | 0.09 | 0.17 | 0.18 | 0.15 | 0.18 | 0.21 |
| Net realized and unrealized gains/(losses) on investments, interest rate swaps, futures contracts and foreign currency transactions | 0.39 | (1.37) | (0.12) | (0.05) | 0.48 | (0.64) |
| Total from investment operations applicable to common shareholders | 0.48 | (1.20) | 0.06 | 0.10 | 0.66 | (0.43) |
| Distributions to common shareholders from: | ||||||
| Net investment income | (0.17) | (0.09) | (0.18) | (0.07) | (0.12) | (0.25) |
| Net realized gains | – | – | – | (0.01) | – | – |
| Return of capital | – | (0.24) | (0.15) | (0.25) | (0.25) | (0.17) |
| Total distributions | (0.17) | (0.33) | (0.33) | (0.33) | (0.37) | (0.42) |
| Capital Share Transactions: | ||||||
| Impact due to open market repurchase policy (Note 7) | – | – | – | – | – | 0.01 |
| Net asset value per common share, end of period | $3.16 | $2.85 | $4.38 | $4.65 | $4.88 | $4.59 |
| Market price, end of period | $2.72 | $2.37 | $4.22 | $3.80 | $4.25 | $3.93 |
| Total Investment Return Based on(b): | ||||||
| Market price | 21.09% | (37.59%) | 19.87% | (2.82%) | 18.12% | (14.29%) |
| Net asset value | 17.69% | (27.70%) | 1.67% | 3.56% | 16.13% | (7.27%) |
| Ratio to Average Net Assets Applicable to Common Shareholders/Supplementary Data(c): | ||||||
| Net assets applicable to common shareholders, end of period (000 omitted) | $781,948 | $705,932 | $1,085,384 | $1,151,847 | $1,208,154 | $1,142,604 |
| Average net assets applicable to common shareholders (000 omitted) | $779,121 | $919,052 | $1,165,019 | $1,145,806 | $1,194,235 | $1,290,606 |
| Net operating expenses | 3.32%(d) | 3.15% | 2.57% | 2.87% | 2.84% | 2.67% |
| Net operating expenses, excluding interest expense and distributions to Series A Mandatory Redeemable Preferred Shares | 1.35%(d) | 1.36% | 1.16% | 1.32% | 1.22% | 1.17% |
| Net Investment income | 5.68%(d) | 4.71% | 3.75% | 3.29% | 3.68% | 4.14% |
| Portfolio turnover | 14%(e) | 26% | 44% | 88% | 46% | 44% See Notes to Financial Statements.
|
| abrdn Asia-Pacific Income Fund, Inc. | 23 |
| For the Six-Months Ended April 30, | For the Fiscal Years Ended October 31, | |||||
| 2023 (unaudited) | 2022 | 2021 | 2020 | 2019 | 2018 | |
| Leverage (senior securities) outstanding (000 omitted) | $315,000 | $315,000 | $450,000 | $415,000 | $531,000 | $505,000 |
| Leverage (preferred stock) outstanding (000 omitted) | $50,000 | $50,000 | $50,000 | $50,000 | $50,000 | $50,000 |
| Asset coverage ratio on long-term debt obligations at period end(f) | 364% | 340% | 352% | 390% | 337% | 336% |
| Asset coverage per $1,000 on long-term debt obligations at period end | $3,641 | $3,400 | $3,523 | $3,896 | $3,369 | $3,362 |
| Asset coverage ratio on total leverage at period end(g) | 314% | 293% | 317% | 348% | 308% | 306% |
| Asset coverage per $1,000 on total leverage at period end | $3,142 | $2,934 | $3,171 | $3,477 | $3,079 | $3,059 |
| (a) | Based on average shares outstanding. |
| (b) | Total investment return based on market value is calculated assuming that shares of the Fund’s common stock were purchased at the closing market price as of the beginning of the period, dividends, capital gains and other distributions were reinvested as provided for in the Fund’s dividend reinvestment plan and then sold at the closing market price per share on the last day of the period. The computation does not reflect any sales commission investors may incur in purchasing or selling shares of the Fund. The total investment return based on the net asset value is similarly computed except that the Fund’s net asset value is substituted for the closing market value. |
| (c) | Ratios calculated on the basis of income, expenses and preferred share dividends applicable to both the common and preferred shares relative to the average net assets of common shareholders. For the six-month period ended April 30, 2023 and for the fiscal years ended October 31, 2022, 2021, 2020, 2019, 2018, the ratios of net investment income before preferred stock dividends to average net assets of common shareholders were 5.95%, 4.91%, 3.93%, 3.47%, 3.85% and 4.30% respectively. |
| (d) | Annualized. |
| (e) | Not annualized. |
| (f) | Asset coverage ratio is calculated by dividing net assets plus the amount of any borrowings, including Series A Mandatory Redeemable Preferred Shares, for investment purposes by the amount of any long-term debt obligations, which includes the senior secured notes and revolving credit facility. |
| (g) | Asset coverage ratio is calculated by dividing net assets plus the amount of any borrowings for investment purposes by the amount of any borrowings. |
| 24 | abrdn Asia-Pacific Income Fund, Inc. |
| abrdn Asia-Pacific Income Fund, Inc. | 25 |
| 26 | abrdn Asia-Pacific Income Fund, Inc. |
| Security Type | Standard Inputs |
| Debt and other fixed-income securities | Reported trade data, broker-dealer price quotations, benchmark yields, issuer spreads on comparable securities, credit quality, yield, and maturity. |
| Forward foreign currency contracts | Forward exchange rate quotations. |
| Swap agreements | Market information pertaining to the underlying reference assets, i.e., credit spreads, credit event probabilities, fair values, forward rates, and volatility measures. |
| Investments, at Value | Level 1 – Quoted Prices | Level 2 – Other Significant Observable Inputs | Level 3 – Significant Unobservable Inputs | Total |
| Assets | ||||
| Investments in Securities | ||||
| Corporate Bonds | $– | $546,155,491 | $– | $546,155,491 |
| Government Bonds | – | 529,869,427 | – | 529,869,427 |
| Short-Term Investment | 39,473,909 | – | – | 39,473,909 |
| Total Investments | $39,473,909 | $1,076,024,918 | $– | $1,115,498,827 |
| Other Financial Instruments | ||||
| Foreign Currency Exchange Contracts | $– | $1,228,506 | $– | $1,228,506 |
| Futures Contracts | 2,523,212 | – | – | 2,523,212 |
| Total Other Financial Instruments | $2,523,212 | $1,228,506 | $– | $3,751,718 |
| Total Assets | $41,997,121 | $1,077,253,424 | $– | $1,119,250,545 |
| Liabilities | ||||
| Other Financial Instruments | ||||
| Centrally Cleared Interest Rate Swap Agreements | $– | $(940,835) | $– | $(940,835) |
| Foreign Currency Exchange Contracts | – | (708,465) | – | (708,465) |
| Futures Contracts | (1,177,627) | – | – | (1,177,627) |
| Total Liabilities | $(1,177,627) | $(1,649,300) | $– | $(2,826,927) |
| abrdn Asia-Pacific Income Fund, Inc. | 27 |
| 28 | abrdn Asia-Pacific Income Fund, Inc. |
| abrdn Asia-Pacific Income Fund, Inc. | 29 |
| Risk Exposure Category | |||||||
| Interest Rate Contracts | Foreign Currency Contracts | Credit Contracts | Equity Contracts | Commodity Contracts | Other | Total | |
| Assets: | |||||||
| Unrealized appreciation on: | |||||||
| Forward Foreign Currency Exchange Contracts | $– | $1,228,506 | $– | $– | $– | $– | $1,228,506 |
| Futures Contracts | 2,523,213 | – | – | – | – | – | 2,523,213 |
| Total | $2,523,213 | $1,228,506 | $– | $– | $– | $– | $3,751,719 |
| Liabilities: | |||||||
| Unrealized depreciation on: | |||||||
| Forward Foreign Currency Exchange Contracts | $– | $708,465 | $– | $– | $– | $– | $708,465 |
| Futures Contracts | 1,177,628 | – | – | – | – | – | 1,177,628 |
| Swap Contracts | 940,835 | – | – | – | – | – | 940,835 |
| Total | $2,118,463 | $708,465 | $– | $– | $– | $– | $2,826,928 |
| Gross Amounts Not Offset in the Statement of Assets and Liabilities | Gross Amounts Not Offset in the Statement of Assets and Liabilities | |||||||
| Gross Amounts of Assets Presented in Statement of Assets and Liabilities | Financial Instruments | Collateral Received(1) | Net Amount(2) | Gross Amounts of Liabilities Presented in Statement of Assets and Liabilities | Financial Instruments | Collateral Pledged(1) | Net Amount(2) | |
| Description | Assets | Liabilities | ||||||
| Foreign Currency Exchange Contracts(3) | ||||||||
| BNP Paribas S.A. | $47,864 | $– | $– | $47,864 | $– | $– | $– | $– |
| Citibank N.A. | 137,255 | (137,255) | – | – | 296,621 | (137,255) | (159,366) | – |
| HSBC Bank PLC | – | – | – | – | 21,699 | – | – | 21,699 |
| Royal Bank of Canada | – | – | – | – | 11,965 | – | – | 11,965 |
| Standard Chartered Bank | 277,624 | – | – | 277,624 | – | – | – | – |
| State Street Bank & Trust Co. | 26,921 | – | – | 26,921 | – | – | – | – |
| UBS AG | 738,842 | (378,180) | – | 360,662 | 378,180 | (378,180) | – | – |
| 30 | abrdn Asia-Pacific Income Fund, Inc. |
| (1) | In some instances, the actual collateral received and/or pledged may be more than the amount shown here due to overcollateralization. |
| (2) | Net amounts represent the net receivables/(payable) that would be due from/to the counterparty in the event of default. Exposure from financial derivative instruments can only be netted across transactions governed under the same master netting agreement with the same legal entity. |
| (3) | Includes financial instrument which are not subject to a master netting arrangement across funds, or another similar arrangement. |
| Risk Exposure Category | ||||||
| Interest Rate Contracts | Foreign Currency Contracts | Credit Contracts | Equity Contracts | Commodity Contracts | Total | |
| Realized Gain (Loss) on Derivatives Recognized as a Result of Operations: | ||||||
| Net realized gain (loss) on: | ||||||
| Futures Contracts | $1,070,217 | $– | $– | $– | $– | $1,070,217 |
| Forward Currency Contracts | – | (4,689,825) | – | – | – | (4,689,825) |
| Swap Contracts | 3,711 | – | – | – | – | 3,711 |
| Total | $1,073,928 | $(4,689,825) | $– | $– | $– | $(3,615,897) |
| Net Change in Unrealized Appreciation (Depreciation) on Derivatives Recognized as a Result of Operations: | ||||||
| Net change in unrealized appreciation (depreciation) of: | ||||||
| Futures Contracts | $2,852,229 | $– | $– | $– | $– | $2,852,229 |
| Forward Currency Contracts | – | 3,146,667 | – | – | – | 3,146,667 |
| Swap Contracts | (940,835) | – | – | – | – | (940,835) |
| Total | $1,911,394 | $3,146,667 | $– | $– | $– | $5,058,061 |
| abrdn Asia-Pacific Income Fund, Inc. | 31 |
| 32 | abrdn Asia-Pacific Income Fund, Inc. |
| abrdn Asia-Pacific Income Fund, Inc. | 33 |
| 34 | abrdn Asia-Pacific Income Fund, Inc. |
| Series | Maturity Date | Interest Rate | Notional/ Carrying Amount | Estimated Fair Value |
| Series C | February 8, 2032 | 3.87% | $50,000,000 | $45,913,063 |
| Series D | August 10, 2032 | 3.70% | $100,000,000 | $90,061,802 |
| Series E | June 19, 2034 | 3.73% | $100,000,000 | $88,826,245 |
| abrdn Asia-Pacific Income Fund, Inc. | 35 |
| 36 | abrdn Asia-Pacific Income Fund, Inc. |
| abrdn Asia-Pacific Income Fund, Inc. | 37 |
| Tax Cost of Securities | Unrealized Appreciation | Unrealized Depreciation | Net Unrealized Appreciation/ (Depreciation) |
| $1,257,301,934 | $20,951,672 | $(169,899,112) | $(148,947,440) |
| 38 | abrdn Asia-Pacific Income Fund, Inc. |
| abrdn Asia-Pacific Income Fund, Inc. | 39 |
| 40 | abrdn Asia-Pacific Income Fund, Inc. |

(b) Not applicable.
Item 2. Code of Ethics.
This item is inapplicable to semi-annual report on Form N-CSR.
Item 3. Audit Committee Financial Expert.
This item is inapplicable to semi-annual report on Form N-CSR.
Item 4. Principal Accountant Fees and Services.
This item is inapplicable to semi-annual report on Form N-CSR.
Item 5. Audit Committee of Listed Registrants.
This item is inapplicable to semi-annual report on Form N-CSR.
Item 6. Investments.
(a) Schedule of Investments in securities of unaffiliated issuers as of close of the reporting period is included as part of the Report to Shareholders filed under Item 1 of this Form N-CSR.
(b) Not applicable.
Item 7. Disclosure of Proxy Voting Policies and Procedures for Closed-End Management Investment Companies.
This item is inapplicable to semi-annual report on Form N-CSR.
Item 8. Portfolio Managers of Closed-End Management Investment Companies.
| (a) | Not applicable to semi-annual report on Form N-CSR. |
| (b) | There has been no change, as of the date of this filing, in any of the portfolio managers identified in response to paragraph (a)(1) of this Item in the registrant’s most recently filed annual report on Form N-CSR. |
Item 9. Purchases of Equity Securities by Closed-End Management Investment Company and Affiliated Purchasers.
No such purchases were made by or on behalf of the Registrant during the period covered by the report.
Item 10. Submission of Matters to a Vote of Security Holders.
During the period ended April 30, 2023, there were no material changes to the procedures by which shareholders may recommend nominees to the Registrant’s Board of Directors.
Item 11. Controls and Procedures.
| (a) | The Registrant’s principal executive and principal financial officers, or persons performing similar functions, have concluded that the Registrant’s disclosure controls and procedures (as defined in Rule 30a-3(c) under the Investment Company Act of 1940 (the “Act”) (17 CFR 270.30a-3(c))) are effective, as of a date within 90 days of the filing date of the report that includes the disclosure required by this paragraph, based on the evaluation of these controls and procedures required by Rule 30a-3(b) under the Act (17 CFR 270.30a3(b)) and Rule 13a-15(b) or 15d-15(b) under the Securities Exchange Act of 1934, as amended (17 CFR 240.13a-15(b) or 240.15d15(b)). |
| (b) | There were no changes in the Registrant’s internal control over financial reporting (as defined in Rule 30a-3(d) under the Act (17 CFR 270.30a-3(d))) that occurred during the second fiscal quarter of the period covered by this report that has materially affected, or is reasonably likely to materially affect, the Registrant’s internal control over financial reporting. |
Item 12 - Disclosure of Securities Lending Activities for Closed-End Management Investment Companies
Not applicable
Item 13. Exhibits.
| (a)(1) | Not applicable. |
| (a)(2) | The certifications of the registrant as required by Rule 30a-2(a) under the Act are exhibits to this Form N-CSR. |
| (a)(3) | Any written solicitation to purchase securities under Rule 23c-1 under the 1940 Act (17 CFR 270.23c-1) sent or given during the period covered by the report by or on behalf of the registrant to 10 or more persons. Not applicable. |
| (a)(4) | Change in Registrant’s independent public accountant. Not applicable. |
| (b) | The certifications of the registrant as required by Rule 30a-2(b) under the Act are exhibits to this Form N-CSR. |
| (c) | A copy of the Registrant’s notices to stockholders, which accompanied distributions paid, pursuant to the Registrant’s Managed Distribution Policy since the Registrant’s last filed N-CSR, are filed herewith as Exhibits (c)(1), (c)(2), (c)(3), (c)(4), (c)(5), (c)(6) and (c)(7), as required by the terms of the Registrant’s SEC exemptive order. |
SIGNATURES
Pursuant to the requirements of the Securities Exchange Act of 1934 and the Investment Company Act of 1940, the Registrant has duly caused this report to be signed on its behalf by the undersigned, thereunto duly authorized.
abrdn Asia-Pacific Income Fund, Inc.
| By: | /s/ Christian Pittard | |
| Christian Pittard, | ||
| Principal Executive Officer of | ||
| abrdn Asia-Pacific Income Fund, Inc. |
Date: July 10, 2023
Pursuant to the requirements of the Securities Exchange Act of 1934 and the Investment Company Act of 1940, this report has been signed below by the following persons on behalf of the Registrant and in the capacities and on the dates indicated.
| By: | /s/ Christian Pittard | |
| Christian Pittard, | ||
| Principal Executive Officer of | ||
| abrdn Asia-Pacific Income Fund, Inc. | ||
Date: July 10, 2023
|
||
| By: | /s/ Sharon Ferrari | |
| Sharon Ferrari, | ||
| Principal Financial Officer of | ||
| abrdn Asia-Pacific Income Fund, Inc. | ||
| Date: July 10, 2023 | ||
Exhibit 99.CERT
Certification Pursuant to Rule 30a-2(a) under the 1940 Act and Section 302 of the Sarbanes-Oxley Act
I, Sharon Ferrari, certify that:
| 1. | I have reviewed this report on Form N-CSR of abrdn Asia-Pacific Income Fund, Inc. (the “Registrant”); |
| 2. | Based on my knowledge, this report does not contain any untrue statement of a material fact or omit to state a material fact necessary to make the statements made, in light of the circumstances under which such statements were made, not misleading with respect to the period covered by this report; |
| 3. | Based on my knowledge, the financial statements, and other financial information included in this report, fairly present in all material respects the financial condition, results of operations, changes in net assets, and cash flows (if the financial statements are required to include a statement of cash flows) of the Registrant as of, and for, the periods presented in this report; |
| 4. | The Registrant’s other certifying officer(s) and I are responsible for establishing and maintaining disclosure controls and procedures (as defined in Rule 30a-3(c) under the Investment Company Act of 1940) and internal control over financial reporting (as defined in Rule 30a-3(d) under the Investment Company Act of 1940) for the Registrant and have: |
| (a) | Designed such disclosure controls and procedures, or caused such disclosure controls and procedures to be designed under our supervision, to ensure that material information relating to the Registrant, including its consolidated subsidiaries, is made known to us by others within those entities, particularly during the period in which this report is being prepared; |
| (b) | Designed such internal control over financial reporting, or caused such internal control over financial reporting to be designed under our supervision, to provide reasonable assurance regarding the reliability of financial reporting and the preparation of financial statements for external purposes in accordance with generally accepted accounting principles; |
| (c) | Evaluated the effectiveness of the Registrant’s disclosure controls and procedures and presented in this report our conclusions about the effectiveness of the disclosure controls and procedures, as of a date within 90 days prior to the filing date of this report based on such evaluation; and |
| (d) | Disclosed in this report any change in the Registrant’s internal control over financial reporting that occurred during the period covered by this report that has materially affected, or is reasonably likely to materially affect, the Registrant’s internal control over financial reporting; and |
| 5. | The Registrant’s other certifying officer(s) and I have disclosed to the Registrant’s auditors and the audit committee of the Registrant’s board of directors (or persons performing the equivalent functions): |
| (a) | All significant deficiencies and material weaknesses in the design or operation of internal control over financial reporting which are reasonably likely to adversely affect the Registrant’s ability to record, process, summarize, and report financial information; and |
| (b) | Any fraud, whether or not material, that involves management or other employees who have a significant role in the Registrant’s internal control over financial reporting. |
Date: July 10, 2023
| /s/ Sharon Ferrari | |
| Sharon Ferrari | |
| Principal Financial Officer |
Certification Pursuant to Rule 30a-2(a) under the 1940 Act and Section 302 of the Sarbanes-Oxley Act
I, Christian Pittard, certify that:
| 1. | I have reviewed this report on Form N-CSR of abrdn Asia-Pacific Income Fund, Inc. (the “Registrant”); |
| 2. | Based on my knowledge, this report does not contain any untrue statement of a material fact or omit to state a material fact necessary to make the statements made, in light of the circumstances under which such statements were made, not misleading with respect to the period covered by this report; |
| 3. | Based on my knowledge, the financial statements, and other financial information included in this report, fairly present in all material respects the financial condition, results of operations, changes in net assets, and cash flows (if the financial statements are required to include a statement of cash flows) of the Registrant as of, and for, the periods presented in this report; |
| 4. | The Registrant’s other certifying officer(s) and I are responsible for establishing and maintaining disclosure controls and procedures (as defined in Rule 30a-3(c) under the Investment Company Act of 1940) and internal control over financial reporting (as defined in Rule 30a-3(d) under the Investment Company Act of 1940) for the Registrant and have: |
| (a) | Designed such disclosure controls and procedures, or caused such disclosure controls and procedures to be designed under our supervision, to ensure that material information relating to the Registrant, including its consolidated subsidiaries, is made known to us by others within those entities, particularly during the period in which this report is being prepared; |
| (b) | Designed such internal control over financial reporting, or caused such internal control over financial reporting to be designed under our supervision, to provide reasonable assurance regarding the reliability of financial reporting and the preparation of financial statements for external purposes in accordance with generally accepted accounting principles; |
| (c) | Evaluated the effectiveness of the Registrant’s disclosure controls and procedures and presented in this report our conclusions about the effectiveness of the disclosure controls and procedures, as of a date within 90 days prior to the filing date of this report based on such evaluation; and |
| (d) | Disclosed in this report any change in the Registrant’s internal control over financial reporting that occurred during the period covered by this report that has materially affected, or is reasonably likely to materially affect, the Registrant’s internal control over financial reporting; and |
| 5. | The Registrant’s other certifying officer(s) and I have disclosed to the Registrant’s auditors and the audit committee of the Registrant’s board of directors (or persons performing the equivalent functions): |
| (a) | All significant deficiencies and material weaknesses in the design or operation of internal control over financial reporting which are reasonably likely to adversely affect the Registrant’s ability to record, process, summarize, and report financial information; and |
| (b) | Any fraud, whether or not material, that involves management or other employees who have a significant role in the Registrant’s internal control over financial reporting. |
Date: July 10, 2023
| /s/ Christian Pittard | |
| Christian Pittard | |
| Principal Executive Officer |
Exhibit 99.906CERT
Certification Pursuant to Rule 30a-2(b) under the 1940 Act and Section 906 of the Sarbanes-Oxley Act
Christian Pittard, Principal Executive Officer, and Sharon Ferrari, Principal Financial Officer, of abrdn Asia-Pacific Income Fund, Inc. (the “Registrant”), each certify that:
| 1. | The Registrant’s periodic report on Form N-CSR for the period ended April 30, 2023 (the “Form N-CSR”) fully complies with the requirements of Section 13(a) or Section 15(d) of the Securities Exchange Act of 1934, as amended, as applicable; and |
| 2. | The information contained in the Form N-CSR fairly presents, in all material respects, the financial condition and results of operations of the Registrant. |
PRINCIPAL EXECUTIVE OFFICER
abrdn Asia-Pacific Income Fund, Inc.
| /s/ Christian Pittard | |
| Christian Pittard | |
| Date: July 10, 2023 |
PRINCIPAL FINANCIAL OFFICER
abrdn Asia-Pacific Income Fund, Inc.
| /s/ Sharon Ferrari | |
| Sharon Ferrari | |
| Date: July 10, 2023 |
This certification is being furnished solely pursuant to Section 906 of the Sarbanes-Oxley Act of 2002 and is not being filed as part of Form N-CSR or as a separate disclosure document. A signed original of this written statement, or other document authenticating, acknowledging, or otherwise adopting the signature that appears in typed form within the electronic version of this written statement required by Section 906, has been provided to the Registrant and will be retained by the Registrant and furnished to the Securities and Exchange Commission or its staff upon request.
Exhibit 99.13(c)(1)


FOR IMMEDIATE RELEASE
For More Information Contact:
abrdn U.S. Closed-End Funds
Investor Relations
1-800-522-5465
Investor.Relations@abrdn.com
ABRDN U.S. CLOSED-END FUNDS
ANNOUNCE DISTRIBUTION PAYMENT DETAILS
abrdn Global Infrastructure Income Fund (“ASGI”)
abrdn Asia-Pacific Income Fund, Inc. (“FAX”)
abrdn Australia Equity Fund, Inc. (“IAF”)
The India Fund, Inc. (“IFN”)
abrdn Japan Equity Fund, Inc. (“JEQ”)
(Philadelphia, January 11, 2023) -The above-noted abrdn U.S. Closed-End Funds (the “Funds” or individually the “Fund”), today announced that the Funds paid the distributions noted in the table below on January 11, 2023, on a per share basis to all shareholders of record as of December 30, 2022 (ex-dividend date December 29, 2022). These dates apply to the Funds listed below with the exception of the abrdn Australia Equity Fund, Inc. (IAF), the India Fund, Inc. (IFN) and the abrdn Japan Equity Fund, Inc. (JEQ) which paid the distribution on January 11, 2023 to all shareholders of record as of November 22, 2022 (ex-dividend date November 21, 2022).
| Ticker | Exchange | Fund | Amount | |||||
| ASGI | NYSE | abrdn Global Infrastructure Income Fund | $ | 0.1200 | ||||
| FAX | NYSE American | abrdn Asia-Pacific Income Fund, Inc. | $ | 0.0275 | ||||
| IAF | NYSE American | abrdn Australia Equity Fund, Inc. | $ | 0.1200 | ||||
| IFN | NYSE | The India Fund, Inc. | $ | 1.6100 | ||||
| JEQ | NYSE | abrdn Japan Equity Fund, Inc. | $ | 0.1000 | ||||
Each Fund has adopted a distribution policy to provide investors with a stable distribution out of current income, supplemented by realized capital gains and, to the extent necessary, paid-in capital.
For the abrdn Australia Equity Fund, Inc. (IAF), the India Fund, Inc. (IFN) and the abrdn Japan Equity Fund, Inc. (JEQ) the stock distributions were automatically paid in newly issued shares of the Fund unless otherwise instructed by the shareholder to be paid in cash. Shares of common stock were issued at the lower of the net asset value (“NAV”) per share or the market price per share with a floor for the NAV of not less than 95% of the market price on December 20, 2022. The reinvestment prices per share for these distributions were as follows: $4.38 for the abrdn Australia Equity Fund, Inc. (IAF); $15.26 for the India Fund, Inc. (IFN) and $5.42 for the abrdn Japan Equity Fund, Inc. (JEQ). Fractional shares were generally settled in cash, except for registered shareholders with book entry accounts at Computershare Investor Services who had whole and fractional shares added to their account.
To have received the abrdn Australia Equity Fund, Inc. (IAF), the India Fund, Inc. (IFN) and the abrdn Japan Equity Fund, Inc. (JEQ) quarterly distributions payable in January 2023 in cash instead of shares of common stock, for shareholders who hold shares in “street name,” the bank, brokerage or nominee who holds the shares must have advised the Depository Trust Company as to the full and fractional shares for which they want the distribution paid in cash by December 16, 2022; and for shares that are held in registered form, written notification for the election of cash by registered shareholders must have been received by Computershare Investor Services prior to December 16, 2022.
Under applicable U.S. tax rules, the amount and character of distributable income for each Fund’s fiscal year can be finally determined only as of the end of the Fund’s fiscal year. However, under Section 19 of the Investment Company Act of 1940, as amended (the “1940 Act”) and related rules, the Funds may be required to indicate to shareholders the estimated source of certain distributions to shareholders.
The following tables set forth the estimated amounts of the sources of the distributions for purposes of Section 19 of the 1940 Act and the rules adopted thereunder. The tables have been computed based on generally accepted accounting principles. The tables include estimated amounts and percentages for the current distributions paid this month as well as for the cumulative distributions paid relating to fiscal year to date, from the following sources: net investment income; net realized short-term capital gains; net realized long-term capital gains; and return of capital. The estimated compositions of the distributions may vary because the estimated composition may be impacted by future income, expenses and realized gains and losses on securities and currencies.
Each Fund’s estimated sources of the current distribution paid this month and for its current fiscal year to date are as follows:
| Estimated Amounts of Current Distribution per Share | ||||||||||||||||||||||||||||||||||||
| Fund* | Distribution Amount | Net Investment Income | Net Realized Short-Term Gains** | Net Realized Long-Term Gains | Return of Capital | |||||||||||||||||||||||||||||||
| ASGI | $ | 0.1200 | $ | 0.0024 | 2 | % | - | - | $ | 0.1176 | 98 | % | - | - | ||||||||||||||||||||||
| FAX | $ | 0.0275 | $ | 0.0140 | 51 | % | - | - | - | - | $ | 0.0135 | 49 | % | ||||||||||||||||||||||
| IAF | $ | 0.1200 | $ | 0.0096 | 8 | % | - | - | $ | 0.0408 | 34 | % | $ | 0.0696 | 58 | % | ||||||||||||||||||||
| IFN | $ | 1.6100 | $ | 0.4186 | 26 | % | - | - | $ | 1.1914 | 74 | % | - | - | ||||||||||||||||||||||
| JEQ | $ | 0.1000 | $ | 0.0020 | 2 | % | $ | 0.0090 | 9 | % | - | - | $ | 0.0890 | 89 | % | ||||||||||||||||||||
| Estimated Amounts of Fiscal Year* to Date Cumulative Distributions per Share | ||||||||||||||||||||||||||||||||||||
| Fund | Distribution Amount | Net Investment Income | Net Realized Short-Term Gains ** | Net Realized Long-Term
Gains | Return of Capital | |||||||||||||||||||||||||||||||
| ASGI | $ | 0.3600 | $ | 0.0072 | 2 | % | - | - | $ | 0.3528 | 98 | % | - | - | ||||||||||||||||||||||
| FAX | $ | 0.0550 | $ | 0.0281 | 51 | % | - | - | - | - | $ | 0.0269 | 49 | % | ||||||||||||||||||||||
| IAF | $ | 0.1200 | $ | 0.0096 | 8 | % | - | - | $ | 0.0408 | 34 | % | $ | 0.0696 | 58 | % | ||||||||||||||||||||
| IFN+ | $ | 3.1800 | $ | 0.8268 | 26 | % | - | - | $ | 2.3532 | 74 | % | - | - | ||||||||||||||||||||||
| JEQ | $ | 0.1000 | $ | 0.0020 | 2 | % | $ | 0.0090 | 9 | % | - | - | $ | 0.0890 | 89 | % | ||||||||||||||||||||
* ASGI has a 9/30 fiscal year end; FAX, IAF and JEQ have a 10/31 fiscal year end; IFN has a 12/31 fiscal year end.
**includes currency gains
+ The distribution consists of the regular quarterly distribution of $0.47 and a special capital gains distribution of $1.14 required to meet US tax regulations.
Where the estimated amounts above show a portion of the distribution to be a “Return of Capital,” it means that Fund estimates that it has distributed more than its income and capital gains; therefore, a portion of your distribution may be a return of capital. A return of capital may occur for example, when some or all of the money that you invested in a Fund is paid back to you. A return of capital distribution does not necessarily reflect the Fund’s investment performance and should not be confused with “yield” or “income.”
As of December 31, 2022, after giving effect to this payment, JEQ estimates it has a net deficit of $8,052,149. A net deficit results when the Fund has net unrealized losses that are in excess of any net realized gains that have not yet been distributed.
The amounts and sources of distributions reported in this notice are only estimates and are not being provided for tax reporting purposes. The final determination of the source of all distributions for the current year will only be made after year-end. The actual amounts and sources of the amounts for tax reporting purposes will depend upon the Fund’s investment experience during the remainder of the fiscal year and may be subject to change based on tax regulations. After the end of each calendar year, a Form 1099-DIV will be sent to shareholders for the prior calendar year that will tell you how to report these distributions for federal income tax purposes.
The following table provides the Funds’ total return performance based on net asset value (NAV) over various time periods compared to the Funds’ annualized and cumulative distribution rates.
| Fund Performance and Distribution Rate Information | ||||||||||||||||
| Fund | Average Annual Total Return on NAV for the 5 Year Period Ending 11/30/20221 | Current Fiscal Period’s Annualized Distribution Rate on NAV | Cumulative Total Return on NAV1 | Cumulative Distribution Rate on NAV2 | ||||||||||||
| ASGI2 | 9.27 | %3 | 6.80 | % | 14.34 | % | 1.13 | % | ||||||||
| FAX2 | -2.34 | % | 10.75 | % | 8.84 | % | 0.90 | % | ||||||||
1 Return data is net of all Fund expenses and fees and assumes the reinvestment of all distributions reinvested at prices obtained under the Fund’s dividend reinvestment plan.
2 Based on the Fund’s NAV as of November 30, 2022.
3 The Fund launched within the past 5 years; the performance and distribution rate information presented reflects data from inception (July 29, 2020) through November 30, 2022.
| Fund Performance and Distribution Rate Information | ||||||||||||||||
| Fund | Average Annual Total Return on NAV for the 5 Year Period Ending 10/31/20221 | Current Fiscal Period’s Annualized Distribution Rate on NAV | Cumulative Total Return on NAV1 | Cumulative Distribution Rate on NAV2 | ||||||||||||
| IAF2 | 4.60 | % | 12.63 | % | -18.74 | % | 12.63 | % | ||||||||
| IFN2 | 4.14 | % | 11.16 | % | -15.42 | % | 8.63 | % | ||||||||
| JEQ2 | -2.86 | % | 8.14 | %3 | -32.88 | % | 22.60 | % | ||||||||
1 Return data is net of all Fund expenses and fees and assumes the reinvestment of all distributions reinvested at prices obtained under the Fund’s dividend reinvestment plan.
2 Based on the Fund’s NAV as of October 31, 2022.
3 The percentage shown does not include the Fund’s annual distribution policy in place in 2021.
Shareholders should not draw any conclusions about a Fund’s investment performance from the amount of the Fund’s current distributions or from the terms of the distribution policy (the “Distribution Policy”).
While NAV performance may be indicative of the Fund’s investment performance, it does not measure the value of a shareholder’s investment in the Fund. The value of a shareholder’s investment in the Fund is determined by the Fund’s market price, which is based on the supply and demand for the Fund’s shares in the open market.
Pursuant to an exemptive order granted by the Securities and Exchange Commission, the Funds may distribute any long-term capital gains more frequently than the limits provided in Section 19(b) under the 1940 Act and Rule 19b-1 thereunder. Therefore, distributions paid by the Funds during the year may include net income, short-term capital gains, long-term capital gains and/or a return of capital. Net income dividends and short-term capital gain dividends, while generally taxable at ordinary income rates, may be eligible, to the extent of qualified dividend income earned by the Funds, to be taxed at a lower rate not to exceed the maximum rate applicable to your long-term capital gains. Distributions made in any calendar year in excess of investment company taxable income and net capital gain are treated as taxable ordinary dividends to the extent of undistributed earnings and profits, and then as a return of capital that reduces the adjusted basis in the shares held. To the extent return of capital distributions exceed the adjusted basis in the shares held, capital gain is recognized with a holding period based on the period the shares have been held at the date such amount is received.
The payment of distributions in accordance with the Distribution Policy may result in a decrease in the Fund’s net assets. A decrease in the Fund’s net assets may cause an increase in the Fund’s annual operating expense ratio and a decrease in the Fund’s market price per share to the extent the market price correlates closely to the Fund’s net asset value per share. The Distribution Policy may also negatively affect the Fund’s investment activities to the extent that the Fund is required to hold larger cash positions than it typically would hold or to the extent that the Fund must liquidate securities that it would not have sold, for the purpose of paying the distribution. Each Fund’s Board has the right to amend, suspend or terminate the Distribution Policy at any time. The amendment, suspension or termination of the Distribution Policy may affect the Fund’s market price per share. Investors should consult their tax advisor regarding federal, state and local tax considerations that may be applicable in their particular circumstances.
Circular 230 disclosure: To ensure compliance with requirements imposed by the U.S. Treasury, we inform you that any U.S. tax advice contained in this communication (including any attachments) is not intended or written to be used, and cannot be used, for the purpose of (i) avoiding penalties under the Internal Revenue Code or (ii) promoting, marketing or recommending to another party any transaction or matter addressed herein.
In the United States, abrdn is the marketing name for the following affiliated, registered investment advisers: abrdn Inc., Aberdeen Asset Managers Ltd., abrdn Australia Limited, abrdn Asia Limited, Aberdeen Capital Management, LLC, abrdn ETFs Advisors LLC and Aberdeen Standard Alternative Funds Limited.
Closed-end funds are traded on the secondary market through one of the stock exchanges. A Fund’s investment return and principal value will fluctuate so that an investor’s shares may be worth more or less than the original cost. Shares of closed-end funds may trade above (a premium) or below (a discount) the net asset value (NAV) of the fund’s portfolio. There is no assurance that a Fund will achieve its investment objective. Past performance does not guarantee future results.
If you wish to receive this information electronically, please contact Investor.Relations@abrdn.com
https://www.abrdn.com/en-us/cefinvestorcenter
###
Exhibit 99.13(c)(2)
FOR IMMEDIATE RELEASE
For More Information Contact:
abrdn U.S. Closed-End Funds
Investor Relations
1-800-522-5465
Investor.Relations@abrdn.com
ABRDN
U.S. CLOSED-END FUNDS
ANNOUNCE DISTRIBUTION PAYMENT DETAILS
abrdn Global Infrastructure Income Fund (“ASGI”)
abrdn Asia-Pacific Income Fund, Inc. (“FAX”)
(Philadelphia, January 31, 2023) -The above-noted abrdn U.S. Closed-End Funds (the “Funds” or individually the “Fund”), today announced that the Funds paid the distributions noted in the table below on January 31, 2023, on a per share basis to all shareholders of record as of January 24, 2023 (ex-dividend date January 23, 2023).
| Ticker | Exchange | Fund | Amount | |||||
| ASGI | NYSE | abrdn Global Infrastructure Income Fund | $ | 0.1200 | ||||
| FAX | NYSE American | abrdn Asia-Pacific Income Fund, Inc. | $ | 0.0275 | ||||
Each Fund has adopted a distribution policy to provide investors with a stable distribution out of current income, supplemented by realized capital gains and, to the extent necessary, paid-in capital.
Under applicable U.S. tax rules, the amount and character of distributable income for each Fund’s fiscal year can be finally determined only as of the end of the Fund’s fiscal year. However, under Section 19 of the Investment Company Act of 1940, as amended (the “1940 Act”) and related rules, the Funds may be required to indicate to shareholders the estimated source of certain distributions to shareholders.
The following tables set forth the estimated amounts of the sources of the distributions for purposes of Section 19 of the 1940 Act and the rules adopted thereunder. The tables have been computed based on generally accepted accounting principles. The tables include estimated amounts and percentages for the current distributions paid this month as well as for the cumulative distributions paid relating to fiscal year to date, from the following sources: net investment income; net realized short-term capital gains; net realized long-term capital gains; and return of capital. The estimated compositions of the distributions may vary because the estimated composition may be impacted by future income, expenses and realized gains and losses on securities and currencies.
Each Fund’s estimated sources of the current distribution paid this month and for its current fiscal year to date are as follows:
| Estimated Amounts of Current Distribution per Share | ||||||||||||||||||||||||||||||||||||
| Fund* | Distribution Amount | Net Investment Income | Net Realized Short-Term Gains** | Net Realized Long-Term Gains | Return of Capital | |||||||||||||||||||||||||||||||
| ASGI | $ | 0.1200 | $ | 0.0132 | 11 | % | - | - | $ | 0.1068 | 89 | % | - | - | ||||||||||||||||||||||
| FAX | $ | 0.0275 | $ | 0.0143 | 52 | % | - | - | - | - | $ | 0.0132 | 48 | % | ||||||||||||||||||||||
| Estimated Amounts of Fiscal Year* to Date Cumulative Distributions per Share | ||||||||||||||||||||||||||||||||||||
Fund | Distribution Amount | Net Investment | Net Realized Short-Term Gains ** | Net Realized Long-Term Gains | Return of Capital | |||||||||||||||||||||||||||||||
| ASGI | $ | 0.4800 | $ | 0.0528 | 11 | % | - | - | $ | 0.4272 | 89 | % | - | - | ||||||||||||||||||||||
| FAX | $ | 0.0825 | $ | 0.0429 | 52 | % | - | - | - | - | $ | 0.0396 | 48 | % | ||||||||||||||||||||||
* ASGI has a 9/30 fiscal year end; FAX has a 10/31 fiscal year end.
**includes currency gains
Where the estimated amounts above show a portion of the distribution to be a “Return of Capital,” it means that Fund estimates that it has distributed more than its income and capital gains; therefore, a portion of your distribution may be a return of capital. A return of capital may occur for example, when some or all of the money that you invested in a Fund is paid back to you. A return of capital distribution does not necessarily reflect the Fund’s investment performance and should not be confused with “yield” or “income.”
The amounts and sources of distributions reported in this notice are only estimates and are not being provided for tax reporting purposes. The final determination of the source of all distributions for the current year will only be made after year-end. The actual amounts and sources of the amounts for tax reporting purposes will depend upon the Fund’s investment experience during the remainder of the fiscal year and may be subject to change based on tax regulations. After the end of each calendar year, a Form 1099-DIV will be sent to shareholders for the prior calendar year that will tell you how to report these distributions for federal income tax purposes.
The following table provides the Funds’ total return performance based on net asset value (NAV) over various time periods compared to the Funds’ annualized and cumulative distribution rates.
| Fund Performance and Distribution Rate Information | ||||||||||||||||
| Fund | Average Annual Total Return on NAV for the 5 Year Period Ending 12/31/20221 | Current Fiscal Period’s Annualized Distribution Rate on NAV | Cumulative Total Return on NAV1 | Cumulative
Distribution Rate on NAV2 | ||||||||||||
| ASGI | 7.52 | %3 | 7.07 | % | 10.78 | % | 1.77 | % | ||||||||
| FAX | -2.13 | % | 10.58 | % | 11.70 | % | 1.76 | % | ||||||||
1 Return data is net of all Fund expenses and fees and assumes the reinvestment of all distributions reinvested at prices obtained under the Fund’s dividend reinvestment plan.
2 Based on the Fund’s NAV as of December 31, 2022.
3 The Fund launched within the past 5 years; the performance and distribution rate information presented reflects data from inception (July 29, 2020) through December 31, 2022.
Shareholders should not draw any conclusions about a Fund’s investment performance from the amount of the Fund’s current distributions or from the terms of the distribution policy (the “Distribution Policy”).
While NAV performance may be indicative of the Fund’s investment performance, it does not measure the value of a shareholder’s investment in the Fund. The value of a shareholder’s investment in the Fund is determined by the Fund’s market price, which is based on the supply and demand for the Fund’s shares in the open market.
Pursuant to an exemptive order granted by the Securities and Exchange Commission, the Funds may distribute any long-term capital gains more frequently than the limits provided in Section 19(b) under the 1940 Act and Rule 19b-1 thereunder. Therefore, distributions paid by the Funds during the year may include net income, short-term capital gains, long-term capital gains and/or a return of capital. Net income dividends and short-term capital gain dividends, while generally taxable at ordinary income rates, may be eligible, to the extent of qualified dividend income earned by the Funds, to be taxed at a lower rate not to exceed the maximum rate applicable to your long-term capital gains. Distributions made in any calendar year in excess of investment company taxable income and net capital gain are treated as taxable ordinary dividends to the extent of undistributed earnings and profits, and then as a return of capital that reduces the adjusted basis in the shares held. To the extent return of capital distributions exceed the adjusted basis in the shares held, capital gain is recognized with a holding period based on the period the shares have been held at the date such amount is received.
The payment of distributions in accordance with the Distribution Policy may result in a decrease in the Fund’s net assets. A decrease in the Fund’s net assets may cause an increase in the Fund’s annual operating expense ratio and a decrease in the Fund’s market price per share to the extent the market price correlates closely to the Fund’s net asset value per share. The Distribution Policy may also negatively affect the Fund’s investment activities to the extent that the Fund is required to hold larger cash positions than it typically would hold or to the extent that the Fund must liquidate securities that it would not have sold, for the purpose of paying the distribution. Each Fund’s Board has the right to amend, suspend or terminate the Distribution Policy at any time. The amendment, suspension or termination of the Distribution Policy may affect the Fund’s market price per share. Investors should consult their tax advisor regarding federal, state and local tax considerations that may be applicable in their particular circumstances.
Circular 230 disclosure: To ensure compliance with requirements imposed by the U.S. Treasury, we inform you that any U.S. tax advice contained in this communication (including any attachments) is not intended or written to be used, and cannot be used, for the purpose of (i) avoiding penalties under the Internal Revenue Code or (ii) promoting, marketing or recommending to another party any transaction or matter addressed herein.
In the United States, abrdn is the marketing name for the following affiliated, registered investment advisers: abrdn Inc., Aberdeen Asset Managers Ltd., abrdn Australia Limited, abrdn Asia Limited, Aberdeen Capital Management, LLC, abrdn ETFs Advisors LLC and Aberdeen Standard Alternative Funds Limited.
Closed-end funds are traded on the secondary market through one of the stock exchanges. A Fund’s investment return and principal value will fluctuate so that an investor’s shares may be worth more or less than the original cost. Shares of closed-end funds may trade above (a premium) or below (a discount) the net asset value (NAV) of the fund’s portfolio. There is no assurance that a Fund will achieve its investment objective. Past performance does not guarantee future results.
If you wish to receive this information electronically, please contact Investor.Relations@abrdn.com
https://www.abrdn.com/en-us/cefinvestorcenter
###
Exhibit 99.13(c)(3)
FOR IMMEDIATE RELEASE
For More Information Contact:
abrdn U.S. Closed-End Funds
Investor Relations
1-800-522-5465
Investor.Relations@abrdn.com
ABRDN
U.S. CLOSED-END FUNDS
ANNOUNCE DISTRIBUTION PAYMENT DETAILS
abrdn Global Infrastructure Income Fund (“ASGI”)
abrdn Asia-Pacific Income Fund, Inc. (“FAX”)
(Philadelphia, February 28, 2023) -The above-noted abrdn U.S. Closed-End Funds (the “Funds” or individually the “Fund”), today announced that the Funds paid the distributions noted in the table below on February 28, 2023, on a per share basis to all shareholders of record as of February 21, 2023 (ex-dividend date February 17, 2023).
| Ticker | Exchange | Fund | Amount | |||||
| ASGI | NYSE | abrdn Global Infrastructure Income Fund | $ | 0.1200 | ||||
| FAX | NYSE American | abrdn Asia-Pacific Income Fund, Inc. | $ | 0.0275 | ||||
Each Fund has adopted a distribution policy to provide investors with a stable distribution out of current income, supplemented by realized capital gains and, to the extent necessary, paid-in capital.
Under applicable U.S. tax rules, the amount and character of distributable income for each Fund’s fiscal year can be finally determined only as of the end of the Fund’s fiscal year. However, under Section 19 of the Investment Company Act of 1940, as amended (the “1940 Act”) and related rules, the Funds may be required to indicate to shareholders the estimated source of certain distributions to shareholders.
The following tables set forth the estimated amounts of the sources of the distributions for purposes of Section 19 of the 1940 Act and the rules adopted thereunder. The tables have been computed based on generally accepted accounting principles. The tables include estimated amounts and percentages for the current distributions paid this month as well as for the cumulative distributions paid relating to fiscal year to date, from the following sources: net investment income; net realized short-term capital gains; net realized long-term capital gains; and return of capital. The estimated compositions of the distributions may vary because the estimated composition may be impacted by future income, expenses and realized gains and losses on securities and currencies.
Each Fund’s estimated sources of the current distribution paid this month and for its current fiscal year to date are as follows:
| Estimated Amounts of Current Distribution per Share | ||||||||||||||||||||||||||||||||||||
| Fund* | Distribution Amount | Net Investment Income | Net Realized Short-Term Gains** | Net Realized Long-Term Gains | Return of Capital | |||||||||||||||||||||||||||||||
| ASGI | $ | 0.1200 | $ | 0.0084 | 7 | % | - | - | $ | 0.1116 | 93 | % | - | - | ||||||||||||||||||||||
| FAX | $ | 0.0275 | $ | 0.0143 | 52 | % | - | - | - | - | $ | 0.0132 | 48 | % | ||||||||||||||||||||||
| Estimated Amounts of Fiscal Year* to Date Cumulative Distributions per Share | ||||||||||||||||||||||||||||||||||||
Fund | Distribution Amount | Net Investment | Net Realized Short-Term Gains ** | Net Realized Long-Term Gains | Return of Capital | |||||||||||||||||||||||||||||||
| ASGI | $ | 0.6000 | $ | 0.0420 | 7 | % | - | - | $ | 0.5580 | 93 | % | - | - | ||||||||||||||||||||||
| FAX | $ | 0.1100 | $ | 0.0572 | 52 | % | - | - | - | - | $ | 0.0528 | 48 | % | ||||||||||||||||||||||
* ASGI has a 9/30 fiscal year end; FAX has a 10/31 fiscal year end.
**includes currency gains
Where the estimated amounts above show a portion of the distribution to be a “Return of Capital,” it means that Fund estimates that it has distributed more than its income and capital gains; therefore, a portion of your distribution may be a return of capital. A return of capital may occur for example, when some or all of the money that you invested in a Fund is paid back to you. A return of capital distribution does not necessarily reflect the Fund’s investment performance and should not be confused with “yield” or “income.”
The amounts and sources of distributions reported in this notice are only estimates and are not being provided for tax reporting purposes. The final determination of the source of all distributions for the current year will only be made after year-end. The actual amounts and sources of the amounts for tax reporting purposes will depend upon the Fund’s investment experience during the remainder of the fiscal year and may be subject to change based on tax regulations. After the end of each calendar year, a Form 1099-DIV will be sent to shareholders for the prior calendar year that will tell you how to report these distributions for federal income tax purposes.
The following table provides the Funds’ total return performance based on net asset value (NAV) over various time periods compared to the Funds’ annualized and cumulative distribution rates.
| Fund Performance and Distribution Rate Information | ||||||||||||||||
| Fund | Average Annual Total Return on NAV for the 5 Year Period Ending 01/31/20231 | Current Fiscal Period’s Annualized Distribution Rate on NAV | Cumulative
Total Return on NAV1 | Cumulative Distribution Rate on NAV2 | ||||||||||||
| ASGI | 9.43 | %3 | 6.76 | % | 16.49 | % | 2.25 | % | ||||||||
| FAX | -1.23 | % | 10.00 | % | 19.27 | % | 2.50 | % | ||||||||
1 Return data is net of all Fund expenses and fees and assumes the reinvestment of all distributions reinvested at prices obtained under the Fund’s dividend reinvestment plan.
2 Based on the Fund’s NAV as of January 31, 2023.
3 The Fund launched within the past 5 years; the performance and distribution rate information presented reflects data from inception (July 29, 2020) through January 31, 2023.
Shareholders should not draw any conclusions about a Fund’s investment performance from the amount of the Fund’s current distributions or from the terms of the distribution policy (the “Distribution Policy”).
While NAV performance may be indicative of the Fund’s investment performance, it does not measure the value of a shareholder’s investment in the Fund. The value of a shareholder’s investment in the Fund is determined by the Fund’s market price, which is based on the supply and demand for the Fund’s shares in the open market.
Pursuant to an exemptive order granted by the Securities and Exchange Commission, the Funds may distribute any long-term capital gains more frequently than the limits provided in Section 19(b) under the 1940 Act and Rule 19b-1 thereunder. Therefore, distributions paid by the Funds during the year may include net income, short-term capital gains, long-term capital gains and/or a return of capital. Net income dividends and short-term capital gain dividends, while generally taxable at ordinary income rates, may be eligible, to the extent of qualified dividend income earned by the Funds, to be taxed at a lower rate not to exceed the maximum rate applicable to your long-term capital gains. Distributions made in any calendar year in excess of investment company taxable income and net capital gain are treated as taxable ordinary dividends to the extent of undistributed earnings and profits, and then as a return of capital that reduces the adjusted basis in the shares held. To the extent return of capital distributions exceed the adjusted basis in the shares held, capital gain is recognized with a holding period based on the period the shares have been held at the date such amount is received.
The payment of distributions in accordance with the Distribution Policy may result in a decrease in the Fund’s net assets. A decrease in the Fund’s net assets may cause an increase in the Fund’s annual operating expense ratio and a decrease in the Fund’s market price per share to the extent the market price correlates closely to the Fund’s net asset value per share. The Distribution Policy may also negatively affect the Fund’s investment activities to the extent that the Fund is required to hold larger cash positions than it typically would hold or to the extent that the Fund must liquidate securities that it would not have sold, for the purpose of paying the distribution. Each Fund’s Board has the right to amend, suspend or terminate the Distribution Policy at any time. The amendment, suspension or termination of the Distribution Policy may affect the Fund’s market price per share. Investors should consult their tax advisor regarding federal, state and local tax considerations that may be applicable in their particular circumstances.
Circular 230 disclosure: To ensure compliance with requirements imposed by the U.S. Treasury, we inform you that any U.S. tax advice contained in this communication (including any attachments) is not intended or written to be used, and cannot be used, for the purpose of (i) avoiding penalties under the Internal Revenue Code or (ii) promoting, marketing or recommending to another party any transaction or matter addressed herein.
In the United States, abrdn is the marketing name for the following affiliated, registered investment advisers: abrdn Inc., Aberdeen Asset Managers Ltd., abrdn Australia Limited, abrdn Asia Limited, Aberdeen Capital Management, LLC, abrdn ETFs Advisors LLC and Aberdeen Standard Alternative Funds Limited.
Closed-end funds are traded on the secondary market through one of the stock exchanges. A Fund’s investment return and principal value will fluctuate so that an investor’s shares may be worth more or less than the original cost. Shares of closed-end funds may trade above (a premium) or below (a discount) the net asset value (NAV) of the fund’s portfolio. There is no assurance that a Fund will achieve its investment objective. Past performance does not guarantee future results.
https://www.abrdn.com/en-us/cefinvestorcenter
###
Exhibit 99.13(c)(4)
FOR IMMEDIATE RELEASE
For More Information Contact:
abrdn U.S. Closed-End Funds
Investor Relations
1-800-522-5465
Investor.Relations@abrdn.com
ABRDN U.S. CLOSED-END FUNDS
ANNOUNCE DISTRIBUTION PAYMENT DETAILS
abrdn Global Infrastructure Income Fund (“ASGI”)
abrdn Asia-Pacific Income Fund, Inc. (“FAX”)
abrdn Australia Equity Fund, Inc. (“IAF”)
The India Fund, Inc. (“IFN”)
abrdn Japan Equity Fund, Inc. (“JEQ”)
(Philadelphia, March 31, 2023) -The above-noted abrdn U.S. Closed-End Funds (the “Funds” or individually the “Fund”), today announced that the Funds paid the distributions noted in the table below on March 31, 2023, on a per share basis to all shareholders of record as of March 24, 2023 (ex-dividend date March 23, 2023). These dates apply to the Funds listed below with the exception of the abrdn Australia Equity Fund, Inc. (IAF), the India Fund, Inc. (IFN) and the abrdn Japan Equity Fund, Inc. (JEQ) which paid the distribution on March 31, 2023 to all shareholders of record as of February 21, 2023 (ex-dividend date February 17, 2023).
| Ticker | Exchange | Fund | Amount | |||||
| ASGI | NYSE | abrdn Global Infrastructure Income Fund | $ | 0.1200 | ||||
| FAX | NYSE American | abrdn Asia-Pacific Income Fund, Inc. | $ | 0.0275 | ||||
| IAF | NYSE American | abrdn Australia Equity Fund, Inc. | $ | 0.1300 | ||||
| IFN | NYSE | The India Fund, Inc. | $ | 0.4300 | ||||
| JEQ | NYSE | abrdn Japan Equity Fund, Inc. | $ | 0.1000 | ||||
Each Fund has adopted a distribution policy to provide investors with a stable distribution out of current income, supplemented by realized capital gains and, to the extent necessary, paid-in capital.
For the abrdn Australia Equity Fund, Inc. (IAF), the India Fund, Inc. (IFN) and the abrdn Japan Equity Fund, Inc. (JEQ) the stock distributions were automatically paid in newly issued shares of the Fund unless otherwise instructed by the shareholder to be paid in cash. Shares of common stock were issued at the lower of the net asset value (“NAV”) per share or the market price per share with a floor for the NAV of not less than 95% of the market price on March 17, 2023. The reinvestment prices per share for these distributions were as follows: $4.32 for the abrdn Australia Equity Fund, Inc. (IAF); $14.76 for the India Fund, Inc. (IFN) and $5.32 for the abrdn Japan Equity Fund, Inc. (JEQ). Fractional shares were generally settled in cash, except for registered shareholders with book entry accounts at Computershare Investor Services who had whole and fractional shares added to their account.
To have received the abrdn Australia Equity Fund, Inc. (IAF), the India Fund, Inc. (IFN) and the abrdn Japan Equity Fund, Inc. (JEQ) quarterly distributions payable in March 2023 in cash instead of shares of common stock, for shareholders who hold shares in “street name,” the bank, brokerage or nominee who holds the shares must have advised the Depository Trust Company as to the full and fractional shares for which they want the distribution paid in cash by March 16, 2023; and for shares that are held in registered form, written notification for the election of cash by registered shareholders must have been received by Computershare Investor Services prior to March 16, 2023.
Under applicable U.S. tax rules, the amount and character of distributable income for each Fund’s fiscal year can be finally determined only as of the end of the Fund’s fiscal year. However, under Section 19 of the Investment Company Act of 1940, as amended (the “1940 Act”) and related rules, the Funds may be required to indicate to shareholders the estimated source of certain distributions to shareholders.
The following tables set forth the estimated amounts of the sources of the distributions for purposes of Section 19 of the 1940 Act and the rules adopted thereunder. The tables have been computed based on generally accepted accounting principles. The tables include estimated amounts and percentages for the current distributions paid this month as well as for the cumulative distributions paid relating to fiscal year to date, from the following sources: net investment income; net realized short-term capital gains; net realized long-term capital gains; and return of capital. The estimated compositions of the distributions may vary because the estimated composition may be impacted by future income, expenses and realized gains and losses on securities and currencies.
Each Fund’s estimated sources of the current distribution paid this month and for its current fiscal year to date are as follows:
| Estimated Amounts of Current Distribution per Share | ||||||||||||||||||||||||||||||||||||
| Fund | Distribution Amount | Net Investment Income | Net Realized Short-Term Gains** | Net Realized Long-Term Gains | Return of Capital | |||||||||||||||||||||||||||||||
| ASGI | $ | 0.1200 | $ | 0.0060 | 5 | % | $ | 0.0012 | 1 | % | $ | 0.0984 | 82 | % | $ | 0.0144 | 12 | % | ||||||||||||||||||
| FAX | $ | 0.0275 | $ | 0.0151 | 55 | % | - | - | - | - | $ | 0.0124 | 45 | % | ||||||||||||||||||||||
| IAF | $ | 0.1300 | $ | 0.0351 | 27 | % | $ | 0.0026 | 2 | % | $ | 0.0130 | 10 | % | $ | 0.0793 | 61 | % | ||||||||||||||||||
| IFN | $ | 0.4300 | - | - | - | - | $ | 0.4300 | 100 | % | - | - | ||||||||||||||||||||||||
| JEQ | $ | 0.1000 | $ | 0.0150 | 15 | % | $ | 0.0040 | 4 | % | - | - | $ | 0.0810 | 81 | % | ||||||||||||||||||||
| Estimated Amounts of Fiscal Year* to Date Cumulative Distributions per Share | ||||||||||||||||||||||||||||||||||||
Fund | Distribution Amount | Net Investment | Net Realized Short-Term Gains ** | Net Realized Long-Term Gains | Return of Capital | |||||||||||||||||||||||||||||||
| ASGI | $ | 0.7200 | $ | 0.0360 | 5 | % | $ | 0.0072 | 1 | % | $ | 0.5904 | 82 | % | $ | 0.0864 | 12 | % | ||||||||||||||||||
| FAX | $ | 0.1375 | $ | 0.0756 | 55 | % | - | - | - | - | $ | 0.0619 | 45 | % | ||||||||||||||||||||||
| IAF | $ | 0.2500 | $ | 0.0675 | 27 | % | $ | 0.0050 | 2 | % | $ | 0.0250 | 10 | % | $ | 0.1525 | 61 | % | ||||||||||||||||||
| IFN | $ | 0.4300 | - | - | - | - | $ | 0.4300 | 100 | % | - | - | ||||||||||||||||||||||||
| JEQ | $ | 0.2000 | $ | 0.0300 | 15 | % | $ | 0.0080 | 4 | % | - | - | $ | 0.1620 | 81 | % | ||||||||||||||||||||
* ASGI has a 9/30 fiscal year end; FAX, IAF and JEQ have a 10/31 fiscal year end; IFN has a 12/31 fiscal year end.
**includes currency gains
Where the estimated amounts above show a portion of the distribution to be a “Return of Capital,” it means that Fund estimates that it has distributed more than its income and capital gains; therefore, a portion of your distribution may be a return of capital. A return of capital may occur for example, when some or all of the money that you invested in a Fund is paid back to you. A return of capital distribution does not necessarily reflect the Fund’s investment performance and should not be confused with “yield” or “income.”
The amounts and sources of distributions reported in this notice are only estimates and are not being provided for tax reporting purposes. The final determination of the source of all distributions for the current year will only be made after year-end. The actual amounts and sources of the amounts for tax reporting purposes will depend upon the Fund’s investment experience during the remainder of the fiscal year and may be subject to change based on tax regulations. After the end of each calendar year, a Form 1099-DIV will be sent to shareholders for the prior calendar year that will tell you how to report these distributions for federal income tax purposes.
The following table provides the Funds’ total return performance based on net asset value (NAV) over various time periods compared to the Funds’ annualized and cumulative distribution rates.
| Fund Performance and Distribution Rate Information | ||||||||||||||||
| Fund | Average Annual Total Return on NAV for the 5 Year Period Ending 02/28/20231 | Current Fiscal Period’s Annualized Distribution Rate on NAV | Cumulative
Total Return on NAV1 | Cumulative Distribution Rate on NAV2 | ||||||||||||
| ASGI3 | 7.77 | %3 | 7.03 | % | 12.77 | % | 2.93 | % | ||||||||
| FAX | -1.29 | % | 10.48 | % | 14.99 | % | 3.49 | % | ||||||||
1 Return data is net of all Fund expenses and fees and assumes the reinvestment of all distributions reinvested at prices obtained under the Fund’s dividend reinvestment plan.
2 Based on the Fund’s NAV as of February 28, 2023.
3 The Fund launched within the past 5 years; the performance and distribution rate information presented reflects data from inception (July 29, 2020) through February 28, 2023.
| Fund Performance and Distribution Rate Information | ||||||||||||||||
| Fund | Average Annual Total Return on NAV for the 5 Year Period Ending 01/31/20231 | Current Fiscal Period’s Annualized Distribution Rate on NAV | Cumulative
Total Return on NAV1 | Cumulative
Distribution Rate on NAV2 | ||||||||||||
| IAF | 6.87 | % | 8.71 | % | 21.22 | % | 2.18 | % | ||||||||
| IFN | 2.57 | % | N/A | * | 0.61 | % | N/A | * | ||||||||
| JEQ | -2.16 | % | 5.99 | %3 | 13.01 | % | 1.50 | % | ||||||||
1 Return data is net of all Fund expenses and fees and assumes the reinvestment of all distributions reinvested at prices obtained under the Fund’s dividend reinvestment plan.
2 Based on the Fund’s NAV as of January 31, 2023.
3 The percentage shown does not include the Fund’s annual distribution policy in place in 2021.
Shareholders should not draw any conclusions about a Fund’s investment performance from the amount of the Fund’s current distributions or from the terms of the distribution policy (the “Distribution Policy”).
While NAV performance may be indicative of the Fund’s investment performance, it does not measure the value of a shareholder’s investment in the Fund. The value of a shareholder’s investment in the Fund is determined by the Fund’s market price, which is based on the supply and demand for the Fund’s shares in the open market.
Pursuant to an exemptive order granted by the Securities and Exchange Commission, the Funds may distribute any long-term capital gains more frequently than the limits provided in Section 19(b) under the 1940 Act and Rule 19b-1 thereunder. Therefore, distributions paid by the Funds during the year may include net income, short-term capital gains, long-term capital gains and/or a return of capital. Net income dividends and short-term capital gain dividends, while generally taxable at ordinary income rates, may be eligible, to the extent of qualified dividend income earned by the Funds, to be taxed at a lower rate not to exceed the maximum rate applicable to your long-term capital gains. Distributions made in any calendar year in excess of investment company taxable income and net capital gain are treated as taxable ordinary dividends to the extent of undistributed earnings and profits, and then as a return of capital that reduces the adjusted basis in the shares held. To the extent return of capital distributions exceed the adjusted basis in the shares held, capital gain is recognized with a holding period based on the period the shares have been held at the date such amount is received.
The payment of distributions in accordance with the Distribution Policy may result in a decrease in the Fund’s net assets. A decrease in the Fund’s net assets may cause an increase in the Fund’s annual operating expense ratio and a decrease in the Fund’s market price per share to the extent the market price correlates closely to the Fund’s net asset value per share. The Distribution Policy may also negatively affect the Fund’s investment activities to the extent that the Fund is required to hold larger cash positions than it typically would hold or to the extent that the Fund must liquidate securities that it would not have sold, for the purpose of paying the distribution. Each Fund’s Board has the right to amend, suspend or terminate the Distribution Policy at any time. The amendment, suspension or termination of the Distribution Policy may affect the Fund’s market price per share. Investors should consult their tax advisor regarding federal, state and local tax considerations that may be applicable in their particular circumstances.
Circular 230 disclosure: To ensure compliance with requirements imposed by the U.S. Treasury, we inform you that any U.S. tax advice contained in this communication (including any attachments) is not intended or written to be used, and cannot be used, for the purpose of (i) avoiding penalties under the Internal Revenue Code or (ii) promoting, marketing or recommending to another party any transaction or matter addressed herein.
In the United States, abrdn is the marketing name for the following affiliated, registered investment advisers: abrdn Inc., abrdn Investments Limited, abrdn Australia Limited, abrdn Asia Limited, Aberdeen Capital Management, LLC, abrdn ETFs Advisors LLC and abrdn Alternative Funds Limited.
Closed-end funds are traded on the secondary market through one of the stock exchanges. A Fund’s investment return and principal value will fluctuate so that an investor’s shares may be worth more or less than the original cost. Shares of closed-end funds may trade above (a premium) or below (a discount) the net asset value (NAV) of the fund’s portfolio. There is no assurance that a Fund will achieve its investment objective. Past performance does not guarantee future results.
https://www.abrdn.com/en-us/cefinvestorcenter
###
Exhibit 99.13(c)(5)
FOR IMMEDIATE RELEASE
For More Information Contact:
abrdn U.S. Closed-End Funds
Investor Relations
1-800-522-5465
Investor.Relations@abrdn.com
ABRDN
U.S. CLOSED-END FUNDS
ANNOUNCE DISTRIBUTION PAYMENT DETAILS
abrdn Global Infrastructure Income
Fund (“ASGI”)
abrdn Asia-Pacific Income Fund, Inc. (“FAX”)
(Philadelphia, April 28, 2023) -The above-noted abrdn U.S. Closed-End Funds (the “Funds” or individually the “Fund”), today announced that the Funds paid the distributions noted in the table below on April 28, 2023, on a per share basis to all shareholders of record as of April 21, 2023 (ex-dividend date April 20, 2023).
| Ticker | Exchange | Fund | Amount | |||||
| ASGI | NYSE | abrdn Global Infrastructure Income Fund | $ | 0.1200 | ||||
| FAX | NYSE American | abrdn Asia-Pacific Income Fund, Inc. | $ | 0.0275 | ||||
Each Fund has adopted a distribution policy to provide investors with a stable distribution out of current income, supplemented by realized capital gains and, to the extent necessary, paid-in capital.
Under applicable U.S. tax rules, the amount and character of distributable income for each Fund’s fiscal year can be finally determined only as of the end of the Fund’s fiscal year. However, under Section 19 of the Investment Company Act of 1940, as amended (the “1940 Act”) and related rules, the Funds may be required to indicate to shareholders the estimated source of certain distributions to shareholders.
The following tables set forth the estimated amounts of the sources of the distributions for purposes of Section 19 of the 1940 Act and the rules adopted thereunder. The tables have been computed based on generally accepted accounting principles. The tables include estimated amounts and percentages for the current distributions paid this month as well as for the cumulative distributions paid relating to fiscal year to date, from the following sources: net investment income; net realized short-term capital gains; net realized long-term capital gains; and return of capital. The estimated compositions of the distributions may vary because the estimated composition may be impacted by future income, expenses and realized gains and losses on securities and currencies.
Each Fund’s estimated sources of the current distribution paid this month and for its current fiscal year to date are as follows:
| Estimated Amounts of Current Distribution per Share | ||||||||||||||||||||||||||||||||||||
Fund | Distribution Amount | Net Investment Income | Net Realized Short-Term Gains** | Net Realized Long-Term Gains | Return of Capital | |||||||||||||||||||||||||||||||
| ASGI | $ | 0.1200 | $ | 0.0240 | 20 | % | $ | 0.0216 | 18 | % | $ | 0.0744 | 62 | % | - | - | ||||||||||||||||||||
| FAX | $ | 0.0275 | $ | 0.0140 | 51 | % | - | - | - | - | $ | 0.0135 | 49 | % | ||||||||||||||||||||||
| Estimated Amounts of Fiscal Year* to Date Cumulative Distributions per Share | ||||||||||||||||||||||||||||||||||||
Fund | Distribution Amount | Net Investment | Net Realized
Short-Term | Net Realized Long-Term Gains | Return of | |||||||||||||||||||||||||||||||
| ASGI | $ | 0.8400 | $ | 0.1680 | 20 | % | $ | 0.1512 | 18 | % | $ | 0.5208 | 62 | % | - | - | ||||||||||||||||||||
| FAX | $ | 0.1650 | $ | 0.0842 | 51 | % | - | - | - | - | $ | 0.0808 | 49 | % | ||||||||||||||||||||||
* ASGI has a 9/30 fiscal year end; FAX has a 10/31 fiscal year end.
**includes currency gains
Where the estimated amounts above show a portion of the distribution to be a “Return of Capital,” it means that Fund estimates that it has distributed more than its income and capital gains; therefore, a portion of your distribution may be a return of capital. A return of capital may occur for example, when some or all of the money that you invested in a Fund is paid back to you. A return of capital distribution does not necessarily reflect the Fund’s investment performance and should not be confused with “yield” or “income.”
The amounts and sources of distributions reported in this notice are only estimates and are not being provided for tax reporting purposes. The final determination of the source of all distributions for the current year will only be made after year-end. The actual amounts and sources of the amounts for tax reporting purposes will depend upon the Fund’s investment experience during the remainder of the fiscal year and may be subject to change based on tax regulations. After the end of each calendar year, a Form 1099-DIV will be sent to shareholders for the prior calendar year that will tell you how to report these distributions for federal income tax purposes.
The following table provides the Funds’ total return performance based on net asset value (NAV) over various time periods compared to the Funds’ annualized and cumulative distribution rates.
| Fund Performance and Distribution Rate Information | ||||||||||||||||
| Fund | Average Annual Total Return on NAV for the 5 Year Period Ending 03/31/20231 | Current Fiscal Period’s Annualized Distribution Rate on NAV | Cumulative Total Return on NAV1 | Cumulative Distribution Rate on NAV2 | ||||||||||||
| ASGI3 | 8.88 | %3 | 6.85 | % | 16.63 | % | 3.42 | % | ||||||||
| FAX | -1.10 | % | 10.44 | % | 16.52 | % | 4.35 | % | ||||||||
1 Return data is net of all Fund expenses and fees and assumes the reinvestment of all distributions reinvested at prices obtained under the Fund’s dividend reinvestment plan.
2 Based on the Fund’s NAV as of March 31, 2023.
3 The Fund launched within the past 5 years; the performance and distribution rate information presented reflects data from inception (July 29, 2020) through March 31, 2023.
Shareholders should not draw any conclusions about a Fund’s investment performance from the amount of the Fund’s current distributions or from the terms of the distribution policy (the “Distribution Policy”).
While NAV performance may be indicative of the Fund’s investment performance, it does not measure the value of a shareholder’s investment in the Fund. The value of a shareholder’s investment in the Fund is determined by the Fund’s market price, which is based on the supply and demand for the Fund’s shares in the open market.
Pursuant to an exemptive order granted by the Securities and Exchange Commission, the Funds may distribute any long-term capital gains more frequently than the limits provided in Section 19(b) under the 1940 Act and Rule 19b-1 thereunder. Therefore, distributions paid by the Funds during the year may include net income, short-term capital gains, long-term capital gains and/or a return of capital. Net income dividends and short-term capital gain dividends, while generally taxable at ordinary income rates, may be eligible, to the extent of qualified dividend income earned by the Funds, to be taxed at a lower rate not to exceed the maximum rate applicable to your long-term capital gains. Distributions made in any calendar year in excess of investment company taxable income and net capital gain are treated as taxable ordinary dividends to the extent of undistributed earnings and profits, and then as a return of capital that reduces the adjusted basis in the shares held. To the extent return of capital distributions exceed the adjusted basis in the shares held, capital gain is recognized with a holding period based on the period the shares have been held at the date such amount is received.
The payment of distributions in accordance with the Distribution Policy may result in a decrease in the Fund’s net assets. A decrease in the Fund’s net assets may cause an increase in the Fund’s annual operating expense ratio and a decrease in the Fund’s market price per share to the extent the market price correlates closely to the Fund’s net asset value per share. The Distribution Policy may also negatively affect the Fund’s investment activities to the extent that the Fund is required to hold larger cash positions than it typically would hold or to the extent that the Fund must liquidate securities that it would not have sold, for the purpose of paying the distribution. Each Fund’s Board has the right to amend, suspend or terminate the Distribution Policy at any time. The amendment, suspension or termination of the Distribution Policy may affect the Fund’s market price per share. Investors should consult their tax advisor regarding federal, state and local tax considerations that may be applicable in their particular circumstances.
Circular 230 disclosure: To ensure compliance with requirements imposed by the U.S. Treasury, we inform you that any U.S. tax advice contained in this communication (including any attachments) is not intended or written to be used, and cannot be used, for the purpose of (i) avoiding penalties under the Internal Revenue Code or (ii) promoting, marketing or recommending to another party any transaction or matter addressed herein.
In the United States, abrdn is the marketing name for the following affiliated, registered investment advisers: abrdn Inc., abrdn Investments Limited, abrdn Australia Limited, abrdn Asia Limited, Aberdeen Capital Management, LLC, abrdn ETFs Advisors LLC and abrdn Alternative Funds Limited.
Closed-end funds are traded on the secondary market through one of the stock exchanges. A Fund’s investment return and principal value will fluctuate so that an investor’s shares may be worth more or less than the original cost. Shares of closed-end funds may trade above (a premium) or below (a discount) the net asset value (NAV) of the fund’s portfolio. There is no assurance that a Fund will achieve its investment objective. Past performance does not guarantee future results.
https://www.abrdn.com/en-us/cefinvestorcenter
###
Exhibit 99.13(c)(6)
FOR IMMEDIATE RELEASE
For More Information Contact:
abrdn U.S. Closed-End Funds
Investor Relations
1-800-522-5465
Investor.Relations@abrdn.com
ABRDN
U.S. CLOSED-END FUNDS
ANNOUNCE DISTRIBUTION PAYMENT DETAILS
abrdn Global Infrastructure Income
Fund (“ASGI”)
abrdn Asia-Pacific Income Fund, Inc. (“FAX”)
(Philadelphia, May 31, 2023) -The above-noted abrdn U.S. Closed-End Funds (the “Funds” or individually the “Fund”), today announced that the Funds paid the distributions noted in the table below on May 31, 2023, on a per share basis to all shareholders of record as of May 19, 2023 (ex-dividend date May 18, 2023).
| Ticker | Exchange | Fund | Amount | |||||
| ASGI | NYSE | abrdn Global Infrastructure Income Fund | $ | 0.1200 | ||||
| FAX | NYSE American | abrdn Asia-Pacific Income Fund, Inc. | $ | 0.0275 | ||||
Each Fund has adopted a distribution policy to provide investors with a stable distribution out of current income, supplemented by realized capital gains and, to the extent necessary, paid-in capital.
Under applicable U.S. tax rules, the amount and character of distributable income for each Fund’s fiscal year can be finally determined only as of the end of the Fund’s fiscal year. However, under Section 19 of the Investment Company Act of 1940, as amended (the “1940 Act”) and related rules, the Funds may be required to indicate to shareholders the estimated source of certain distributions to shareholders.
The following tables set forth the estimated amounts of the sources of the distributions for purposes of Section 19 of the 1940 Act and the rules adopted thereunder. The tables have been computed based on generally accepted accounting principles. The tables include estimated amounts and percentages for the current distributions paid this month as well as for the cumulative distributions paid relating to fiscal year to date, from the following sources: net investment income; net realized short-term capital gains; net realized long-term capital gains; and return of capital. The estimated compositions of the distributions may vary because the estimated composition may be impacted by future income, expenses and realized gains and losses on securities and currencies.
Each Fund’s estimated sources of the current distribution paid this month and for its current fiscal year to date are as follows:
| Estimated Amounts of Current Distribution per Share | ||||||||||||||||||||||||||||||||||||
Fund | Distribution Amount | Net Investment Income | Net Realized Short-Term Gains** | Net Realized Long-Term Gains | Return of Capital | |||||||||||||||||||||||||||||||
| ASGI | $ | 0.1200 | $ | 0.0372 | 31 | % | $ | 0.0168 | 14 | % | $ | 0.0660 | 55 | % | - | - | ||||||||||||||||||||
| FAX | $ | 0.0275 | $ | 0.0146 | 53 | % | - | - | - | - | $ | 0.0129 | 47 | % | ||||||||||||||||||||||
| Estimated Amounts of Fiscal Year* to Date Cumulative Distributions per Share | ||||||||||||||||||||||||||||||||||||
Fund | Distribution Amount | Net Investment | Net Realized Short-Term Gains** | Net Realized Long-Term Gains | Return of | |||||||||||||||||||||||||||||||
| ASGI | $ | 0.9600 | $ | 0.2976 | 31 | % | $ | 0.1344 | 14 | % | $ | 0.5280 | 55 | % | - | - | ||||||||||||||||||||
| FAX | $ | 0.1925 | $ | 0.1020 | 53 | % | - | - | - | - | $ | 0.0905 | 47 | % | ||||||||||||||||||||||
* ASGI has a 9/30 fiscal year end; FAX has a 10/31 fiscal year end.
**includes currency gains
Where the estimated amounts above show a portion of the distribution to be a “Return of Capital,” it means that Fund estimates that it has distributed more than its income and capital gains; therefore, a portion of your distribution may be a return of capital. A return of capital may occur for example, when some or all of the money that you invested in a Fund is paid back to you. A return of capital distribution does not necessarily reflect the Fund’s investment performance and should not be confused with “yield” or “income.”
The amounts and sources of distributions reported in this notice are only estimates and are not being provided for tax reporting purposes. The final determination of the source of all distributions for the current year will only be made after year-end. The actual amounts and sources of the amounts for tax reporting purposes will depend upon the Fund’s investment experience during the remainder of the fiscal year and may be subject to change based on tax regulations. After the end of each calendar year, a Form 1099-DIV will be sent to shareholders for the prior calendar year that will tell you how to report these distributions for federal income tax purposes.
The following table provides the Funds’ total return performance based on net asset value (NAV) over various time periods compared to the Funds’ annualized and cumulative distribution rates.
| Fund Performance and Distribution Rate Information | ||||||||||||||||
| Fund | Average Annual Total Return on NAV for the 5 Year Period Ending 04/30/20231 | Current Fiscal Period’s Annualized Distribution Rate on NAV | Cumulative Total Return on NAV1 | Cumulative Distribution Rate on NAV2 | ||||||||||||
| ASGI3 | 9.63 | %3 | 6.72 | % | 19.70 | % | 3.92 | % | ||||||||
| FAX | -0.48 | % | 10.44 | % | 17.69 | % | 5.22 | % | ||||||||
1 Return data is net of all Fund expenses and fees and assumes the reinvestment of all distributions reinvested at prices obtained under the Fund’s dividend reinvestment plan.
2 Based on the Fund’s NAV as of April 30, 2023.
3 The Fund launched within the past 5 years; the performance and distribution rate information presented reflects data from inception (July 29, 2020) through April 30, 2023.
Shareholders should not draw any conclusions about a Fund’s investment performance from the amount of the Fund’s current distributions or from the terms of the distribution policy (the “Distribution Policy”).
While NAV performance may be indicative of the Fund’s investment performance, it does not measure the value of a shareholder’s investment in the Fund. The value of a shareholder’s investment in the Fund is determined by the Fund’s market price, which is based on the supply and demand for the Fund’s shares in the open market.
Pursuant to an exemptive order granted by the Securities and Exchange Commission, the Funds may distribute any long-term capital gains more frequently than the limits provided in Section 19(b) under the 1940 Act and Rule 19b-1 thereunder. Therefore, distributions paid by the Funds during the year may include net income, short-term capital gains, long-term capital gains and/or a return of capital. Net income dividends and short-term capital gain dividends, while generally taxable at ordinary income rates, may be eligible, to the extent of qualified dividend income earned by the Funds, to be taxed at a lower rate not to exceed the maximum rate applicable to your long-term capital gains. Distributions made in any calendar year in excess of investment company taxable income and net capital gain are treated as taxable ordinary dividends to the extent of undistributed earnings and profits, and then as a return of capital that reduces the adjusted basis in the shares held. To the extent return of capital distributions exceed the adjusted basis in the shares held, capital gain is recognized with a holding period based on the period the shares have been held at the date such amount is received.
The payment of distributions in accordance with the Distribution Policy may result in a decrease in the Fund’s net assets. A decrease in the Fund’s net assets may cause an increase in the Fund’s annual operating expense ratio and a decrease in the Fund’s market price per share to the extent the market price correlates closely to the Fund’s net asset value per share. The Distribution Policy may also negatively affect the Fund’s investment activities to the extent that the Fund is required to hold larger cash positions than it typically would hold or to the extent that the Fund must liquidate securities that it would not have sold, for the purpose of paying the distribution. Each Fund’s Board has the right to amend, suspend or terminate the Distribution Policy at any time. The amendment, suspension or termination of the Distribution Policy may affect the Fund’s market price per share. Investors should consult their tax advisor regarding federal, state and local tax considerations that may be applicable in their particular circumstances.
Circular 230 disclosure: To ensure compliance with requirements imposed by the U.S. Treasury, we inform you that any U.S. tax advice contained in this communication (including any attachments) is not intended or written to be used, and cannot be used, for the purpose of (i) avoiding penalties under the Internal Revenue Code or (ii) promoting, marketing or recommending to another party any transaction or matter addressed herein.
In the United States, abrdn is the marketing name for the following affiliated, registered investment advisers: abrdn Inc., abrdn Investments Limited, abrdn Australia Limited, abrdn Asia Limited, Aberdeen Capital Management, LLC, abrdn ETFs Advisors LLC and abrdn Alternative Funds Limited.
Closed-end funds are traded on the secondary market through one of the stock exchanges. A Fund’s investment return and principal value will fluctuate so that an investor’s shares may be worth more or less than the original cost. Shares of closed-end funds may trade above (a premium) or below (a discount) the net asset value (NAV) of the fund’s portfolio. There is no assurance that a Fund will achieve its investment objective. Past performance does not guarantee future results.
https://www.abrdn.com/en-us/cefinvestorcenter
###
Exhibit 99.13(c)(7)
FOR IMMEDIATE RELEASE
For More Information Contact:
abrdn U.S. Closed-End Funds
Investor Relations
1-800-522-5465
Investor.Relations@abrdn.com
ABRDN U.S. CLOSED-END FUNDS
ANNOUNCE DISTRIBUTION PAYMENT DETAILS
abrdn Global Infrastructure Income Fund (“ASGI”)
abrdn Asia-Pacific Income Fund, Inc. (“FAX”)
(Philadelphia, June 30, 2023) -The above-noted abrdn U.S. Closed-End Funds (the “Funds” or individually the “Fund”), today announced that the Funds paid the distributions noted in the table below on June 30, 2023, on a per share basis to all shareholders of record as of June 23, 2023 (ex-dividend date June 22, 2023). These dates apply to the Funds listed below with the exception of the abrdn Australia Equity Fund, Inc. (IAF), the India Fund, Inc. (IFN) and the abrdn Japan Equity Fund, Inc. (JEQ) which paid the distribution on June 30, 2023, to all shareholders of record as of May 19, 2023 (ex-dividend date May 18, 2023).
| Ticker | Exchange | Fund | Amount | |||||
| ASGI | NYSE | abrdn Global Infrastructure Income Fund | $ | 0.1200 | ||||
| FAX | NYSE American | abrdn Asia-Pacific Income Fund, Inc. | $ | 0.0275 | ||||
| IAF | NYSE American | abrdn Australia Equity Fund, Inc. | $ | 0.1300 | ||||
| IFN | NYSE | The India Fund, Inc. | $ | 0.3900 | ||||
| JEQ | NYSE | abrdn Japan Equity Fund, Inc. | $ | 0.1000 | ||||
Each Fund has adopted a distribution policy to provide investors with a stable distribution out of current income, supplemented by realized capital gains and, to the extent necessary, paid-in capital.
For the abrdn Australia Equity Fund, Inc. (IAF), the India Fund, Inc. (IFN) and the abrdn Japan Equity Fund, Inc. (JEQ) the stock distributions were automatically paid in newly issued shares of the Fund unless otherwise instructed by the shareholder to be paid in cash. Shares of common stock were issued at the lower of the net asset value (“NAV”) per share or the market price per share with a floor for the NAV of not less than 95% of the market price on June 16, 2023. The reinvestment prices per share for these distributions were as follows: $4.44 for the abrdn Australia Equity Fund, Inc. (IAF); $16.03 for the India Fund, Inc. (IFN) and $6.15 for the abrdn Japan Equity Fund, Inc. (JEQ). Fractional shares were generally settled in cash, except for registered shareholders with book entry accounts at Computershare Investor Services who had whole and fractional shares added to their account.
To have received the abrdn Australia Equity Fund, Inc. (IAF), the India Fund, Inc. (IFN) and the abrdn Japan Equity Fund, Inc. (JEQ) quarterly distributions payable in June 2023 in cash instead of shares of common stock, for shareholders who hold shares in “street name,” the bank, brokerage or nominee who holds the shares must have advised the Depository Trust Company as to the full and fractional shares for which they want the distribution paid in cash by June 15, 2023; and for shares that are held in registered form, written notification for the election of cash by registered shareholders must have been received by Computershare Investor Services prior to June 15, 2023.
Under applicable U.S. tax rules, the amount and character of distributable income for each Fund’s fiscal year can be finally determined only as of the end of the Fund’s fiscal year. However, under Section 19 of the Investment Company Act of 1940, as amended (the “1940 Act”) and related rules, the Funds may be required to indicate to shareholders the estimated source of certain distributions to shareholders.
The following tables set forth the estimated amounts of the sources of the distributions for purposes of Section 19 of the 1940 Act and the rules adopted thereunder. The tables have been computed based on generally accepted accounting principles. The tables include estimated amounts and percentages for the current distributions paid this month as well as for the cumulative distributions paid relating to fiscal year to date, from the following sources: net investment income; net realized short-term capital gains; net realized long-term capital gains; and return of capital. The estimated compositions of the distributions may vary because the estimated composition may be impacted by future income, expenses and realized gains and losses on securities and currencies.
Each Fund’s estimated sources of the current distribution paid this month and for its current fiscal year to date are as follows:
| Estimated Amounts of Current Distribution per Share | ||||||||||||||||||||||||||||||||||||
| Fund | Distribution Amount | Net Investment Income | Net Realized Short-Term Gains** | Net Realized Long-Term Gains | Return of Capital | |||||||||||||||||||||||||||||||
| ASGI | $ | 0.1200 | $ | 0.0372 | 31 | % | $ | 0.0132 | 11 | % | $ | 0.0696 | 58 | % | - | - | ||||||||||||||||||||
| FAX | $ | 0.0275 | $ | 0.0151 | 55 | % | - | - | - | - | $ | 0.0124 | 45 | % | ||||||||||||||||||||||
| IAF | $ | 0.1300 | $ | 0.0247 | 19 | % | $ | 0.0013 | 1 | % | $ | 0.0078 | 6 | % | $ | 0.0962 | 74 | % | ||||||||||||||||||
| IFN | $ | 0.3900 | - | - | $ | 0.0039 | 1 | % | $ | 0.3861 | 99 | % | - | - | ||||||||||||||||||||||
| JEQ | $ | 0.1000 | $ | 0.0090 | 9 | % | $ | 0.0020 | 2 | % | - | - | $ | 0.0890 | 89 | % | ||||||||||||||||||||
| Estimated Amounts of Fiscal Year* to Date Cumulative Distributions per Share | ||||||||||||||||||||||||||||||||||||
| Fund | Distribution Amount | Net Investment Income | Net Realized Short-Term Gains ** | Net Realized Long-Term Gains | Return of Capital | |||||||||||||||||||||||||||||||
| ASGI | $ | 1.0800 | $ | 0.3348 | 31 | % | $ | 0.1188 | 11 | % | $ | 0.6264 | 58 | % | - | - | ||||||||||||||||||||
| FAX | $ | 0.2200 | $ | 0.1210 | 55 | % | - | - | - | - | $ | 0.0990 | 45 | % | ||||||||||||||||||||||
| IAF | $ | 0.3800 | $ | 0.0722 | 19 | % | $ | 0.0038 | 1 | % | $ | 0.0228 | 6 | % | $ | 0.2812 | 74 | % | ||||||||||||||||||
| IFN | $ | 0.8200 | - | - | $ | 0.0082 | 1 | % | $ | 0.8118 | 99 | % | - | - | ||||||||||||||||||||||
| JEQ | $ | 0.3000 | $ | 0.0270 | 9 | % | $ | 0.0060 | 2 | % | - | - | $ | 0.2670 | 89 | % | ||||||||||||||||||||
* ASGI has a 9/30 fiscal year end; FAX, IAF and JEQ have a 10/31 fiscal year end; IFN has a 12/31 fiscal year end.
**includes currency gains
Where the estimated amounts above show a portion of the distribution to be a “Return of Capital,” it means that Fund estimates that it has distributed more than its income and capital gains; therefore, a portion of your distribution may be a return of capital. A return of capital may occur for example, when some or all of the money that you invested in a Fund is paid back to you. A return of capital distribution does not necessarily reflect the Fund’s investment performance and should not be confused with “yield” or “income.”
As of June 22, 2023, after giving effect to this payment, IAF estimates it has a net deficit of $541,000. A net deficit results when the Fund has net unrealized losses that are in excess of any net realized gains that have not yet been distributed.
As of June 22, 2023, after giving effect to this payment, JEQ estimates it has a net deficit of $5,391,000.00. A net deficit results when the Fund has net unrealized losses that are in excess of any net realized gains that have not yet been distributed.
The amounts and sources of distributions reported in this notice are only estimates and are not being provided for tax reporting purposes. The final determination of the source of all distributions for the current year will only be made after year-end. The actual amounts and sources of the amounts for tax reporting purposes will depend upon the Fund’s investment experience during the remainder of the fiscal year and may be subject to change based on tax regulations. After the end of each calendar year, a Form 1099-DIV will be sent to shareholders for the prior calendar year that will tell you how to report these distributions for federal income tax purposes.
The following table provides the Funds’ total return performance based on net asset value (NAV) over various time periods compared to the Funds’ annualized and cumulative distribution rates.
| Fund Performance and Distribution Rate Information | ||||||||||||||||
| Fund | Average Annual Total Return on NAV for the 5 Year Period Ending 05/31/20231 | Current Fiscal Period’s Annualized Distribution Rate on NAV | Cumulative Total Return on NAV1 | Cumulative Distribution Rate on NAV2 | ||||||||||||
| ASGI3 | 7.42 | %3 | 7.11 | % | 13.85 | % | 4.74 | % | ||||||||
| FAX | -0.73 | % | 10.68 | % | 16.24 | % | 6.23 | % | ||||||||
1 Return data is net of all Fund expenses and fees and assumes the reinvestment of all distributions reinvested at prices obtained under the Fund’s dividend reinvestment plan.
2 Based on the Fund’s NAV as of May 31, 2023.
3 The Fund launched within the past 5 years; the performance and distribution rate information presented reflects data from inception (July 29, 2020) through May 31, 2023.
| Fund Performance and Distribution Rate Information | ||||||||||||||||
| Fund | Average Annual Total Return on NAV for the 5 Year Period Ending 04/30/20231 | Current Fiscal Period’s Annualized Distribution Rate on NAV | Cumulative Total Return on NAV1 | Cumulative Distribution Rate on NAV2 | ||||||||||||
| IAF | 6.76 | % | 10.26 | % | 12.63 | % | 5.03 | % | ||||||||
| IFN | 3.36 | % | 10.72 | % | 1.40 | % | 2.68 | % | ||||||||
| JEQ | -1.20 | % | 6.13 | % | 12.55 | % | 3.06 | % | ||||||||
1 Return data is net of all Fund expenses and fees and assumes the reinvestment of all distributions reinvested at prices obtained under the Fund’s dividend reinvestment plan.
2 Based on the Fund’s NAV as of April 30, 2023.
Shareholders should not draw any conclusions about a Fund’s investment performance from the amount of the Fund’s current distributions or from the terms of the distribution policy (the “Distribution Policy”).
While NAV performance may be indicative of the Fund’s investment performance, it does not measure the value of a shareholder’s investment in the Fund. The value of a shareholder’s investment in the Fund is determined by the Fund’s market price, which is based on the supply and demand for the Fund’s shares in the open market.
Pursuant to an exemptive order granted by the Securities and Exchange Commission, the Funds may distribute any long-term capital gains more frequently than the limits provided in Section 19(b) under the 1940 Act and Rule 19b-1 thereunder. Therefore, distributions paid by the Funds during the year may include net income, short-term capital gains, long-term capital gains and/or a return of capital. Net income dividends and short-term capital gain dividends, while generally taxable at ordinary income rates, may be eligible, to the extent of qualified dividend income earned by the Funds, to be taxed at a lower rate not to exceed the maximum rate applicable to your long-term capital gains. Distributions made in any calendar year in excess of investment company taxable income and net capital gain are treated as taxable ordinary dividends to the extent of undistributed earnings and profits, and then as a return of capital that reduces the adjusted basis in the shares held. To the extent return of capital distributions exceed the adjusted basis in the shares held, capital gain is recognized with a holding period based on the period the shares have been held at the date such amount is received.
The payment of distributions in accordance with the Distribution Policy may result in a decrease in the Fund’s net assets. A decrease in the Fund’s net assets may cause an increase in the Fund’s annual operating expense ratio and a decrease in the Fund’s market price per share to the extent the market price correlates closely to the Fund’s net asset value per share. The Distribution Policy may also negatively affect the Fund’s investment activities to the extent that the Fund is required to hold larger cash positions than it typically would hold or to the extent that the Fund must liquidate securities that it would not have sold, for the purpose of paying the distribution. Each Fund’s Board has the right to amend, suspend or terminate the Distribution Policy at any time. The amendment, suspension or termination of the Distribution Policy may affect the Fund’s market price per share. Investors should consult their tax advisor regarding federal, state and local tax considerations that may be applicable in their particular circumstances.
Circular 230 disclosure: To ensure compliance with requirements imposed by the U.S. Treasury, we inform you that any U.S. tax advice contained in this communication (including any attachments) is not intended or written to be used, and cannot be used, for the purpose of (i) avoiding penalties under the Internal Revenue Code or (ii) promoting, marketing or recommending to another party any transaction or matter addressed herein.
In the United States, abrdn is the marketing name for the following affiliated, registered investment advisers: abrdn Inc., abrdn Investments Limited, abrdn Australia Limited, abrdn Asia Limited, Aberdeen Capital Management, LLC, abrdn ETFs Advisors LLC and abrdn Alternative Funds Limited.
Closed-end funds are traded on the secondary market through one of the stock exchanges. A Fund’s investment return and principal value will fluctuate so that an investor’s shares may be worth more or less than the original cost. Shares of closed-end funds may trade above (a premium) or below (a discount) the net asset value (NAV) of the fund’s portfolio. There is no assurance that a Fund will achieve its investment objective. Past performance does not guarantee future results.
https://www.abrdn.com/en-us/cefinvestorcenter
###
1 Year abrdn Asiapacific Income Chart |
1 Month abrdn Asiapacific Income Chart |

It looks like you are not logged in. Click the button below to log in and keep track of your recent history.
Support: +44 (0) 203 8794 460 | support@advfn.com
By accessing the services available at ADVFN you are agreeing to be bound by ADVFN's Terms & Conditions
 Hot Features