We could not find any results for:
Make sure your spelling is correct or try broadening your search.
| Share Name | Share Symbol | Market | Type |
|---|---|---|---|
| Battalion Oil Corporation | AMEX:BATL | AMEX | Common Stock |
| Price Change | % Change | Share Price | High Price | Low Price | Open Price | Shares Traded | Last Trade | |
|---|---|---|---|---|---|---|---|---|
| 0.03 | 0.53% | 5.66 | 5.84 | 5.547 | 5.69 | 11,124 | 01:00:00 |
| |
Battalion Oil Corporation
Two Memorial City Plaza 820 Gessner Road, Suite 1100 Houston, Texas 77024 Tel: (832) 538-0300 |
| |
Luminus Management, LLC
Luminus Energy Partners Master Fund, Ltd. c/o of Luminus Management, LLC 1811 Bering Drive, Suite 400 Houston, Texas 77057 Tel: (713) 826-6262 |
| |
Oaktree Capital Group, LLC
Oaktree Fund GP, LLC OCM Holdings I, LLC Oaktree Holdings, LLC OCM HLCN Holdings, L.P. Oaktree Fund GPI, L.P. Oaktree Capital I, L.P. c/o Oak Tree Capital Group, LLC 333 S. Grand Avenue, 28th Floor Los Angeles, California 90071 Tel: (213) 830-6300 |
| |
Ruckus Energy Holdings, LLC
Fury Resources, Inc. Richard H. Little c/o K&L Gates LLP 1 Park Plaza, Twelfth Floor Irvine, CA 92614 |
|
| |
Bruce F. Perce
Ryan H. Ferris Mayer Brown LLP 71 South Wacker Drive Chicago, IL 60606 Tel: (312) 782-0600 |
| |
David B. Cosgrove
Dechert LLP 300 South Tryon Street, Suite 800 Charlotte, NC 28202 Tel: (704) 339-3147 |
| |
Michael A. Hedge
Jason C. Dreibelbis K&L Gates LLP 1 Park Plaza, Twelfth Floor Irvine, CA 92614 Tel: (949) 253-0900 |
|
| | BATTALION OIL CORPORATION | | | | | ||||||
| | By: | | |
/s/ Walter R. Mayer
|
| | | | |||
| | | | | Name: | | | Walter R. Mayer | | | | |
| | | | | Title: | | | Senior Vice President, General Counsel and Corporate Secretary | | | | |
| | LUMINUS ENERGY PARTNERS MASTER FUND, LTD. | | | | | ||||||
| | By: | | |
/s/ Jonathan Barrett
|
| | | | |||
| | | | | Name: | | | Jonathan Barrett | | | | |
| | | | | Title: | | |
President of Luminus Management, LLC
|
| | | |
| | LUMINUS MANAGEMENT, LLC | | | | | ||||||
| | By: | | |
/s/ Jonathan Barrett
|
| | | | |||
| | | | | Name: | | | Jonathan Barrett | | | | |
| | | | | Title: | | | President | | | | |
| | By: | | |
/s/ Henry Orren
|
| | | | |||
| | | | | Name: | | | Henry Orren | | | | |
| | | | | Title: | | | Senior Vice President | | | | |
| | By: | | |
/s/ Henry Orren
|
| | | | |||
| | | | | Name: | | | Henry Orren | | | | |
| | | | | Title: | | | Senior Vice President | | | | |
| | By: | | |
/s/ Henry Orren
|
| | | | |||
| | | | | Name: | | | Henry Orren | | | | |
| | | | | Title: | | | Senior Vice President | | | | |
| | By: | | |
/s/ Henry Orren
|
| | | | |||
| | | | | Name: | | | Henry Orren | | | | |
| | | | | Title: | | | Senior Vice President | | | | |
| | By: | | |
/s/ Henry Orren
|
| | | | |||
| | | | | Name: | | | Henry Orren | | | | |
| | | | | Title: | | | Senior Vice President | | | | |
| | By: | | |
/s/ Henry Orren
|
| | | | |||
| | | | | Name: | | | Henry Orren | | | | |
| | | | | Title: | | | Senior Vice President | | | | |
| | By: | | |
/s/ Henry Orren
|
| | | | |||
| | | | | Name: | | | Henry Orren | | | | |
| | | | | Title: | | | Senior Vice President | | | | |
| | By: | | |
/s/ Henry Orren
|
| | | | |||
| | | | | Name: | | | Henry Orren | | | | |
| | | | | Title: | | | Senior Vice President | | | | |
| | By: | | |
/s/ Ariella Fuchs
|
| | | | |||
| | | | | Name: | | | Ariella Fuchs | | | | |
| | | | | Title: | | | President and General Counsel | | | | |
| | By: | | |
/s/ Ariella Fuchs
|
| | | | |||
| | | | | Name: | | | Ariella Fuchs | | | | |
| | | | | Title: | | | President and General Counsel | | | | |
| | | |
/s/ Richard H. Little
|
| | | | ||||
| | | | | Name: | | | Richard H. Little | | | | |
Exhibit 99.(C)(iv)
| Project San Jacinto DISCUSSION MATERIALS FOR THE BOARD OF DIRECTORS OF BATTALION OIL CORPORATION NOVEMBER 4 , 2023 | CONFIDENTIAL | PRELIMINARY DRAFT | SUBJECT TO FURTHER REVIEW |
| CONFIDENTIAL - PRELIMINARY DRAFT - SUBJECT TO FURTHER REVIEW Table of Contents 2 Page 1. Executive Summary 3 2. Financial Analyses 8 3. Selected Public Market Observations 29 4. Appendix 34 Weighted Average Cost of Capital Calculation 35 Observed Premiums Paid Analysis 38 Selected Series A Convertible Preferred Stock Terms 41 Glossary of Selected Terms 44 5. Disclaimer 47 |
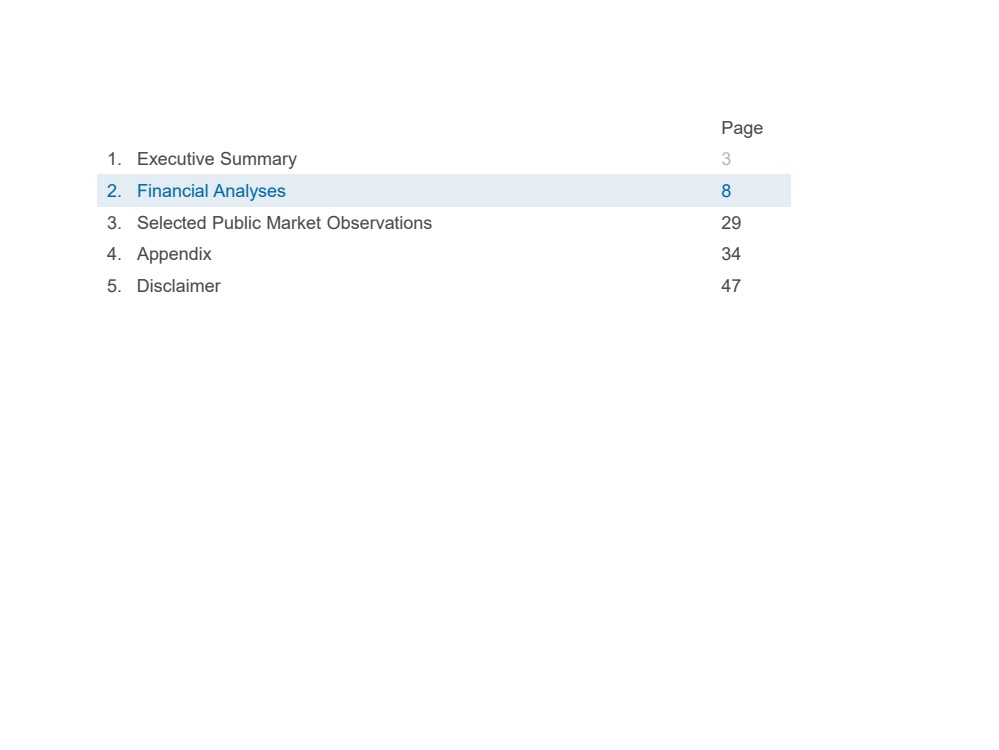
| Page 1. Executive Summary 3 2. Financial Analyses 8 3. Selected Public Market Observations 29 4. Appendix 34 5. Disclaimer 47 |
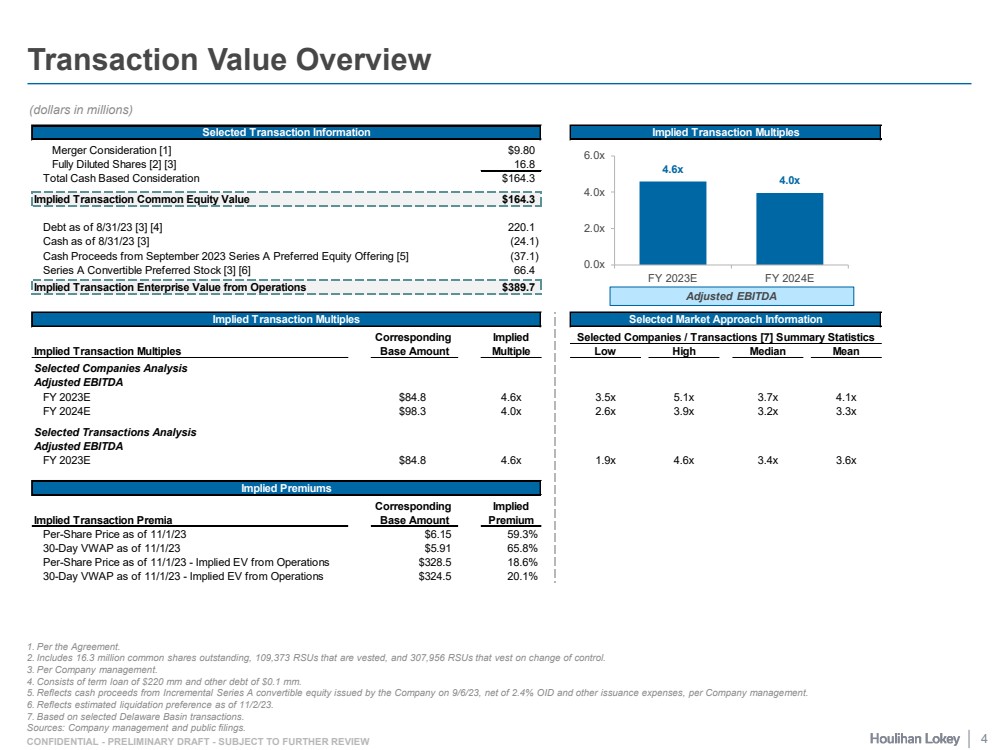
| CONFIDENTIAL - PRELIMINARY DRAFT - SUBJECT TO FURTHER REVIEW Transaction Value Overview 1. Per the Agreement. 2. Includes 16.3 million common shares outstanding, 109,373 RSUs that are vested, and 307,956 RSUs that vest on change of control. 3. Per Company management. 4. Consists of term loan of $220 mm and other debt of $0.1 mm. 5. Reflects cash proceeds from Incremental Series A convertible equity issued by the Company on 9/6/23, net of 2.4% OID and other issuance expenses, per Company management. 6. Reflects estimated liquidation preference as of 11/2/23. 7. Based on selected Delaware Basin transactions. Sources: Company management and public filings. (dollars in millions) Selected Transaction Information Implied Transaction Multiples Merger Consideration [1] $9.80 Fully Diluted Shares [2] [3] 16.8 Total Cash Based Consideration $164.3 Implied Transaction Common Equity Value $164.3 Debt as of 8/31/23 [3] [4] 220.1 Cash as of 8/31/23 [3] (24.1) Cash Proceeds from September 2023 Series A Preferred Equity Offering [5] (37.1) Series A Convertible Preferred Stock [3] [6] 66.4 Implied Transaction Enterprise Value from Operations $389.7 Implied Transaction Multiples Selected Market Approach Information Corresponding Implied Selected Companies / Transactions [7] Summary Statistics Implied Transaction Multiples Base Amount Multiple Low High Median Mean Selected Companies Analysis Adjusted EBITDA FY 2023E $84.8 4.6x 3.5x 5.1x 3.7x 4.1x FY 2024E $98.3 4.0x 2.6x 3.9x 3.2x 3.3x Selected Transactions Analysis Adjusted EBITDA FY 2023E $84.8 4.6x 1.9x 4.6x 3.4x 3.6x Implied Premiums Corresponding Implied Implied Transaction Premia Base Amount Premium Per-Share Price as of 11/1/23 $6.15 59.3% 30-Day VWAP as of 11/1/23 $5.91 65.8% Per-Share Price as of 11/1/23 - Implied EV from Operations $328.5 18.6% 30-Day VWAP as of 11/1/23 - Implied EV from Operations $324.5 20.1% 4.6x 4.0x 0.0x 2.0x 4.0x 6.0x FY 2023E FY 2024E Adjusted EBITDA 4 |
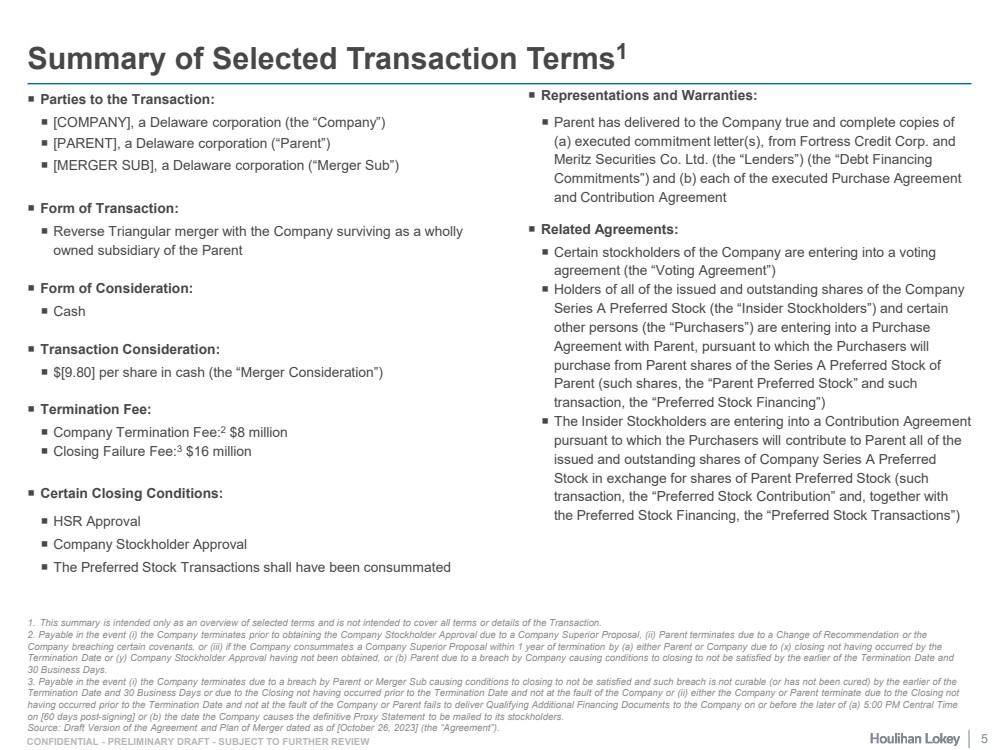
| CONFIDENTIAL - PRELIMINARY DRAFT - SUBJECT TO FURTHER REVIEW Parties to the Transaction: [COMPANY], a Delaware corporation (the “Company”) [PARENT], a Delaware corporation (“Parent”) [MERGER SUB], a Delaware corporation (“Merger Sub”) Form of Transaction: Reverse Triangular merger with the Company surviving as a wholly owned subsidiary of the Parent Form of Consideration: Cash Transaction Consideration: $[9.80] per share in cash (the “Merger Consideration”) Termination Fee: Company Termination Fee:2 $8 million Closing Failure Fee:3 $16 million Certain Closing Conditions: HSR Approval Company Stockholder Approval The Preferred Stock Transactions shall have been consummated Representations and Warranties: Parent has delivered to the Company true and complete copies of (a) executed commitment letter(s), from Fortress Credit Corp. and Meritz Securities Co. Ltd. (the “Lenders”) (the “Debt Financing Commitments”) and (b) each of the executed Purchase Agreement and Contribution Agreement Related Agreements: Certain stockholders of the Company are entering into a voting agreement (the “Voting Agreement”) Holders of all of the issued and outstanding shares of the Company Series A Preferred Stock (the “Insider Stockholders”) and certain other persons (the “Purchasers”) are entering into a Purchase Agreement with Parent, pursuant to which the Purchasers will purchase from Parent shares of the Series A Preferred Stock of Parent (such shares, the “Parent Preferred Stock” and such transaction, the “Preferred Stock Financing”) The Insider Stockholders are entering into a Contribution Agreement pursuant to which the Purchasers will contribute to Parent all of the issued and outstanding shares of Company Series A Preferred Stock in exchange for shares of Parent Preferred Stock (such transaction, the “Preferred Stock Contribution” and, together with the Preferred Stock Financing, the “Preferred Stock Transactions”) Summary of Selected Transaction Terms1 1. This summary is intended only as an overview of selected terms and is not intended to cover all terms or details of the Transaction. 2. Payable in the event (i) the Company terminates prior to obtaining the Company Stockholder Approval due to a Company Superior Proposal, (ii) Parent terminates due to a Change of Recommendation or the Company breaching certain covenants, or (iii) if the Company consummates a Company Superior Proposal within 1 year of termination by (a) either Parent or Company due to (x) closing not having occurred by the Termination Date or (y) Company Stockholder Approval having not been obtained, or (b) Parent due to a breach by Company causing conditions to closing to not be satisfied by the earlier of the Termination Date and 30 Business Days. 3. Payable in the event (i) the Company terminates due to a breach by Parent or Merger Sub causing conditions to closing to not be satisfied and such breach is not curable (or has not been cured) by the earlier of the Termination Date and 30 Business Days or due to the Closing not having occurred prior to the Termination Date and not at the fault of the Company or (ii) either the Company or Parent terminate due to the Closing not having occurred prior to the Termination Date and not at the fault of the Company or Parent fails to deliver Qualifying Additional Financing Documents to the Company on or before the later of (a) 5:00 PM Central Time on [60 days post-signing] or (b) the date the Company causes the definitive Proxy Statement to be mailed to its stockholders. Source: Draft Version of the Agreement and Plan of Merger dated as of [October 26, 2023] (the “Agreement”). 5 |
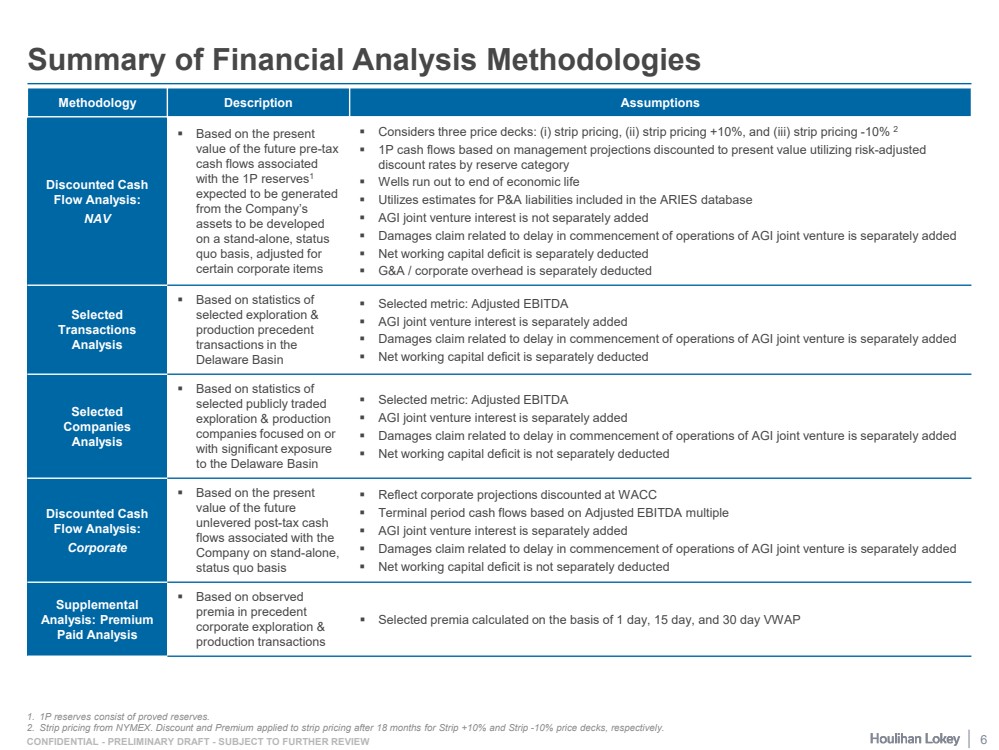
| CONFIDENTIAL - PRELIMINARY DRAFT - SUBJECT TO FURTHER REVIEW Summary of Financial Analysis Methodologies Methodology Description Assumptions Discounted Cash Flow Analysis: NAV Based on the present value of the future pre-tax cash flows associated with the 1P reserves1 expected to be generated from the Company’s assets to be developed on a stand-alone, status quo basis, adjusted for certain corporate items Considers three price decks: (i) strip pricing, (ii) strip pricing +10%, and (iii) strip pricing -10% 2 1P cash flows based on management projections discounted to present value utilizing risk-adjusted discount rates by reserve category Wells run out to end of economic life Utilizes estimates for P&A liabilities included in the ARIES database AGI joint venture interest is not separately added Damages claim related to delay in commencement of operations of AGI joint venture is separately added Net working capital deficit is separately deducted G&A / corporate overhead is separately deducted Selected Transactions Analysis Based on statistics of selected exploration & production precedent transactions in the Delaware Basin Selected metric: Adjusted EBITDA AGI joint venture interest is separately added Damages claim related to delay in commencement of operations of AGI joint venture is separately added Net working capital deficit is separately deducted Selected Companies Analysis Based on statistics of selected publicly traded exploration & production companies focused on or with significant exposure to the Delaware Basin Selected metric: Adjusted EBITDA AGI joint venture interest is separately added Damages claim related to delay in commencement of operations of AGI joint venture is separately added Net working capital deficit is not separately deducted Discounted Cash Flow Analysis: Corporate Based on the present value of the future unlevered post-tax cash flows associated with the Company on stand-alone, status quo basis Reflect corporate projections discounted at WACC Terminal period cash flows based on Adjusted EBITDA multiple AGI joint venture interest is separately added Damages claim related to delay in commencement of operations of AGI joint venture is separately added Net working capital deficit is not separately deducted Supplemental Analysis: Premium Paid Analysis Based on observed premia in precedent corporate exploration & production transactions Selected premia calculated on the basis of 1 day, 15 day, and 30 day VWAP 1. 1P reserves consist of proved reserves. 2. Strip pricing from NYMEX. Discount and Premium applied to strip pricing after 18 months for Strip +10% and Strip -10% price decks, respectively. 6 |
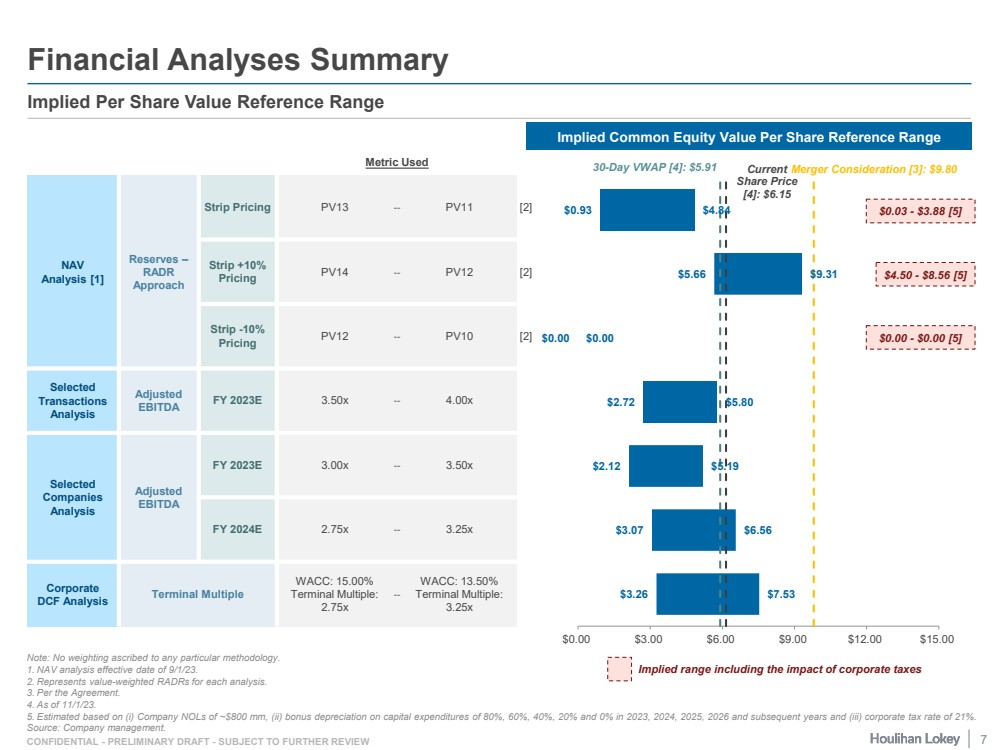
| CONFIDENTIAL - PRELIMINARY DRAFT - SUBJECT TO FURTHER REVIEW Note: No weighting ascribed to any particular methodology. 1. NAV analysis effective date of 9/1/23. 2. Represents value-weighted RADRs for each analysis. 3. Per the Agreement. 4. As of 11/1/23. 5. Estimated based on (i) Company NOLs of ~$800 mm, (ii) bonus depreciation on capital expenditures of 80%, 60%, 40%, 20% and 0% in 2023, 2024, 2025, 2026 and subsequent years and (iii) corporate tax rate of 21%. Source: Company management. Financial Analyses Summary Implied Per Share Value Reference Range Metric Used NAV Analysis [1] Reserves – RADR Approach Strip Pricing PV13 -- PV11 [2] Strip +10% Pricing PV14 -- PV12 [2] Strip -10% Pricing PV12 -- PV10 [2] Selected Transactions Analysis Adjusted EBITDA FY 2023E 3.50x -- 4.00x Selected Companies Analysis Adjusted EBITDA FY 2023E 3.00x -- 3.50x FY 2024E 2.75x -- 3.25x Corporate DCF Analysis Terminal Multiple WACC: 15.00% Terminal Multiple: 2.75x -- WACC: 13.50% Terminal Multiple: 3.25x Implied Common Equity Value Per Share Reference Range $4.50 - $8.56 [5] $0.03 - $3.88 [5] $0.00 - $0.00 [5] Implied range including the impact of corporate taxes $3.26 $3.07 $2.12 $2.72 $0.00 $5.66 $0.93 $7.53 $6.56 $5.19 $5.80 $0.00 $9.31 $4.84 Current Merger Consideration [3]: $9.80 Share Price [4]: $6.15 30-Day VWAP [4]: $5.91 $0.00 $3.00 $6.00 $9.00 $12.00 $15.00 7 |
| Page 1. Executive Summary 3 2. Financial Analyses 8 3. Selected Public Market Observations 29 4. Appendix 34 5. Disclaimer 47 |
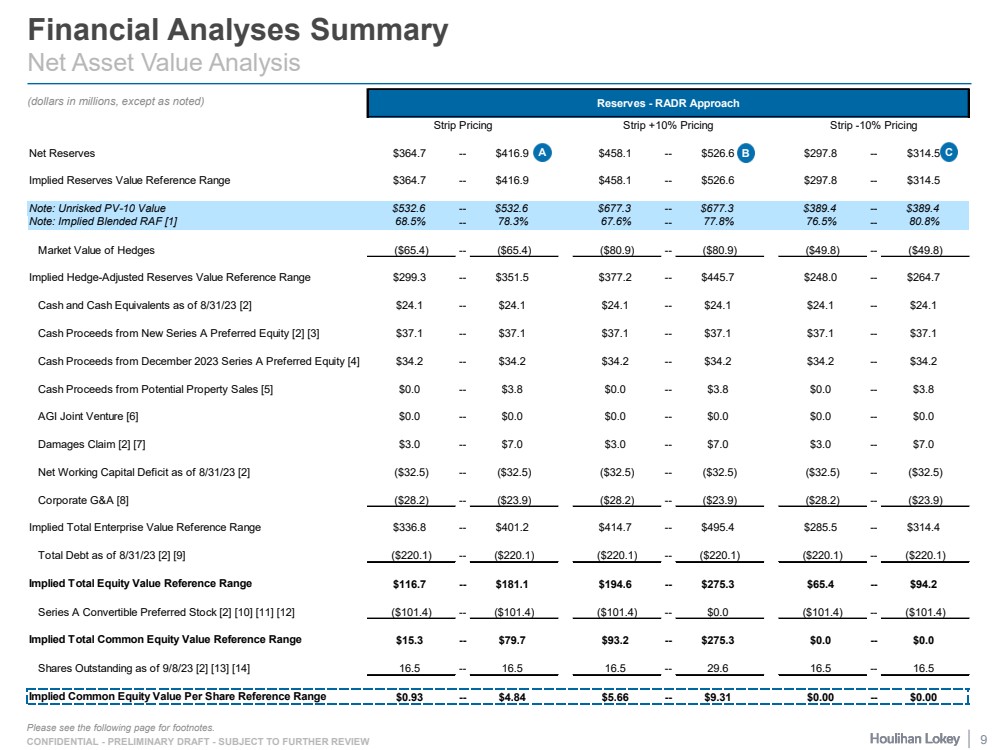
| CONFIDENTIAL - PRELIMINARY DRAFT - SUBJECT TO FURTHER REVIEW Financial Analyses Summary Net Asset Value Analysis Please see the following page for footnotes. (dollars in millions, except as noted) Reserves - RADR Approach Strip Pricing Strip +10% Pricing Strip -10% Pricing Net Reserves $364.7 -- $416.9 $458.1 -- $526.6 $297.8 -- $314.5 Implied Reserves Value Reference Range $364.7 -- $416.9 $458.1 -- $526.6 $297.8 -- $314.5 Note: Unrisked PV-10 Value $532.6 -- $532.6 $677.3 -- $677.3 $389.4 -- $389.4 Note: Implied Blended RAF [1] 68.5% -- 78.3% 67.6% -- 77.8% 76.5% -- 80.8% Market Value of Hedges ($65.4) -- ($65.4) ($80.9) -- ($80.9) ($49.8) -- ($49.8) Implied Hedge-Adjusted Reserves Value Reference Range $299.3 -- $351.5 $377.2 -- $445.7 $248.0 -- $264.7 Cash and Cash Equivalents as of 8/31/23 [2] $24.1 -- $24.1 $24.1 -- $24.1 $24.1 -- $24.1 Cash Proceeds from New Series A Preferred Equity [2] [3] $37.1 -- $37.1 $37.1 -- $37.1 $37.1 -- $37.1 Cash Proceeds from December 2023 Series A Preferred Equity [4] $34.2 -- $34.2 $34.2 -- $34.2 $34.2 -- $34.2 Cash Proceeds from Potential Property Sales [5] $0.0 -- $3.8 $0.0 -- $3.8 $0.0 -- $3.8 AGI Joint Venture [6] $0.0 -- $0.0 $0.0 -- $0.0 $0.0 -- $0.0 Damages Claim [2] [7] $3.0 -- $7.0 $3.0 -- $7.0 $3.0 -- $7.0 Net Working Capital Deficit as of 8/31/23 [2] ($32.5) -- ($32.5) ($32.5) -- ($32.5) ($32.5) -- ($32.5) Corporate G&A [8] ($28.2) -- ($23.9) ($28.2) -- ($23.9) ($28.2) -- ($23.9) Implied Total Enterprise Value Reference Range $336.8 -- $401.2 $414.7 -- $495.4 $285.5 -- $314.4 Total Debt as of 8/31/23 [2] [9] ($220.1) -- ($220.1) ($220.1) -- ($220.1) ($220.1) -- ($220.1) Implied Total Equity Value Reference Range $116.7 -- $181.1 $194.6 -- $275.3 $65.4 -- $94.2 Series A Convertible Preferred Stock [2] [10] [11] [12] ($101.4) -- ($101.4) ($101.4) -- $0.0 ($101.4) -- ($101.4) Implied Total Common Equity Value Reference Range $15.3 -- $79.7 $93.2 -- $275.3 $0.0 -- $0.0 Shares Outstanding as of 9/8/23 [2] [13] [14] 16.5 -- 16.5 16.5 -- 29.6 16.5 -- 16.5 Implied Common Equity Value Per Share Reference Range $0.93 -- $4.84 $5.66 -- $9.31 $0.00 -- $0.00 A B C 9 |
| CONFIDENTIAL - PRELIMINARY DRAFT - SUBJECT TO FURTHER REVIEW Financial Analyses Summary Net Asset Value Analysis (cont.) 1.Represents value-weighted RAFs for each analysis as applicable. 2.Per Company management. 3.Reflects cash proceeds from Incremental Series A Preferred convertible equity issued by the Company on 9/6/23, net of 2.4% OID and other issuance expenses. 4.Reflects cash proceeds from Incremental Series A convertible equity to be issued by the Company in December 2023, net of 2.4% OID and other issuance expenses, per Company management. 5.Reflects cash proceeds from potential sale of certain mineral rights which may be effectuated in December 2023, estimated at $0.0 and $3.8 mm on the low end and high end, respectively, per Company management. 6.Economic benefit of Company's 5% interest in AGI Joint Venture reflected in reserve cash flows as an offset to certain expenses. 7.Estimated damages claim due to delay in commencement of operations of the AGI Joint Venture, per Company management. 8.2024E G&A capitalized at 3.25x at the low end and 2.75x at the high end. 9.Consists of term loan of $220 mm and other debt of $0.1 mm. 10.Series A convertible equity issued prior to 9/6/23 converts into ~3.0 mm shares based on a liquidation preference of $27.5 mm and conversion price of $9.03 per share, as of 11/2/23. 11.Includes Incremental Series A convertible equity issued by the Company on 9/6/23, which converts into ~5.1 mm shares based on a liquidation preference of $38.9 mm and conversion price of $7.63 per share. 12.Includes Series A convertible equity to be issued by the Company in December 2023, which converts into ~5.2 mm shares based on a liquidation preference of $35.0 mm and conversion price of $7.05 per share, based on an 18% premium to the 20-day VWAP as of 11/1/23. 13.Includes 16.3 million common shares outstanding and 109,373 RSUs that are vested. Excludes performance shares that vest under change of control. 14.The Company has 478,152 options outstanding (three equal tranches at exercise prices of $18.91, $28.23 and $37.83). Source: Company management. 10 |
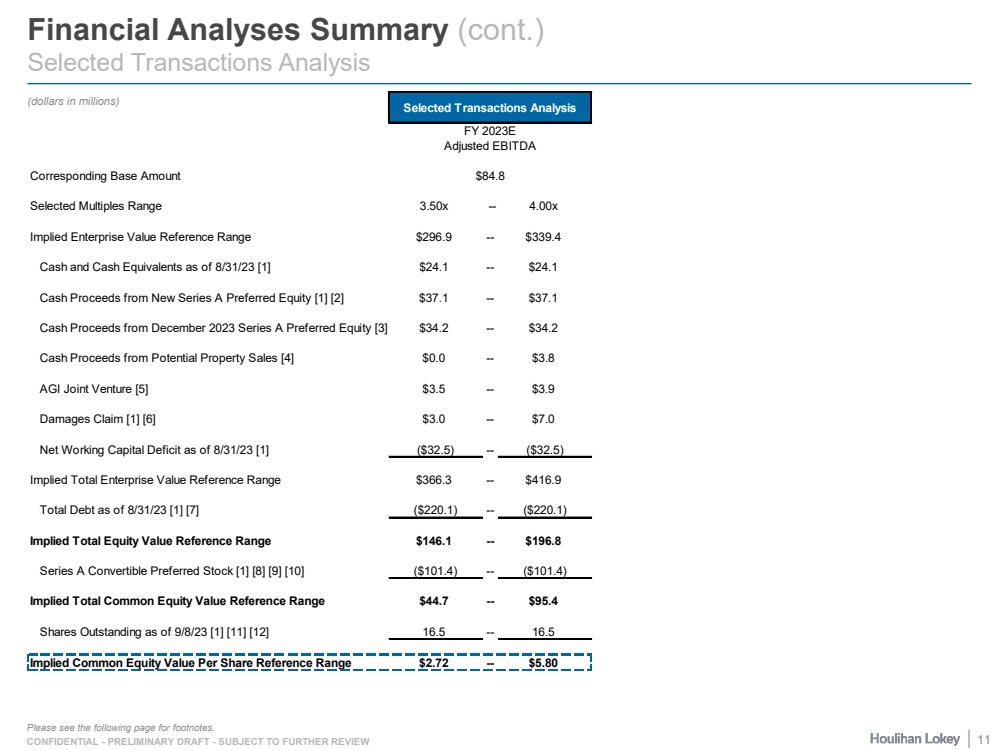
| CONFIDENTIAL - PRELIMINARY DRAFT - SUBJECT TO FURTHER REVIEW Financial Analyses Summary (cont.) Selected Transactions Analysis (dollars in millions) Please see the following page for footnotes. Selected Transactions Analysis FY 2023E Adjusted EBITDA Corresponding Base Amount $84.8 Selected Multiples Range 3.50x -- 4.00x Implied Enterprise Value Reference Range $296.9 -- $339.4 Cash and Cash Equivalents as of 8/31/23 [1] $24.1 -- $24.1 Cash Proceeds from New Series A Preferred Equity [1] [2] $37.1 -- $37.1 Cash Proceeds from December 2023 Series A Preferred Equity [3] $34.2 -- $34.2 Cash Proceeds from Potential Property Sales [4] $0.0 -- $3.8 AGI Joint Venture [5] $3.5 -- $3.9 Damages Claim [1] [6] $3.0 -- $7.0 Net Working Capital Deficit as of 8/31/23 [1] ($32.5) -- ($32.5) Implied Total Enterprise Value Reference Range $366.3 -- $416.9 Total Debt as of 8/31/23 [1] [7] ($220.1) -- ($220.1) Implied Total Equity Value Reference Range $146.1 -- $196.8 Series A Convertible Preferred Stock [1] [8] [9] [10] ($101.4) -- ($101.4) Implied Total Common Equity Value Reference Range $44.7 -- $95.4 Shares Outstanding as of 9/8/23 [1] [11] [12] 16.5 -- 16.5 Implied Common Equity Value Per Share Reference Range $2.72 -- $5.80 11 |
| CONFIDENTIAL - PRELIMINARY DRAFT - SUBJECT TO FURTHER REVIEW Financial Analyses Summary (cont.) Selected Transactions Analysis (cont.) 1.Per Company management. 2.Reflects cash proceeds from Incremental Series A Preferred convertible equity issued by the Company on 9/6/23, net of 2.4% OID and other issuance expenses. 3.Reflects cash proceeds from Incremental Series A convertible equity to be issued by the Company in December 2023, net of 2.4% OID and other issuance expenses, per Company management. 4.Reflects cash proceeds from potential sale of certain mineral rights which may be effectuated in December 2023, estimated at $0.0 and $3.8 mm on the low end and high end, respectively, per Company management. 5.See page 45 for details. 6.Estimated damages claim due to delay in commencement of operations of the AGI Joint Venture, per Company management. 7.Consists of term loan of $220 mm and other debt of $0.1 mm. 8.Series A convertible equity issued prior to 9/6/23 converts into ~3.0 mm shares based on a liquidation preference of $27.5 mm and conversion price of $9.03 per share, as of 11/2/23. 9.Includes Incremental Series A convertible equity issued by the Company on 9/6/23, which converts into ~5.1 mm shares based on a liquidation preference of $38.9 mm and conversion price of $7.63 per share. 10.Includes Series A convertible equity to be issued by the Company in December 2023, which converts into ~5.2 mm shares based on a liquidation preference of $35.0 mm and conversion price of $7.05 per share, based on an 18% premium to the 20-day VWAP as of 11/1/23. 11.Includes 16.3 million common shares outstanding and 109,373 RSUs that are vested. Excludes performance shares that vest under change of control. 12.The Company has 478,152 options outstanding (three equal tranches at exercise prices of $18.91, $28.23 and $37.83). Source: Company management. 12 |
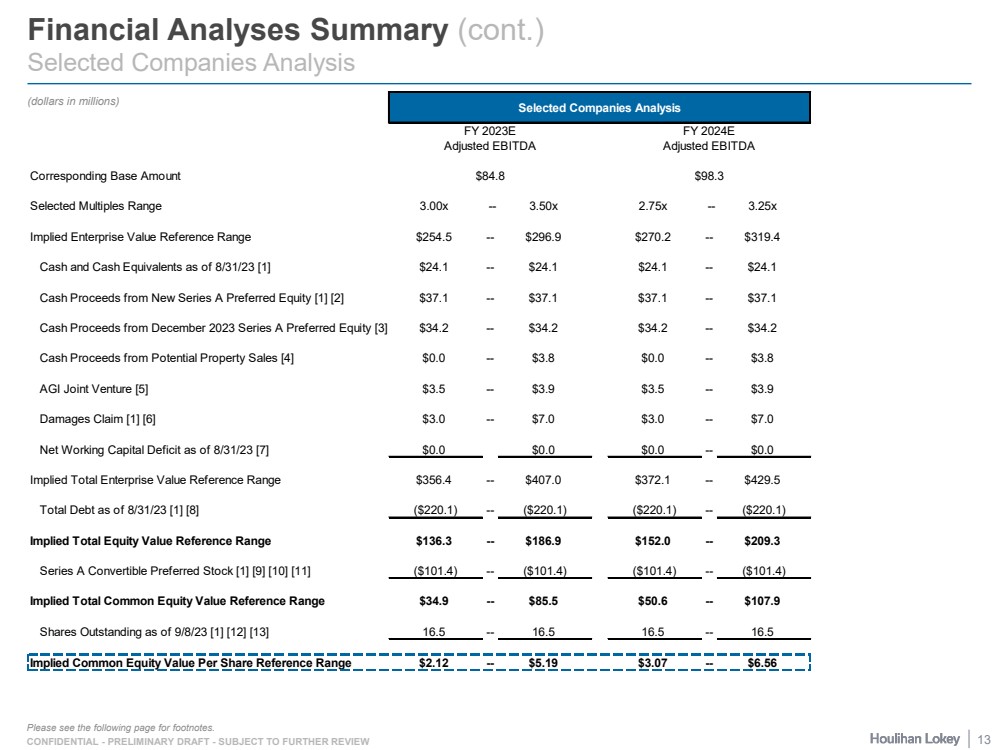
| CONFIDENTIAL - PRELIMINARY DRAFT - SUBJECT TO FURTHER REVIEW Financial Analyses Summary (cont.) Selected Companies Analysis (dollars in millions) Please see the following page for footnotes. Selected Companies Analysis FY 2023E FY 2024E Adjusted EBITDA Adjusted EBITDA Corresponding Base Amount $84.8 $98.3 Selected Multiples Range 3.00x -- 3.50x 2.75x -- 3.25x Implied Enterprise Value Reference Range $254.5 -- $296.9 $270.2 -- $319.4 Cash and Cash Equivalents as of 8/31/23 [1] $24.1 -- $24.1 $24.1 -- $24.1 Cash Proceeds from New Series A Preferred Equity [1] [2] $37.1 -- $37.1 $37.1 -- $37.1 Cash Proceeds from December 2023 Series A Preferred Equity [3] $34.2 -- $34.2 $34.2 -- $34.2 Cash Proceeds from Potential Property Sales [4] $0.0 -- $3.8 $0.0 -- $3.8 AGI Joint Venture [5] $3.5 -- $3.9 $3.5 -- $3.9 Damages Claim [1] [6] $3.0 -- $7.0 $3.0 -- $7.0 Net Working Capital Deficit as of 8/31/23 [7] $0.0 $0.0 $0.0 -- $0.0 Implied Total Enterprise Value Reference Range $356.4 -- $407.0 $372.1 -- $429.5 Total Debt as of 8/31/23 [1] [8] ($220.1) -- ($220.1) ($220.1) -- ($220.1) Implied Total Equity Value Reference Range $136.3 -- $186.9 $152.0 -- $209.3 Series A Convertible Preferred Stock [1] [9] [10] [11] ($101.4) -- ($101.4) ($101.4) -- ($101.4) Implied Total Common Equity Value Reference Range $34.9 -- $85.5 $50.6 -- $107.9 Shares Outstanding as of 9/8/23 [1] [12] [13] 16.5 -- 16.5 16.5 -- 16.5 Implied Common Equity Value Per Share Reference Range $2.12 -- $5.19 $3.07 -- $6.56 13 |
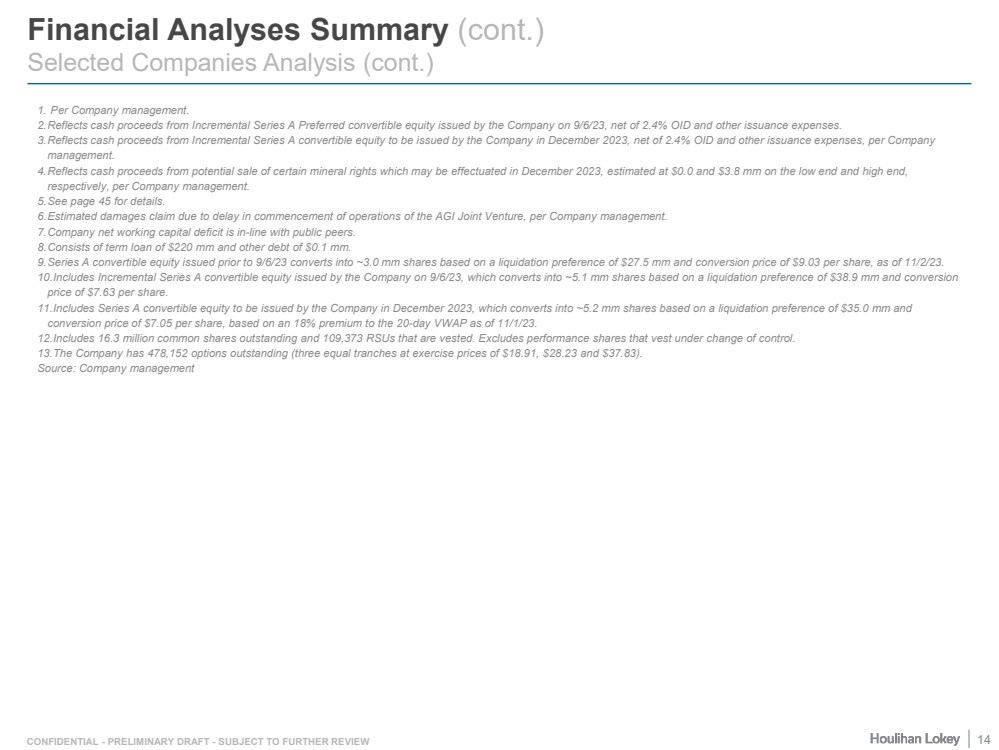
| CONFIDENTIAL - PRELIMINARY DRAFT - SUBJECT TO FURTHER REVIEW Financial Analyses Summary (cont.) Selected Companies Analysis (cont.) 1. Per Company management. 2.Reflects cash proceeds from Incremental Series A Preferred convertible equity issued by the Company on 9/6/23, net of 2.4% OID and other issuance expenses. 3.Reflects cash proceeds from Incremental Series A convertible equity to be issued by the Company in December 2023, net of 2.4% OID and other issuance expenses, per Company management. 4.Reflects cash proceeds from potential sale of certain mineral rights which may be effectuated in December 2023, estimated at $0.0 and $3.8 mm on the low end and high end, respectively, per Company management. 5.See page 45 for details. 6.Estimated damages claim due to delay in commencement of operations of the AGI Joint Venture, per Company management. 7.Company net working capital deficit is in-line with public peers. 8.Consists of term loan of $220 mm and other debt of $0.1 mm. 9.Series A convertible equity issued prior to 9/6/23 converts into ~3.0 mm shares based on a liquidation preference of $27.5 mm and conversion price of $9.03 per share, as of 11/2/23. 10.Includes Incremental Series A convertible equity issued by the Company on 9/6/23, which converts into ~5.1 mm shares based on a liquidation preference of $38.9 mm and conversion price of $7.63 per share. 11.Includes Series A convertible equity to be issued by the Company in December 2023, which converts into ~5.2 mm shares based on a liquidation preference of $35.0 mm and conversion price of $7.05 per share, based on an 18% premium to the 20-day VWAP as of 11/1/23. 12.Includes 16.3 million common shares outstanding and 109,373 RSUs that are vested. Excludes performance shares that vest under change of control. 13.The Company has 478,152 options outstanding (three equal tranches at exercise prices of $18.91, $28.23 and $37.83). Source: Company management 14 |
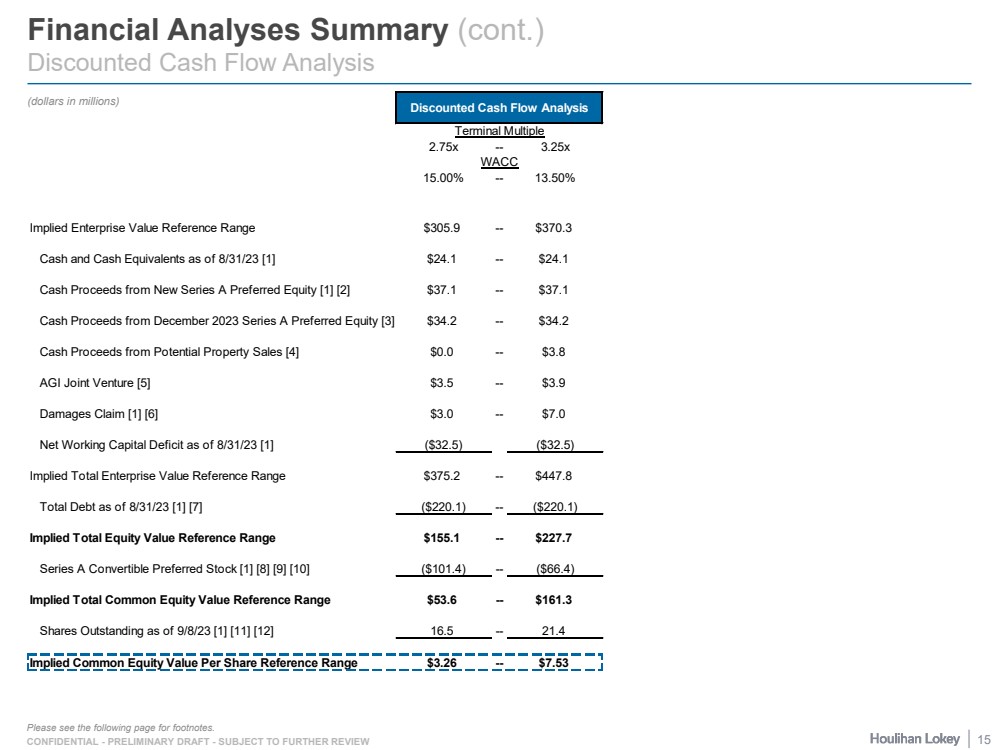
| CONFIDENTIAL - PRELIMINARY DRAFT - SUBJECT TO FURTHER REVIEW Financial Analyses Summary (cont.) Discounted Cash Flow Analysis (dollars in millions) Please see the following page for footnotes. Discounted Cash Flow Analysis Terminal Multiple 2.75x -- 3.25x WACC 15.00% -- 13.50% Implied Enterprise Value Reference Range $305.9 -- $370.3 Cash and Cash Equivalents as of 8/31/23 [1] $24.1 -- $24.1 Cash Proceeds from New Series A Preferred Equity [1] [2] $37.1 -- $37.1 Cash Proceeds from December 2023 Series A Preferred Equity [3] $34.2 -- $34.2 Cash Proceeds from Potential Property Sales [4] $0.0 -- $3.8 AGI Joint Venture [5] $3.5 -- $3.9 Damages Claim [1] [6] $3.0 -- $7.0 Net Working Capital Deficit as of 8/31/23 [1] ($32.5) ($32.5) Implied Total Enterprise Value Reference Range $375.2 -- $447.8 Total Debt as of 8/31/23 [1] [7] ($220.1) -- ($220.1) Implied Total Equity Value Reference Range $155.1 -- $227.7 Series A Convertible Preferred Stock [1] [8] [9] [10] ($101.4) -- ($66.4) Implied Total Common Equity Value Reference Range $53.6 -- $161.3 Shares Outstanding as of 9/8/23 [1] [11] [12] 16.5 -- 21.4 Implied Common Equity Value Per Share Reference Range $3.26 -- $7.53 15 |
| CONFIDENTIAL - PRELIMINARY DRAFT - SUBJECT TO FURTHER REVIEW Financial Analyses Summary (cont.) Discounted Cash Flow Analysis (cont.) 1.Per Company management. 2.Reflects cash proceeds from Incremental Series A Preferred convertible equity issued by the Company on 9/6/23, net of 2.4% OID and other issuance expenses. 3.Reflects cash proceeds from Incremental Series A convertible equity to be issued by the Company in December 2023, net of 2.4% OID and other issuance expenses, per Company management. 4.Reflects cash proceeds from potential sale of certain mineral rights which may be effectuated in December 2023, estimated at $0.0 and $3.8 mm on the low end and high end, respectively, per Company management. 5.See page 45 for details. 6.Estimated damages claim due to delay in commencement of operations of the AGI Joint Venture, per Company management. 7.Consists of term loan of $220 mm and other debt of $0.1 mm. 8.Series A convertible equity issued prior to 9/6/23 converts into ~3.0 mm shares based on a liquidation preference of $27.5 mm and conversion price of $9.03 per share, as of 11/2/23. 9.Includes Incremental Series A convertible equity issued by the Company on 9/6/23, which converts into ~5.1 mm shares based on a liquidation preference of $38.9 mm and conversion price of $7.63 per share. 10.Includes Series A convertible equity to be issued by the Company in December 2023, which converts into ~5.2 mm shares based on a liquidation preference of $35.0 mm and conversion price of $7.05 per share, based on an 18% premium to the 20-day VWAP as of 11/1/23. 11.Includes 16.3 million common shares outstanding and 109,373 RSUs that are vested. Excludes performance shares that vest under change of control. 12.The Company has 478,152 options outstanding (three equal tranches at exercise prices of $18.91, $28.23 and $37.83). Source: Company management. 16 |
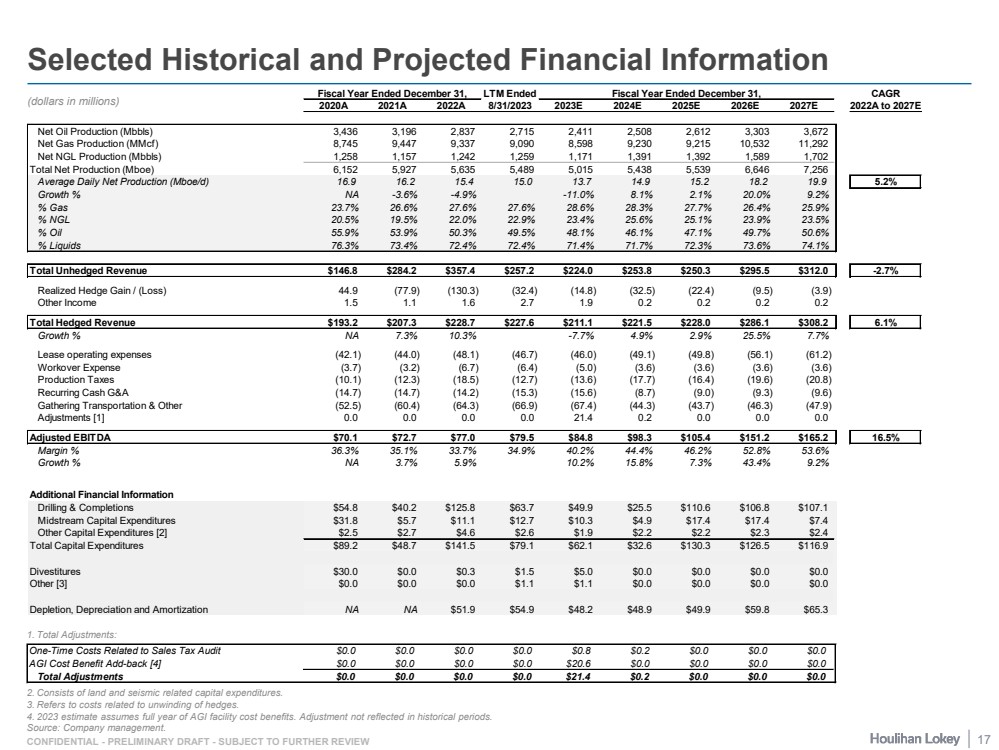
| CONFIDENTIAL - PRELIMINARY DRAFT - SUBJECT TO FURTHER REVIEW Selected Historical and Projected Financial Information 1. Total Adjustments: 2. Consists of land and seismic related capital expenditures. 3. Refers to costs related to unwinding of hedges. 4. 2023 estimate assumes full year of AGI facility cost benefits. Adjustment not reflected in historical periods. Source: Company management. (dollars in millions) One-Time Costs Related to Sales Tax Audit $0.0 $0.0 $0.0 $0.0 $0.8 $0.2 $0.0 $0.0 $0.0 AGI Cost Benefit Add-back [4] $0.0 $0.0 $0.0 $0.0 $20.6 $0.0 $0.0 $0.0 $0.0 Total Adjustments $0.0 $0.0 $0.0 $0.0 $21.4 $0.2 $0.0 $0.0 $0.0 Fiscal Year Ended December 31, LTM Ended Fiscal Year Ended December 31, CAGR 2020A 2021A 2022A 8/31/2023 2023E 2024E 2025E 2026E 2027E 2022A to 2027E Net Oil Production (Mbbls) 3,436 3,196 2,837 2,715 2,411 2,508 2,612 3,303 3,672 Net Gas Production (MMcf) 8,745 9,447 9,337 9,090 8,598 9,230 9,215 10,532 11,292 Net NGL Production (Mbbls) 1,258 1,157 1,242 1,259 1,171 1,391 1,392 1,589 1,702 Total Net Production (Mboe) 6,152 5,927 5,635 5,489 5,015 5,438 5,539 6,646 7,256 Average Daily Net Production (Mboe/d) 16.9 16.2 15.4 15.0 13.7 14.9 15.2 18.2 19.9 5.2% Growth % NA -3.6% -4.9% -11.0% 8.1% 2.1% 20.0% 9.2% % Gas 23.7% 26.6% 27.6% 27.6% 28.6% 28.3% 27.7% 26.4% 25.9% % NGL 20.5% 19.5% 22.0% 22.9% 23.4% 25.6% 25.1% 23.9% 23.5% % Oil 55.9% 53.9% 50.3% 49.5% 48.1% 46.1% 47.1% 49.7% 50.6% % Liquids 76.3% 73.4% 72.4% 72.4% 71.4% 71.7% 72.3% 73.6% 74.1% Total Unhedged Revenue $146.8 $284.2 $357.4 $257.2 $224.0 $253.8 $250.3 $295.5 $312.0 -2.7% Realized Hedge Gain / (Loss) 44.9 (77.9) (130.3) (32.4) (14.8) (32.5) (22.4) (9.5) (3.9) Other Income 1.5 1.1 1.6 2.7 1.9 0.2 0.2 0.2 0.2 Total Hedged Revenue $193.2 $207.3 $228.7 $227.6 $211.1 $221.5 $228.0 $286.1 $308.2 6.1% Growth % NA 7.3% 10.3% -7.7% 4.9% 2.9% 25.5% 7.7% Lease operating expenses (42.1) (44.0) (48.1) (46.7) (46.0) (49.1) (49.8) (56.1) (61.2) Workover Expense (3.7) (3.2) (6.7) (6.4) (5.0) (3.6) (3.6) (3.6) (3.6) Production Taxes (10.1) (12.3) (18.5) (12.7) (13.6) (17.7) (16.4) (19.6) (20.8) Recurring Cash G&A (14.7) (14.7) (14.2) (15.3) (15.6) (8.7) (9.0) (9.3) (9.6) Gathering Transportation & Other (52.5) (60.4) (64.3) (66.9) (67.4) (44.3) (43.7) (46.3) (47.9) Adjustments [1] 0.0 0.0 0.0 0.0 21.4 0.2 0.0 0.0 0.0 Adjusted EBITDA $70.1 $72.7 $77.0 $79.5 $84.8 $98.3 $105.4 $151.2 $165.2 16.5% Margin % 36.3% 35.1% 33.7% 34.9% 40.2% 44.4% 46.2% 52.8% 53.6% Growth % NA 3.7% 5.9% 10.2% 15.8% 7.3% 43.4% 9.2% Additional Financial Information Drilling & Completions $54.8 $40.2 $125.8 $63.7 $49.9 $25.5 $110.6 $106.8 $107.1 Midstream Capital Expenditures $31.8 $5.7 $11.1 $12.7 $10.3 $4.9 $17.4 $17.4 $7.4 Other Capital Expenditures [2] $2.5 $2.7 $4.6 $2.6 $1.9 $2.2 $2.2 $2.3 $2.4 Total Capital Expenditures $89.2 $48.7 $141.5 $79.1 $62.1 $32.6 $130.3 $126.5 $116.9 Divestitures $30.0 $0.0 $0.3 $1.5 $5.0 $0.0 $0.0 $0.0 $0.0 Other [3] $0.0 $0.0 $0.0 $1.1 $1.1 $0.0 $0.0 $0.0 $0.0 Depletion, Depreciation and Amortization NA NA $51.9 $54.9 $48.2 $48.9 $49.9 $59.8 $65.3 17 |
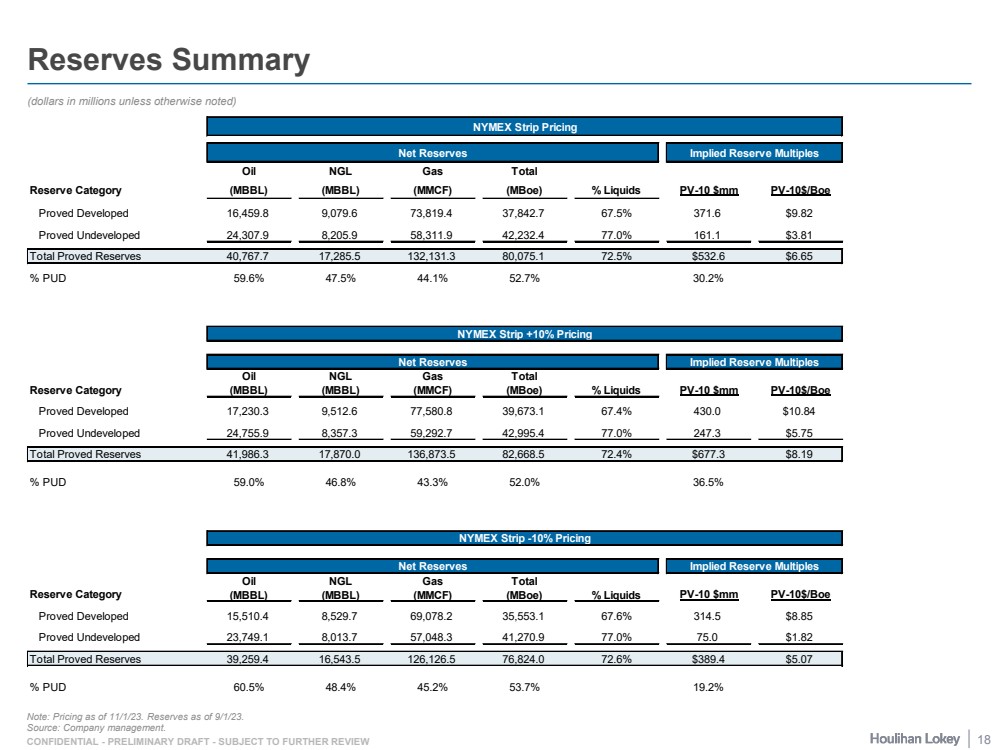
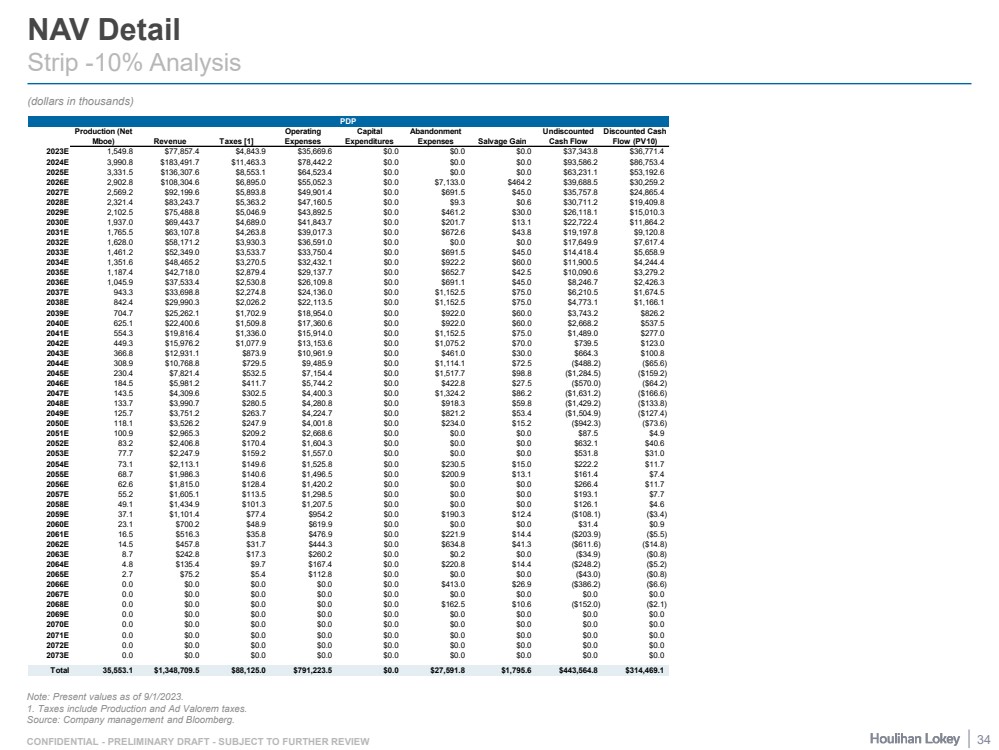
| CONFIDENTIAL - PRELIMINARY DRAFT - SUBJECT TO FURTHER REVIEW Reserves Summary (dollars in millions unless otherwise noted) Note: Pricing as of 11/1/23. Reserves as of 9/1/23. Source: Company management. NYMEX Strip Pricing Net Reserves Implied Reserve Multiples Oil NGL Gas Total Reserve Category (MBBL) (MBBL) (MMCF) (MBoe) % Liquids PV-10 $mm PV-10$/Boe Proved Developed 16,459.8 9,079.6 73,819.4 37,842.7 67.5% 371.6 $9.82 Proved Undeveloped 24,307.9 8,205.9 58,311.9 42,232.4 77.0% 161.1 $3.81 Total Proved Reserves 40,767.7 17,285.5 132,131.3 80,075.1 72.5% $532.6 $6.65 % PUD 59.6% 47.5% 44.1% 52.7% 30.2% NYMEX Strip +10% Pricing Net Reserves Implied Reserve Multiples Oil NGL Gas Total Reserve Category (MBBL) (MBBL) (MMCF) (MBoe) % Liquids PV-10 $mm PV-10$/Boe Proved Developed 17,230.3 9,512.6 77,580.8 39,673.1 67.4% 430.0 $10.84 Proved Undeveloped 24,755.9 8,357.3 59,292.7 42,995.4 77.0% 247.3 $5.75 Total Proved Reserves 41,986.3 17,870.0 136,873.5 82,668.5 72.4% $677.3 $8.19 % PUD 59.0% 46.8% 43.3% 52.0% 36.5% NYMEX Strip -10% Pricing Net Reserves Implied Reserve Multiples Oil NGL Gas Total Reserve Category (MBBL) (MBBL) (MMCF) (MBoe) % Liquids PV-10 $mm PV-10$/Boe Proved Developed 15,510.4 8,529.7 69,078.2 35,553.1 67.6% 314.5 $8.85 Proved Undeveloped 23,749.1 8,013.7 57,048.3 41,270.9 77.0% 75.0 $1.82 Total Proved Reserves 39,259.4 16,543.5 126,126.5 76,824.0 72.6% $389.4 $5.07 % PUD 60.5% 48.4% 45.2% 53.7% 19.2% 18 |
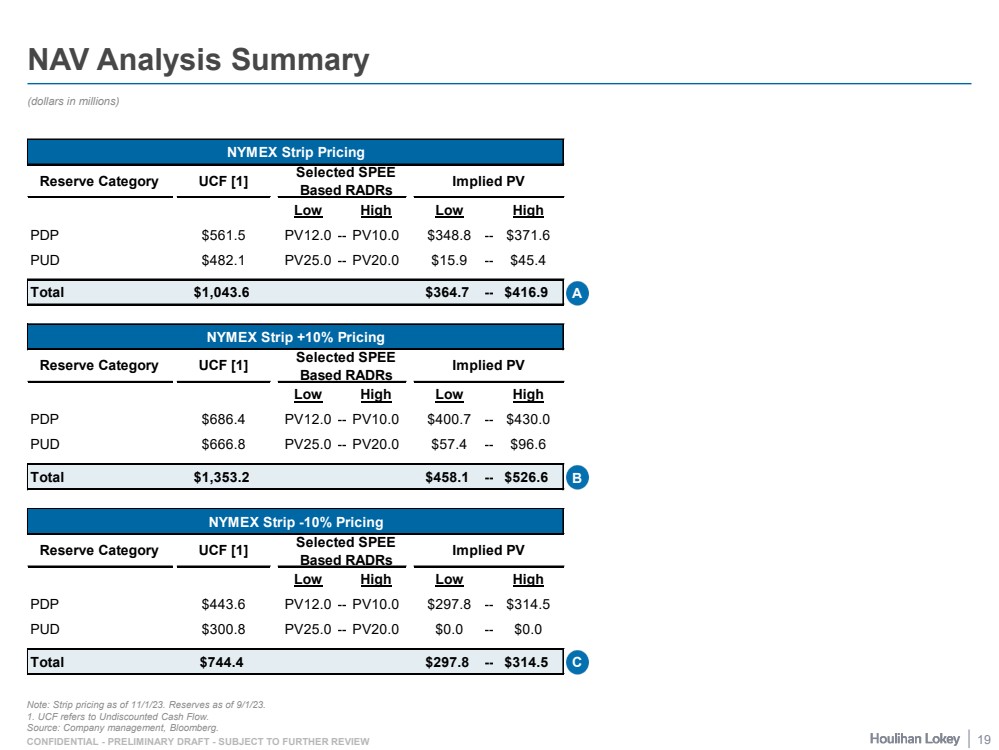
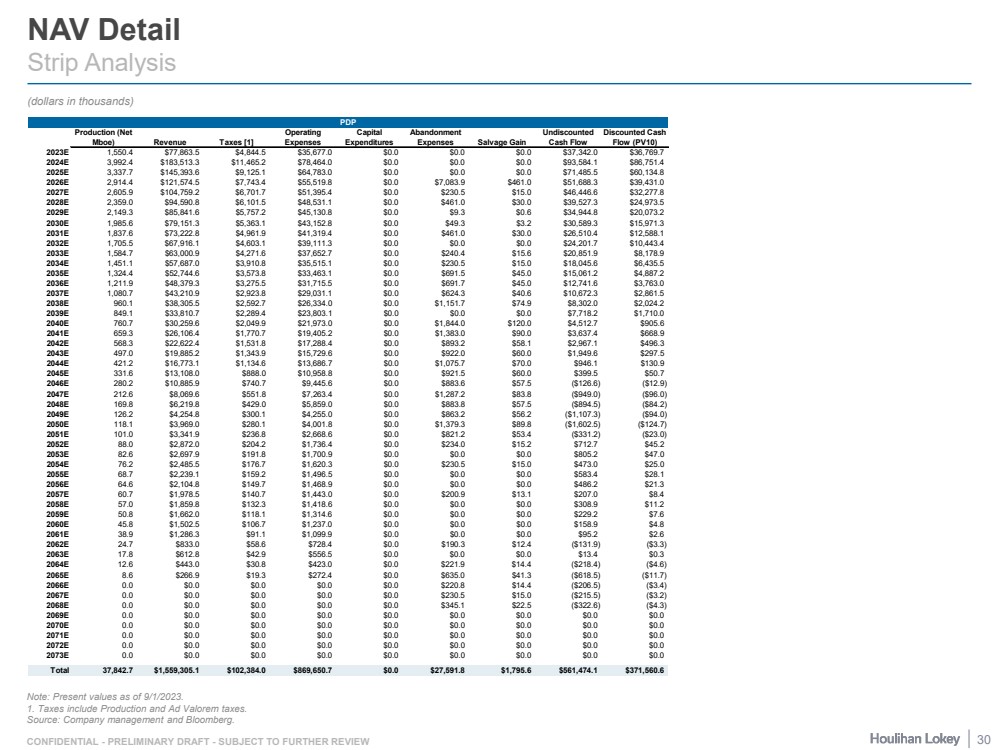
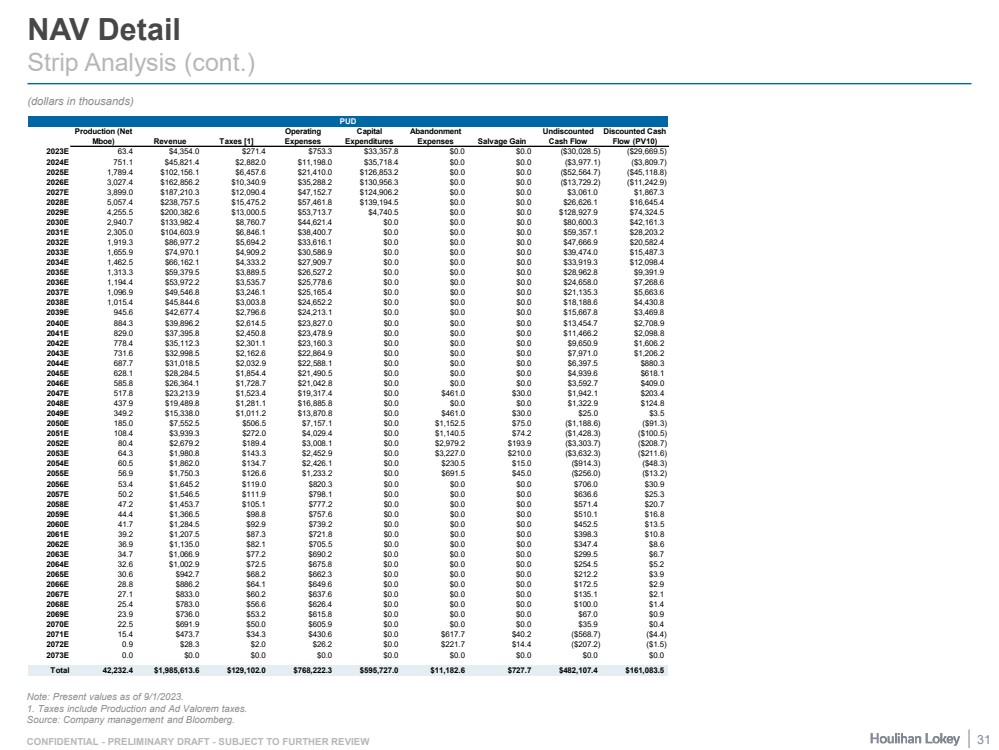
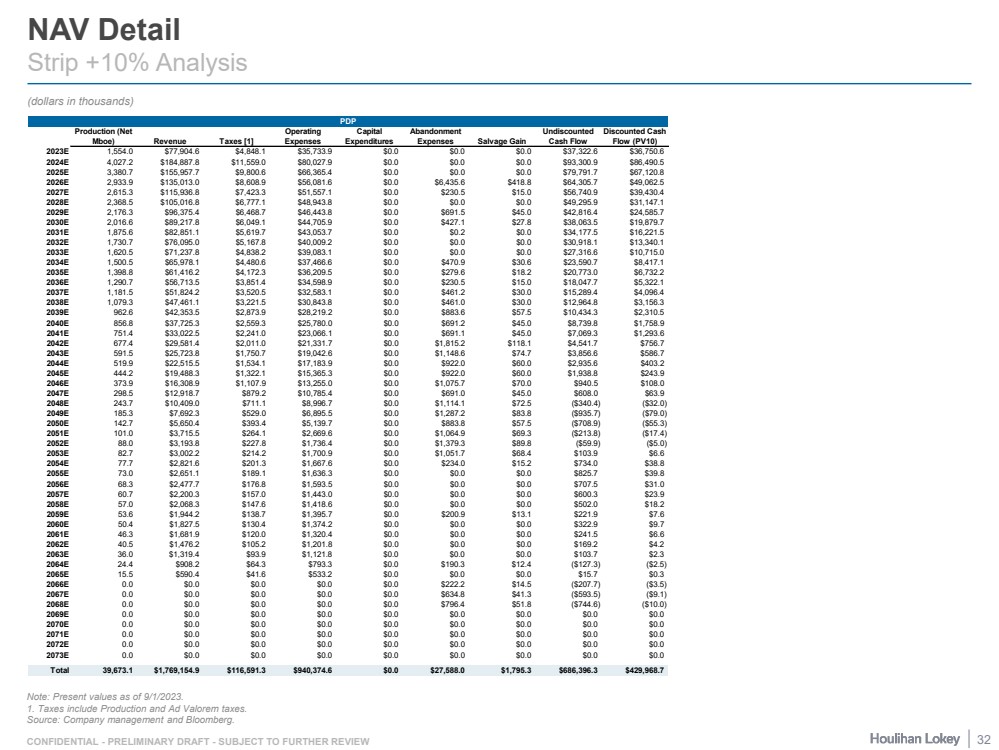
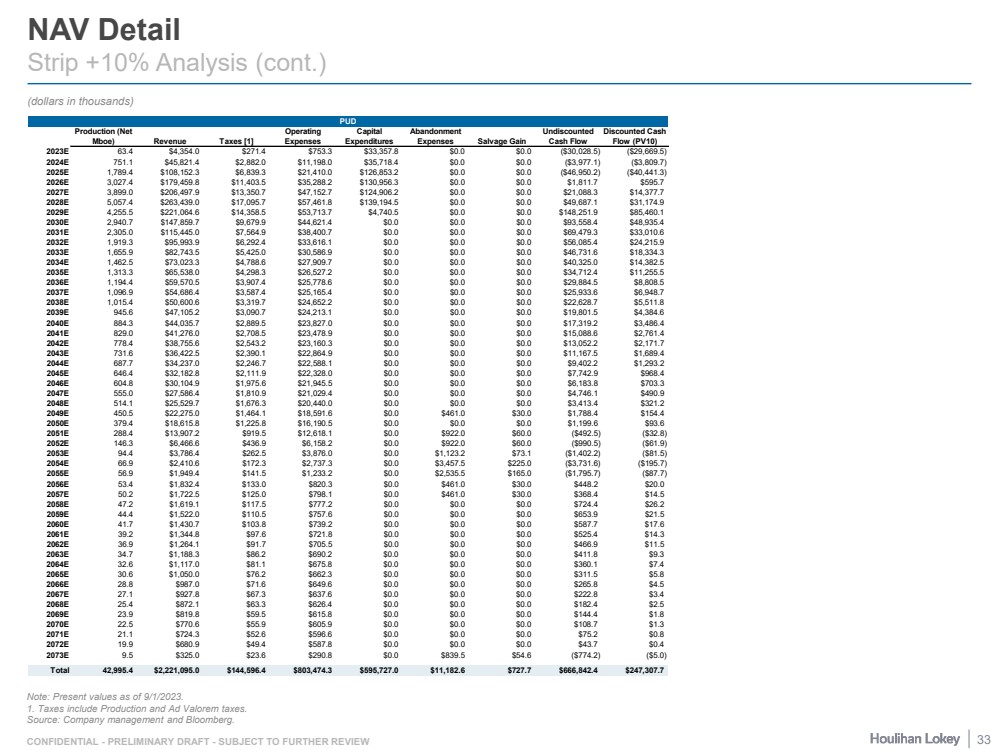
| CONFIDENTIAL - PRELIMINARY DRAFT - SUBJECT TO FURTHER REVIEW NAV Analysis Summary (dollars in millions) Note: Strip pricing as of 11/1/23. Reserves as of 9/1/23. 1. UCF refers to Undiscounted Cash Flow. Source: Company management, Bloomberg. NYMEX Strip Pricing Reserve Category UCF [1] Selected SPEE Based RADRs Implied PV Low High Low High PDP $561.5 PV12.0 -- PV10.0 $348.8 -- $371.6 PUD $482.1 PV25.0 -- PV20.0 $15.9 -- $45.4 Total $1,043.6 $364.7 -- $416.9 A NYMEX Strip +10% Pricing Reserve Category UCF [1] Selected SPEE Based RADRs Implied PV Low High Low High PDP $686.4 PV12.0 -- PV10.0 $400.7 -- $430.0 PUD $666.8 PV25.0 -- PV20.0 $57.4 -- $96.6 Total $1,353.2 $458.1 -- $526.6 B NYMEX Strip -10% Pricing Reserve Category UCF [1] Selected SPEE Based RADRs Implied PV Low High Low High PDP $443.6 PV12.0 -- PV10.0 $297.8 -- $314.5 PUD $300.8 PV25.0 -- PV20.0 $0.0 -- $0.0 Total $744.4 $297.8 -- $314.5 C 19 |
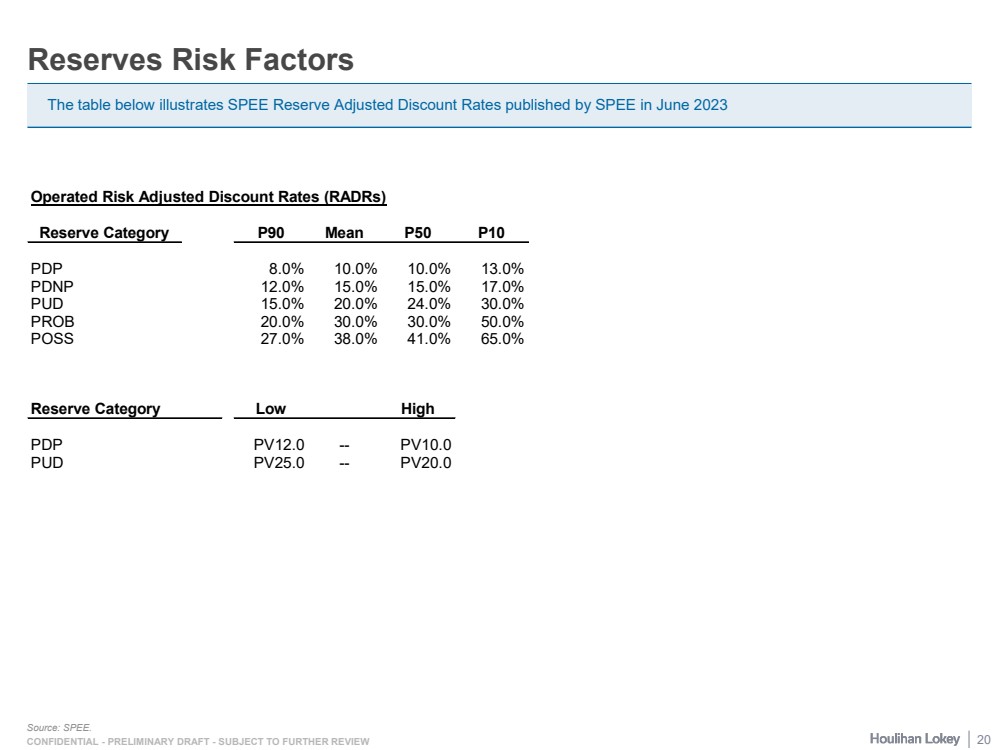
| CONFIDENTIAL - PRELIMINARY DRAFT - SUBJECT TO FURTHER REVIEW Reserves Risk Factors Source: SPEE. The table below illustrates SPEE Reserve Adjusted Discount Rates published by SPEE in June 2023 Operated Risk Adjusted Discount Rates (RADRs) Reserve Category P90 Mean P50 P10 PDP 8.0% 10.0% 10.0% 13.0% PDNP 12.0% 15.0% 15.0% 17.0% PUD 15.0% 20.0% 24.0% 30.0% PROB 20.0% 30.0% 30.0% 50.0% POSS 27.0% 38.0% 41.0% 65.0% Reserve Category Low High PDP PV12.0 -- PV10.0 PUD PV25.0 -- PV20.0 20 |
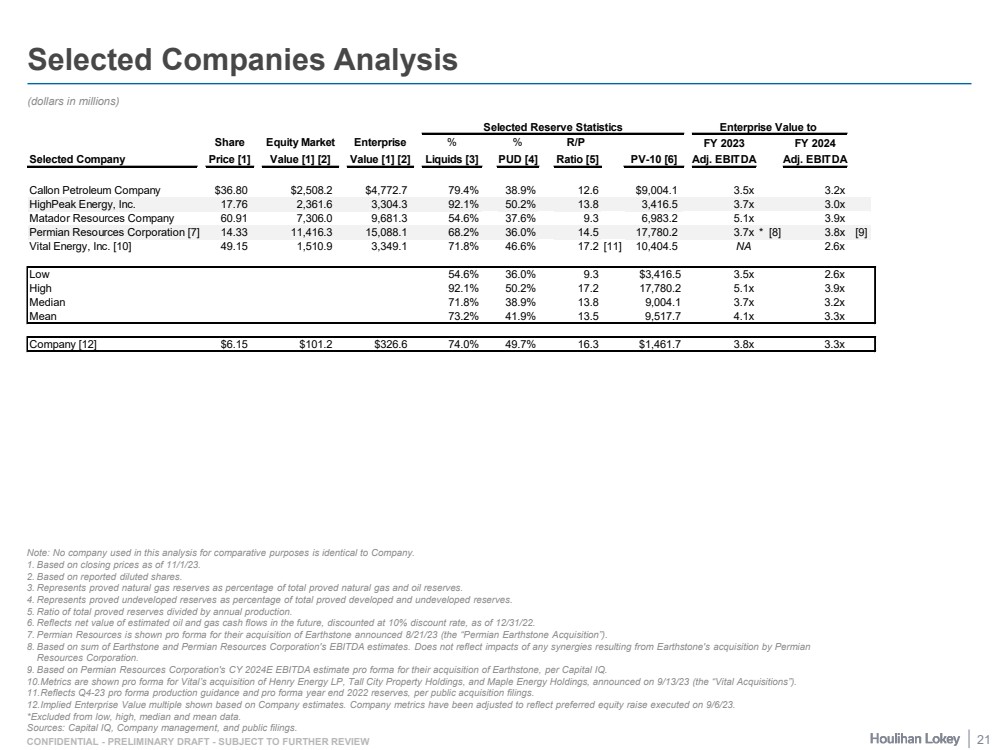
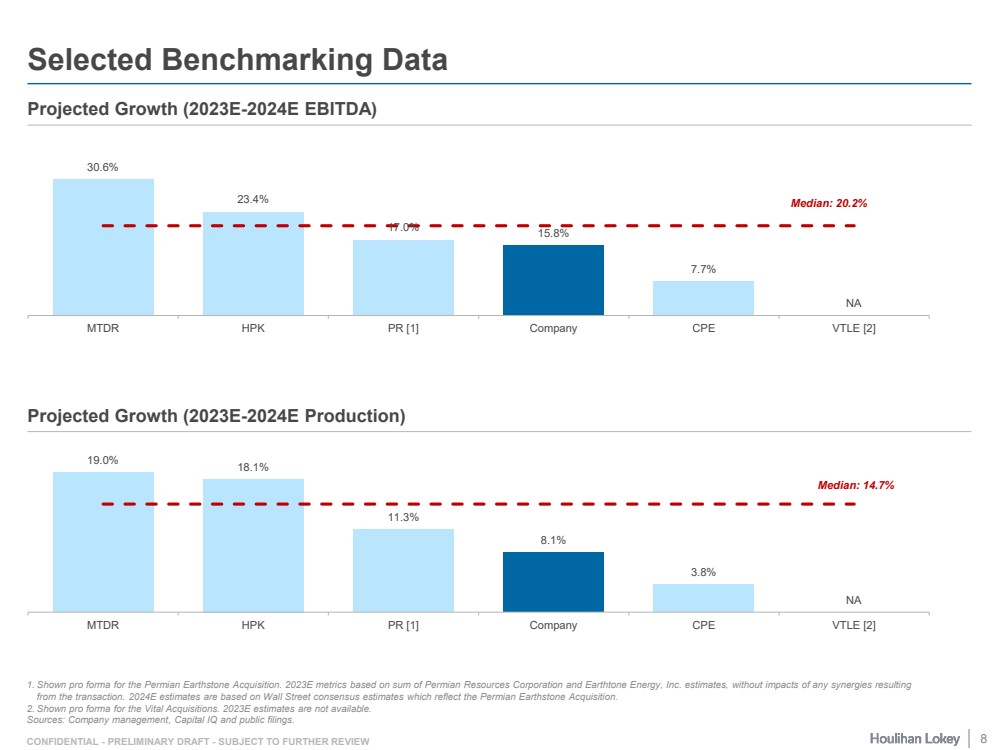
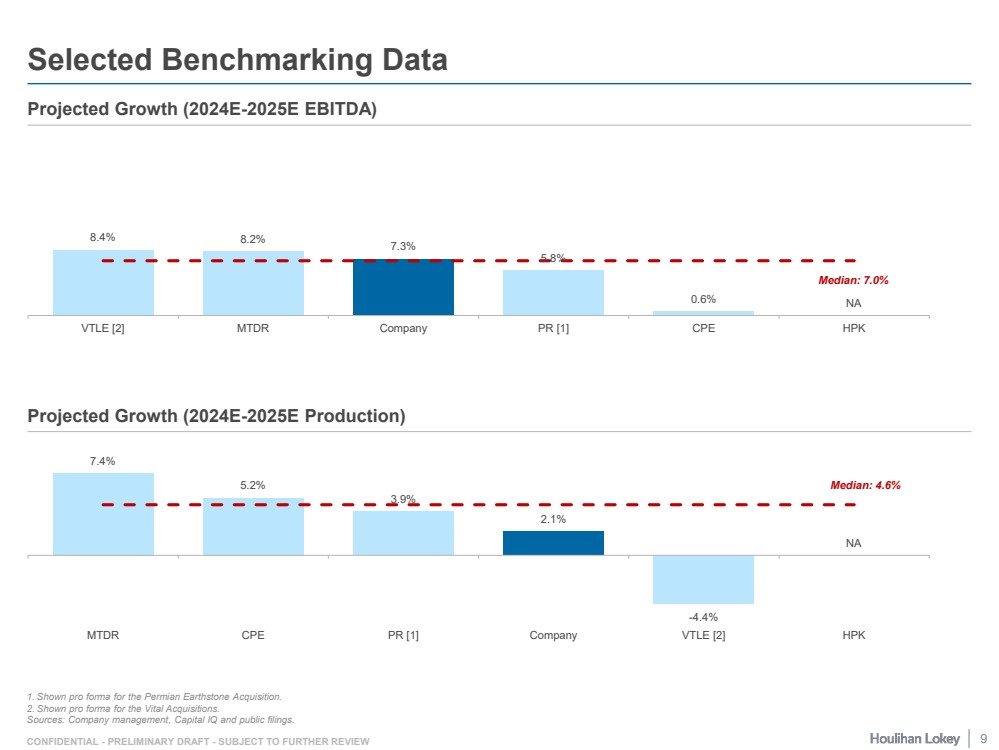
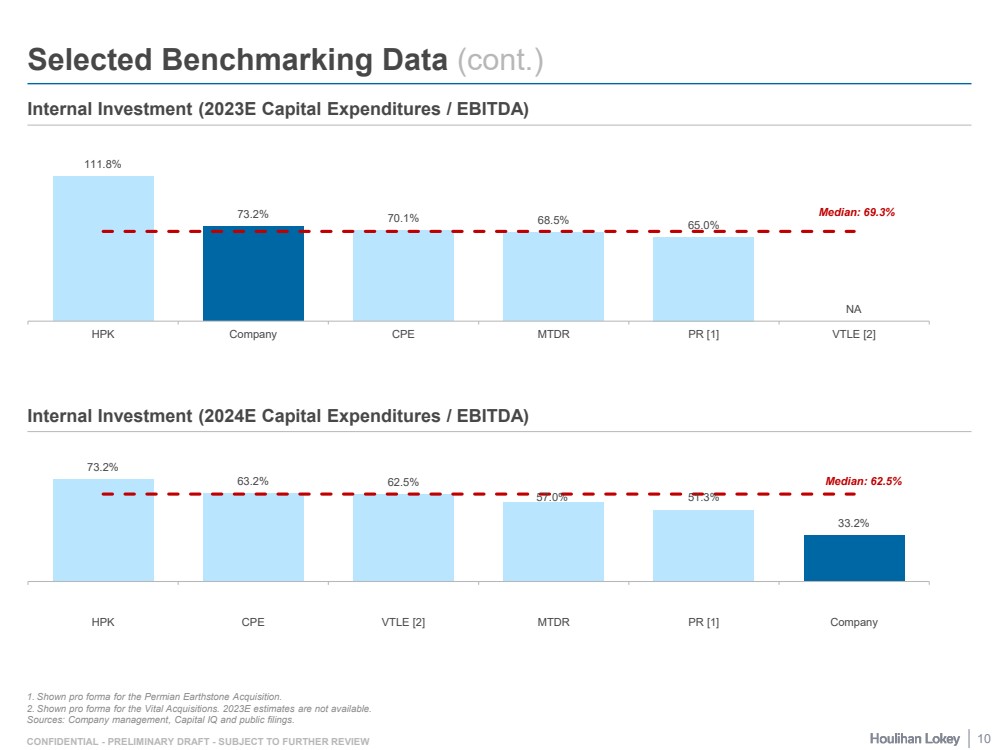
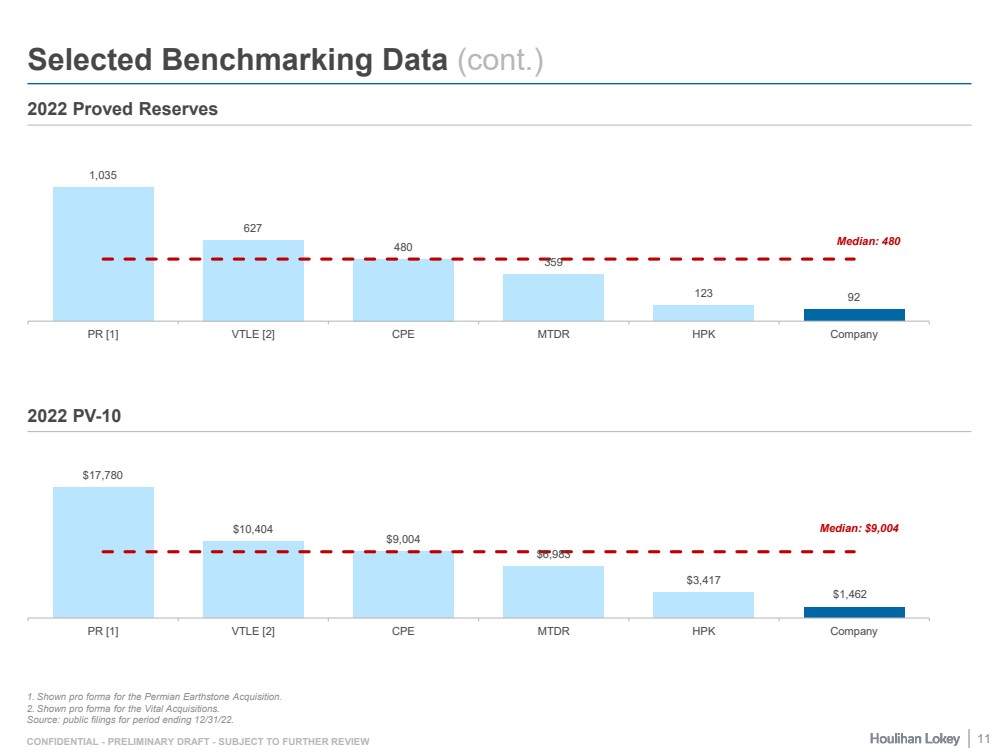
| CONFIDENTIAL - PRELIMINARY DRAFT - SUBJECT TO FURTHER REVIEW Selected Companies Analysis (dollars in millions) Note: No company used in this analysis for comparative purposes is identical to Company. 1. Based on closing prices as of 11/1/23. 2. Based on reported diluted shares. 3. Represents proved natural gas reserves as percentage of total proved natural gas and oil reserves. 4. Represents proved undeveloped reserves as percentage of total proved developed and undeveloped reserves. 5. Ratio of total proved reserves divided by annual production. 6. Reflects net value of estimated oil and gas cash flows in the future, discounted at 10% discount rate, as of 12/31/22. 7. Permian Resources is shown pro forma for their acquisition of Earthstone announced 8/21/23 (the “Permian Earthstone Acquisition”). 8. Based on sum of Earthstone and Permian Resources Corporation's EBITDA estimates. Does not reflect impacts of any synergies resulting from Earthstone's acquisition by Permian Resources Corporation. 9. Based on Permian Resources Corporation's CY 2024E EBITDA estimate pro forma for their acquisition of Earthstone, per Capital IQ. 10.Metrics are shown pro forma for Vital’s acquisition of Henry Energy LP, Tall City Property Holdings, and Maple Energy Holdings, announced on 9/13/23 (the “Vital Acquisitions”). 11.Reflects Q4-23 pro forma production guidance and pro forma year end 2022 reserves, per public acquisition filings. 12.Implied Enterprise Value multiple shown based on Company estimates. Company metrics have been adjusted to reflect preferred equity raise executed on 9/6/23. *Excluded from low, high, median and mean data. Sources: Capital IQ, Company management, and public filings. 21 Selected Reserve Statistics Enterprise Value to Share Equity Market Enterprise % % R/P FY 2023 FY 2024 Selected Company Price [1] Value [1] [2] Value [1] [2] Liquids [3] PUD [4] Ratio [5] PV-10 [6] Adj. EBITDA Adj. EBITDA Callon Petroleum Company $36.80 $2,508.2 $4,772.7 79.4% 38.9% 12.6 $9,004.1 3.5x 3.2x HighPeak Energy, Inc. 17.76 2,361.6 3,304.3 92.1% 50.2% 13.8 3,416.5 3.7x 3.0x Matador Resources Company 60.91 7,306.0 9,681.3 54.6% 37.6% 9.3 6,983.2 5.1x 3.9x Permian Resources Corporation [7] 14.33 11,416.3 15,088.1 68.2% 36.0% 14.5 17,780.2 3.7x * [8] 3.8x [9] Vital Energy, Inc. [10] 49.15 1,510.9 3,349.1 71.8% 46.6% 17.2 [11] 10,404.5 NA 2.6x Low 54.6% 36.0% 9.3 $3,416.5 3.5x 2.6x High 92.1% 50.2% 17.2 17,780.2 5.1x 3.9x Median 71.8% 38.9% 13.8 9,004.1 3.7x 3.2x Mean 73.2% 41.9% 13.5 9,517.7 4.1x 3.3x Company [12] $6.15 $101.2 $326.6 74.0% 49.7% 16.3 $1,461.7 3.8x 3.3x |
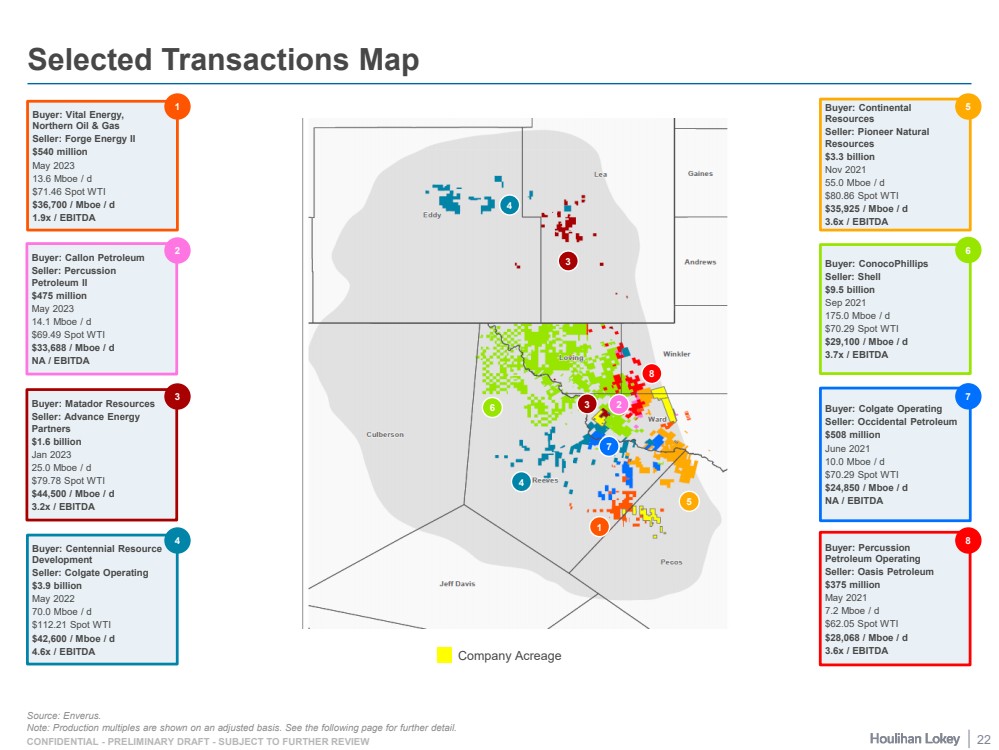
| CONFIDENTIAL - PRELIMINARY DRAFT - SUBJECT TO FURTHER REVIEW Selected Transactions Map Buyer: Continental Resources Seller: Pioneer Natural Resources $3.3 billion Nov 2021 55.0 Mboe / d $80.86 Spot WTI $35,925 / Mboe / d 3.6x / EBITDA 5 Buyer: Matador Resources Seller: Advance Energy Partners $1.6 billion Jan 2023 25.0 Mboe / d $79.78 Spot WTI $44,500 / Mboe / d 3.2x / EBITDA 3 Buyer: Vital Energy, Northern Oil & Gas Seller: Forge Energy II $540 million May 2023 13.6 Mboe / d $71.46 Spot WTI $36,700 / Mboe / d 1.9x / EBITDA 1 Buyer: Centennial Resource Development Seller: Colgate Operating $3.9 billion May 2022 70.0 Mboe / d $112.21 Spot WTI $42,600 / Mboe / d 4.6x / EBITDA 4 Company Acreage 3 5 6 Buyer: Callon Petroleum Seller: Percussion Petroleum II $475 million May 2023 14.1 Mboe / d $69.49 Spot WTI $33,688 / Mboe / d NA / EBITDA 2 Buyer: ConocoPhillips Seller: Shell $9.5 billion Sep 2021 175.0 Mboe / d $70.29 Spot WTI $29,100 / Mboe / d 3.7x / EBITDA 6 Buyer: Percussion Petroleum Operating Seller: Oasis Petroleum $375 million May 2021 7.2 Mboe / d $62.05 Spot WTI $28,068 / Mboe / d 3.6x / EBITDA 8 8 Buyer: Colgate Operating Seller: Occidental Petroleum $508 million June 2021 10.0 Mboe / d $70.29 Spot WTI $24,850 / Mboe / d NA / EBITDA 7 1 Source: Enverus .. Note: Production multiples are shown on an adjusted basis. See the following page for further detail. 2 7 4 3 4 22 |
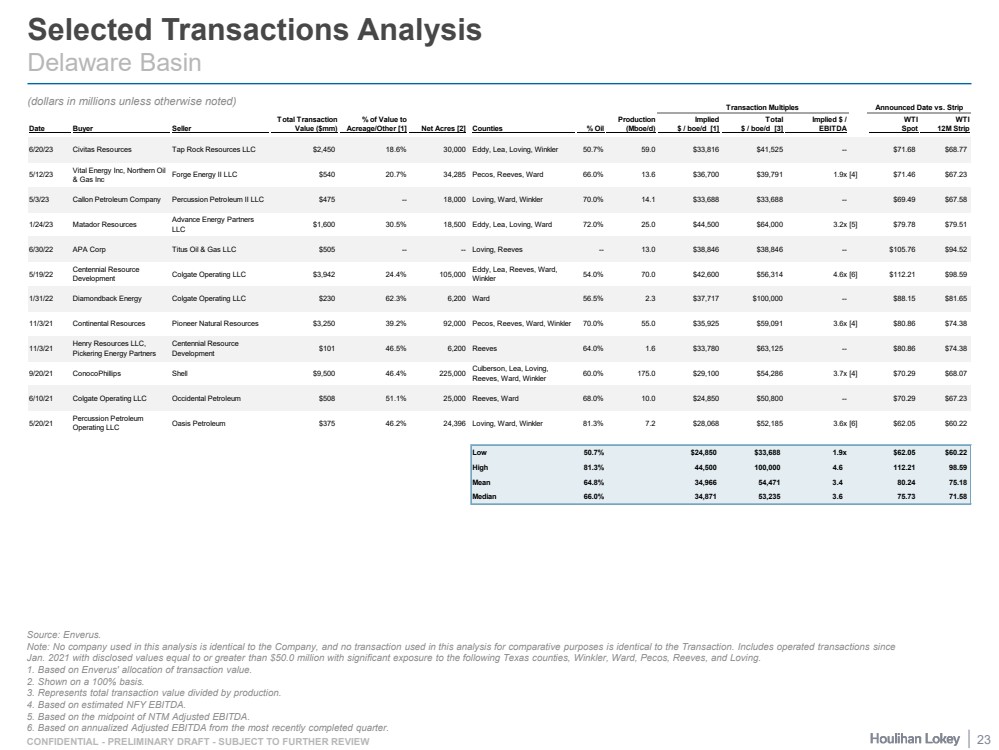
| CONFIDENTIAL - PRELIMINARY DRAFT - SUBJECT TO FURTHER REVIEW Selected Transactions Analysis Delaware Basin Source: Enverus. Note: No company used in this analysis is identical to the Company, and no transaction used in this analysis for comparative purposes is identical to the Transaction. Includes operated transactions since Jan. 2021 with disclosed values equal to or greater than $50.0 million with significant exposure to the following Texas counties, Winkler, Ward, Pecos, Reeves, and Loving. 1. Based on Enverus' allocation of transaction value. 2. Shown on a 100% basis. 3. Represents total transaction value divided by production. 4. Based on estimated NFY EBITDA. 5. Based on the midpoint of NTM Adjusted EBITDA. 6. Based on annualized Adjusted EBITDA from the most recently completed quarter. (dollars in millions unless otherwise noted) Transaction Multiples Announced Date vs. Strip Total Transaction % of Value to Production Implied Total Implied $ / WTI WTI Date Buyer Seller Value ($mm) Acreage/Other [1] Net Acres [2] Counties % Oil (Mboe/d) $ / boe/d [1] $ / boe/d [3] EBITDA Spot 12M Strip 6/20/23 Civitas Resources Tap Rock Resources LLC $2,450 18.6% 30,000 Eddy, Lea, Loving, Winkler 50.7% 59.0 $33,816 $41,525 -- $71.68 $68.77 5/12/23 Vital Energy Inc, Northern Oil & Gas Inc Forge Energy II LLC $540 20.7% 34,285 Pecos, Reeves, Ward 66.0% 13.6 $36,700 $39,791 1.9x [4] $71.46 $67.23 5/3/23 Callon Petroleum Company Percussion Petroleum II LLC $475 -- 18,000 Loving, Ward, Winkler 70.0% 14.1 $33,688 $33,688 -- $69.49 $67.58 1/24/23 Matador Resources Advance Energy Partners LLC $1,600 30.5% 18,500 Eddy, Lea, Loving, Ward 72.0% 25.0 $44,500 $64,000 3.2x [5] $79.78 $79.51 6/30/22 APA Corp Titus Oil & Gas LLC $505 -- -- Loving, Reeves -- 13.0 $38,846 $38,846 -- $105.76 $94.52 5/19/22 Centennial Resource Development Colgate Operating LLC $3,942 24.4% 105,000 Eddy, Lea, Reeves, Ward, Winkler 54.0% 70.0 $42,600 $56,314 4.6x [6] $112.21 $98.59 1/31/22 Diamondback Energy Colgate Operating LLC $230 62.3% 6,200 Ward 56.5% 2.3 $37,717 $100,000 -- $88.15 $81.65 11/3/21 Continental Resources Pioneer Natural Resources $3,250 39.2% 92,000 Pecos, Reeves, Ward, Winkler 70.0% 55.0 $35,925 $59,091 3.6x [4] $80.86 $74.38 11/3/21 Henry Resources LLC, Pickering Energy Partners Centennial Resource Development $101 46.5% 6,200 Reeves 64.0% 1.6 $33,780 $63,125 -- $80.86 $74.38 9/20/21 ConocoPhillips Shell $9,500 46.4% 225,000 Culberson, Lea, Loving, Reeves, Ward, Winkler 60.0% 175.0 $29,100 $54,286 3.7x [4] $70.29 $68.07 6/10/21 Colgate Operating LLC Occidental Petroleum $508 51.1% 25,000 Reeves, Ward 68.0% 10.0 $24,850 $50,800 -- $70.29 $67.23 5/20/21 Percussion Petroleum Operating LLC Oasis Petroleum $375 46.2% 24,396 Loving, Ward, Winkler 81.3% 7.2 $28,068 $52,185 3.6x [6] $62.05 $60.22 Low 50.7% $24,850 $33,688 1.9x $62.05 $60.22 High 81.3% 44,500 100,000 4.6 112.21 98.59 Mean 64.8% 34,966 54,471 3.4 80.24 75.18 Median 66.0% 34,871 53,235 3.6 75.73 71.58 23 |
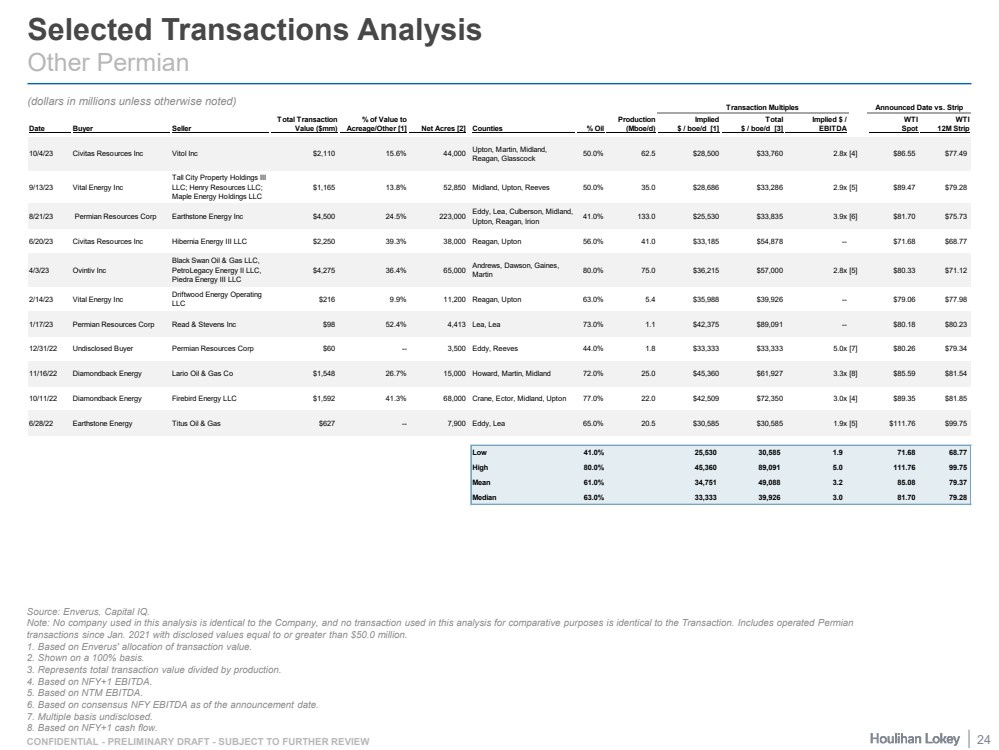
| CONFIDENTIAL - PRELIMINARY DRAFT - SUBJECT TO FURTHER REVIEW Selected Transactions Analysis Other Permian Source: Enverus, Capital IQ. Note: No company used in this analysis is identical to the Company, and no transaction used in this analysis for comparative purposes is identical to the Transaction. Includes operated Permian transactions since Jan. 2021 with disclosed values equal to or greater than $50.0 million. 1. Based on Enverus' allocation of transaction value. 2. Shown on a 100% basis. 3. Represents total transaction value divided by production. 4. Based on NFY+1 EBITDA. 5. Based on NTM EBITDA. 6. Based on consensus NFY EBITDA as of the announcement date. 7. Multiple basis undisclosed. 8. Based on NFY+1 cash flow. (dollars in millions unless otherwise noted) Transaction Multiples Announced Date vs. Strip Total Transaction % of Value to Production Implied Total Implied $ / WTI WTI Date Buyer Seller Value ($mm) Acreage/Other [1] Net Acres [2] Counties % Oil (Mboe/d) $ / boe/d [1] $ / boe/d [3] EBITDA Spot 12M Strip 10/4/23 Civitas Resources Inc Vitol Inc $2,110 15.6% 44,000 Upton, Martin, Midland, Reagan, Glasscock 50.0% 62.5 $28,500 $33,760 2.8x [4] $86.55 $77.49 9/13/23 Vital Energy Inc Tall City Property Holdings III LLC; Henry Resources LLC; Maple Energy Holdings LLC $1,165 13.8% 52,850 Midland, Upton, Reeves 50.0% 35.0 $28,686 $33,286 2.9x [5] $89.47 $79.28 8/21/23 Permian Resources Corp Earthstone Energy Inc $4,500 24.5% 223,000 Eddy, Lea, Culberson, Midland, Upton, Reagan, Irion 41.0% 133.0 $25,530 $33,835 3.9x [6] $81.70 $75.73 6/20/23 Civitas Resources Inc Hibernia Energy III LLC $2,250 39.3% 38,000 Reagan, Upton 56.0% 41.0 $33,185 $54,878 -- $71.68 $68.77 4/3/23 Ovintiv Inc Black Swan Oil & Gas LLC, PetroLegacy Energy II LLC, Piedra Energy III LLC $4,275 36.4% 65,000 Andrews, Dawson, Gaines, Martin 80.0% 75.0 $36,215 $57,000 2.8x [5] $80.33 $71.12 2/14/23 Vital Energy Inc Driftwood Energy Operating LLC $216 9.9% 11,200 Reagan, Upton 63.0% 5.4 $35,988 $39,926 -- $79.06 $77.98 1/17/23 Permian Resources Corp Read & Stevens Inc $98 52.4% 4,413 Lea, Lea 73.0% 1.1 $42,375 $89,091 -- $80.18 $80.23 12/31/22 Undisclosed Buyer Permian Resources Corp $60 -- 3,500 Eddy, Reeves 44.0% 1.8 $33,333 $33,333 5.0x [7] $80.26 $79.34 11/16/22 Diamondback Energy Lario Oil & Gas Co $1,548 26.7% 15,000 Howard, Martin, Midland 72.0% 25.0 $45,360 $61,927 3.3x [8] $85.59 $81.54 10/11/22 Diamondback Energy Firebird Energy LLC $1,592 41.3% 68,000 Crane, Ector, Midland, Upton 77.0% 22.0 $42,509 $72,350 3.0x [4] $89.35 $81.85 6/28/22 Earthstone Energy Titus Oil & Gas $627 -- 7,900 Eddy, Lea 65.0% 20.5 $30,585 $30,585 1.9x [5] $111.76 $99.75 Low 41.0% 25,530 30,585 1.9 71.68 68.77 High 80.0% 45,360 89,091 5.0 111.76 99.75 Mean 61.0% 34,751 49,088 3.2 85.08 79.37 Median 63.0% 33,333 39,926 3.0 81.70 79.28 24 |
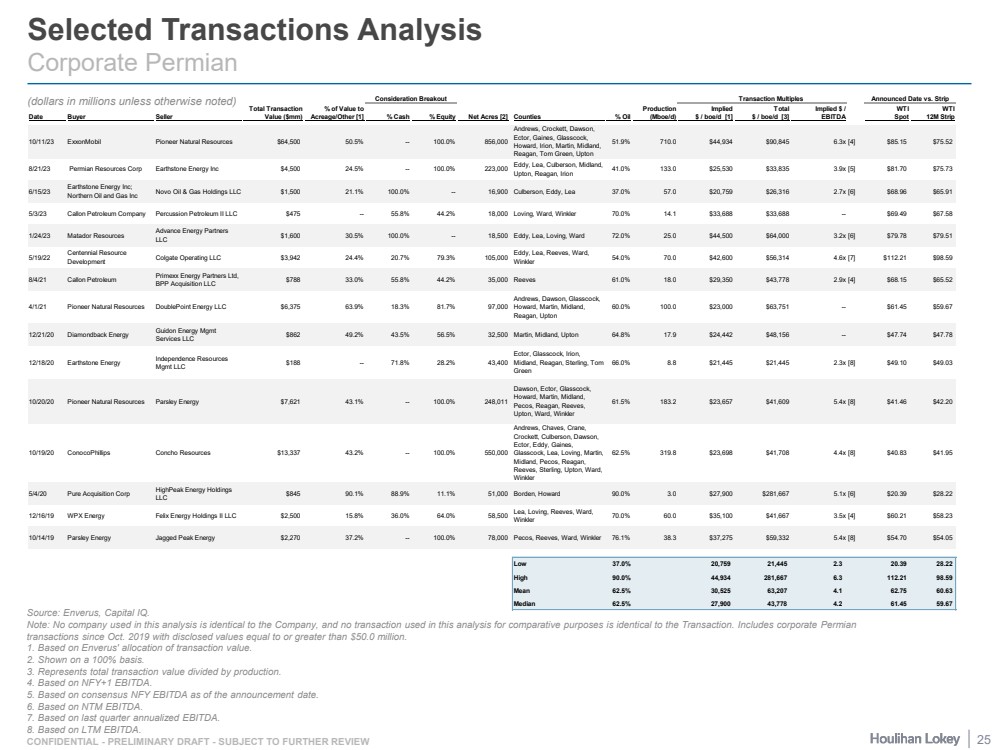
| CONFIDENTIAL - PRELIMINARY DRAFT - SUBJECT TO FURTHER REVIEW Selected Transactions Analysis Corporate Permian Source: Enverus, Capital IQ. Note: No company used in this analysis is identical to the Company, and no transaction used in this analysis for comparative purposes is identical to the Transaction. Includes corporate Permian transactions since Oct. 2019 with disclosed values equal to or greater than $50.0 million. 1. Based on Enverus' allocation of transaction value. 2. Shown on a 100% basis. 3. Represents total transaction value divided by production. 4. Based on NFY+1 EBITDA. 5. Based on consensus NFY EBITDA as of the announcement date. 6. Based on NTM EBITDA. 7. Based on last quarter annualized EBITDA. 8. Based on LTM EBITDA. (dollars in millions unless otherwise noted) Consideration Breakout Transaction Multiples Announced Date vs. Strip Total Transaction % of Value to Production Implied Total Implied $ / WTI WTI Date Buyer Seller Value ($mm) Acreage/Other [1] % Cash % Equity Net Acres [2] Counties % Oil (Mboe/d) $ / boe/d [1] $ / boe/d [3] EBITDA Spot 12M Strip 10/11/23 ExxonMobil Pioneer Natural Resources $64,500 50.5% -- 100.0% 856,000 Andrews, Crockett, Dawson, Ector, Gaines, Glasscock, Howard, Irion, Martin, Midland, Reagan, Tom Green, Upton 51.9% 710.0 $44,934 $90,845 6.3x [4] $85.15 $75.52 8/21/23 Permian Resources Corp Earthstone Energy Inc $4,500 24.5% -- 100.0% 223,000 Eddy, Lea, Culberson, Midland, Upton, Reagan, Irion 41.0% 133.0 $25,530 $33,835 3.9x [5] $81.70 $75.73 6/15/23 Earthstone Energy Inc; Northern Oil and Gas Inc Novo Oil & Gas Holdings LLC $1,500 21.1% 100.0% -- 16,900 Culberson, Eddy, Lea 37.0% 57.0 $20,759 $26,316 2.7x [6] $68.96 $65.91 5/3/23 Callon Petroleum Company Percussion Petroleum II LLC $475 -- 55.8% 44.2% 18,000 Loving, Ward, Winkler 70.0% 14.1 $33,688 $33,688 -- $69.49 $67.58 1/24/23 Matador Resources Advance Energy Partners LLC $1,600 30.5% 100.0% -- 18,500 Eddy, Lea, Loving, Ward 72.0% 25.0 $44,500 $64,000 3.2x [6] $79.78 $79.51 5/19/22 Centennial Resource Development Colgate Operating LLC $3,942 24.4% 20.7% 79.3% 105,000 Eddy, Lea, Reeves, Ward, Winkler 54.0% 70.0 $42,600 $56,314 4.6x [7] $112.21 $98.59 8/4/21 Callon Petroleum Primexx Energy Partners Ltd, BPP Acquisition LLC $788 33.0% 55.8% 44.2% 35,000 Reeves 61.0% 18.0 $29,350 $43,778 2.9x [4] $68.15 $65.52 4/1/21 Pioneer Natural Resources DoublePoint Energy LLC $6,375 63.9% 18.3% 81.7% 97,000 Andrews, Dawson, Glasscock, Howard, Martin, Midland, Reagan, Upton 60.0% 100.0 $23,000 $63,751 -- $61.45 $59.67 12/21/20 Diamondback Energy Guidon Energy Mgmt Services LLC $862 49.2% 43.5% 56.5% 32,500 Martin, Midland, Upton 64.8% 17.9 $24,442 $48,156 -- $47.74 $47.78 12/18/20 Earthstone Energy Independence Resources Mgmt LLC $188 -- 71.8% 28.2% 43,400 Ector, Glasscock, Irion, Midland, Reagan, Sterling, Tom Green 66.0% 8.8 $21,445 $21,445 2.3x [8] $49.10 $49.03 10/20/20 Pioneer Natural Resources Parsley Energy $7,621 43.1% -- 100.0% 248,011 Dawson, Ector, Glasscock, Howard, Martin, Midland, Pecos, Reagan, Reeves, Upton, Ward, Winkler 61.5% 183.2 $23,657 $41,609 5.4x [8] $41.46 $42.20 10/19/20 ConocoPhillips Concho Resources $13,337 43.2% -- 100.0% 550,000 Andrews, Chaves, Crane, Crockett, Culberson, Dawson, Ector, Eddy, Gaines, Glasscock, Lea, Loving, Martin, Midland, Pecos, Reagan, Reeves, Sterling, Upton, Ward, Winkler 62.5% 319.8 $23,698 $41,708 4.4x [8] $40.83 $41.95 5/4/20 Pure Acquisition Corp HighPeak Energy Holdings LLC $845 90.1% 88.9% 11.1% 51,000 Borden, Howard 90.0% 3.0 $27,900 $281,667 5.1x [6] $20.39 $28.22 12/16/19 WPX Energy Felix Energy Holdings II LLC $2,500 15.8% 36.0% 64.0% 58,500 Lea, Loving, Reeves, Ward, Winkler 70.0% 60.0 $35,100 $41,667 3.5x [4] $60.21 $58.23 10/14/19 Parsley Energy Jagged Peak Energy $2,270 37.2% -- 100.0% 78,000 Pecos, Reeves, Ward, Winkler 76.1% 38.3 $37,275 $59,332 5.4x [8] $54.70 $54.05 Low 37.0% 20,759 21,445 2.3 20.39 28.22 High 90.0% 44,934 281,667 6.3 112.21 98.59 Mean 62.5% 30,525 63,207 4.1 62.75 60.63 Median 62.5% 27,900 43,778 4.2 61.45 59.67 25 |
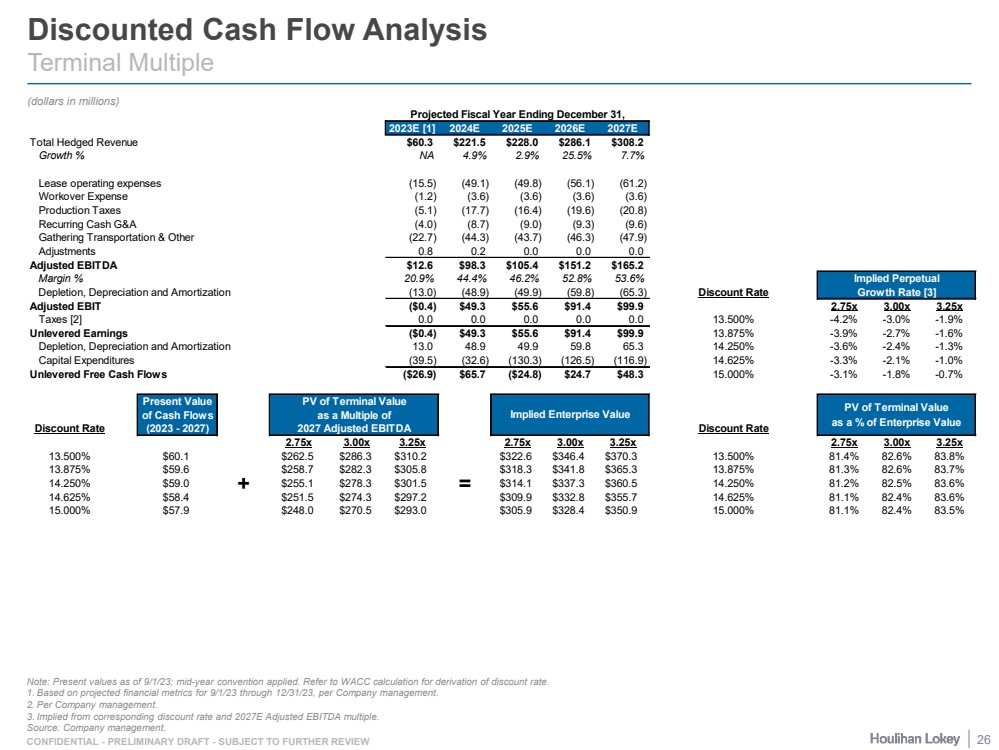
| CONFIDENTIAL - PRELIMINARY DRAFT - SUBJECT TO FURTHER REVIEW Discounted Cash Flow Analysis Terminal Multiple (dollars in millions) Note: Present values as of 9/1/23; mid-year convention applied. Refer to WACC calculation for derivation of discount rate. 1. Based on projected financial metrics for 9/1/23 through 12/31/23, per Company management. 2. Per Company management. 3. Implied from corresponding discount rate and 2027E Adjusted EBITDA multiple. Source: Company management. Projected Fiscal Year Ending December 31, 2023E [1] 2024E 2025E 2026E 2027E Total Hedged Revenue $60.3 $221.5 $228.0 $286.1 $308.2 Growth % NA 4.9% 2.9% 25.5% 7.7% Lease operating expenses (15.5) (49.1) (49.8) (56.1) (61.2) Workover Expense (1.2) (3.6) (3.6) (3.6) (3.6) Production Taxes (5.1) (17.7) (16.4) (19.6) (20.8) Recurring Cash G&A (4.0) (8.7) (9.0) (9.3) (9.6) Gathering Transportation & Other (22.7) (44.3) (43.7) (46.3) (47.9) Adjustments 0.8 0.2 0.0 0.0 0.0 Adjusted EBITDA $12.6 $98.3 $105.4 $151.2 $165.2 Margin % 20.9% 44.4% 46.2% 52.8% 53.6% Implied Perpetual Depletion, Depreciation and Amortization (13.0) (48.9) (49.9) (59.8) (65.3) Discount Rate Growth Rate [3] Adjusted EBIT ($0.4) $49.3 $55.6 $91.4 $99.9 2.75x 3.00x 3.25x Taxes [2] 0.0 0.0 0.0 0.0 0.0 13.500% -4.2% -3.0% -1.9% Unlevered Earnings ($0.4) $49.3 $55.6 $91.4 $99.9 13.875% -3.9% -2.7% -1.6% Depletion, Depreciation and Amortization 13.0 48.9 49.9 59.8 65.3 14.250% -3.6% -2.4% -1.3% Capital Expenditures (39.5) (32.6) (130.3) (126.5) (116.9) 14.625% -3.3% -2.1% -1.0% Unlevered Free Cash Flows ($26.9) $65.7 ($24.8) $24.7 $48.3 15.000% -3.1% -1.8% -0.7% Present Value PV of Terminal Value of Cash Flows as a Multiple of Discount Rate (2023 - 2027) 2027 Adjusted EBITDA Discount Rate 2.75x 3.00x 3.25x 2.75x 3.00x 3.25x 2.75x 3.00x 3.25x 13.500% $60.1 $262.5 $286.3 $310.2 $322.6 $346.4 $370.3 13.500% 81.4% 82.6% 83.8% 13.875% $59.6 $258.7 $282.3 $305.8 $318.3 $341.8 $365.3 13.875% 81.3% 82.6% 83.7% 14.250% $59.0 + $255.1 $278.3 $301.5 = $314.1 $337.3 $360.5 14.250% 81.2% 82.5% 83.6% 14.625% $58.4 $251.5 $274.3 $297.2 $309.9 $332.8 $355.7 14.625% 81.1% 82.4% 83.6% 15.000% $57.9 $248.0 $270.5 $293.0 $305.9 $328.4 $350.9 15.000% 81.1% 82.4% 83.5% PV of Terminal Value as a % of Enterprise Value Implied Enterprise Value 26 |
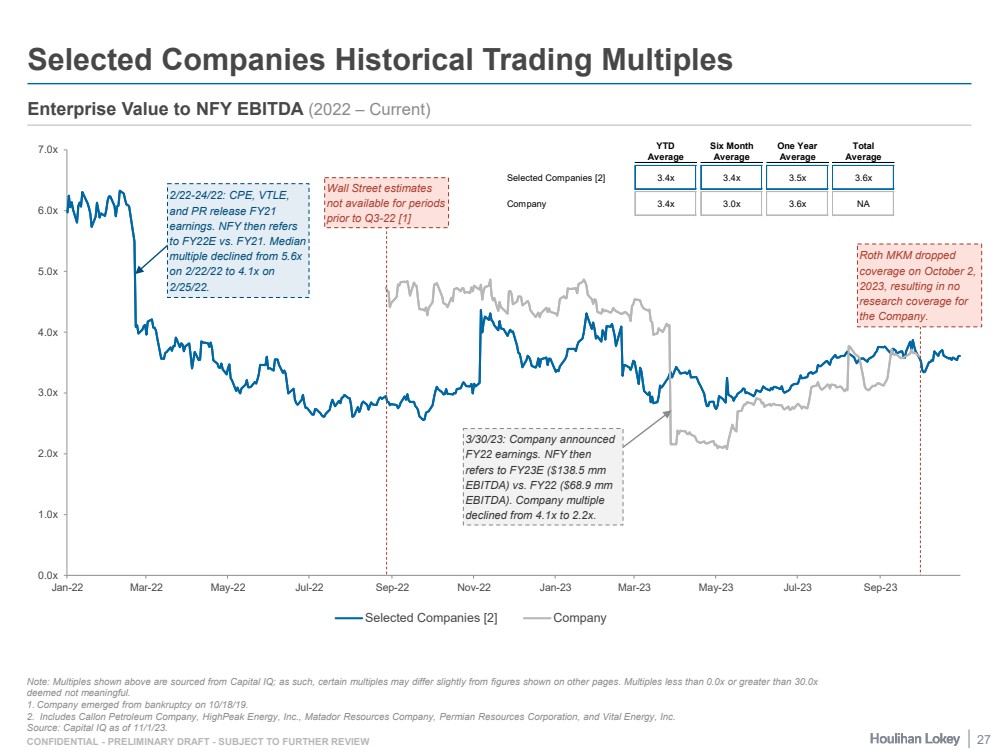
| CONFIDENTIAL - PRELIMINARY DRAFT - SUBJECT TO FURTHER REVIEW 0.0x 1.0x 2.0x 3.0x 4.0x 5.0x 6.0x 7.0x Jan-22 Mar-22 May-22 Jul-22 Sep-22 Nov-22 Jan-23 Mar-23 May-23 Jul-23 Sep-23 Selected Companies [2] Company Selected Companies Historical Trading Multiples Note: Multiples shown above are sourced from Capital IQ; as such, certain multiples may differ slightly from figures shown on other pages. Multiples less than 0.0x or greater than 30.0x deemed not meaningful. 1. Company emerged from bankruptcy on 10/18/19. 2. Includes Callon Petroleum Company, HighPeak Energy, Inc., Matador Resources Company, Permian Resources Corporation, and Vital Energy, Inc. Source: Capital IQ as of 11/1/23. Enterprise Value to NFY EBITDA (2022 – Current) 2/22-24/22: CPE, VTLE, and PR release FY21 earnings. NFY then refers to FY22E vs. FY21. Median multiple declined from 5.6x on 2/22/22 to 4.1x on 2/25/22. Wall Street estimates not available for periods prior to Q3-22 [1] 3/30/23: Company announced FY22 earnings. NFY then refers to FY23E ($138.5 mm EBITDA) vs. FY22 ($68.9 mm EBITDA). Company multiple declined from 4.1x to 2.2x. Roth MKM dropped coverage on October 2, 2023, resulting in no research coverage for the Company. YTD Six Month One Year Total Average Average Average Average Selected Companies [2] 3.4x 3.4x 3.5x 3.6x Company 3.4x 3.0x 3.6x NA 27 |
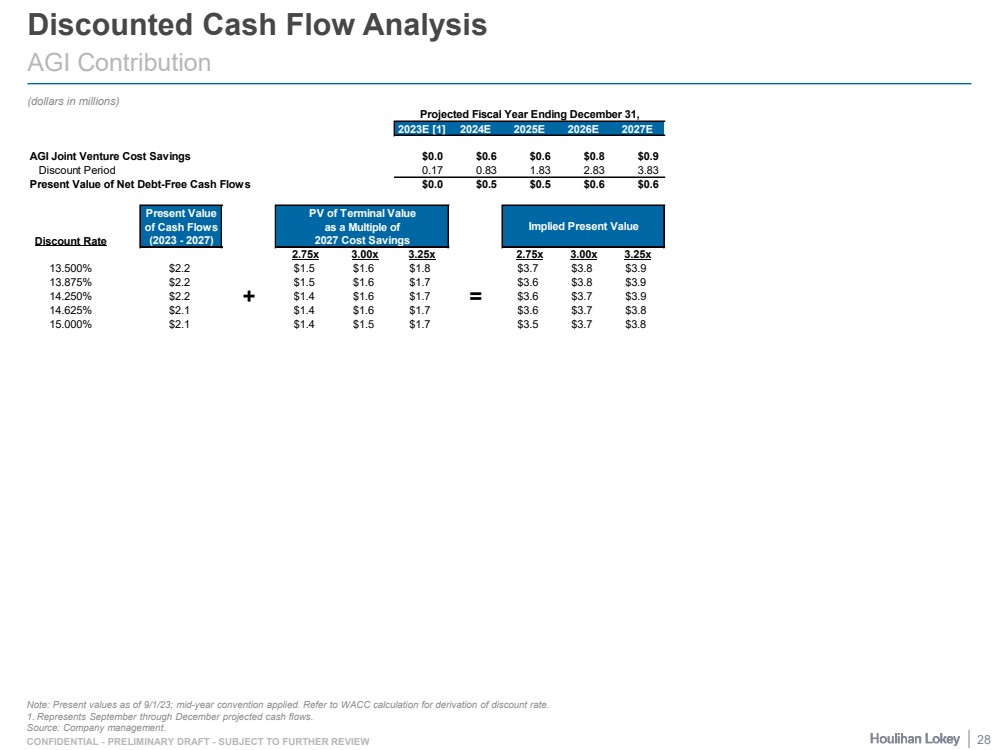
| CONFIDENTIAL - PRELIMINARY DRAFT - SUBJECT TO FURTHER REVIEW Discounted Cash Flow Analysis AGI Contribution (dollars in millions) Note: Present values as of 9/1/23; mid-year convention applied. Refer to WACC calculation for derivation of discount rate. 1. Represents September through December projected cash flows. Source: Company management. Projected Fiscal Year Ending December 31, 2023E [1] 2024E 2025E 2026E 2027E AGI Joint Venture Cost Savings $0.0 $0.6 $0.6 $0.8 $0.9 Discount Period 0.17 0.83 1.83 2.83 3.83 Present Value of Net Debt-Free Cash Flows $0.0 $0.5 $0.5 $0.6 $0.6 Present Value PV of Terminal Value of Cash Flows as a Multiple of Discount Rate (2023 - 2027) 2027 Cost Savings 2.75x 3.00x 3.25x 2.75x 3.00x 3.25x 13.500% $2.2 $1.5 $1.6 $1.8 $3.7 $3.8 $3.9 13.875% $2.2 $1.5 $1.6 $1.7 $3.6 $3.8 $3.9 14.250% $2.2 + $1.4 $1.6 $1.7 = $3.6 $3.7 $3.9 14.625% $2.1 $1.4 $1.6 $1.7 $3.6 $3.7 $3.8 15.000% $2.1 $1.4 $1.5 $1.7 $3.5 $3.7 $3.8 Implied Present Value 28 |
| Page 1. Executive Summary 3 2. Financial Analyses 8 3. Selected Public Market Observations 29 4. Appendix 34 5. Disclaimer 47 |
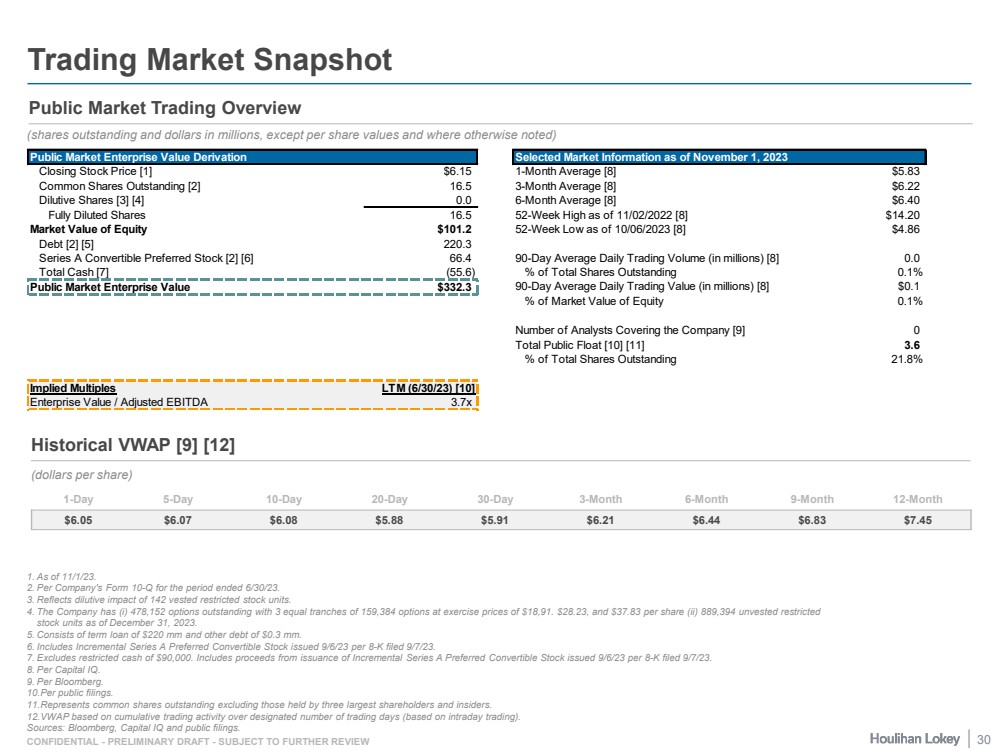
| CONFIDENTIAL - PRELIMINARY DRAFT - SUBJECT TO FURTHER REVIEW Trading Market Snapshot Public Market Trading Overview (shares outstanding and dollars in millions, except per share values and where otherwise noted) 1. As of 11/1/23. 2. Per Company's Form 10-Q for the period ended 6/30/23. 3. Reflects dilutive impact of 142 vested restricted stock units. 4. The Company has (i) 478,152 options outstanding with 3 equal tranches of 159,384 options at exercise prices of $18,91. $28.23, and $37.83 per share (ii) 889,394 unvested restricted stock units as of December 31, 2023. 5. Consists of term loan of $220 mm and other debt of $0.3 mm. 6. Includes Incremental Series A Preferred Convertible Stock issued 9/6/23 per 8-K filed 9/7/23. 7. Excludes restricted cash of $90,000. Includes proceeds from issuance of Incremental Series A Preferred Convertible Stock issued 9/6/23 per 8-K filed 9/7/23. 8. Per Capital IQ. 9. Per Bloomberg. 10.Per public filings. 11.Represents common shares outstanding excluding those held by three largest shareholders and insiders. 12.VWAP based on cumulative trading activity over designated number of trading days (based on intraday trading). Sources: Bloomberg, Capital IQ and public filings. Historical VWAP [9] [12] (dollars per share) 1-Day 5-Day 10-Day 20-Day 30-Day 3-Month 6-Month 9-Month 12-Month $6.05 $6.07 $6.08 $5.88 $5.91 $6.21 $6.44 $6.83 $7.45 Public Market Enterprise Value Derivation Selected Market Information as of November 1, 2023 Closing Stock Price [1] $6.15 1-Month Average [8] $5.83 Common Shares Outstanding [2] 16.5 3-Month Average [8] $6.22 Dilutive Shares [3] [4] 0.0 6-Month Average [8] $6.40 Fully Diluted Shares 16.5 52-Week High as of 11/02/2022 [8] $14.20 Market Value of Equity $101.2 52-Week Low as of 10/06/2023 [8] $4.86 Debt [2] [5] 220.3 Series A Convertible Preferred Stock [2] [6] 66.4 90-Day Average Daily Trading Volume (in millions) [8] 0.0 Total Cash [7] (55.6) % of Total Shares Outstanding 0.1% Public Market Enterprise Value $332.3 90-Day Average Daily Trading Value (in millions) [8] $0.1 % of Market Value of Equity 0.1% Number of Analysts Covering the Company [9] 0 Total Public Float [10] [11] 3.6 % of Total Shares Outstanding 21.8% Implied Multiples LTM (6/30/23) [10] CY 2023E [12] CY 2024E [12] Enterprise Value / Adjusted EBITDA 3.7x 4.2x 3.9x 30 |
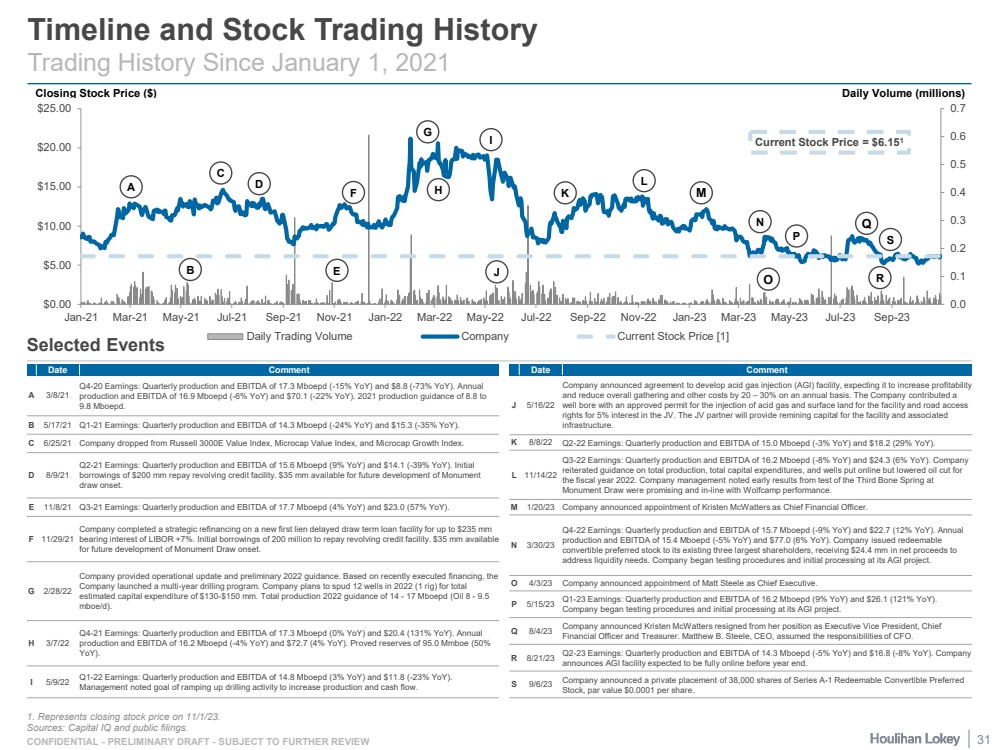
| CONFIDENTIAL - PRELIMINARY DRAFT - SUBJECT TO FURTHER REVIEW 0.0 0.1 0.2 0.3 0.4 0.5 0.6 0.7 $0.00 $5.00 $10.00 $15.00 $20.00 $25.00 Jan-21 Mar-21 May-21 Jul-21 Sep-21 Nov-21 Jan-22 Mar-22 May-22 Jul-22 Sep-22 Nov-22 Jan-23 Mar-23 May-23 Jul-23 Sep-23 Daily Trading Volume Company Current Stock Price [1] Closing Stock Price ($) Daily Volume (millions) Timeline and Stock Trading History Trading History Since January 1, 2021 Selected Events Date Comment A 3/8/21 Q4-20 Earnings: Quarterly production and EBITDA of 17.3 Mboepd (-15% YoY) and $8.8 (-73% YoY). Annual production and EBITDA of 16.9 Mboepd (-6% YoY) and $70.1 (-22% YoY). 2021 production guidance of 8.8 to 9.8 Mboepd. B 5/17/21 Q1-21 Earnings: Quarterly production and EBITDA of 14.3 Mboepd (-24% YoY) and $15.3 (-35% YoY). C 6/25/21 Company dropped from Russell 3000E Value Index, Microcap Value Index, and Microcap Growth Index. D 8/9/21 Q2-21 Earnings: Quarterly production and EBITDA of 15.6 Mboepd (9% YoY) and $14.1 (-39% YoY). Initial borrowings of $200 mm repay revolving credit facility. $35 mm available for future development of Monument draw onset. E 11/8/21 Q3-21 Earnings: Quarterly production and EBITDA of 17.7 Mboepd (4% YoY) and $23.0 (57% YoY). F 11/29/21 Company completed a strategic refinancing on a new first lien delayed draw term loan facility for up to $235 mm bearing interest of LIBOR +7%. Initial borrowings of 200 million to repay revolving credit facility. $35 mm available for future development of Monument Draw onset. G 2/28/22 Company provided operational update and preliminary 2022 guidance. Based on recently executed financing, the Company launched a multi-year drilling program. Company plans to spud 12 wells in 2022 (1 rig) for total estimated capital expenditure of $130-$150 mm. Total production 2022 guidance of 14 - 17 Mboepd (Oil 8 - 9.5 mboe/d). H 3/7/22 Q4-21 Earnings: Quarterly production and EBITDA of 17.3 Mboepd (0% YoY) and $20.4 (131% YoY). Annual production and EBITDA of 16.2 Mboepd (-4% YoY) and $72.7 (4% YoY). Proved reserves of 95.0 Mmboe (50% YoY). I 5/9/22 Q1-22 Earnings: Quarterly production and EBITDA of 14.8 Mboepd (3% YoY) and $11.8 (-23% YoY). Management noted goal of ramping up drilling activity to increase production and cash flow. Date Comment J 5/16/22 Company announced agreement to develop acid gas injection (AGI) facility, expecting it to increase profitability and reduce overall gathering and other costs by 20 – 30% on an annual basis. The Company contributed a well bore with an approved permit for the injection of acid gas and surface land for the facility and road access rights for 5% interest in the JV. The JV partner will provide remining capital for the facility and associated infrastructure. K 8/8/22 Q2-22 Earnings: Quarterly production and EBITDA of 15.0 Mboepd (-3% YoY) and $18.2 (29% YoY). L 11/14/22 Q3-22 Earnings: Quarterly production and EBITDA of 16.2 Mboepd (-8% YoY) and $24.3 (6% YoY). Company reiterated guidance on total production, total capital expenditures, and wells put online but lowered oil cut for the fiscal year 2022. Company management noted early results from test of the Third Bone Spring at Monument Draw were promising and in-line with Wolfcamp performance. M 1/20/23 Company announced appointment of Kristen McWatters as Chief Financial Officer. N 3/30/23 Q4-22 Earnings: Quarterly production and EBITDA of 15.7 Mboepd (-9% YoY) and $22.7 (12% YoY). Annual production and EBITDA of 15.4 Mboepd (-5% YoY) and $77.0 (6% YoY). Company issued redeemable convertible preferred stock to its existing three largest shareholders, receiving $24.4 mm in net proceeds to address liquidity needs. Company began testing procedures and initial processing at its AGI project. O 4/3/23 Company announced appointment of Matt Steele as Chief Executive. P 5/15/23 Q1-23 Earnings: Quarterly production and EBITDA of 16.2 Mboepd (9% YoY) and $26.1 (121% YoY). Company began testing procedures and initial processing at its AGI project. Q 8/4/23 Company announced Kristen McWatters resigned from her position as Executive Vice President, Chief Financial Officer and Treasurer. Matthew B. Steele, CEO, assumed the responsibilities of CFO. R 8/21/23 Q2-23 Earnings: Quarterly production and EBITDA of 14.3 Mboepd (-5% YoY) and $16.8 (-8% YoY). Company announces AGI facility expected to be fully online before year end. S 9/6/23 Company announced a private placement of 38,000 shares of Series A-1 Redeemable Convertible Preferred Stock, par value $0.0001 per share. A F G E C H J L M N O B K P D I Current Stock Price = $6.151 S R Q 1. Represents closing stock price on 11/1/23. Sources: Capital IQ and public filings. 31 |
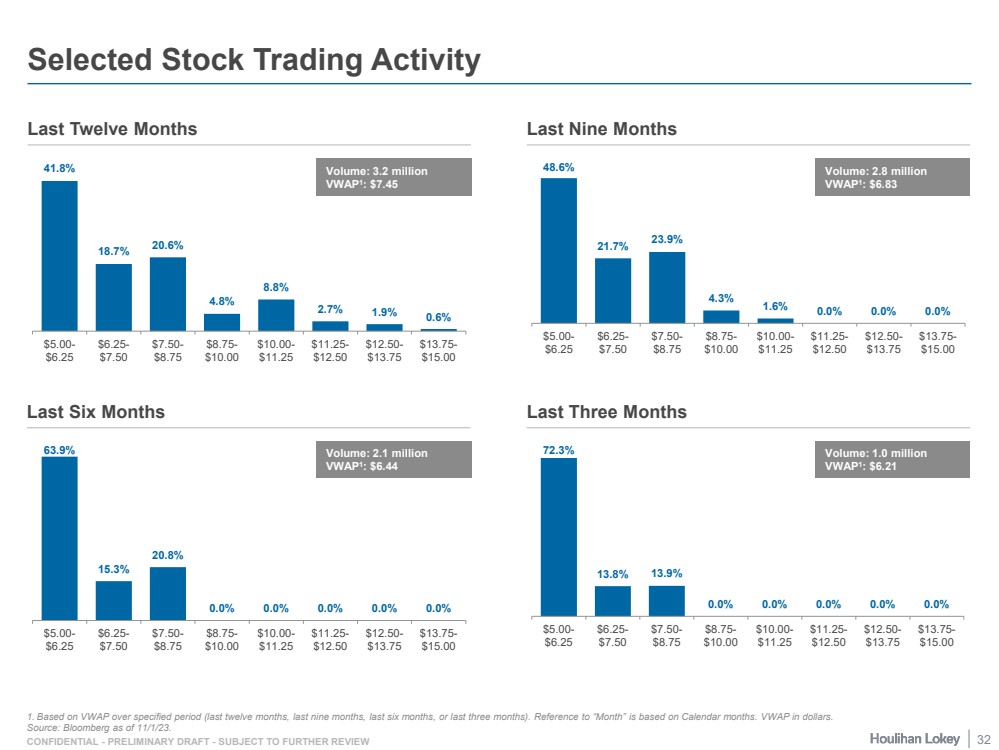
| CONFIDENTIAL - PRELIMINARY DRAFT - SUBJECT TO FURTHER REVIEW 41.8% 18.7% 20.6% 4.8% 8.8% 2.7% 1.9% 0.6% $5.00- $6.25 $6.25- $7.50 $7.50- $8.75 $8.75- $10.00 $10.00- $11.25 $11.25- $12.50 $12.50- $13.75 $13.75- $15.00 48.6% 21.7% 23.9% 4.3% 1.6% 0.0% 0.0% 0.0% $5.00- $6.25 $6.25- $7.50 $7.50- $8.75 $8.75- $10.00 $10.00- $11.25 $11.25- $12.50 $12.50- $13.75 $13.75- $15.00 63.9% 15.3% 20.8% 0.0% 0.0% 0.0% 0.0% 0.0% $5.00- $6.25 $6.25- $7.50 $7.50- $8.75 $8.75- $10.00 $10.00- $11.25 $11.25- $12.50 $12.50- $13.75 $13.75- $15.00 72.3% 13.8% 13.9% 0.0% 0.0% 0.0% 0.0% 0.0% $5.00- $6.25 $6.25- $7.50 $7.50- $8.75 $8.75- $10.00 $10.00- $11.25 $11.25- $12.50 $12.50- $13.75 $13.75- $15.00 Selected Stock Trading Activity Last Twelve Months Last Nine Months Last Six Months Last Three Months 1. Based on VWAP over specified period (last twelve months, last nine months, last six months, or last three months). Reference to “Month” is based on Calendar months. VWAP in dollars. Source: Bloomberg as of 11/1/23. Volume: 3.2 million VWAP1: $7.45 Volume: 2.8 million VWAP1: $6.83 Volume: 2.1 million VWAP1: $6.44 Volume: 1.0 million VWAP1: $6.21 32 |
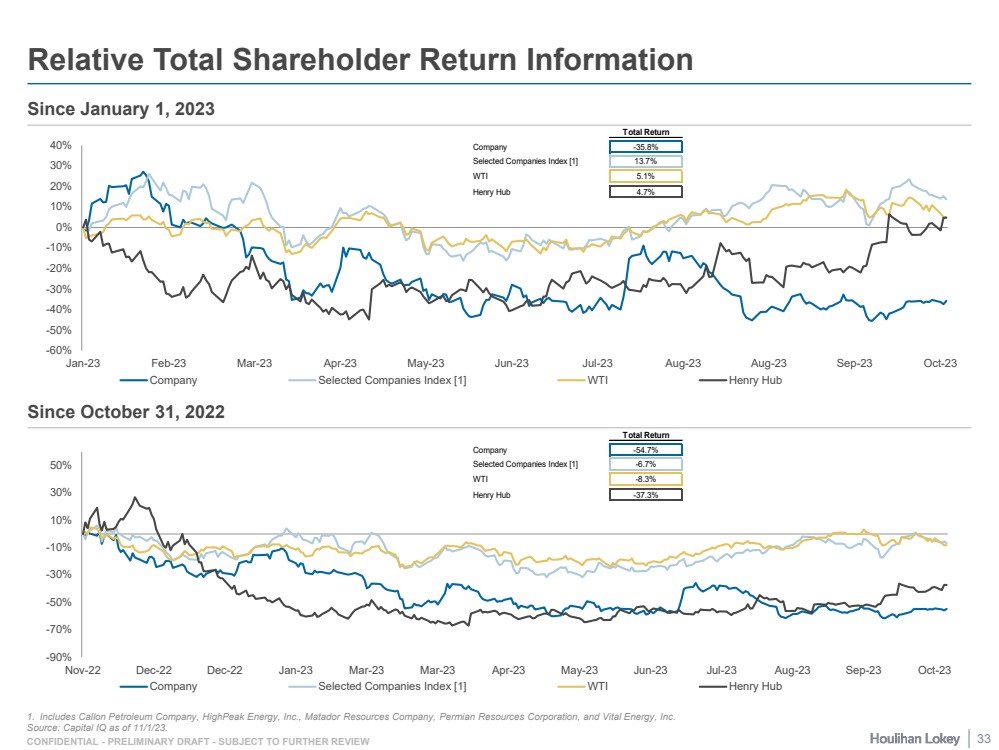
| CONFIDENTIAL - PRELIMINARY DRAFT - SUBJECT TO FURTHER REVIEW -90% -70% -50% -30% -10% 10% 30% 50% Nov-22 Dec-22 Dec-22 Jan-23 Mar-23 Mar-23 Apr-23 May-23 Jun-23 Jul-23 Aug-23 Sep-23 Oct-23 Company Selected Companies Index [1] WTI Henry Hub -60% -50% -40% -30% -20% -10% 0% 10% 20% 30% 40% Jan-23 Feb-23 Mar-23 Apr-23 May-23 Jun-23 Jul-23 Aug-23 Aug-23 Sep-23 Oct-23 Company Selected Companies Index [1] WTI Henry Hub Relative Total Shareholder Return Information Since January 1, 2023 1. Includes Callon Petroleum Company, HighPeak Energy, Inc., Matador Resources Company, Permian Resources Corporation, and Vital Energy, Inc. Source: Capital IQ as of 11/1/23. Since October 31, 2022 Total Return Company -35.8% Selected Companies Index [1] 13.7% WTI 5.1% Henry Hub 4.7% Total Return Company -54.7% Selected Companies Index [1] -6.7% WTI -8.3% Henry Hub -37.3% 33 |
| Page 1. Executive Summary 3 2. Financial Analyses 8 3. Selected Public Market Observations 29 4. Appendix 34 Weighted Average Cost of Capital Calculation 35 Observed Premiums Paid Analysis 38 Selected Series A Convertible Preferred Stock Terms 41 Glossary of Selected Terms 44 5. Disclaimer 47 |
| Page 1. Executive Summary 3 2. Financial Analyses 8 3. Selected Public Market Observations 29 4. Appendix 34 Weighted Average Cost of Capital Calculation 35 Observed Premiums Paid Analysis 38 Selected Series A Convertible Preferred Stock Terms 41 Glossary of Selected Terms 44 5. Disclaimer 47 |
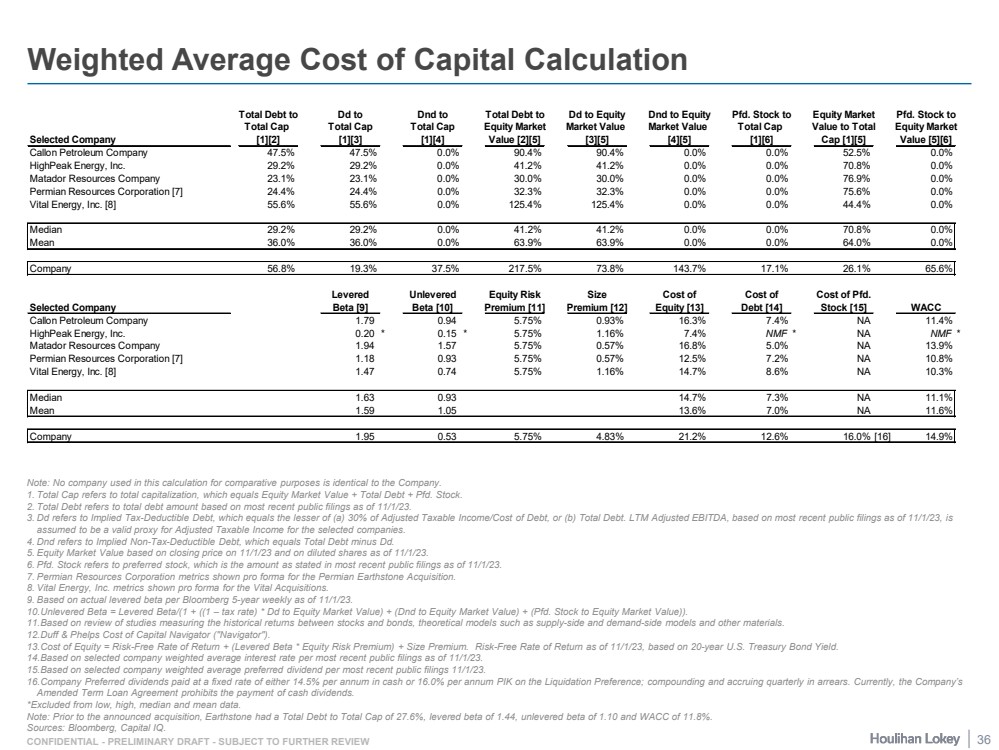
| CONFIDENTIAL - PRELIMINARY DRAFT - SUBJECT TO FURTHER REVIEW Weighted Average Cost of Capital Calculation Note: No company used in this calculation for comparative purposes is identical to the Company. 1. Total Cap refers to total capitalization, which equals Equity Market Value + Total Debt + Pfd. Stock. 2. Total Debt refers to total debt amount based on most recent public filings as of 11/1/23. 3. Dd refers to Implied Tax-Deductible Debt, which equals the lesser of (a) 30% of Adjusted Taxable Income/Cost of Debt, or (b) Total Debt. LTM Adjusted EBITDA, based on most recent public filings as of 11/1/23, is assumed to be a valid proxy for Adjusted Taxable Income for the selected companies. 4. Dnd refers to Implied Non-Tax-Deductible Debt, which equals Total Debt minus Dd. 5. Equity Market Value based on closing price on 11/1/23 and on diluted shares as of 11/1/23. 6. Pfd. Stock refers to preferred stock, which is the amount as stated in most recent public filings as of 11/1/23. 7. Permian Resources Corporation metrics shown pro forma for the Permian Earthstone Acquisition. 8. Vital Energy, Inc. metrics shown pro forma for the Vital Acquisitions. 9. Based on actual levered beta per Bloomberg 5-year weekly as of 11/1/23. 10.Unlevered Beta = Levered Beta/(1 + ((1 – tax rate) * Dd to Equity Market Value) + (Dnd to Equity Market Value) + (Pfd. Stock to Equity Market Value)). 11.Based on review of studies measuring the historical returns between stocks and bonds, theoretical models such as supply-side and demand-side models and other materials. 12.Duff & Phelps Cost of Capital Navigator ("Navigator"). 13.Cost of Equity = Risk-Free Rate of Return + (Levered Beta * Equity Risk Premium) + Size Premium. Risk-Free Rate of Return as of 11/1/23, based on 20-year U.S. Treasury Bond Yield. 14.Based on selected company weighted average interest rate per most recent public filings as of 11/1/23. 15.Based on selected company weighted average preferred dividend per most recent public filings 11/1/23. 16.Company Preferred dividends paid at a fixed rate of either 14.5% per annum in cash or 16.0% per annum PIK on the Liquidation Preference; compounding and accruing quarterly in arrears. Currently, the Company’s Amended Term Loan Agreement prohibits the payment of cash dividends. *Excluded from low, high, median and mean data. Note: Prior to the announced acquisition, Earthstone had a Total Debt to Total Cap of 27.6%, levered beta of 1.44, unlevered beta of 1.10 and WACC of 11.8%. Sources: Bloomberg, Capital IQ. Total Debt to Dd to Dnd to Total Debt to Dd to Equity Dnd to Equity Pfd. Stock to Equity Market Pfd. Stock to Total Cap Total Cap Total Cap Equity Market Market Value Market Value Total Cap Value to Total Equity Market Selected Company [1][2] [1][3] [1][4] Value [2][5] [3][5] [4][5] [1][6] Cap [1][5] Value [5][6] Callon Petroleum Company 47.5% ### 47.5% ### 0.0% ### 90.4% ### 90.4% ### 0.0% ### 0.0% ### 52.5% ### 0.0% ### HighPeak Energy, Inc. 29.2% ### 29.2% ### 0.0% ### 41.2% ### 41.2% ### 0.0% ### 0.0% ### 70.8% ### 0.0% ### Matador Resources Company 23.1% ### 23.1% ### 0.0% ### 30.0% ### 30.0% ### 0.0% ### 0.0% ### 76.9% ### 0.0% ### Permian Resources Corporation [7] 24.4% ### 24.4% ### 0.0% ### 32.3% ### 32.3% ### 0.0% ### 0.0% ### 75.6% ### 0.0% ### Vital Energy, Inc. [8] 55.6% ### 55.6% ### 0.0% ### 125.4% ### 125.4% ### 0.0% ### 0.0% ### 44.4% ### 0.0% ### Median 29.2% 29.2% 0.0% 41.2% 41.2% 0.0% 0.0% 70.8% 0.0% Mean 36.0% 36.0% 0.0% 63.9% 63.9% 0.0% 0.0% 64.0% 0.0% Company 56.8% ### 19.3% ### 37.5% ### 217.5% ### 73.8% ### 143.7% ### 17.1% ### 26.1% ### 65.6% ### Debt Levered Unlevered Equity Risk Size Cost of Cost of Cost of Pfd. Selected Company Beta [5] Beta [9] Beta [10] Premium [11] Premium [12] Equity [13] Debt [14] Stock [15] WACC Callon Petroleum Company Input 1.79 ### 0.94 ### 5.75% 0.93% 16.3% ### 7.4% ### NA NA 11.4% ### HighPeak Energy, Inc. Input 0.20 * 0.15 * 5.75% 1.16% 7.4% ### NMF * NA NA NMF * Matador Resources Company Input 1.94 ### 1.57 ### 5.75% 0.57% 16.8% ### 5.0% ### NA NA 13.9% ### Permian Resources Corporation [7] Input 1.18 ### 0.93 ### 5.75% 0.57% 12.5% ### 7.2% ### NA NA 10.8% ### Vital Energy, Inc. [8] Input 1.47 ### 0.74 ### 5.75% 1.16% 14.7% ### 8.6% ### NA NA 10.3% ### Median 1.63 0.93 14.7% 7.3% NA 11.1% Mean 1.59 1.05 13.6% 7.0% NA 11.6% Company Input 1.95 ### 0.53 ### 5.75% 4.83% 21.2% ### 12.6% ### 16.0% [16] 14.9% ### 36 |
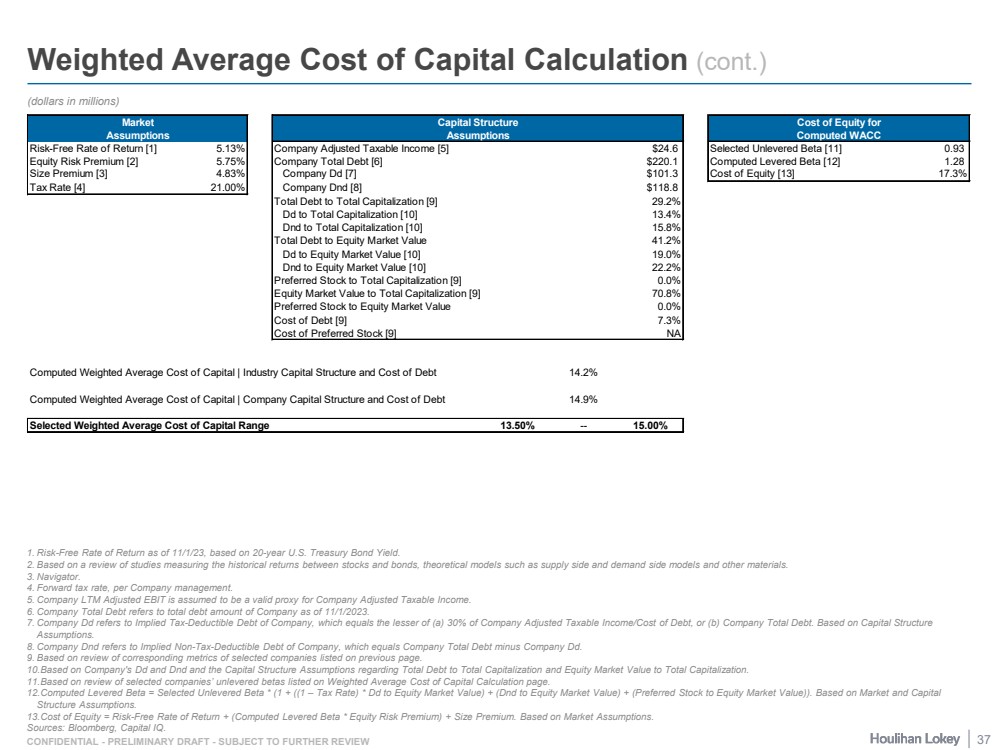
| CONFIDENTIAL - PRELIMINARY DRAFT - SUBJECT TO FURTHER REVIEW Weighted Average Cost of Capital Calculation (cont.) 1. Risk-Free Rate of Return as of 11/1/23, based on 20-year U.S. Treasury Bond Yield. 2. Based on a review of studies measuring the historical returns between stocks and bonds, theoretical models such as supply side and demand side models and other materials. 3. Navigator. 4. Forward tax rate, per Company management. 5. Company LTM Adjusted EBIT is assumed to be a valid proxy for Company Adjusted Taxable Income. 6. Company Total Debt refers to total debt amount of Company as of 11/1/2023. 7. Company Dd refers to Implied Tax-Deductible Debt of Company, which equals the lesser of (a) 30% of Company Adjusted Taxable Income/Cost of Debt, or (b) Company Total Debt. Based on Capital Structure Assumptions. 8. Company Dnd refers to Implied Non-Tax-Deductible Debt of Company, which equals Company Total Debt minus Company Dd. 9. Based on review of corresponding metrics of selected companies listed on previous page. 10.Based on Company's Dd and Dnd and the Capital Structure Assumptions regarding Total Debt to Total Capitalization and Equity Market Value to Total Capitalization. 11.Based on review of selected companies’ unlevered betas listed on Weighted Average Cost of Capital Calculation page. 12.Computed Levered Beta = Selected Unlevered Beta * (1 + ((1 – Tax Rate) * Dd to Equity Market Value) + (Dnd to Equity Market Value) + (Preferred Stock to Equity Market Value)). Based on Market and Capital Structure Assumptions. 13.Cost of Equity = Risk-Free Rate of Return + (Computed Levered Beta * Equity Risk Premium) + Size Premium. Based on Market Assumptions. Sources: Bloomberg, Capital IQ. (dollars in millions) Market Capital Structure Cost of Equity for Assumptions Assumptions Computed WACC Risk-Free Rate of Return [1] 5.13% Company Adjusted Taxable Income [5] $24.6 Selected Unlevered Beta [11] 0.93 Equity Risk Premium [2] 5.75% Company Total Debt [6] $220.1 Computed Levered Beta [12] 1.28 Size Premium [3] 4.83% Company Dd [7] $101.3 Cost of Equity [13] 17.3% Tax Rate [4] 21.00% Company Dnd [8] $118.8 Debt Beta [15] Total Debt to Total Capitalization [9] 29.2% Dd to Total Capitalization [10] 13.4% Dnd to Total Capitalization [10] 15.8% Total Debt to Equity Market Value 41.2% Dd to Equity Market Value [10] 19.0% Dnd to Equity Market Value [10] 22.2% Preferred Stock to Total Capitalization [9] 0.0% Equity Market Value to Total Capitalization [9] 70.8% Preferred Stock to Equity Market Value 0.0% Cost of Debt [9] 7.3% Cost of Preferred Stock [9] NA Computed Weighted Average Cost of Capital | Industry Capital Structure and Cost of Debt 14.2% Computed Weighted Average Cost of Capital | Company Capital Structure and Cost of Debt 14.9% Selected Weighted Average Cost of Capital Range 13.50% -- 15.00% 37 |
| Page 1. Executive Summary 3 2. Financial Analyses 8 3. Selected Public Market Observations 29 4. Appendix 34 Weighted Average Cost of Capital Calculation 35 Observed Premiums Paid Analysis 38 Selected Series A Convertible Preferred Stock Terms 41 Glossary of Selected Terms 44 5. Disclaimer 47 |
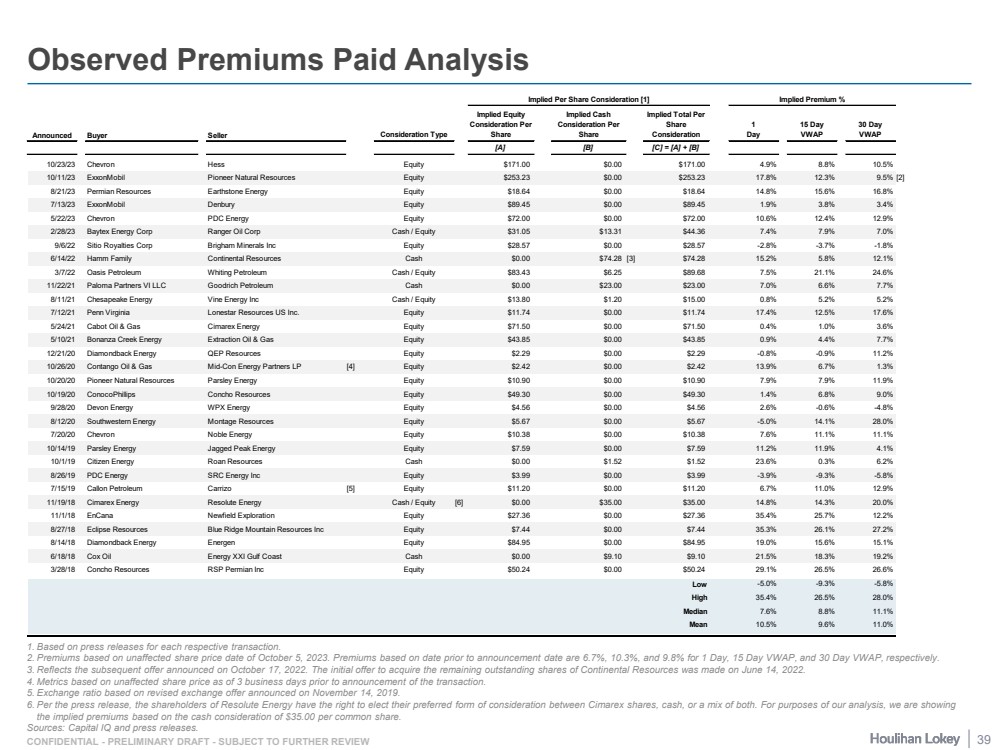
| CONFIDENTIAL - PRELIMINARY DRAFT - SUBJECT TO FURTHER REVIEW Observed Premiums Paid Analysis 1. Based on press releases for each respective transaction. 2. Premiums based on unaffected share price date of October 5, 2023. Premiums based on date prior to announcement date are 6.7%, 10.3%, and 9.8% for 1 Day, 15 Day VWAP, and 30 Day VWAP, respectively. 3. Reflects the subsequent offer announced on October 17, 2022. The initial offer to acquire the remaining outstanding shares of Continental Resources was made on June 14, 2022. 4. Metrics based on unaffected share price as of 3 business days prior to announcement of the transaction. 5. Exchange ratio based on revised exchange offer announced on November 14, 2019. 6. Per the press release, the shareholders of Resolute Energy have the right to elect their preferred form of consideration between Cimarex shares, cash, or a mix of both. For purposes of our analysis, we are showing the implied premiums based on the cash consideration of $35.00 per common share. Sources: Capital IQ and press releases. Implied Per Share Consideration [1] Implied Premium % Announced Buyer Seller Consideration Type Implied Equity Consideration Per Share Implied Cash Consideration Per Share Implied Total Per Share Consideration 1 Day 15 Day VWAP 30 Day VWAP [A] [B] [C] = [A] + [B] 10/23/23 Chevron Hess Equity $171.00 $0.00 $171.00 4.9% 8.8% 10.5% 10/11/23 ExxonMobil Pioneer Natural Resources Equity $253.23 $0.00 $253.23 17.8% 12.3% 9.5% [2] 8/21/23 Permian Resources Earthstone Energy Equity $18.64 $0.00 $18.64 14.8% 15.6% 16.8% 7/13/23 ExxonMobil Denbury Equity $89.45 $0.00 $89.45 1.9% 3.8% 3.4% 5/22/23 Chevron PDC Energy Equity $72.00 $0.00 $72.00 10.6% 12.4% 12.9% 2/28/23 Baytex Energy Corp Ranger Oil Corp Cash / Equity $31.05 $13.31 $44.36 7.4% 7.9% 7.0% 9/6/22 Sitio Royalties Corp Brigham Minerals Inc Equity $28.57 $0.00 $28.57 -2.8% -3.7% -1.8% 6/14/22 Hamm Family Continental Resources Cash $0.00 $74.28 [3] $74.28 15.2% 5.8% 12.1% 3/7/22 Oasis Petroleum Whiting Petroleum Cash / Equity $83.43 $6.25 $89.68 7.5% 21.1% 24.6% 11/22/21 Paloma Partners VI LLC Goodrich Petroleum Cash $0.00 $23.00 $23.00 7.0% 6.6% 7.7% 8/11/21 Chesapeake Energy Vine Energy Inc Cash / Equity $13.80 $1.20 $15.00 0.8% 5.2% 5.2% 7/12/21 Penn Virginia Lonestar Resources US Inc. Equity $11.74 $0.00 $11.74 17.4% 12.5% 17.6% 5/24/21 Cabot Oil & Gas Cimarex Energy Equity $71.50 $0.00 $71.50 0.4% 1.0% 3.6% 5/10/21 Bonanza Creek Energy Extraction Oil & Gas Equity $43.85 $0.00 $43.85 0.9% 4.4% 7.7% 12/21/20 Diamondback Energy QEP Resources Equity $2.29 $0.00 $2.29 -0.8% -0.9% 11.2% 10/26/20 Contango Oil & Gas Mid-Con Energy Partners LP [4] Equity $2.42 $0.00 $2.42 13.9% 6.7% 1.3% 10/20/20 Pioneer Natural Resources Parsley Energy Equity $10.90 $0.00 $10.90 7.9% 7.9% 11.9% 10/19/20 ConocoPhillips Concho Resources Equity $49.30 $0.00 $49.30 1.4% 6.8% 9.0% 9/28/20 Devon Energy WPX Energy Equity $4.56 $0.00 $4.56 2.6% -0.6% -4.8% 8/12/20 Southwestern Energy Montage Resources Equity $5.67 $0.00 $5.67 -5.0% 14.1% 28.0% 7/20/20 Chevron Noble Energy Equity $10.38 $0.00 $10.38 7.6% 11.1% 11.1% 10/14/19 Parsley Energy Jagged Peak Energy Equity $7.59 $0.00 $7.59 11.2% 11.9% 4.1% 10/1/19 Citizen Energy Roan Resources Cash $0.00 $1.52 $1.52 23.6% 0.3% 6.2% 8/26/19 PDC Energy SRC Energy Inc Equity $3.99 $0.00 $3.99 -3.9% -9.3% -5.8% 7/15/19 Callon Petroleum Carrizo [5] Equity $11.20 $0.00 $11.20 6.7% 11.0% 12.9% 11/19/18 Cimarex Energy Resolute Energy Cash / Equity [6] $0.00 $35.00 $35.00 14.8% 14.3% 20.0% 11/1/18 EnCana Newfield Exploration Equity $27.36 $0.00 $27.36 35.4% 25.7% 12.2% 8/27/18 Eclipse Resources Blue Ridge Mountain Resources Inc Equity $7.44 $0.00 $7.44 35.3% 26.1% 27.2% 8/14/18 Diamondback Energy Energen Equity $84.95 $0.00 $84.95 19.0% 15.6% 15.1% 6/18/18 Cox Oil Energy XXI Gulf Coast Cash $0.00 $9.10 $9.10 21.5% 18.3% 19.2% 3/28/18 Concho Resources RSP Permian Inc Equity $50.24 $0.00 $50.24 29.1% 26.5% 26.6% Low -5.0% -9.3% -5.8% High 35.4% 26.5% 28.0% Median 7.6% 8.8% 11.1% Mean 10.5% 9.6% 11.0% 39 |
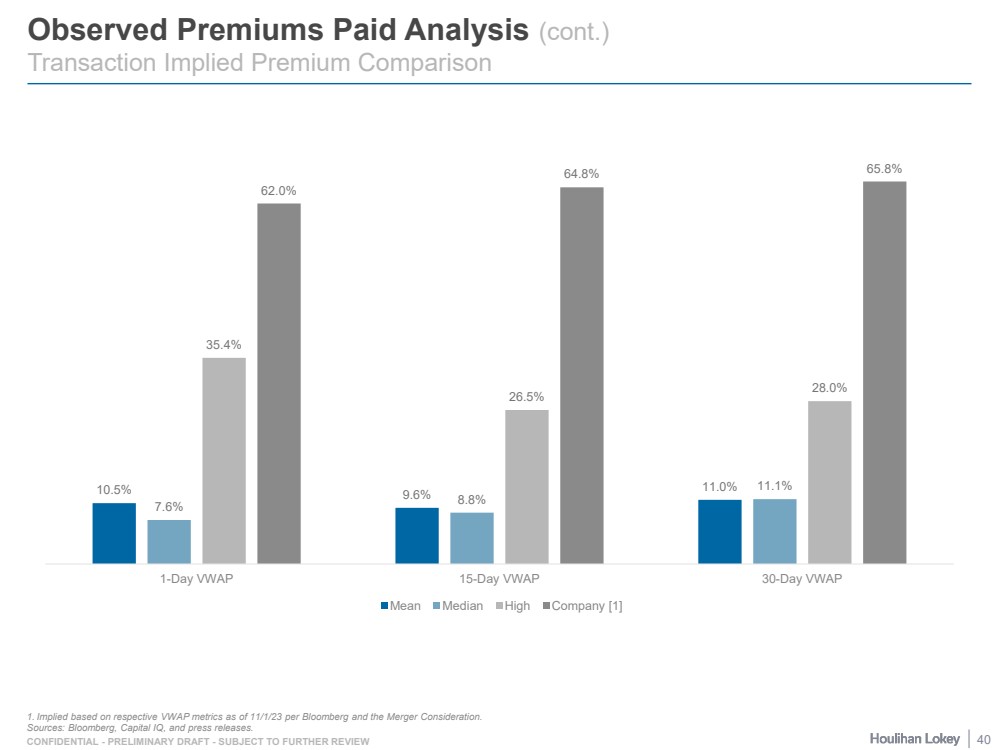
| CONFIDENTIAL - PRELIMINARY DRAFT - SUBJECT TO FURTHER REVIEW Observed Premiums Paid Analysis (cont.) Transaction Implied Premium Comparison 1. Implied based on respective VWAP metrics as of 11/1/23 per Bloomberg and the Merger Consideration. Sources: Bloomberg, Capital IQ, and press releases. 10.5% 9.6% 11.0% 7.6% 8.8% 11.1% 35.4% 26.5% 28.0% 62.0% 64.8% 65.8% 1-Day VWAP 15-Day VWAP 30-Day VWAP Mean Median High Company [1] 40 |
| Page 1. Executive Summary 3 2. Financial Analyses 8 3. Selected Public Market Observations 29 4. Appendix 34 Weighted Average Cost of Capital Calculation 35 Observed Premiums Paid Analysis 38 Selected Series A Convertible Preferred Stock Terms 41 Glossary of Selected Terms 44 5. Disclaimer 47 |
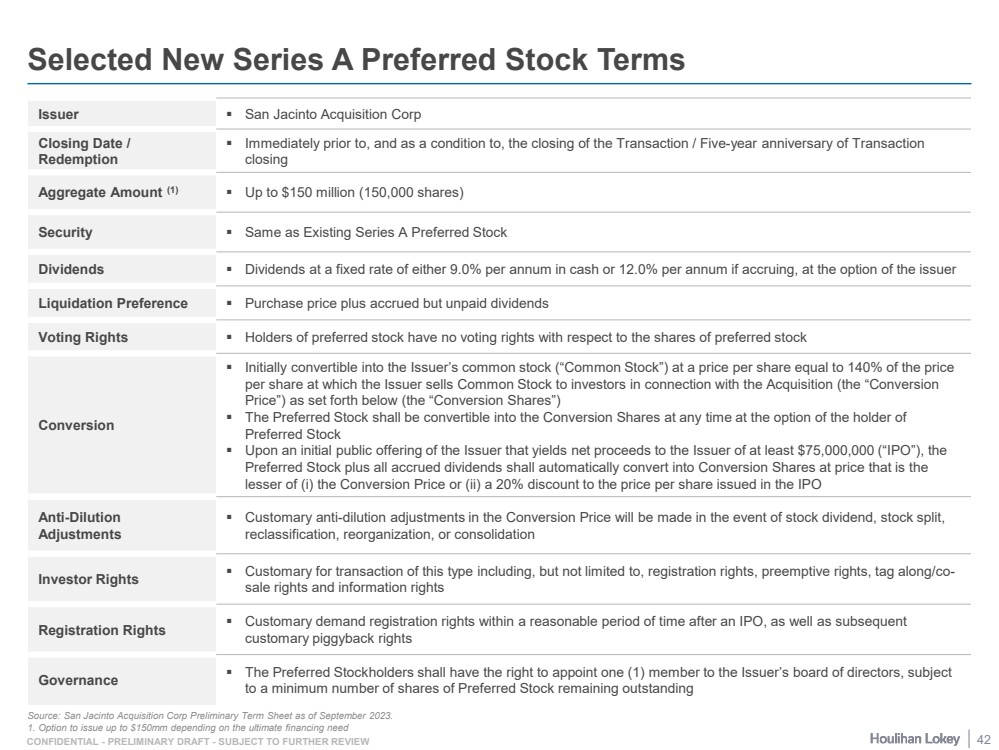
| CONFIDENTIAL - PRELIMINARY DRAFT - SUBJECT TO FURTHER REVIEW Selected New Series A Preferred Stock Terms Source: San Jacinto Acquisition Corp Preliminary Term Sheet as of September 2023. 1. Option to issue up to $150mm depending on the ultimate financing need Issuer San Jacinto Acquisition Corp Closing Date / Redemption Immediately prior to, and as a condition to, the closing of the Transaction / Five-year anniversary of Transaction closing Aggregate Amount (1) Up to $150 million (150,000 shares) Security Same as Existing Series A Preferred Stock Dividends Dividends at a fixed rate of either 9.0% per annum in cash or 12.0% per annum if accruing, at the option of the issuer Liquidation Preference Purchase price plus accrued but unpaid dividends Voting Rights Holders of preferred stock have no voting rights with respect to the shares of preferred stock Conversion Initially convertible into the Issuer’s common stock (“Common Stock”) at a price per share equal to 140% of the price per share at which the Issuer sells Common Stock to investors in connection with the Acquisition (the “Conversion Price”) as set forth below (the “Conversion Shares”) The Preferred Stock shall be convertible into the Conversion Shares at any time at the option of the holder of Preferred Stock Upon an initial public offering of the Issuer that yields net proceeds to the Issuer of at least $75,000,000 (“IPO”), the Preferred Stock plus all accrued dividends shall automatically convert into Conversion Shares at price that is the lesser of (i) the Conversion Price or (ii) a 20% discount to the price per share issued in the IPO Anti-Dilution Adjustments Customary anti-dilution adjustments in the Conversion Price will be made in the event of stock dividend, stock split, reclassification, reorganization, or consolidation Investor Rights Customary for transaction of this type including, but not limited to, registration rights, preemptive rights, tag along/co-sale rights and information rights Registration Rights Customary demand registration rights within a reasonable period of time after an IPO, as well as subsequent customary piggyback rights Governance The Preferred Stockholders shall have the right to appoint one (1) member to the Issuer’s board of directors, subject to a minimum number of shares of Preferred Stock remaining outstanding 42 |
| CONFIDENTIAL - PRELIMINARY DRAFT - SUBJECT TO FURTHER REVIEW Existing Series A Convertible Preferred Stock Terms Source: Company public filings. 1. Refers to PDP PV-20 based on a reserve report prepared by an independent reserve engineering firm at the end of a fiscal quarter. Issuer Battalion Oil Corporation Issuance Date / Maturity Date Initial issuance on March 23, 2023; Incremental issuance on September 6, 2023; Incremental issuance in December 2023 / Matures November 24, 2025 Aggregate Amount $25 million (25,000 shares) initial issuance; $38 million (38,000 shares) incremental issuance; $35 million (35,000 shares) incremental issuance contemplated in December Liquidation Preference Purchase price plus accrued but unpaid dividends Voting Rights Holders of preferred stock have no voting rights with respect to the shares of preferred stock Dividends Dividends at a fixed rate of either 14.5% per annum in cash or 16.0% per annum PIK on the Liquidation Preference; compounding and accruing quarterly in arrears Currently, the Company’s Amended Term Loan Agreement prohibits the payment of cash dividends Conversion Holders of preferred stock may convert their shares into common stock at a conversion ratio (the “Conversion Ratio”) equal to the then applicable Liquidation Preference at the time of conversion divided by the then applicable conversion price ($9.03 per share for initial issuance; $7.63 per share for incremental issuance; incremental December issuance based on an 18.0% premium to the volume weighted average price of common stock for the 20 trading days immediately preceding the closing date) Company has the right to convert outstanding shares of preferred stock into common stock at the Conversion Ratio should the Company meet certain calculated valuation metrics(1) which when divided by the number of outstanding shares of common stock equals or exceeds 130% of the conversion price Redemption Features (Company) Company has the option to redeem the preferred stock in cash for an amount per share of preferred stock equal to (the “Redemption Price”): < 120 days following the closing date: 100% of the Liquidation Preference; On or after 120 days and < 180 days following the closing date: 102% of the Liquidation Preference; On or after 180 days and prior to the first anniversary of the closing date: 105% of the Liquidation Preference; After first anniversary and prior to the second anniversary of the closing date: 108% of the Liquidation Preference; After second anniversary of the closing date: 120% of the Liquidation Preference at such time Redemption Features (Change of Control) On or prior to 150 days following the issuance date, and at the election of the Company, a cash payment equal to the Liquidation Preference or equity consideration equal to the 107.5% of the Liquidation Preference, or > 150 days following the issuance date, the Company shall offer each Holder a cash payment equal to the Redemption Price. Holders may elect conversion into common stock at the Conversion Ratio 43 |
| Page 1. Executive Summary 3 2. Financial Analyses 8 3. Selected Public Market Observations 29 4. Appendix 34 Weighted Average Cost of Capital Calculation 35 Observed Premiums Paid Analysis 38 Selected Series A Convertible Preferred Stock Terms 41 Glossary of Selected Terms 44 5. Disclaimer 47 |
| CONFIDENTIAL - PRELIMINARY DRAFT - SUBJECT TO FURTHER REVIEW 12M refers to Twelve Month 1P refers to proven reserves A refers to Actual Adj. refers to Adjusted Adjusted EBITDA refers to Earnings Before Interest, Taxes, Depreciation and Amortization, adjusted for certain non-recurring items AGI refers to Acid Gas Injection Avg refers to Average Bblpd refers to Barrels per Day Boe refers to Barrels of Oil Equivalent Boepd refers to Barrels of Oil Equivalent per Day CAGR refers to Compound Annual Growth Rate CAPEX refers to Capital Expenditures CY refers to Calendar Year DCF refers to Discounted Cash Flow Disc. refers to discount E refers to Estimated EBIT refers to Earnings Before Interest and Taxes EBITDA refers to Earnings Before Interest, Taxes, Depreciation and Amortization EPS refers to Earnings Per Share EV refers to Enterprise Value FV refers to Fair Value FY refers to Fiscal Year G&A refers to General and Administrative GTO refers to Gathering, Transportation and Other K refers to Thousand L5M refers to most recently completed 5-month period Lbs/ft refers to Pounds per Foot LOE refers to lease operating expenses LOS refers to lease operating schedule LQA refers to Last Quarter Annualized LTM refers to Most recently completed 12-month period for which financial information has been made public or available, other than for the Company, in which case LTM refers to Latest 12 Months Mbbl refers to One Thousand Barrels Mboe refers to One Thousand Barrel of Oil Equivalent Mcf refers to Thousand Cubic Feet Mcfpd refers to Million Cubic Feet per day MM refers to Million Mmboe refers to One Million Barrels of Oil Equivalent MMcf refers to Million Cubic Feet Mo refers to Month NA refers to Not Applicable NAV refers to Net Asset Value NDA refers to Non-Disclosure Agreement NFY refers to Refers to the next fiscal year for which financial information has not been made public, other than for the Company, in which case NFY refers to Next Fiscal Year Glossary of Selected Terms 45 |
| CONFIDENTIAL - PRELIMINARY DRAFT - SUBJECT TO FURTHER REVIEW NFY+1 refers to Next Fiscal Year following NFY NGL refers to Natural Gas Liquid NMF refers to Not Meaningful Figure NTM refers to Next Twelve Months NYMEX refers to New York Mercantile Exchange P&A refers to Plugging and Abandonment PDNP refers to Proved Developed Non-Producing PDP refers to Proved Developed Producing Prem. refers to premium PROB refers to Probable POSS refers to Possible PUD refers to Proved Undeveloped PV refers to Present Value PV-10 refers to present value discounted at ten percent Q refers to Quarter R/P refers to Reserves/Production RADR refers to Risk-Adjusted Discount Rates RAF refers to Reserve Adjustment Factors RSU refers to Restricted Stock Unit SPEE refers to Society of Petroleum Evaluation Engineers SWD refers to Saltwater Disposal UCF refers to Unlevered Cash Flow VWAP refers to Volume-Weighted Average Price WACC refers to Weighted Average Cost of Capital WTI refers to West Texas Intermediate YoY refers to Year-over-Year YTD refers to Year to Date Glossary of Selected Terms (cont.) 46 |
| Page 1. Executive Summary 3 2. Financial Analyses 8 3. Selected Public Market Observations 29 4. Appendix 34 5. Disclaimer 47 |
| CONFIDENTIAL - PRELIMINARY DRAFT - SUBJECT TO FURTHER REVIEW This presentation, and any supplemental information (written or oral) or other documents provided in connection therewith (collectively, the “materials”), are provided solely for the information of the Board of Directors (the “Board”) of Battalion Oil Corporation (the “Company”) by Houlihan Lokey in connection with the Board’s consideration of a potential transaction (the “Transaction”) involving the Company. This presentation is incomplete without reference to, and should be considered in conjunction with, any supplemental information provided by and discussions with Houlihan Lokey in connection therewith. Any defined terms used herein shall have the meanings set forth herein, even if such defined terms have been given different meanings elsewhere in the materials. The materials are for discussion purposes only. Houlihan Lokey expressly disclaims any and all liability, whether direct or indirect, in contract or tort or otherwise, to any person in connection with the materials. The materials were prepared for specific persons familiar with the business and affairs of the Company for use in a specific context and were not prepared with a view to public disclosure or to conform with any disclosure standards under any state, federal or international securities laws or other laws, rules or regulations, and none of the Board, the Company or Houlihan Lokey takes any responsibility for the use of the materials by persons other than the Board. The materials are provided on a confidential basis solely for the information of the Board and may not be disclosed, summarized, reproduced, disseminated or quoted or otherwise referred to, in whole or in part, without Houlihan Lokey’s express prior written consent, except as expressly permitted by Houlihan Lokey’s engagement letter with the Company. Notwithstanding any other provision herein, the Company (and each employee, representative or other agent of the Company) may disclose to any and all persons without limitation of any kind, the tax treatment and tax structure of any transaction and all materials of any kind (including opinions or other tax analyses, if any) that are provided to the Company relating to such tax treatment and structure. However, any information relating to the tax treatment and tax structure shall remain confidential (and the foregoing sentence shall not apply) to the extent necessary to enable any person to comply with securities laws. For this purpose, the tax treatment of a transaction is the purported or claimed U.S. income or franchise tax treatment of the transaction and the tax structure of a transaction is any fact that may be relevant to understanding the purported or claimed U.S. income or franchise tax treatment of the transaction. If the Company plans to disclose information pursuant to the first sentence of this paragraph, the Company shall inform those to whom it discloses any such information that they may not rely upon such information for any purpose without Houlihan Lokey’s prior written consent. Houlihan Lokey is not an expert on, and nothing contained in the materials should be construed as advice with regard to, legal, accounting, regulatory, insurance, tax or other specialist matters. Houlihan Lokey’s role in reviewing any information was limited solely to performing such a review as it deemed necessary to support its own advice and analysis and was not on behalf of the Board. The materials necessarily are based on financial, economic, market and other conditions as in effect on, and the information available to Houlihan Lokey as of, the date of the materials. Although subsequent developments may affect the contents of the materials, Houlihan Lokey has not undertaken, and is under no obligation, to update, revise or reaffirm the materials. The materials are not intended to provide the sole basis for evaluation of the Transaction and do not purport to contain all information that may be required. The materials do not address the underlying business decision of the Company or any other party to proceed with or effect the Transaction, or the relative merits of the Transaction as compared to any alternative business strategies or transactions that might be available for the Company or any other party. The materials do not constitute any opinion, nor do the materials constitute a recommendation to the Board, the Company, any security holder of the Company or any other party as to how to vote or act with respect to any matter relating to the Transaction or otherwise or whether to buy or sell any assets or securities of any company. Houlihan Lokey’s only opinion is the opinion, if any, that is actually delivered to the Board. In preparing the materials Houlihan Lokey has acted as an independent contractor and nothing in the materials is intended to create or shall be construed as creating a fiduciary or other relationship between Houlihan Lokey and any party. The materials may not reflect information known to other professionals in other business areas of Houlihan Lokey and its affiliates. Disclaimer 48 |
| CONFIDENTIAL - PRELIMINARY DRAFT - SUBJECT TO FURTHER REVIEW The preparation of the materials was a complex process involving quantitative and qualitative judgments and determinations with respect to the financial, comparative and other analytic methods employed and the adaption and application of these methods to the unique facts and circumstances presented and, therefore, is not readily susceptible to partial analysis or summary description. Furthermore, Houlihan Lokey did not attribute any particular weight to any analysis or factor considered by it, but rather made qualitative judgments as to the significance and relevance of each analysis and factor. Each analytical technique has inherent strengths and weaknesses, and the nature of the available information may further affect the value of particular techniques. Accordingly, the analyses contained in the materials must be considered as a whole. Selecting portions of the analyses, analytic methods and factors without considering all analyses and factors could create a misleading or incomplete view. The materials reflect judgments and assumptions with regard to industry performance, general business, economic, regulatory, market and financial conditions and other matters, many of which are beyond the control of the participants in the Transaction. Any estimates of value contained in the materials are not necessarily indicative of actual value or predictive of future results or values, which may be significantly more or less favorable. Any analyses relating to the value of assets, businesses or securities do not purport to be appraisals or to reflect the prices at which any assets, businesses or securities may actually be sold. The materials do not constitute a credit rating. In preparing the materials, Houlihan Lokey has not conducted any physical inspection or independent appraisal or evaluation of any of the assets, properties or liabilities (contingent or otherwise) of the Company or any other party and has no obligation to evaluate the solvency of the Company or any other party under any law. All budgets, projections, estimates, financial analyses, reports and other information with respect to operations reflected in the materials have been prepared by management of the relevant party or are derived from such budgets, projections, estimates, financial analyses, reports and other information or from other sources, which involve numerous and significant subjective determinations made by management of the relevant party and/or which such management has reviewed and found reasonable. The budgets, projections and estimates contained in the materials may or may not be achieved and differences between projected results and those actually achieved may be material. Houlihan Lokey has relied upon representations made by management of the Company that such budgets, projections and estimates have been reasonably prepared in good faith on bases reflecting the best currently available estimates and judgments of such management (or, with respect to information obtained from public sources, represent reasonable estimates), and Houlihan Lokey expresses no opinion with respect to such budgets, projections or estimates or the assumptions on which they are based. The scope of the financial analysis contained herein is based on discussions with the Company (including, without limitation, regarding the methodologies to be utilized), and Houlihan Lokey does not make any representation, express or implied, as to the sufficiency or adequacy of such financial analysis or the scope thereof for any particular purpose. Houlihan Lokey has assumed and relied upon the accuracy and completeness of the financial and other information provided to, discussed with or reviewed by it without (and without assuming responsibility for) independent verification of such information, makes no representation or warranty (express or implied) in respect of the accuracy or completeness of such information and has further relied upon the assurances of the Company that it is not aware of any facts or circumstances that would make such information inaccurate or misleading. In addition, Houlihan Lokey has relied upon and assumed, without independent verification, that there has been no change in the business, assets, liabilities, financial condition, results of operations, cash flows or prospects of the Company or any other participant in the Transaction since the respective dates of the most recent financial statements and other information, financial or otherwise, provided to, discussed with or reviewed by Houlihan Lokey that would be material to its analyses, and that the final forms of any draft documents reviewed by Houlihan Lokey will not differ in any material respect from such draft documents. Disclaimer (cont.) 49 |
| CONFIDENTIAL - PRELIMINARY DRAFT - SUBJECT TO FURTHER REVIEW The materials are not an offer to sell or a solicitation of an indication of interest to purchase any security, option, commodity, future, loan or currency. The materials do not constitute a commitment by Houlihan Lokey or any of its affiliates to underwrite, subscribe for or place any securities, to extend or arrange credit, or to provide any other services. In the ordinary course of business, certain of Houlihan Lokey’s affiliates and employees, as well as investment funds in which they may have financial interests or with which they may co-invest, may acquire, hold or sell, long or short positions, or trade or otherwise effect transactions, in debt, equity, and other securities and financial instruments (including loans and other obligations) of, or investments in, the Company, any Transaction counterparty, any other Transaction participant, any other financially interested party with respect to any transaction, other entities or parties that are mentioned in the materials, or any of the foregoing entities’ or parties’ respective affiliates, subsidiaries, investment funds, portfolio companies and representatives (collectively, the “Interested Parties”), or any currency or commodity that may be involved in the Transaction. Houlihan Lokey provides mergers and acquisitions, restructuring and other advisory and consulting services to clients, which may have in the past included, or may currently or in the future include, one or more Interested Parties, for which services Houlihan Lokey has received, and may receive, compensation. Although Houlihan Lokey in the course of such activities and relationships or otherwise may have acquired, or may in the future acquire, information about one or more Interested Parties or the Transaction, or that otherwise may be of interest to the Board or the Company, Houlihan Lokey shall have no obligation to, and may not be contractually permitted to, disclose such information, or the fact that Houlihan Lokey is in possession of such information, to the Board or the Company or to use such information on behalf of the Board or the Company. Houlihan Lokey’s personnel may make statements or provide advice that is contrary to information contained in the materials. Disclaimer (cont.) 50 |
| CONFIDENTIAL - PRELIMINARY DRAFT - SUBJECT TO FURTHER REVIEW 51 CORPORATE FINANCE FINANCIAL RESTRUCTURING FINANCIAL AND VALUATION ADVISORY HL.com |
Exhibit 99.(C)(v)
| Project San Jacinto SUPPLEMENTAL SCHEDULES FOR THE BOARD OF DIRECTORS OF BATTALION OIL CORPORATION NOVEMBER 4 , 2023 | CONFIDENTIAL | PRELIMINARY DRAFT | SUBJECT TO FURTHER REVIEW |
| CONFIDENTIAL - PRELIMINARY DRAFT - SUBJECT TO FURTHER REVIEW Table of Contents 2 Page 1. Selected Public Market Observations 3 2. Benchmarking Data 7 3. Selected Technical Observations 12 4. Pricing 27 5. NAV Analysis Detail 29 6. Glossary of Selected Terms 36 7. Disclaimer 39 |
| Page 1. Selected Public Market Observations 3 2. Benchmarking Data 7 3. Selected Technical Observations 12 4. Pricing 27 5. NAV Analysis Detail 29 6. Glossary of Selected Terms 36 7. Disclaimer 39 |
| CONFIDENTIAL - PRELIMINARY DRAFT - SUBJECT TO FURTHER REVIEW Selected Float and Trading Data Average Daily Volume1 / Shares Outstanding Average Daily Volume1 / Public Float 1. Based on 90-day average trading volume as of 11/1/23. CPE refers to Callon Petroleum Company, HPK refers to HighPeak Energy, Inc., MTDR refers to Matador Resources Company, PR refers to Permian Resources Corporation, and VTLE refers to Vital Energy, Inc. 2. Company float excludes shares held by Luminus Management, LLC., Brookfield Corporation, LSP Investment Advisors, LLC., and insiders. Source: Capital IQ as of 11/1/23. 0.1% 2.4% 0.4% 1.2% 3.1% 3.8% Median: 2.4% Company CPE HPK MTDR PR VTLE 0.6% 3.0% 2.2% 1.3% 4.1% 3.3% Median: 3.0% Company [2] CPE HPK MTDR PR VTLE 4 |
| CONFIDENTIAL - PRELIMINARY DRAFT - SUBJECT TO FURTHER REVIEW Selected Float and Trading Data (cont.) Public Float / Shares Outstanding Average Daily Traded Value2 (dollars in millions) 1. Company float excludes shares held by Luminus Management, LLC., Brookfield Corporation, LSP Investment Advisors, LLC., and insiders. 2. Based on 90-day average trading volume as of 11/1/23. CPE refers to Callon Petroleum Company, HPK refers to HighPeak Energy, Inc., MTDR refers to Matador Resources Company, PR refers to Permian Resources Corporation, and VTLE refers to Vital Energy, Inc. Source: Capital IQ as of 11/1/23. $0.1 $61.3 $7.5 $84.6 $135.1 $37.6 Median: $61.3 Company CPE HPK MTDR PR VTLE 21.8% 78.2% 16.9% 92.6% 76.2% 116.8% Median: 78.2% Company [1] CPE HPK MTDR PR VTLE 5 |
| CONFIDENTIAL - PRELIMINARY DRAFT - SUBJECT TO FURTHER REVIEW If Preferred does not convert: If Preferred [1] converts: Common Stock Common Stock Holder Shares % Outstanding Shares % Outstanding Luminus Management, LLC 6.2 37.4% 10.4 42.6% Brookfield Corporation 4.0 24.2% 76.0% 6.1 24.8% 83.9% LSP Investment Advisors, LLC 2.4 14.4% 4.0 16.4% Goldman Sachs Group 0.6 3.8% 0.6 2.5% Lion Point Capital, LP 0.4 2.3% 0.4 1.6% Jefferies Financial Group Inc. 0.4 2.2% 0.4 1.5% Loomis Sayles & Company, L.P. 0.3 1.8% 0.3 1.2% The Vanguard Group, Inc. 0.3 1.7% 0.3 1.2% Current / Former Directors and Executive Officers 0.4 2.2% 0.4 1.5% Other 1.6 9.9% 1.6 6.7% Total 16.5 100.0% 24.5 100.0% Ownership Summary 16.5 million shares Note: Ownership represents data as of 11/1/23. 1. Conversion of Preferred would result in an implied 8.0 million shares on an as converted basis. Illustrative analysis assumes conversion date of 11/2/23, PIK interest rate of 16.0%, and conversion price of $9.03 per share for Series A convertible equity issued prior to 9/6/23 and $7.63 for Incremental Series A convertible equity issued on 9/6/23. Sources: Capital IQ and public filings. (shares in millions) 24.5 million shares 1) Luminus Management, LLC: 37.4% 2) Brookfield Corporation: 24.2% 3) LSP Investment Advisors, LLC: 14.4% 4) Goldman Sachs Group: 3.8% 5) Lion Point Capital, LP: 2.3% 6) Jefferies Financial Group Inc.: 2.2% 7) Loomis Sayles & Company, L.P.: 1.8% 8) The Vanguard Group, Inc.: 1.7% Current / Former Directors and Executive Officers: 2.2% Other: 9.9% 1) Luminus Management, LLC: 42.6% 2) Brookfield Corporation: 24.8% 3) LSP Investment Advisors, LLC: 16.4% 4) Goldman Sachs Group: 2.5% 5) Lion Point Capital, LP: 1.6% 6) Jefferies Financial Group Inc.: 1.5% 7) Loomis Sayles & Company, L.P.: 1.2% 8) The Vanguard Group, Inc.: 1.2% Current / Former Directors and Executive Officers: 1.5% Other: 6.7% 6 |
| Page 1. Selected Public Market Observations 3 2. Benchmarking Data 7 3. Selected Technical Observations 12 4. Pricing 27 5. NAV Analysis Detail 29 6. Glossary of Selected Terms 36 7. Disclaimer 39 |
| CONFIDENTIAL - PRELIMINARY DRAFT - SUBJECT TO FURTHER REVIEW Selected Benchmarking Data Projected Growth (2023E-2024E EBITDA) 1. Shown pro forma for the Permian Earthstone Acquisition. 2023E metrics based on sum of Permian Resources Corporation and Earthtone Energy, Inc. estimates, without impacts of any synergies resulting from the transaction. 2024E estimates are based on Wall Street consensus estimates which reflect the Permian Earthstone Acquisition. 2. Shown pro forma for the Vital Acquisitions. 2023E estimates are not available. Sources: Company management, Capital IQ and public filings. Projected Growth (2023E-2024E Production) 19.0% 18.1% 11.3% 8.1% 3.8% NA Median: 14.7% MTDR HPK PR [1] Company CPE VTLE [2] 30.6% 23.4% 17.0% 15.8% 7.7% NA Median: 20.2% MTDR HPK PR [1] Company CPE VTLE [2] 8 |
| CONFIDENTIAL - PRELIMINARY DRAFT - SUBJECT TO FURTHER REVIEW Selected Benchmarking Data Projected Growth (2024E-2025E EBITDA) 1. Shown pro forma for the Permian Earthstone Acquisition. 2. Shown pro forma for the Vital Acquisitions. Sources: Company management, Capital IQ and public filings. Projected Growth (2024E-2025E Production) 8.4% 8.2% 7.3% 5.8% 0.6% NA Median: 7.0% VTLE [2] MTDR Company PR [1] CPE HPK 7.4% 5.2% 3.9% 2.1% -4.4% NA Median: 4.6% MTDR CPE PR [1] Company VTLE [2] HPK 9 |
| CONFIDENTIAL - PRELIMINARY DRAFT - SUBJECT TO FURTHER REVIEW Selected Benchmarking Data (cont.) 81.6% 46.4% 22.2% 7.4% -0.3% -6.7% Median: 22.2% HPK PR MTDR VTLE CPE Company Internal Investment (2023E Capital Expenditures / EBITDA) Internal Investment (2024E Capital Expenditures / EBITDA) 1. Shown pro forma for the Permian Earthstone Acquisition. 2. Shown pro forma for the Vital Acquisitions. 2023E estimates are not available. Sources: Company management, Capital IQ and public filings. 111.8% 73.2% 70.1% 68.5% 65.0% NA Median: 69.3% HPK Company CPE MTDR PR [1] VTLE [2] 73.2% 63.2% 62.5% 57.0% 51.3% 33.2% Median: 62.5% HPK CPE VTLE [2] MTDR PR [1] Company 10 |
| CONFIDENTIAL - PRELIMINARY DRAFT - SUBJECT TO FURTHER REVIEW Selected Benchmarking Data (cont.) 1. Shown pro forma for the Permian Earthstone Acquisition. 2. Shown pro forma for the Vital Acquisitions. Source: public filings for period ending 12/31/22. 114.9% 72.3% 72.0% 70.2% 65.6% NA Median: 72.1% HPK MTDR CPE VTLE Company PR 2022 Proved Reserves 2022 PV-10 1,035 627 480 359 123 92 Median: 480 PR [1] VTLE [2] CPE MTDR HPK Company $17,780 $10,404 $9,004 $6,983 $3,417 $1,462 Median: $9,004 PR [1] VTLE [2] CPE MTDR HPK Company 11 |
| Page 1. Selected Public Market Observations 3 2. Benchmarking Data 7 3. Selected Technical Observations 12 4. Pricing 27 5. NAV Analysis Detail 29 6. Glossary of Selected Terms 36 7. Disclaimer 39 |
| CONFIDENTIAL - PRELIMINARY DRAFT - SUBJECT TO FURTHER REVIEW 1 10 100 01/2015 01/2016 01/2017 01/2018 01/2019 01/2020 01/2021 01/2022 01/2023 01/2024 01/2025 01/2026 01/2027 01/2028 01/2029 01/2030 Daily Production Bblpd and Mcfpd Historical Oil Historical Gas PDP Production Forecast Review Houlihan Lokey compared gross historical production to gross forecasted production by basin, analyzing (i) production rate and (ii) decline rate: (i) Forecasted production rate is in line with recent output (ii) Forecasted decline rate ties to historical trends Well concentration is well diversified with 80% of PDP value coming from >30% of the Company’s wells Source: Company’s 3Q23 ARIES database Note: Gross production shown; Full historical production is current thru 10/2023; PV10 based on 11/1/23 strip pricing, effective 9/1/2023 Top 80% (41 wells) Bottom 20% (80 wells) 21% NTM Decline Key Points Gross PDP Production Profile PDP Well Concentration Top 80% of PDP value resides within 34% of wells 13 |
| CONFIDENTIAL - PRELIMINARY DRAFT - SUBJECT TO FURTHER REVIEW Monument Draw West Quito Draw Hackberry Draw Fixed LOE ($M / Well / Month) Variable LOE ( $ / Bw) (2) $60.9 - $15.0 $30.0 $45.0 $60.0 YE-19 YE-20 YE-21 YE-22 1Q-23 Yr 1-7 $31.9 - $15.0 $30.0 $45.0 $60.0 YE-19 YE-20 YE-21 YE-22 1Q-23 Yr 1-7 $41.0 - $15.0 $30.0 $45.0 $60.0 YE-19 YE-20 YE-21 YE-22 1Q-23 Yr 1-4 $0.75 - $0.30 $0.60 $0.90 $1.20 $1.50 YE-19 YE-20 YE-21 YE-22 1Q-23 Proj. $0.75 - $0.30 $0.60 $0.90 $1.20 $1.50 YE-19 YE-20 YE-21 YE-22 1Q-23 Proj. $1.08 - $0.30 $0.60 $0.90 $1.20 $1.50 YE-19 YE-20 YE-21 YE-22 1Q-23 Proj. Projection Summaries | PDP LOS - Historical and Projected LOE Set forth below is a summary of the Company’s historical and projected fixed and variable LOE costs Assumes gas lift, which many wells are 2+ years without; switching to rod pump after 7 years production life (similar to legacy wells) Assumes jet pump; switching to rod pump after 4 years production life Assumes jet pump; switching to rod pump after 7 years production life. HBD's reversion date reflects larger volumes for longer SWD Forecast Fixed LOE Forecast Workover 6 Month Average 6Mo Avg. LOE = $27 6Mo Avg. LOE = $31 6Mo Avg. LOE = $41 6 Month Average 6Mo Avg. SWD = $0.87 6Mo Avg. SWD = $0.80 6Mo Avg. SWD = $0.72 Source: Company management. (1) Projections assume stepdowns of ~$29k/well/mo in year 5 for MD; ~$15k in year 8 for WQ; ~$30k in year 8 for HD; (2) Represents WaterBridge Contract. (1) (1) (1) 14 |
| CONFIDENTIAL - PRELIMINARY DRAFT - SUBJECT TO FURTHER REVIEW Total Company GTO ($ / Boe) Total LOE + Workover Excluding GTO ($ / Boe) $11.57 $11.26 $11.35 $13.23 $12.08 $7.78 $8.08 1H-22 2H-22 1Q-23 2Q-23 4Q-23 1Q-24 2Q-24 Asset Overview | PDP LOS – GTO & LOE Cost Breakdown Set forth below are the Company’s historical and projected Gathering, Transportation and Other cost and LOE costs per Boe GTO / Boe Forecast Source: Company management. LOE / Boe Workover / Boe Forecast Decrease primarily driven by AGI, providing low cost treating Q1-24 $8.68 $8.40 $8.02 $8.76 $0.83 $1.51 $0.92 $2.03 $10.45 $9.89 $10.46 1H-22 2H-22 1Q-23 2Q-23 4Q-23 1Q-24 2Q-24 15 |
| CONFIDENTIAL - PRELIMINARY DRAFT - SUBJECT TO FURTHER REVIEW GOR Historical vs. Projections Trend Monument Draw PDP (Historical vs Forecast Detail) | Mcf of Gas to Bbl of Oil Ratio Source: Company provided ARIES reserves database. Current database assumptions for go-forward GOR are in line with recent trends 3.5x 3.6x 3.7x 3.9x 3.9x 4.3x 4.7x 4.6x Jan-23 Feb-23 Mar-23 Apr-23 May-23 Jun-23 Jul-23 Aug-23 4.8x 5.0x 5.1x 5.2x 5.2x YE-23 YE-24 YE-25 YE-26 YE-27 Historical Forecast 16 |
| CONFIDENTIAL - PRELIMINARY DRAFT - SUBJECT TO FURTHER REVIEW LOE Historical vs. Projections Trend Source: Company provided ARIES reserves database. 1. Excludes July 2023 2. Excludes prior period workover adjustment Current database assumptions for go-forward LOE + Workover Expenses (Excluding GTO) are in line with the last 5 months LOE (Historical vs Forecast Detail) | $ / boe Historical LOE Historical Workover Forecast L5M Average (1) $8.62 $8.24 $7.22 $8.19 $9.03 $9.12 $8.32 $10.25 $0.61 $0.55 $1.55 $2.66 $1.14 $2.24 $1.59 $9.23 $8.79 $8.77 $10.85 $10.17 $11.36 $8.32 $11.83 Jan-23 Feb-23 Mar-23 Apr-23 May-23 Jun-23 Jul-23 Aug-23 (2) $10.45 $10.67 $9.51 $8.52 $8.50 YE-23 YE-24 YE-25 YE-26 YE-27 17 |
| CONFIDENTIAL - PRELIMINARY DRAFT - SUBJECT TO FURTHER REVIEW CONFIDENTIAL - PRELIMINARY DRAFT - SUBJECT TO FURTHER REVIEW Type Curve Decline Monument Draw | 3BS Type Well Selection Map Monument Draw type wells completed on or after 2015 with proppant loading greater than 1,500 lbs/ft Company Parameters Lateral Length 10,000’ Peak Rate: Oil (Bblpd) / Wet Gas (Mcfpd) 1,230 / 1,792 Initial Decline (%): Oil / Gas 80% / 62% b-factor: Oil / Gas 1.2 / 1.2 EURT: Oil (Mbbl) / Wet Gas (Mmcf) (1) 819 / 2,087 EURT: (2-Stream Mboe) / % Oil (1) 1,167 / 70% Type Curve Type Wells BATL Type Wells Avg Source: Company management. (1) EURT: Technical EUR with 50 year cut off 18 |
| CONFIDENTIAL - PRELIMINARY DRAFT - SUBJECT TO FURTHER REVIEW CONFIDENTIAL - PRELIMINARY DRAFT - SUBJECT TO FURTHER REVIEW Type Curve Decline Monument Draw | WCA Type Well Selection Map Monument Draw type wells completed on or after 2015 with proppant loading greater than 1,500 lbs/ft Company Parameters Lateral Length 10,000’ Peak Rate: Oil (Bblpd) / Wet Gas (Mcfpd) 956 / 1,374 Initial Decline (%): Oil / Gas 66% / 49% b-factor: Oil / Gas 1.2 / 1.2 EURT: Oil (Mbbl) / Wet Gas (Mmcf) (1) 1,012 / 2,285 EURT: (2-Stream Mboe) / % Oil (1) 1,393 / 73% Type Curve Type Wells BATL Type Wells Avg Source: Company management (1) EURT: Technical EUR with 50 year cut off 19 |
| CONFIDENTIAL - PRELIMINARY DRAFT - SUBJECT TO FURTHER REVIEW CONFIDENTIAL - PRELIMINARY DRAFT - SUBJECT TO FURTHER REVIEW Type Curve Decline Monument Draw | WCB Type Well Selection Map Company Parameters Lateral Length 10,000’ Peak Rate: Oil (Bblpd) / Wet Gas (Mcfpd) 885 / 1,264 Initial Decline (%): Oil / Gas 67% / 39% b-factor: Oil / Gas 1.2 / 1.2 EURT: Oil (Mbbl) / Wet Gas (Mmcf) (1) 914 / 2,693 EURT: (2-Stream Mboe) / % Oil (1) 1,363 / 67% Monument Draw type wells completed on or after 2015 with proppant loading greater than 1,500 lbs/ft Type Curve Type Wells BATL Type Wells Avg Source: Company management (1) EURT: Technical EUR with 50 year cut off 20 |
| CONFIDENTIAL - PRELIMINARY DRAFT - SUBJECT TO FURTHER REVIEW CONFIDENTIAL - PRELIMINARY DRAFT - SUBJECT TO FURTHER REVIEW Type Curve Decline West Quito Draw | 3BS Type Well Selection Map West Quito Draw type wells completed on or after 2015 with proppant loading greater than 1,700 lbs/ft Company Parameters Lateral Length 10,000’ Peak Rate: Oil (Bblpd) / Wet Gas (Mcfpd) 682 / 5,135 Initial Decline (%): Oil / Gas 74% / 73% b-factor: Oil / Gas 1.2 / 1.2 EURT: Oil (Mbbl) / Wet Gas (Mmcf) (1) 552 / 4,307 EURT: (2-Stream Mboe) / % Oil (1) 1,269 / 43% Type Curve Type Wells BATL Type Wells Avg Source: Company management (1) EURT: Technical EUR with 50 year cut off 21 |
| CONFIDENTIAL - PRELIMINARY DRAFT - SUBJECT TO FURTHER REVIEW CONFIDENTIAL - PRELIMINARY DRAFT - SUBJECT TO FURTHER REVIEW Type Curve Decline West Quito Draw | WCA Type Well Selection Map West Quito Draw type wells completed on or after 2015 with proppant loading greater than 1,700 lbs/ft Company Parameters Lateral Length 10,000’ Peak Rate: Oil (Bblpd) / Wet Gas (Mcfpd) 563 / 4,634 Initial Decline (%): Oil / Gas 64% / 62% b-factor: Oil / Gas 1.2 / 1.2 EURT: Oil (Mbbl) / Wet Gas (Mmcf) (1) 631 / 5,521 EURT: (2-Stream Mboe) / % Oil (1) 1,552 / 41% Type Curve Type Wells BATL Type Wells Avg Source: Company management (1) EURT: Technical EUR with 50 year cut off 22 |
| CONFIDENTIAL - PRELIMINARY DRAFT - SUBJECT TO FURTHER REVIEW CONFIDENTIAL - PRELIMINARY DRAFT - SUBJECT TO FURTHER REVIEW Type Curve Decline West Quito Draw | WCB Type Well Selection Map West Quito Draw type wells completed on or after 2015 with proppant loading greater than 1,700 lbs/ft Company Parameters Lateral Length 10,000’ Peak Rate: Oil (Bblpd) / Wet Gas (Mcfpd) 494 / 5,636 Initial Decline (%): Oil / Gas 74% / 68% b-factor: Oil / Gas 1.2 / 1.2 EURT: Oil (Mbbl) / Wet Gas (Mmcf) (1) 412 / 5,413 EURT: (2-Stream Mboe) / % Oil (1) 1,315 / 31% Type Curve Type Wells BATL Type Wells Avg Source: Company management (1) EURT: Technical EUR with 50 year cut off 23 |
| CONFIDENTIAL - PRELIMINARY DRAFT - SUBJECT TO FURTHER REVIEW CONFIDENTIAL - PRELIMINARY DRAFT - SUBJECT TO FURTHER REVIEW Type Curve Decline Hackberry Draw | 3BS Type Well Selection Map Hackberry Draw type wells completed on or after 2015 with proppant loading greater than 2,000 lbs/ft Company Parameters Lateral Length 10,000’ Peak Rate: Oil (Bblpd) / Wet Gas (Mcfpd) 508 / 525 Initial Decline (%): Oil / Gas 62% / 34% b-factor: Oil / Gas 1.1 / 1.2 EURT: Oil (Mbbl) / Wet Gas (Mmcf) (1) 568 / 1,313 EURT: (2-Stream Mboe) / % Oil (1) 787 / 72% Type Curve Type Wells BATL Type Wells Avg Source: Company management (1) EURT: Technical EUR with 50 year cut off 24 |
| CONFIDENTIAL - PRELIMINARY DRAFT - SUBJECT TO FURTHER REVIEW CONFIDENTIAL - PRELIMINARY DRAFT - SUBJECT TO FURTHER REVIEW Type Curve Decline Hackberry Draw | WCA Type Well Selection Map Hackberry Draw type wells completed on or after 2015 with proppant loading greater than 2,000 lbs/ft Company Parameters Lateral Length 10,000’ Peak Rate: Oil (Bblpd) / Wet Gas (Mcfpd) 561 / 820 Initial Decline (%): Oil / Gas 65% / 33% b-factor: Oil / Gas 1.2 / 1.2 EURT: Oil (Mbbl) / Wet Gas (Mmcf) (1) 608 / 2,033 EURT: (2-Stream Mboe) / % Oil (1) 947 / 64% Type Curve Type Wells BATL Type Wells Avg Source: Company management (1) EURT: Technical EUR with 50 year cut off 25 |
| CONFIDENTIAL - PRELIMINARY DRAFT - SUBJECT TO FURTHER REVIEW CONFIDENTIAL - PRELIMINARY DRAFT - SUBJECT TO FURTHER REVIEW Type Curve Decline Hackberry Draw | WCB Type Well Selection Map Hackberry Draw type wells completed on or after 2015 with proppant loading greater than 2,000 lbs/ft Company Parameters Lateral Length 10,000’ Peak Rate: Oil (Bblpd) / Wet Gas (Mcfpd) 626 / 1,110 Initial Decline (%): Oil / Gas 74% / 34% b-factor: Oil / Gas 1.2 / 1.2 EURT: Oil (Mbbl) / Wet Gas (Mmcf) (1) 525 / 2,694 EURT: (2-Stream Mboe) / % Oil (1) 974 / 54% Type Curve Type Wells BATL Type Wells Avg Source: Company management (1) EURT: Technical EUR with 50 year cut off 26 |
| Page 1. Selected Public Market Observations 3 2. Benchmarking Data 7 3. Selected Technical Observations 12 4. Pricing 27 5. NAV Analysis Detail 29 6. Glossary of Selected Terms 36 7. Disclaimer 39 |
| CONFIDENTIAL - PRELIMINARY DRAFT - SUBJECT TO FURTHER REVIEW Commodity Pricing Summary (dollars in actuals) WTI Comparison Natural Gas Comparison Source: Capital IQ as of 11/1/23. Date NYMEX Strip Case NYMEX Strip +10% Pricing NYMEX Strip -10% Pricing Natural Gas Crude Oil - WTI Natural Gas Crude Oil - WTI Natural Gas Crude Oil - WTI 2023 $3.10 $84.54 $3.10 $84.54 $3.10 $84.54 2024 $3.57 $77.65 $3.57 $77.65 $3.57 $77.65 2025 $4.10 $73.19 $4.34 $77.41 $3.86 $68.97 2026 $4.12 $69.87 $4.54 $76.85 $3.71 $62.88 2027 $4.06 $67.31 $4.46 $74.04 $3.65 $60.58 After $4.06 $67.31 $4.46 $74.04 $3.65 $60.58 $0.00 $20.00 $40.00 $60.00 $80.00 $100.00 2023 2024 2025 2026 2027 After NYMEX Strip Case NYMEX Strip +10% Pricing NYMEX Strip -10% Pricing $0.00 $1.00 $2.00 $3.00 $4.00 $5.00 2023 2024 2025 2026 2027 After NYMEX Strip Case NYMEX Strip +10% Pricing NYMEX Strip -10% Pricing 28 |
| Page 1. Selected Public Market Observations 3 2. Benchmarking Data 7 3. Selected Technical Observations 12 4. Pricing 27 5. NAV Analysis Detail 29 6. Glossary of Selected Terms 36 7. Disclaimer 39 |
| CONFIDENTIAL - PRELIMINARY DRAFT - SUBJECT TO FURTHER REVIEW NAV Detail Strip Analysis (dollars in thousands) Note: Present values as of 9/1/2023. 1. Taxes include Production and Ad Valorem taxes. Source: Company management and Bloomberg. PDP Production (Net Mboe) Revenue Taxes [1] Operating Expenses Capital Expenditures Abandonment Expenses Salvage Gain Undiscounted Cash Flow Discounted Cash Flow (PV10) 2023E 1,550.4 $77,863.5 $4,844.5 $35,677.0 $0.0 $0.0 $0.0 $37,342.0 $36,769.7 2024E 3,992.4 $183,513.3 $11,465.2 $78,464.0 $0.0 $0.0 $0.0 $93,584.1 $86,751.4 2025E 3,337.7 $145,393.6 $9,125.1 $64,783.0 $0.0 $0.0 $0.0 $71,485.5 $60,134.8 2026E 2,914.4 $121,574.5 $7,743.4 $55,519.8 $0.0 $7,083.9 $461.0 $51,688.3 $39,431.0 2027E 2,605.9 $104,759.2 $6,701.7 $51,395.4 $0.0 $230.5 $15.0 $46,446.6 $32,277.8 2028E 2,359.0 $94,590.8 $6,101.5 $48,531.1 $0.0 $461.0 $30.0 $39,527.3 $24,973.5 2029E 2,149.3 $85,841.6 $5,757.2 $45,130.8 $0.0 $9.3 $0.6 $34,944.8 $20,073.2 2030E 1,985.6 $79,151.3 $5,363.1 $43,152.8 $0.0 $49.3 $3.2 $30,589.3 $15,971.3 2031E 1,837.6 $73,222.8 $4,961.9 $41,319.4 $0.0 $461.0 $30.0 $26,510.4 $12,588.1 2032E 1,705.5 $67,916.1 $4,603.1 $39,111.3 $0.0 $0.0 $0.0 $24,201.7 $10,443.4 2033E 1,584.7 $63,000.9 $4,271.6 $37,652.7 $0.0 $240.4 $15.6 $20,851.9 $8,178.9 2034E 1,451.1 $57,687.0 $3,910.8 $35,515.1 $0.0 $230.5 $15.0 $18,045.6 $6,435.5 2035E 1,324.4 $52,744.6 $3,573.8 $33,463.1 $0.0 $691.5 $45.0 $15,061.2 $4,887.2 2036E 1,211.9 $48,379.3 $3,275.5 $31,715.5 $0.0 $691.7 $45.0 $12,741.6 $3,763.0 2037E 1,080.7 $43,210.9 $2,923.8 $29,031.1 $0.0 $624.3 $40.6 $10,672.3 $2,861.5 2038E 960.1 $38,305.5 $2,592.7 $26,334.0 $0.0 $1,151.7 $74.9 $8,302.0 $2,024.2 2039E 849.1 $33,810.7 $2,289.4 $23,803.1 $0.0 $0.0 $0.0 $7,718.2 $1,710.0 2040E 760.7 $30,259.6 $2,049.9 $21,973.0 $0.0 $1,844.0 $120.0 $4,512.7 $905.6 2041E 659.3 $26,106.4 $1,770.7 $19,405.2 $0.0 $1,383.0 $90.0 $3,637.4 $668.9 2042E 568.3 $22,622.4 $1,531.8 $17,288.4 $0.0 $893.2 $58.1 $2,967.1 $496.3 2043E 497.0 $19,885.2 $1,343.9 $15,729.6 $0.0 $922.0 $60.0 $1,949.6 $297.5 2044E 421.2 $16,773.1 $1,134.6 $13,686.7 $0.0 $1,075.7 $70.0 $946.1 $130.9 2045E 331.6 $13,108.0 $888.0 $10,958.8 $0.0 $921.5 $60.0 $399.5 $50.7 2046E 280.2 $10,885.9 $740.7 $9,445.6 $0.0 $883.6 $57.5 ($126.6) ($12.9) 2047E 212.6 $8,069.6 $551.8 $7,263.4 $0.0 $1,287.2 $83.8 ($949.0) ($96.0) 2048E 169.8 $6,219.8 $429.0 $5,859.0 $0.0 $883.8 $57.5 ($894.5) ($84.2) 2049E 126.2 $4,254.8 $300.1 $4,255.0 $0.0 $863.2 $56.2 ($1,107.3) ($94.0) 2050E 118.1 $3,969.0 $280.1 $4,001.8 $0.0 $1,379.3 $89.8 ($1,602.5) ($124.7) 2051E 101.0 $3,341.9 $236.8 $2,668.6 $0.0 $821.2 $53.4 ($331.2) ($23.0) 2052E 88.0 $2,872.0 $204.2 $1,736.4 $0.0 $234.0 $15.2 $712.7 $45.2 2053E 82.6 $2,697.9 $191.8 $1,700.9 $0.0 $0.0 $0.0 $805.2 $47.0 2054E 76.2 $2,485.5 $176.7 $1,620.3 $0.0 $230.5 $15.0 $473.0 $25.0 2055E 68.7 $2,239.1 $159.2 $1,496.5 $0.0 $0.0 $0.0 $583.4 $28.1 2056E 64.6 $2,104.8 $149.7 $1,468.9 $0.0 $0.0 $0.0 $486.2 $21.3 2057E 60.7 $1,978.5 $140.7 $1,443.0 $0.0 $200.9 $13.1 $207.0 $8.4 2058E 57.0 $1,859.8 $132.3 $1,418.6 $0.0 $0.0 $0.0 $308.9 $11.2 2059E 50.8 $1,662.0 $118.1 $1,314.6 $0.0 $0.0 $0.0 $229.2 $7.6 2060E 45.8 $1,502.5 $106.7 $1,237.0 $0.0 $0.0 $0.0 $158.9 $4.8 2061E 38.9 $1,286.3 $91.1 $1,099.9 $0.0 $0.0 $0.0 $95.2 $2.6 2062E 24.7 $833.0 $58.6 $728.4 $0.0 $190.3 $12.4 ($131.9) ($3.3) 2063E 17.8 $612.8 $42.9 $556.5 $0.0 $0.0 $0.0 $13.4 $0.3 2064E 12.6 $443.0 $30.8 $423.0 $0.0 $221.9 $14.4 ($218.4) ($4.6) 2065E 8.6 $266.9 $19.3 $272.4 $0.0 $635.0 $41.3 ($618.5) ($11.7) 2066E 0.0 $0.0 $0.0 $0.0 $0.0 $220.8 $14.4 ($206.5) ($3.4) 2067E 0.0 $0.0 $0.0 $0.0 $0.0 $230.5 $15.0 ($215.5) ($3.2) 2068E 0.0 $0.0 $0.0 $0.0 $0.0 $345.1 $22.5 ($322.6) ($4.3) 2069E 0.0 $0.0 $0.0 $0.0 $0.0 $0.0 $0.0 $0.0 $0.0 2070E 0.0 $0.0 $0.0 $0.0 $0.0 $0.0 $0.0 $0.0 $0.0 2071E 0.0 $0.0 $0.0 $0.0 $0.0 $0.0 $0.0 $0.0 $0.0 2072E 0.0 $0.0 $0.0 $0.0 $0.0 $0.0 $0.0 $0.0 $0.0 2073E 0.0 $0.0 $0.0 $0.0 $0.0 $0.0 $0.0 $0.0 $0.0 Total 37,842.7 $1,559,305.1 $102,384.0 $869,650.7 $0.0 $27,591.8 $1,795.6 $561,474.1 $371,560.6 30 |
| CONFIDENTIAL - PRELIMINARY DRAFT - SUBJECT TO FURTHER REVIEW NAV Detail Strip Analysis (cont.) (dollars in thousands) Note: Present values as of 9/1/2023. 1. Taxes include Production and Ad Valorem taxes. Source: Company management and Bloomberg. Production (Net Mboe) Revenue Taxes [1] Operating Expenses Capital Expenditures Abandonment Expenses Salvage Gain Undiscounted Cash Flow Discounted Cash Flow (PV10) 2023E 63.4 $4,354.0 $271.4 $753.3 $33,357.8 $0.0 $0.0 ($30,028.5) ($29,669.5) 2024E 751.1 $45,821.4 $2,882.0 $11,198.0 $35,718.4 $0.0 $0.0 ($3,977.1) ($3,809.7) 2025E 1,789.4 $102,156.1 $6,457.6 $21,410.0 $126,853.2 $0.0 $0.0 ($52,564.7) ($45,118.8) 2026E 3,027.4 $162,856.2 $10,340.9 $35,288.2 $130,956.3 $0.0 $0.0 ($13,729.2) ($11,242.9) 2027E 3,899.0 $187,210.3 $12,090.4 $47,152.7 $124,906.2 $0.0 $0.0 $3,061.0 $1,867.3 2028E 5,057.4 $238,757.5 $15,475.2 $57,461.8 $139,194.5 $0.0 $0.0 $26,626.1 $16,645.4 2029E 4,255.5 $200,382.6 $13,000.5 $53,713.7 $4,740.5 $0.0 $0.0 $128,927.9 $74,324.5 2030E 2,940.7 $133,982.4 $8,760.7 $44,621.4 $0.0 $0.0 $0.0 $80,600.3 $42,161.3 2031E 2,305.0 $104,603.9 $6,846.1 $38,400.7 $0.0 $0.0 $0.0 $59,357.1 $28,203.2 2032E 1,919.3 $86,977.2 $5,694.2 $33,616.1 $0.0 $0.0 $0.0 $47,666.9 $20,582.4 2033E 1,655.9 $74,970.1 $4,909.2 $30,586.9 $0.0 $0.0 $0.0 $39,474.0 $15,487.3 2034E 1,462.5 $66,162.1 $4,333.2 $27,909.7 $0.0 $0.0 $0.0 $33,919.3 $12,098.4 2035E 1,313.3 $59,379.5 $3,889.5 $26,527.2 $0.0 $0.0 $0.0 $28,962.8 $9,391.9 2036E 1,194.4 $53,972.2 $3,535.7 $25,778.6 $0.0 $0.0 $0.0 $24,658.0 $7,268.6 2037E 1,096.9 $49,546.8 $3,246.1 $25,165.4 $0.0 $0.0 $0.0 $21,135.3 $5,663.6 2038E 1,015.4 $45,844.6 $3,003.8 $24,652.2 $0.0 $0.0 $0.0 $18,188.6 $4,430.8 2039E 945.6 $42,677.4 $2,796.6 $24,213.1 $0.0 $0.0 $0.0 $15,667.8 $3,469.8 2040E 884.3 $39,896.2 $2,614.5 $23,827.0 $0.0 $0.0 $0.0 $13,454.7 $2,708.9 2041E 829.0 $37,395.8 $2,450.8 $23,478.9 $0.0 $0.0 $0.0 $11,466.2 $2,098.8 2042E 778.4 $35,112.3 $2,301.1 $23,160.3 $0.0 $0.0 $0.0 $9,650.9 $1,606.2 2043E 731.6 $32,998.5 $2,162.6 $22,864.9 $0.0 $0.0 $0.0 $7,971.0 $1,206.2 2044E 687.7 $31,018.5 $2,032.9 $22,588.1 $0.0 $0.0 $0.0 $6,397.5 $880.3 2045E 628.1 $28,284.5 $1,854.4 $21,490.5 $0.0 $0.0 $0.0 $4,939.6 $618.1 2046E 585.8 $26,364.1 $1,728.7 $21,042.8 $0.0 $0.0 $0.0 $3,592.7 $409.0 2047E 517.8 $23,213.9 $1,523.4 $19,317.4 $0.0 $461.0 $30.0 $1,942.1 $203.4 2048E 437.9 $19,489.8 $1,281.1 $16,885.8 $0.0 $0.0 $0.0 $1,322.9 $124.8 2049E 349.2 $15,338.0 $1,011.2 $13,870.8 $0.0 $461.0 $30.0 $25.0 $3.5 2050E 185.0 $7,552.5 $506.5 $7,157.1 $0.0 $1,152.5 $75.0 ($1,188.6) ($91.3) 2051E 108.4 $3,939.3 $272.0 $4,029.4 $0.0 $1,140.5 $74.2 ($1,428.3) ($100.5) 2052E 80.4 $2,679.2 $189.4 $3,008.1 $0.0 $2,979.2 $193.9 ($3,303.7) ($208.7) 2053E 64.3 $1,980.8 $143.3 $2,452.9 $0.0 $3,227.0 $210.0 ($3,632.3) ($211.6) 2054E 60.5 $1,862.0 $134.7 $2,426.1 $0.0 $230.5 $15.0 ($914.3) ($48.3) 2055E 56.9 $1,750.3 $126.6 $1,233.2 $0.0 $691.5 $45.0 ($256.0) ($13.2) 2056E 53.4 $1,645.2 $119.0 $820.3 $0.0 $0.0 $0.0 $706.0 $30.9 2057E 50.2 $1,546.5 $111.9 $798.1 $0.0 $0.0 $0.0 $636.6 $25.3 2058E 47.2 $1,453.7 $105.1 $777.2 $0.0 $0.0 $0.0 $571.4 $20.7 2059E 44.4 $1,366.5 $98.8 $757.6 $0.0 $0.0 $0.0 $510.1 $16.8 2060E 41.7 $1,284.5 $92.9 $739.2 $0.0 $0.0 $0.0 $452.5 $13.5 2061E 39.2 $1,207.5 $87.3 $721.8 $0.0 $0.0 $0.0 $398.3 $10.8 2062E 36.9 $1,135.0 $82.1 $705.5 $0.0 $0.0 $0.0 $347.4 $8.6 2063E 34.7 $1,066.9 $77.2 $690.2 $0.0 $0.0 $0.0 $299.5 $6.7 2064E 32.6 $1,002.9 $72.5 $675.8 $0.0 $0.0 $0.0 $254.5 $5.2 2065E 30.6 $942.7 $68.2 $662.3 $0.0 $0.0 $0.0 $212.2 $3.9 2066E 28.8 $886.2 $64.1 $649.6 $0.0 $0.0 $0.0 $172.5 $2.9 2067E 27.1 $833.0 $60.2 $637.6 $0.0 $0.0 $0.0 $135.1 $2.1 2068E 25.4 $783.0 $56.6 $626.4 $0.0 $0.0 $0.0 $100.0 $1.4 2069E 23.9 $736.0 $53.2 $615.8 $0.0 $0.0 $0.0 $67.0 $0.9 2070E 22.5 $691.9 $50.0 $605.9 $0.0 $0.0 $0.0 $35.9 $0.4 2071E 15.4 $473.7 $34.3 $430.6 $0.0 $617.7 $40.2 ($568.7) ($4.4) 2072E 0.9 $28.3 $2.0 $26.2 $0.0 $221.7 $14.4 ($207.2) ($1.5) 2073E 0.0 $0.0 $0.0 $0.0 $0.0 $0.0 $0.0 $0.0 $0.0 Total 42,232.4 $1,985,613.6 $129,102.0 $768,222.3 $595,727.0 $11,182.6 $727.7 $482,107.4 $161,083.5 PUD 31 |
| CONFIDENTIAL - PRELIMINARY DRAFT - SUBJECT TO FURTHER REVIEW NAV Detail Strip +10% Analysis (dollars in thousands) Note: Present values as of 9/1/2023. 1. Taxes include Production and Ad Valorem taxes. Source: Company management and Bloomberg. PDP Production (Net Mboe) Revenue Taxes [1] Operating Expenses Capital Expenditures Abandonment Expenses Salvage Gain Undiscounted Cash Flow Discounted Cash Flow (PV10) 2023E 1,554.0 $77,904.6 $4,848.1 $35,733.9 $0.0 $0.0 $0.0 $37,322.6 $36,750.6 2024E 4,027.2 $184,887.8 $11,559.0 $80,027.9 $0.0 $0.0 $0.0 $93,300.9 $86,490.5 2025E 3,380.7 $155,957.7 $9,800.6 $66,365.4 $0.0 $0.0 $0.0 $79,791.7 $67,120.8 2026E 2,933.9 $135,013.0 $8,608.9 $56,081.6 $0.0 $6,435.6 $418.8 $64,305.7 $49,062.5 2027E 2,615.3 $115,936.8 $7,423.3 $51,557.1 $0.0 $230.5 $15.0 $56,740.9 $39,430.4 2028E 2,368.5 $105,016.8 $6,777.1 $48,943.8 $0.0 $0.0 $0.0 $49,295.9 $31,147.1 2029E 2,176.3 $96,375.4 $6,468.7 $46,443.8 $0.0 $691.5 $45.0 $42,816.4 $24,585.7 2030E 2,016.6 $89,217.8 $6,049.1 $44,705.9 $0.0 $427.1 $27.8 $38,063.5 $19,879.7 2031E 1,875.6 $82,851.1 $5,619.7 $43,053.7 $0.0 $0.2 $0.0 $34,177.5 $16,221.5 2032E 1,730.7 $76,095.0 $5,167.8 $40,009.2 $0.0 $0.0 $0.0 $30,918.1 $13,340.1 2033E 1,620.5 $71,237.8 $4,838.2 $39,083.1 $0.0 $0.0 $0.0 $27,316.6 $10,715.0 2034E 1,500.5 $65,978.1 $4,480.6 $37,466.6 $0.0 $470.9 $30.6 $23,590.7 $8,417.1 2035E 1,398.8 $61,416.2 $4,172.3 $36,209.5 $0.0 $279.6 $18.2 $20,773.0 $6,732.2 2036E 1,290.7 $56,713.5 $3,851.4 $34,598.9 $0.0 $230.5 $15.0 $18,047.7 $5,322.1 2037E 1,181.5 $51,824.2 $3,520.5 $32,583.1 $0.0 $461.2 $30.0 $15,289.4 $4,096.4 2038E 1,079.3 $47,461.1 $3,221.5 $30,843.8 $0.0 $461.0 $30.0 $12,964.8 $3,156.3 2039E 962.6 $42,353.5 $2,873.9 $28,219.2 $0.0 $883.6 $57.5 $10,434.3 $2,310.5 2040E 856.8 $37,725.3 $2,559.3 $25,780.0 $0.0 $691.2 $45.0 $8,739.8 $1,758.9 2041E 751.4 $33,022.5 $2,241.0 $23,066.1 $0.0 $691.1 $45.0 $7,069.3 $1,293.6 2042E 677.4 $29,581.4 $2,011.0 $21,331.7 $0.0 $1,815.2 $118.1 $4,541.7 $756.7 2043E 591.5 $25,723.8 $1,750.7 $19,042.6 $0.0 $1,148.6 $74.7 $3,856.6 $586.7 2044E 519.9 $22,515.5 $1,534.1 $17,183.9 $0.0 $922.0 $60.0 $2,935.6 $403.2 2045E 444.2 $19,488.3 $1,322.1 $15,365.3 $0.0 $922.0 $60.0 $1,938.8 $243.9 2046E 373.9 $16,308.9 $1,107.9 $13,255.0 $0.0 $1,075.7 $70.0 $940.5 $108.0 2047E 298.5 $12,918.7 $879.2 $10,785.4 $0.0 $691.0 $45.0 $608.0 $63.9 2048E 243.7 $10,409.0 $711.1 $8,996.7 $0.0 $1,114.1 $72.5 ($340.4) ($32.0) 2049E 185.3 $7,692.3 $529.0 $6,895.5 $0.0 $1,287.2 $83.8 ($935.7) ($79.0) 2050E 142.7 $5,650.4 $393.4 $5,139.7 $0.0 $883.8 $57.5 ($708.9) ($55.3) 2051E 101.0 $3,715.5 $264.1 $2,669.6 $0.0 $1,064.9 $69.3 ($213.8) ($17.4) 2052E 88.0 $3,193.8 $227.8 $1,736.4 $0.0 $1,379.3 $89.8 ($59.9) ($5.0) 2053E 82.7 $3,002.2 $214.2 $1,700.9 $0.0 $1,051.7 $68.4 $103.9 $6.6 2054E 77.7 $2,821.6 $201.3 $1,667.6 $0.0 $234.0 $15.2 $734.0 $38.8 2055E 73.0 $2,651.1 $189.1 $1,636.3 $0.0 $0.0 $0.0 $825.7 $39.8 2056E 68.3 $2,477.7 $176.8 $1,593.5 $0.0 $0.0 $0.0 $707.5 $31.0 2057E 60.7 $2,200.3 $157.0 $1,443.0 $0.0 $0.0 $0.0 $600.3 $23.9 2058E 57.0 $2,068.3 $147.6 $1,418.6 $0.0 $0.0 $0.0 $502.0 $18.2 2059E 53.6 $1,944.2 $138.7 $1,395.7 $0.0 $200.9 $13.1 $221.9 $7.6 2060E 50.4 $1,827.5 $130.4 $1,374.2 $0.0 $0.0 $0.0 $322.9 $9.7 2061E 46.3 $1,681.9 $120.0 $1,320.4 $0.0 $0.0 $0.0 $241.5 $6.6 2062E 40.5 $1,476.2 $105.2 $1,201.8 $0.0 $0.0 $0.0 $169.2 $4.2 2063E 36.0 $1,319.4 $93.9 $1,121.8 $0.0 $0.0 $0.0 $103.7 $2.3 2064E 24.4 $908.2 $64.3 $793.3 $0.0 $190.3 $12.4 ($127.3) ($2.5) 2065E 15.5 $590.4 $41.6 $533.2 $0.0 $0.0 $0.0 $15.7 $0.3 2066E 0.0 $0.0 $0.0 $0.0 $0.0 $222.2 $14.5 ($207.7) ($3.5) 2067E 0.0 $0.0 $0.0 $0.0 $0.0 $634.8 $41.3 ($593.5) ($9.1) 2068E 0.0 $0.0 $0.0 $0.0 $0.0 $796.4 $51.8 ($744.6) ($10.0) 2069E 0.0 $0.0 $0.0 $0.0 $0.0 $0.0 $0.0 $0.0 $0.0 2070E 0.0 $0.0 $0.0 $0.0 $0.0 $0.0 $0.0 $0.0 $0.0 2071E 0.0 $0.0 $0.0 $0.0 $0.0 $0.0 $0.0 $0.0 $0.0 2072E 0.0 $0.0 $0.0 $0.0 $0.0 $0.0 $0.0 $0.0 $0.0 2073E 0.0 $0.0 $0.0 $0.0 $0.0 $0.0 $0.0 $0.0 $0.0 Total 39,673.1 $1,769,154.9 $116,591.3 $940,374.6 $0.0 $27,588.0 $1,795.3 $686,396.3 $429,968.7 32 |
| CONFIDENTIAL - PRELIMINARY DRAFT - SUBJECT TO FURTHER REVIEW NAV Detail Strip +10% Analysis (cont.) (dollars in thousands) Note: Present values as of 9/1/2023. 1. Taxes include Production and Ad Valorem taxes. Source: Company management and Bloomberg. Production (Net Mboe) Revenue Taxes [1] Operating Expenses Capital Expenditures Abandonment Expenses Salvage Gain Undiscounted Cash Flow Discounted Cash Flow (PV10) 2023E 63.4 $4,354.0 $271.4 $753.3 $33,357.8 $0.0 $0.0 ($30,028.5) ($29,669.5) 2024E 751.1 $45,821.4 $2,882.0 $11,198.0 $35,718.4 $0.0 $0.0 ($3,977.1) ($3,809.7) 2025E 1,789.4 $108,152.3 $6,839.3 $21,410.0 $126,853.2 $0.0 $0.0 ($46,950.2) ($40,441.3) 2026E 3,027.4 $179,459.8 $11,403.5 $35,288.2 $130,956.3 $0.0 $0.0 $1,811.7 $595.7 2027E 3,899.0 $206,497.9 $13,350.7 $47,152.7 $124,906.2 $0.0 $0.0 $21,088.3 $14,377.7 2028E 5,057.4 $263,439.0 $17,095.7 $57,461.8 $139,194.5 $0.0 $0.0 $49,687.1 $31,174.9 2029E 4,255.5 $221,064.6 $14,358.5 $53,713.7 $4,740.5 $0.0 $0.0 $148,251.9 $85,460.1 2030E 2,940.7 $147,859.7 $9,679.9 $44,621.4 $0.0 $0.0 $0.0 $93,558.4 $48,935.4 2031E 2,305.0 $115,445.0 $7,564.9 $38,400.7 $0.0 $0.0 $0.0 $69,479.3 $33,010.6 2032E 1,919.3 $95,993.9 $6,292.4 $33,616.1 $0.0 $0.0 $0.0 $56,085.4 $24,215.9 2033E 1,655.9 $82,743.5 $5,425.0 $30,586.9 $0.0 $0.0 $0.0 $46,731.6 $18,334.3 2034E 1,462.5 $73,023.3 $4,788.6 $27,909.7 $0.0 $0.0 $0.0 $40,325.0 $14,382.5 2035E 1,313.3 $65,538.0 $4,298.3 $26,527.2 $0.0 $0.0 $0.0 $34,712.4 $11,255.5 2036E 1,194.4 $59,570.5 $3,907.4 $25,778.6 $0.0 $0.0 $0.0 $29,884.5 $8,808.5 2037E 1,096.9 $54,686.4 $3,587.4 $25,165.4 $0.0 $0.0 $0.0 $25,933.6 $6,948.7 2038E 1,015.4 $50,600.6 $3,319.7 $24,652.2 $0.0 $0.0 $0.0 $22,628.7 $5,511.8 2039E 945.6 $47,105.2 $3,090.7 $24,213.1 $0.0 $0.0 $0.0 $19,801.5 $4,384.6 2040E 884.3 $44,035.7 $2,889.5 $23,827.0 $0.0 $0.0 $0.0 $17,319.2 $3,486.4 2041E 829.0 $41,276.0 $2,708.5 $23,478.9 $0.0 $0.0 $0.0 $15,088.6 $2,761.4 2042E 778.4 $38,755.6 $2,543.2 $23,160.3 $0.0 $0.0 $0.0 $13,052.2 $2,171.7 2043E 731.6 $36,422.5 $2,390.1 $22,864.9 $0.0 $0.0 $0.0 $11,167.5 $1,689.4 2044E 687.7 $34,237.0 $2,246.7 $22,588.1 $0.0 $0.0 $0.0 $9,402.2 $1,293.2 2045E 646.4 $32,182.8 $2,111.9 $22,328.0 $0.0 $0.0 $0.0 $7,742.9 $968.4 2046E 604.8 $30,104.9 $1,975.6 $21,945.5 $0.0 $0.0 $0.0 $6,183.8 $703.3 2047E 555.0 $27,586.4 $1,810.9 $21,029.4 $0.0 $0.0 $0.0 $4,746.1 $490.9 2048E 514.1 $25,529.7 $1,676.3 $20,440.0 $0.0 $0.0 $0.0 $3,413.4 $321.2 2049E 450.5 $22,275.0 $1,464.1 $18,591.6 $0.0 $461.0 $30.0 $1,788.4 $154.4 2050E 379.4 $18,615.8 $1,225.8 $16,190.5 $0.0 $0.0 $0.0 $1,199.6 $93.6 2051E 288.4 $13,907.2 $919.5 $12,618.1 $0.0 $922.0 $60.0 ($492.5) ($32.8) 2052E 146.3 $6,466.6 $436.9 $6,158.2 $0.0 $922.0 $60.0 ($990.5) ($61.9) 2053E 94.4 $3,786.4 $262.5 $3,876.0 $0.0 $1,123.2 $73.1 ($1,402.2) ($81.5) 2054E 66.9 $2,410.6 $172.3 $2,737.3 $0.0 $3,457.5 $225.0 ($3,731.6) ($195.7) 2055E 56.9 $1,949.4 $141.5 $1,233.2 $0.0 $2,535.5 $165.0 ($1,795.7) ($87.7) 2056E 53.4 $1,832.4 $133.0 $820.3 $0.0 $461.0 $30.0 $448.2 $20.0 2057E 50.2 $1,722.5 $125.0 $798.1 $0.0 $461.0 $30.0 $368.4 $14.5 2058E 47.2 $1,619.1 $117.5 $777.2 $0.0 $0.0 $0.0 $724.4 $26.2 2059E 44.4 $1,522.0 $110.5 $757.6 $0.0 $0.0 $0.0 $653.9 $21.5 2060E 41.7 $1,430.7 $103.8 $739.2 $0.0 $0.0 $0.0 $587.7 $17.6 2061E 39.2 $1,344.8 $97.6 $721.8 $0.0 $0.0 $0.0 $525.4 $14.3 2062E 36.9 $1,264.1 $91.7 $705.5 $0.0 $0.0 $0.0 $466.9 $11.5 2063E 34.7 $1,188.3 $86.2 $690.2 $0.0 $0.0 $0.0 $411.8 $9.3 2064E 32.6 $1,117.0 $81.1 $675.8 $0.0 $0.0 $0.0 $360.1 $7.4 2065E 30.6 $1,050.0 $76.2 $662.3 $0.0 $0.0 $0.0 $311.5 $5.8 2066E 28.8 $987.0 $71.6 $649.6 $0.0 $0.0 $0.0 $265.8 $4.5 2067E 27.1 $927.8 $67.3 $637.6 $0.0 $0.0 $0.0 $222.8 $3.4 2068E 25.4 $872.1 $63.3 $626.4 $0.0 $0.0 $0.0 $182.4 $2.5 2069E 23.9 $819.8 $59.5 $615.8 $0.0 $0.0 $0.0 $144.4 $1.8 2070E 22.5 $770.6 $55.9 $605.9 $0.0 $0.0 $0.0 $108.7 $1.3 2071E 21.1 $724.3 $52.6 $596.6 $0.0 $0.0 $0.0 $75.2 $0.8 2072E 19.9 $680.9 $49.4 $587.8 $0.0 $0.0 $0.0 $43.7 $0.4 2073E 9.5 $325.0 $23.6 $290.8 $0.0 $839.5 $54.6 ($774.2) ($5.0) Total 42,995.4 $2,221,095.0 $144,596.4 $803,474.3 $595,727.0 $11,182.6 $727.7 $666,842.4 $247,307.7 PUD 33 |
| CONFIDENTIAL - PRELIMINARY DRAFT - SUBJECT TO FURTHER REVIEW NAV Detail Strip -10% Analysis (dollars in thousands) Note: Present values as of 9/1/2023. 1. Taxes include Production and Ad Valorem taxes. Source: Company management and Bloomberg. PDP Production (Net Mboe) Revenue Taxes [1] Operating Expenses Capital Expenditures Abandonment Expenses Salvage Gain Undiscounted Cash Flow Discounted Cash Flow (PV10) 2023E 1,549.8 $77,857.4 $4,843.9 $35,669.6 $0.0 $0.0 $0.0 $37,343.8 $36,771.4 2024E 3,990.8 $183,491.7 $11,463.3 $78,442.2 $0.0 $0.0 $0.0 $93,586.2 $86,753.4 2025E 3,331.5 $136,307.6 $8,553.1 $64,523.4 $0.0 $0.0 $0.0 $63,231.1 $53,192.6 2026E 2,902.8 $108,304.6 $6,895.0 $55,052.3 $0.0 $7,133.0 $464.2 $39,688.5 $30,259.2 2027E 2,569.2 $92,199.6 $5,893.8 $49,901.4 $0.0 $691.5 $45.0 $35,757.8 $24,865.4 2028E 2,321.4 $83,243.7 $5,363.2 $47,160.5 $0.0 $9.3 $0.6 $30,711.2 $19,409.8 2029E 2,102.5 $75,488.8 $5,046.9 $43,892.5 $0.0 $461.2 $30.0 $26,118.1 $15,010.3 2030E 1,937.0 $69,443.7 $4,689.0 $41,843.7 $0.0 $201.7 $13.1 $22,722.4 $11,864.2 2031E 1,765.5 $63,107.8 $4,263.8 $39,017.3 $0.0 $672.6 $43.8 $19,197.8 $9,120.8 2032E 1,628.0 $58,171.2 $3,930.3 $36,591.0 $0.0 $0.0 $0.0 $17,649.9 $7,617.4 2033E 1,461.2 $52,349.0 $3,533.7 $33,750.4 $0.0 $691.5 $45.0 $14,418.4 $5,658.9 2034E 1,351.6 $48,465.2 $3,270.5 $32,432.1 $0.0 $922.2 $60.0 $11,900.5 $4,244.4 2035E 1,187.4 $42,718.0 $2,879.4 $29,137.7 $0.0 $652.7 $42.5 $10,090.6 $3,279.2 2036E 1,045.9 $37,533.4 $2,530.8 $26,109.8 $0.0 $691.1 $45.0 $8,246.7 $2,426.3 2037E 943.3 $33,698.8 $2,274.8 $24,136.0 $0.0 $1,152.5 $75.0 $6,210.5 $1,674.5 2038E 842.4 $29,990.3 $2,026.2 $22,113.5 $0.0 $1,152.5 $75.0 $4,773.1 $1,166.1 2039E 704.7 $25,262.1 $1,702.9 $18,954.0 $0.0 $922.0 $60.0 $3,743.2 $826.2 2040E 625.1 $22,400.6 $1,509.8 $17,360.6 $0.0 $922.0 $60.0 $2,668.2 $537.5 2041E 554.3 $19,816.4 $1,336.0 $15,914.0 $0.0 $1,152.5 $75.0 $1,489.0 $277.0 2042E 449.3 $15,976.2 $1,077.9 $13,153.6 $0.0 $1,075.2 $70.0 $739.5 $123.0 2043E 366.8 $12,931.1 $873.9 $10,961.9 $0.0 $461.0 $30.0 $664.3 $100.8 2044E 308.9 $10,768.8 $729.5 $9,485.9 $0.0 $1,114.1 $72.5 ($488.2) ($65.6) 2045E 230.4 $7,821.4 $532.5 $7,154.4 $0.0 $1,517.7 $98.8 ($1,284.5) ($159.2) 2046E 184.5 $5,981.2 $411.7 $5,744.2 $0.0 $422.8 $27.5 ($570.0) ($64.2) 2047E 143.5 $4,309.6 $302.5 $4,400.3 $0.0 $1,324.2 $86.2 ($1,631.2) ($166.6) 2048E 133.7 $3,990.7 $280.5 $4,280.8 $0.0 $918.3 $59.8 ($1,429.2) ($133.8) 2049E 125.7 $3,751.2 $263.7 $4,224.7 $0.0 $821.2 $53.4 ($1,504.9) ($127.4) 2050E 118.1 $3,526.2 $247.9 $4,001.8 $0.0 $234.0 $15.2 ($942.3) ($73.6) 2051E 100.9 $2,965.3 $209.2 $2,668.6 $0.0 $0.0 $0.0 $87.5 $4.9 2052E 83.2 $2,406.8 $170.4 $1,604.3 $0.0 $0.0 $0.0 $632.1 $40.6 2053E 77.7 $2,247.9 $159.2 $1,557.0 $0.0 $0.0 $0.0 $531.8 $31.0 2054E 73.1 $2,113.1 $149.6 $1,525.8 $0.0 $230.5 $15.0 $222.2 $11.7 2055E 68.7 $1,986.3 $140.6 $1,496.5 $0.0 $200.9 $13.1 $161.4 $7.4 2056E 62.6 $1,815.0 $128.4 $1,420.2 $0.0 $0.0 $0.0 $266.4 $11.7 2057E 55.2 $1,605.1 $113.5 $1,298.5 $0.0 $0.0 $0.0 $193.1 $7.7 2058E 49.1 $1,434.9 $101.3 $1,207.5 $0.0 $0.0 $0.0 $126.1 $4.6 2059E 37.1 $1,101.4 $77.4 $954.2 $0.0 $190.3 $12.4 ($108.1) ($3.4) 2060E 23.1 $700.2 $48.9 $619.9 $0.0 $0.0 $0.0 $31.4 $0.9 2061E 16.5 $516.3 $35.8 $476.9 $0.0 $221.9 $14.4 ($203.9) ($5.5) 2062E 14.5 $457.8 $31.7 $444.3 $0.0 $634.8 $41.3 ($611.6) ($14.8) 2063E 8.7 $242.8 $17.3 $260.2 $0.0 $0.2 $0.0 ($34.9) ($0.8) 2064E 4.8 $135.4 $9.7 $167.4 $0.0 $220.8 $14.4 ($248.2) ($5.2) 2065E 2.7 $75.2 $5.4 $112.8 $0.0 $0.0 $0.0 ($43.0) ($0.8) 2066E 0.0 $0.0 $0.0 $0.0 $0.0 $413.0 $26.9 ($386.2) ($6.6) 2067E 0.0 $0.0 $0.0 $0.0 $0.0 $0.0 $0.0 $0.0 $0.0 2068E 0.0 $0.0 $0.0 $0.0 $0.0 $162.5 $10.6 ($152.0) ($2.1) 2069E 0.0 $0.0 $0.0 $0.0 $0.0 $0.0 $0.0 $0.0 $0.0 2070E 0.0 $0.0 $0.0 $0.0 $0.0 $0.0 $0.0 $0.0 $0.0 2071E 0.0 $0.0 $0.0 $0.0 $0.0 $0.0 $0.0 $0.0 $0.0 2072E 0.0 $0.0 $0.0 $0.0 $0.0 $0.0 $0.0 $0.0 $0.0 2073E 0.0 $0.0 $0.0 $0.0 $0.0 $0.0 $0.0 $0.0 $0.0 Total 35,553.1 $1,348,709.5 $88,125.0 $791,223.5 $0.0 $27,591.8 $1,795.6 $443,564.8 $314,469.1 34 |
| CONFIDENTIAL - PRELIMINARY DRAFT - SUBJECT TO FURTHER REVIEW NAV Detail Strip -10% Analysis (cont.) (dollars in thousands) Note: Present values as of 9/1/2023. 1. Taxes include Production and Ad Valorem taxes. Source: Company management and Bloomberg. Production (Net Mboe) Revenue Taxes [1] Operating Expenses Capital Expenditures Abandonment Expenses Salvage Gain Undiscounted Cash Flow Discounted Cash Flow (PV10) 2023E 63.4 $4,354.0 $271.4 $753.3 $33,357.8 $0.0 $0.0 ($30,028.5) ($29,669.5) 2024E 751.1 $45,821.4 $2,882.0 $11,198.0 $35,718.4 $0.0 $0.0 ($3,977.1) ($3,809.7) 2025E 1,789.4 $96,159.8 $6,075.9 $21,410.0 $126,853.2 $0.0 $0.0 ($58,179.2) ($49,796.3) 2026E 3,027.4 $146,259.8 $9,279.6 $35,288.2 $130,956.3 $0.0 $0.0 ($29,264.3) ($23,077.0) 2027E 3,899.0 $167,872.8 $10,825.7 $47,152.7 $124,906.2 $0.0 $0.0 ($15,011.8) ($10,674.5) 2028E 5,057.4 $214,007.5 $13,848.6 $57,461.8 $139,194.5 $0.0 $0.0 $3,502.7 $2,076.6 2029E 4,255.5 $179,643.8 $11,637.5 $53,713.7 $4,740.5 $0.0 $0.0 $109,552.1 $63,159.1 2030E 2,940.7 $120,062.8 $7,837.8 $44,621.4 $0.0 $0.0 $0.0 $67,603.7 $35,367.1 2031E 2,305.0 $93,729.4 $6,124.2 $38,400.7 $0.0 $0.0 $0.0 $49,204.5 $23,381.4 2032E 1,919.3 $77,932.5 $5,093.6 $33,616.1 $0.0 $0.0 $0.0 $39,222.9 $16,938.0 2033E 1,655.9 $67,172.5 $4,391.3 $30,586.9 $0.0 $0.0 $0.0 $32,194.4 $12,631.7 2034E 1,462.5 $59,279.6 $3,875.9 $27,909.7 $0.0 $0.0 $0.0 $27,494.1 $9,807.4 2035E 1,313.3 $53,201.8 $3,479.0 $26,527.2 $0.0 $0.0 $0.0 $23,195.6 $7,522.7 2036E 1,194.4 $48,356.5 $3,162.5 $25,778.6 $0.0 $0.0 $0.0 $19,415.5 $5,724.1 2037E 1,096.9 $44,391.0 $2,903.4 $25,165.4 $0.0 $0.0 $0.0 $16,322.2 $4,374.5 2038E 1,015.4 $41,073.7 $2,686.7 $24,652.2 $0.0 $0.0 $0.0 $13,734.8 $3,346.5 2039E 945.6 $38,235.8 $2,501.3 $24,213.1 $0.0 $0.0 $0.0 $11,521.4 $2,552.1 2040E 884.3 $35,743.7 $2,338.4 $23,827.0 $0.0 $0.0 $0.0 $9,578.3 $1,929.0 2041E 829.0 $33,503.4 $2,191.9 $23,478.9 $0.0 $0.0 $0.0 $7,832.6 $1,434.2 2042E 778.4 $31,457.5 $2,058.1 $23,160.3 $0.0 $0.0 $0.0 $6,239.2 $1,038.9 2043E 710.9 $28,677.4 $1,876.9 $22,012.5 $0.0 $0.0 $0.0 $4,788.0 $725.0 2044E 662.9 $26,729.9 $1,749.6 $21,529.6 $0.0 $0.0 $0.0 $3,450.7 $475.3 2045E 584.2 $23,456.8 $1,536.7 $19,675.9 $0.0 $461.0 $30.0 $1,813.2 $230.0 2046E 493.0 $19,642.2 $1,288.9 $17,144.9 $0.0 $0.0 $0.0 $1,208.4 $138.0 2047E 395.2 $15,540.7 $1,022.6 $14,162.4 $0.0 $691.5 $45.0 ($290.7) ($27.3) 2048E 209.4 $7,637.1 $510.9 $7,314.8 $0.0 $922.0 $60.0 ($1,050.6) ($96.9) 2049E 122.6 $3,969.8 $273.2 $4,124.8 $0.0 $1,140.5 $74.2 ($1,494.4) ($127.7) 2050E 91.0 $2,692.2 $189.6 $3,080.3 $0.0 $2,979.2 $193.9 ($3,363.1) ($257.2) 2051E 72.8 $1,984.7 $142.9 $2,511.5 $0.0 $3,227.0 $210.0 ($3,686.7) ($259.9) 2052E 68.5 $1,865.6 $134.3 $2,481.3 $0.0 $230.5 $15.0 ($965.5) ($61.7) 2053E 64.3 $1,753.7 $126.3 $2,452.9 $0.0 $691.5 $45.0 ($1,472.0) ($86.0) 2054E 60.5 $1,648.4 $118.7 $2,426.1 $0.0 $0.0 $0.0 ($896.4) ($47.4) 2055E 56.9 $1,549.5 $111.6 $1,233.2 $0.0 $0.0 $0.0 $204.8 $9.2 2056E 53.4 $1,456.6 $104.9 $820.3 $0.0 $0.0 $0.0 $531.4 $23.3 2057E 50.2 $1,369.2 $98.6 $798.1 $0.0 $0.0 $0.0 $472.5 $18.8 2058E 47.2 $1,287.0 $92.7 $777.2 $0.0 $0.0 $0.0 $417.2 $15.1 2059E 44.4 $1,209.8 $87.1 $757.6 $0.0 $0.0 $0.0 $365.1 $12.0 2060E 41.7 $1,137.2 $81.9 $739.2 $0.0 $0.0 $0.0 $316.2 $9.5 2061E 39.2 $1,069.0 $77.0 $721.8 $0.0 $0.0 $0.0 $270.2 $7.4 2062E 36.9 $1,004.8 $72.3 $705.5 $0.0 $0.0 $0.0 $227.0 $5.6 2063E 34.7 $944.6 $68.0 $690.2 $0.0 $0.0 $0.0 $186.3 $4.2 2064E 32.6 $887.9 $63.9 $675.8 $0.0 $0.0 $0.0 $148.1 $3.0 2065E 30.6 $834.6 $60.1 $662.3 $0.0 $0.0 $0.0 $112.2 $2.1 2066E 28.8 $784.5 $56.5 $649.6 $0.0 $0.0 $0.0 $78.5 $1.3 2067E 27.1 $737.5 $53.1 $637.6 $0.0 $0.0 $0.0 $46.7 $0.7 2068E 23.3 $635.1 $45.7 $572.2 $0.0 $0.0 $0.0 $17.2 $0.2 2069E 4.6 $124.8 $9.0 $114.8 $0.0 $0.0 $0.0 $1.1 $0.0 2070E 0.0 $0.0 $0.0 $0.0 $0.0 $0.0 $0.0 $0.0 $0.0 2071E 0.0 $0.0 $0.0 $0.0 $0.0 $441.8 $28.7 ($413.0) ($4.2) 2072E 0.0 $0.0 $0.0 $0.0 $0.0 $397.7 $25.9 ($371.8) ($3.6) 2073E 0.0 $0.0 $0.0 $0.0 $0.0 $0.0 $0.0 $0.0 $0.0 Total 41,270.9 $1,748,890.0 $113,517.4 $728,387.5 $595,727.0 $11,182.6 $727.7 $300,803.3 $74,965.3 PUD 35 |
| Page 1. Selected Public Market Observations 3 2. Benchmarking Data 7 3. Selected Technical Observations 12 4. Pricing 27 5. NAV Analysis Detail 29 6. Glossary of Selected Terms 36 7. Disclaimer 39 |
| CONFIDENTIAL - PRELIMINARY DRAFT - SUBJECT TO FURTHER REVIEW 12M refers to Twelve Month 1P refers to proven reserves A refers to Actual Adj. refers to Adjusted Adjusted EBITDA refers to Earnings Before Interest, Taxes, Depreciation and Amortization, adjusted for certain non-recurring items AGI refers to Acid Gas Injection Avg refers to Average Bblpd refers to Barrels per Day Boe refers to Barrels of Oil Equivalent Boepd refers to Barrels of Oil Equivalent per Day CAGR refers to Compound Annual Growth Rate CAPEX refers to Capital Expenditures CY refers to Calendar Year DCF refers to Discounted Cash Flow Disc. refers to discount E refers to Estimated EBIT refers to Earnings Before Interest and Taxes EBITDA refers to Earnings Before Interest, Taxes, Depreciation and Amortization EPS refers to Earnings Per Share EV refers to Enterprise Value FV refers to Fair Value FY refers to Fiscal Year G&A refers to General and Administrative GTO refers to Gathering, Transportation and Other K refers to Thousand L5M refers to most recently completed 5-month period Lbs/ft refers to Pounds per Foot LOE refers to lease operating expenses LOS refers to lease operating schedule LQA refers to Last Quarter Annualized LTM refers to Most recently completed 12-month period for which financial information has been made public or available, other than for the Company, in which case LTM refers to Latest 12 Months Mbbl refers to One Thousand Barrels Mboe refers to One Thousand Barrel of Oil Equivalent Mcf refers to Thousand Cubic Feet Mcfpd refers to Million Cubic Feet per day MM refers to Million Mmboe refers to One Million Barrels of Oil Equivalent MMcf refers to Million Cubic Feet Mo refers to Month NA refers to Not Applicable NAV refers to Net Asset Value NDA refers to Non-Disclosure Agreement NFY refers to Refers to the next fiscal year for which financial information has not been made public, other than for the Company, in which case NFY refers to Next Fiscal Year Glossary of Selected Terms 37 |
| CONFIDENTIAL - PRELIMINARY DRAFT - SUBJECT TO FURTHER REVIEW NFY+1 refers to Next Fiscal Year following NFY NGL refers to Natural Gas Liquid NMF refers to Not Meaningful Figure NTM refers to Next Twelve Months NYMEX refers to New York Mercantile Exchange P&A refers to Plugging and Abandonment PDNP refers to Proved Developed Non-Producing PDP refers to Proved Developed Producing Prem. refers to premium PROB refers to Probable POSS refers to Possible PUD refers to Proved Undeveloped PV refers to Present Value PV-10 refers to present value discounted at ten percent Q refers to Quarter R/P refers to Reserves/Production RADR refers to Risk-Adjusted Discount Rates RAF refers to Reserve Adjustment Factors RSU refers to Restricted Stock Unit SPEE refers to Society of Petroleum Evaluation Engineers SWD refers to Saltwater Disposal UCF refers to Unlevered Cash Flow VWAP refers to Volume-Weighted Average Price WACC refers to Weighted Average Cost of Capital WTI refers to West Texas Intermediate YoY refers to Year-over-Year YTD refers to Year to Date Glossary of Selected Terms (cont.) 38 |
| Page 1. Selected Public Market Observations 3 2. Benchmarking Data 7 3. Selected Technical Observations 12 4. Pricing 27 5. NAV Analysis Detail 29 6. Glossary of Selected Terms 36 7. Disclaimer 39 |
| CONFIDENTIAL - PRELIMINARY DRAFT - SUBJECT TO FURTHER REVIEW This presentation, and any supplemental information (written or oral) or other documents provided in connection therewith (collectively, the “materials”), are provided solely for the information of the Board of Directors (the “Board”) of Battalion Oil Corporation (the “Company”) by Houlihan Lokey in connection with the Board’s consideration of a potential transaction (the “Transaction”) involving the Company. This presentation is incomplete without reference to, and should be considered in conjunction with, any supplemental information provided by and discussions with Houlihan Lokey in connection therewith. Any defined terms used herein shall have the meanings set forth herein, even if such defined terms have been given different meanings elsewhere in the materials. The materials are for discussion purposes only. Houlihan Lokey expressly disclaims any and all liability, whether direct or indirect, in contract or tort or otherwise, to any person in connection with the materials. The materials were prepared for specific persons familiar with the business and affairs of the Company for use in a specific context and were not prepared with a view to public disclosure or to conform with any disclosure standards under any state, federal or international securities laws or other laws, rules or regulations, and none of the Board, the Company or Houlihan Lokey takes any responsibility for the use of the materials by persons other than the Board. The materials are provided on a confidential basis solely for the information of the Board and may not be disclosed, summarized, reproduced, disseminated or quoted or otherwise referred to, in whole or in part, without Houlihan Lokey’s express prior written consent, except as expressly permitted by Houlihan Lokey’s engagement letter with the Company. Notwithstanding any other provision herein, the Company (and each employee, representative or other agent of the Company) may disclose to any and all persons without limitation of any kind, the tax treatment and tax structure of any transaction and all materials of any kind (including opinions or other tax analyses, if any) that are provided to the Company relating to such tax treatment and structure. However, any information relating to the tax treatment and tax structure shall remain confidential (and the foregoing sentence shall not apply) to the extent necessary to enable any person to comply with securities laws. For this purpose, the tax treatment of a transaction is the purported or claimed U.S. income or franchise tax treatment of the transaction and the tax structure of a transaction is any fact that may be relevant to understanding the purported or claimed U.S. income or franchise tax treatment of the transaction. If the Company plans to disclose information pursuant to the first sentence of this paragraph, the Company shall inform those to whom it discloses any such information that they may not rely upon such information for any purpose without Houlihan Lokey’s prior written consent. Houlihan Lokey is not an expert on, and nothing contained in the materials should be construed as advice with regard to, legal, accounting, regulatory, insurance, tax or other specialist matters. Houlihan Lokey’s role in reviewing any information was limited solely to performing such a review as it deemed necessary to support its own advice and analysis and was not on behalf of the Board. The materials necessarily are based on financial, economic, market and other conditions as in effect on, and the information available to Houlihan Lokey as of, the date of the materials. Although subsequent developments may affect the contents of the materials, Houlihan Lokey has not undertaken, and is under no obligation, to update, revise or reaffirm the materials. The materials are not intended to provide the sole basis for evaluation of the Transaction and do not purport to contain all information that may be required. The materials do not address the underlying business decision of the Company or any other party to proceed with or effect the Transaction, or the relative merits of the Transaction as compared to any alternative business strategies or transactions that might be available for the Company or any other party. The materials do not constitute any opinion, nor do the materials constitute a recommendation to the Board, the Company, any security holder of the Company or any other party as to how to vote or act with respect to any matter relating to the Transaction or otherwise or whether to buy or sell any assets or securities of any company. Houlihan Lokey’s only opinion is the opinion, if any, that is actually delivered to the Board. In preparing the materials Houlihan Lokey has acted as an independent contractor and nothing in the materials is intended to create or shall be construed as creating a fiduciary or other relationship between Houlihan Lokey and any party. The materials may not reflect information known to other professionals in other business areas of Houlihan Lokey and its affiliates. Disclaimer 40 |
| CONFIDENTIAL - PRELIMINARY DRAFT - SUBJECT TO FURTHER REVIEW The preparation of the materials was a complex process involving quantitative and qualitative judgments and determinations with respect to the financial, comparative and other analytic methods employed and the adaption and application of these methods to the unique facts and circumstances presented and, therefore, is not readily susceptible to partial analysis or summary description. Furthermore, Houlihan Lokey did not attribute any particular weight to any analysis or factor considered by it, but rather made qualitative judgments as to the significance and relevance of each analysis and factor. Each analytical technique has inherent strengths and weaknesses, and the nature of the available information may further affect the value of particular techniques. Accordingly, the analyses contained in the materials must be considered as a whole. Selecting portions of the analyses, analytic methods and factors without considering all analyses and factors could create a misleading or incomplete view. The materials reflect judgments and assumptions with regard to industry performance, general business, economic, regulatory, market and financial conditions and other matters, many of which are beyond the control of the participants in the Transaction. Any estimates of value contained in the materials are not necessarily indicative of actual value or predictive of future results or values, which may be significantly more or less favorable. Any analyses relating to the value of assets, businesses or securities do not purport to be appraisals or to reflect the prices at which any assets, businesses or securities may actually be sold. The materials do not constitute a credit rating. In preparing the materials, Houlihan Lokey has not conducted any physical inspection or independent appraisal or evaluation of any of the assets, properties or liabilities (contingent or otherwise) of the Company or any other party and has no obligation to evaluate the solvency of the Company or any other party under any law. All budgets, projections, estimates, financial analyses, reports and other information with respect to operations reflected in the materials have been prepared by management of the relevant party or are derived from such budgets, projections, estimates, financial analyses, reports and other information or from other sources, which involve numerous and significant subjective determinations made by management of the relevant party and/or which such management has reviewed and found reasonable. The budgets, projections and estimates contained in the materials may or may not be achieved and differences between projected results and those actually achieved may be material. Houlihan Lokey has relied upon representations made by management of the Company that such budgets, projections and estimates have been reasonably prepared in good faith on bases reflecting the best currently available estimates and judgments of such management (or, with respect to information obtained from public sources, represent reasonable estimates), and Houlihan Lokey expresses no opinion with respect to such budgets, projections or estimates or the assumptions on which they are based. The scope of the financial analysis contained herein is based on discussions with the Company (including, without limitation, regarding the methodologies to be utilized), and Houlihan Lokey does not make any representation, express or implied, as to the sufficiency or adequacy of such financial analysis or the scope thereof for any particular purpose. Houlihan Lokey has assumed and relied upon the accuracy and completeness of the financial and other information provided to, discussed with or reviewed by it without (and without assuming responsibility for) independent verification of such information, makes no representation or warranty (express or implied) in respect of the accuracy or completeness of such information and has further relied upon the assurances of the Company that it is not aware of any facts or circumstances that would make such information inaccurate or misleading. In addition, Houlihan Lokey has relied upon and assumed, without independent verification, that there has been no change in the business, assets, liabilities, financial condition, results of operations, cash flows or prospects of the Company or any other participant in the Transaction since the respective dates of the most recent financial statements and other information, financial or otherwise, provided to, discussed with or reviewed by Houlihan Lokey that would be material to its analyses, and that the final forms of any draft documents reviewed by Houlihan Lokey will not differ in any material respect from such draft documents. Disclaimer (cont.) 41 |
| CONFIDENTIAL - PRELIMINARY DRAFT - SUBJECT TO FURTHER REVIEW The materials are not an offer to sell or a solicitation of an indication of interest to purchase any security, option, commodity, future, loan or currency. The materials do not constitute a commitment by Houlihan Lokey or any of its affiliates to underwrite, subscribe for or place any securities, to extend or arrange credit, or to provide any other services. In the ordinary course of business, certain of Houlihan Lokey’s affiliates and employees, as well as investment funds in which they may have financial interests or with which they may co-invest, may acquire, hold or sell, long or short positions, or trade or otherwise effect transactions, in debt, equity, and other securities and financial instruments (including loans and other obligations) of, or investments in, the Company, any Transaction counterparty, any other Transaction participant, any other financially interested party with respect to any transaction, other entities or parties that are mentioned in the materials, or any of the foregoing entities’ or parties’ respective affiliates, subsidiaries, investment funds, portfolio companies and representatives (collectively, the “Interested Parties”), or any currency or commodity that may be involved in the Transaction. Houlihan Lokey provides mergers and acquisitions, restructuring and other advisory and consulting services to clients, which may have in the past included, or may currently or in the future include, one or more Interested Parties, for which services Houlihan Lokey has received, and may receive, compensation. Although Houlihan Lokey in the course of such activities and relationships or otherwise may have acquired, or may in the future acquire, information about one or more Interested Parties or the Transaction, or that otherwise may be of interest to the Board or the Company, Houlihan Lokey shall have no obligation to, and may not be contractually permitted to, disclose such information, or the fact that Houlihan Lokey is in possession of such information, to the Board or the Company or to use such information on behalf of the Board or the Company. Houlihan Lokey’s personnel may make statements or provide advice that is contrary to information contained in the materials. Disclaimer (cont.) 42 |
| CONFIDENTIAL - PRELIMINARY DRAFT - SUBJECT TO FURTHER REVIEW 43 CORPORATE FINANCE FINANCIAL RESTRUCTURING FINANCIAL AND VALUATION ADVISORY HL.com |
1 Year Battalion Oil Chart |
1 Month Battalion Oil Chart |

It looks like you are not logged in. Click the button below to log in and keep track of your recent history.
Support: +44 (0) 203 8794 460 | support@advfn.com
By accessing the services available at ADVFN you are agreeing to be bound by ADVFN's Terms & Conditions
 Hot Features