ADVFN Logo ADVFN

We could not find any results for:
Make sure your spelling is correct or try broadening your search.

Trending Now

Toplists

It looks like you aren't logged in.
Click the button below to log in and view your recent history.

Hot Features

Registration Strip Icon for alerts Register for real-time alerts, custom portfolio, and market movers

SVA Sinovac Biotech Ltd

6.47
0.00 (0.00%)
17 Jan 2025 - Closed
Delayed by 15 minutes
Share Name Share Symbol Market Type
Sinovac Biotech Ltd NASDAQ:SVA NASDAQ Common Stock
  Price Change % Change Share Price Bid Price Offer Price High Price Low Price Open Price Shares Traded Last Trade
  0.00 0.00% 6.47 6.47 6.47 0 10:20:13

Sinovac Reports Unaudited Third Quarter 2009 Financial Results

15/11/2009 10:00pm

PR Newswire (US)


Sinovac Biotech (NASDAQ:SVA)
Historical Stock Chart


From Jan 2020 to Jan 2025
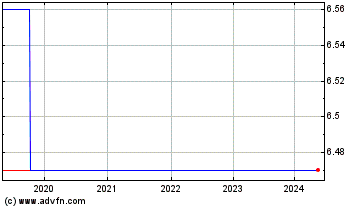
Click Here for more Sinovac Biotech Charts.
- Conference call scheduled Monday, November 16, 2009 at 9:00 a.m. ET - BEIJING, Nov. 15 /PRNewswire-Asia/ -- Sinovac Biotech Ltd. (NASDAQ:SVA), a leading developer and provider of vaccines, announced today its unaudited financial results for the three-month and nine-month periods ended September 30, 2009. Financial Highlights -- Sales for the third quarter increased 142% to $21.2 million -- Sales for the nine-month period increased 40% to $47.8 million -- Operating income for the third quarter rose 436% to $12.4 million -- Operating income for the nine-month period increased 90% to $23.7 million. -- Net income attributable to the shareholders increased 606% to $5.2 million in the third quarter, with diluted EPS of $0.12 -- Cash and cash equivalents at September 30, 2009 was $46.6 million. Business Highlights -- In August, Sinovac reported positive top-line results from the completed clinical trial for its internally-developed pandemic influenza A (H1N1) vaccine, PANFLU.1(TM). The analysis of the clinical trial results showed that Sinovac's H1N1 vaccine induces good immunogenicity after one dose. The seropositive rate, seroconvertive rate and GMT increasing multiple conform to international criteria for vaccines, which indicated PANFLU.1 has a good safety and immunogenicity profile. -- In August, Sinovac was selected by the Beijing Public Health Bureau as one of four manufacturers to supply seasonal influenza vaccine to the citizens of Beijing. The Beijing Public Health Bureau completed the bidding process for the purchase of flu vaccines and corresponding services for 2009 on August 26, 2009. Sinovac will supply its seasonal influenza vaccine, Anflu®, pursuant to this agreement. -- In September, Sinovac's registration application for its pandemic influenza A (H1N1) vaccine, PANFLU.1(TM), was approved by the State Food and Drug Administration (SFDA) and a production license was granted. Sinovac received a first purchase order for 3.3 million doses and a second order purchase for 3.0 million doses on September 4 and September 30, respectively, from China's Ministry of Industry and Information Technology for the national purchase plan. In October, Sinovac received a third purchase order for 5.19 million doses. In aggregate, Sinovac has received orders for a total of 11.49 million doses of its PANFLU.1(TM) vaccine for China's national purchase plan. -- In September, Sinovac signed an agreement with Boryung Pharmaceutical Company Limited, a Korean manufacturer of pharmaceuticals, to collaborate on marketing efforts and possible vaccine supply efforts to the government of South Korea for Sinovac's H1N1 vaccine. The agreement followed meetings between Sinovac and the Korean Food and Drug Administration (KFDA) and the Korean Center for Disease Control (KCDC) where Sinovac presented the scientific data of Sinovac's H1N1 vaccine. The collaboration provides Boryung exclusive rights to represent Sinovac in discussions with the KFDA and KCDC in the development of business opportunities in South Korea surrounding Sinovac's H1N1 vaccine. -- In October, Sinovac obtained a Certificate of Approval from Mexico's Secretaria de Salud to distribute PANFLU.1 in Mexico. Imperiales S.A. de C.V., a biopharmaceutical company with operations in Mexico since 1935, is the exclusive distributor of Sinovac's vaccine products in the Mexican market, pursuant to a prior distribution agreement signed in 2005 with its affiliate. An application for Anflu was filed in Mexico as well. -- In October, Sinovac received the Certificate of Approval to distribute its H5N1 (bird flu) pandemic influenza vaccine in Hong Kong. The Company plans to submit applications in Hong Kong for approval of its PANFLU.1 (H1N1) and Anflu vaccines in the coming months. -- In October, Sinovac was selected to supply its seasonal flu vaccine, Anflu®, to the Shanghai government. This marks Sinovac's entry into an additional new public market for its seasonal flu vaccine. -- In November, Sinovac was selected among five vaccine manufacturers by the Shanghai Government to supply its hepatitis A vaccine, Healive®, to the public market of Shanghai. Sinovac will supply Healive valued at RMB 20.6 million, or approximately $3 million, pursuant to the purchase order that will be in effect for one year. Mr. Weidong Yin, Chairman, President and CEO of Sinovac, commented, "We are very proud that Sinovac was the first company in the world to develop a vaccine for the H1N1 pandemic flu virus. This achievement was made possible by the Company's focus on its mission to provide Chinese children with the best vaccines in the world, and let children in the world benefit from vaccines made in China. To this end, we have not only acted as a successful provider of H1N1 vaccine to China, but have also made strides toward providing other markets such as South Korea and Mexico with PANFLU.1. "Sinovac has been able to demonstrate its flexibility and agility as a leading vaccine Company by excelling in the rapid development and production of this new product, while, at the same time, also realizing product orders for Anflu and the H5N1 Panflu vaccine, both inside and outside of China. We will continue to leverage our leadership position in the development of the H1N1 vaccine to pursue international marketing opportunities for our entire vaccine portfolio. We will also continue our development efforts to expand our portfolio of marketed vaccines, such as EV71, pneumococcal conjugated vaccine, and rabies, in the coming years." Mr. Yin concluded, "Our strong third quarter results were a testament to our ability to commercialize our H1N1 and H5N1 vaccines. We recorded revenues from doses sold in China and Macau. Given our strong product mix, we were able to maintain our gross profit margin in excess of 80%. With the continued execution of our commercialization strategy, we remain on track to exceed the previously projected full year 2009 revenue range of $55 million to $60 million." Market Overview The People's Republic of China (PRC) government's expansion program of publicly funded inoculations has driven increased demand for Sinovac's principal product, Healive. Although the gross margin on public sales is lower than on private sales, Sinovac expects to realize volume-related offsetting cost savings and efficiencies. In the current year, Sinovac expects to generate significant revenues from the sale of its H1N1 vaccine; this is expected to be a short-term initiative that will extend through to the end of the influenza season in the spring of 2010. These sales are not expected to be recurring, but demonstrate the Company's ability to develop, manufacture and distribute vaccines on short notice. At the same time, the outbreak of H1N1 pandemic flu appears to have increased the demand for seasonal flu vaccines. It is expected that increasing sales of Anflu will benefit the company over the long-term. Financial Review for Three Months Ended September 30, 2009 During the third quarter of 2009, sales were $21.2 million, up 142% from $8.7 million in the third quarter of 2008. During the third quarter of 2009, Sinovac's unit dose sales were: Three months ended September 30, 2009 2008 (000 doses) (000 doses) ----------- ----------- Healive 989 1,087 Bilive 215 28 Anflu 4,312 512 Panflu (H5N1) 20 0 PANFLU.1 (H1N1) 586 0 Sales of the hepatitis A vaccine to the public market (including doses purchased by the Ministry of Health) accounted for 31% of total hepatitis A vaccine sales in the quarter. Sales of Bilive increased significantly during the quarter due to a successful marketing campaign. Sales revenues for 20,000 doses of Panflu (H5N1) to Macau and 586,000 doses of PANFLU.1 (H1N1) were booked during the third quarter of 2009. Gross profit for the third quarter 2009 was $17.5 million, with a gross margin of 83%, compared to $7.1 million and a gross margin of 81%, for the same period of 2008. The gross margin was favorably impacted by the utilization of the Anflu production line to produce PANFLU.1 (H1N1) and Panflu (H5N1). The gross margin for the third quarter of 2009 increased from the gross margin of 81% reported in the third quarter of 2008 due to efficiencies resulting from expanded production volume of Bilive and increased utilization of the flu production line. Total operating expenses for the third quarter of 2009 were $5.1 million, compared to $4.8 million in the comparative period in 2008. Selling, general and administrative expenses for the third quarter of 2009 were $3.5 million, compared to $3.8 million in the same period of 2008. SG&A expenses as a percentage of third quarter 2009 sales decreased to 17%, down from 43% during the prior year. The lower selling and administrative expenses as a percentage of revenue resulted from the increased economies of scale associated with the significant growth of sales. Net research and development expenses for the third quarter 2009 were $1.4 million, compared to $812,000 in the same period of 2008. The increased R&D expenses in the third quarter of 2009 were mainly related to the completion of the H1N1 clinical trial and the continued development of the EV 71 vaccine, pneumococcal conjugated vaccine, and universal pandemic influenza vaccine. Third quarter 2009 operating income was $12.4 million, compared to operating income of $2.3 million in the prior year. Net income for the third quarter of 2009 included $246,000 interest and financing expenses and $3.8 million in income tax expenses. Net income for the same period of 2008 included $190,000 of interest and financing expenses and $911,000 of income tax expenses. Net income attributable to shareholders for third quarter of 2009 was $5.2 million, or $0.12 per diluted share, up 606% compared to net income attributable to shareholders of $740,000, or $0.02 per diluted share, in the same period of 2008. As of September 30, 2009, Sinovac's cash and cash equivalents totaled $46.6 million, compared to $32.9 million as of December 31, 2008. The increase in cash and cash equivalents primarily reflects an advance payment received for a vaccine-stockpiling program. Financial Review for Nine Months Ended September 30, 2009 During the nine months ended September 30, 2009, sales were $47.8 million, up 40% from $34.1 million for the same period in 2008. Sinovac recorded strong revenues growth in the second and third quarters, which greatly improved the Company's performance for the year to date. During the first nine months of 2009, Sinovac's unit dose sales were: Nine months ended September 30 2009 2008 ------------------------------ ---- ---- (000 doses) (000 doses) ----------- ----------- Healive 5,024 5,313 Bilive 708 234 Anflu 4,448 498 Panflu (H5N1) 20 0 PANFLU.1 (H1N1) 586 0 Gross profit for the nine-month period was $38.9 million, with a gross margin of 81%, compared to $28.8 million and a gross margin of 84%, for the prior year period. The gross margin was adversely affected by the lower selling price of Healive vaccine delivered to the Ministry of Health, of which 2.08 million doses was delivered in the second quarter of 2009. Total operating expenses for the first nine months of 2009 were $15.2 million, compared to $16.3 million in the comparative period in 2008. Selling, general and administrative expenses for the first nine months of 2009 were $12.0 million, compared to $13.4 million in the prior year period. SG&A expenses as a percentage of sales decreased to 25%, down from 39% in the comparative period of the prior year. Net research and development expenses for the first nine months of 2009 were $2.8 million, compared to $2.4 million in the prior year period. Operating income for the nine months ended September 30, 2009 was $23.7 million, compared to an operating income of $12.5 million in the prior year period. Net income for the first nine months of 2009 included $571,000 in interest and financing expenses and $6.4 million in income tax expenses. Net income for the same period of 2008 included $747,000 of interest and financing expense and $3.2 million of income tax expense. Net income attributable to shareholders for the first nine months of 2009 was $11.1 million, or $0.26 per diluted share, compared to net income of $5.6 million, or $0.13 per diluted share, in the same period of 2008. Conference Call Details The Company will host a conference call on Monday, November 16, 2009 at 9:00 a.m. EDT (10:00 p.m. China Standard Time) to review the Company's third quarter financial results for the period ended September 30, 2009 and provide an update on recent corporate developments. To access the conference call, please dial 1-877-407-4018 (USA) or 1-201-689-8471 (international). A replay of the call will be available from 12:00 p.m. ET on November 16, 2009 until November 30, 2009. To access the replay, please dial 1-877-660-6853 (USA) or 1-201-612-7415 (international) and reference the account number 3055 and the access code 337401. A live audio webcast of the call will also be available from the Investors section on the corporate web site at http://www.sinovac.com/. A webcast replay can be accessed on the corporate website beginning November 16, 2009 and the replay will remain available for 30 days. About Sinovac Sinovac Biotech Ltd. is a China-based biopharmaceutical company that focuses on the research, development, manufacture and commercialization of vaccines that protect against human infectious diseases. Sinovac's commercialized vaccine products include Healive® (hepatitis A), Bilive® (combined hepatitis A and B), Anflu® (seasonal influenza), Panflu(TM) (pandemic influenza (H5N1)), and PANFLU.1(TM) (pandemic influenza A (H1N1)). Sinovac is developing vaccines for enterovirus 71, universal pandemic influenza, pneumococcal infection, Japanese encephalitis, and human rabies. Its wholly owned subsidiary, Tangshan Yian, is conducting field trials for independently developed inactivated animal rabies vaccines. Safe Harbor Statement This announcement contains forward-looking statements. These statements are made under the "safe harbor" provisions of the U.S. Private Securities Litigation Reform Act of 1995. These forward-looking statements can be identified by words or phrases such as "will," "expects," "anticipates," "future," "intends," "plans," "believes," "estimates" and similar statements. Among other things, the business outlook and quotations from management in this press release contain forward-looking statements. Statements that are not historical facts, including statements about Sinovac's beliefs and expectations, are forward-looking statements. Forward-looking statements involve inherent risks and uncertainties. A number of important factors could cause actual results to differ materially from those contained in any forward-looking statement. Sinovac does not undertake any obligation to update any forward-looking statement, except as required under applicable law. Helen G. Yang Sinovac Biotech Ltd. Tel: +86-10-8289-0088 x9871 Fax: +86-10-6296-6910 Email: Investors: Amy Glynn/Stephanie Carrington The Ruth Group Tel: +1-646-536-7023/7017 Email: Media Janine McCargo The Ruth Group Tel: 656-536-7033 Email: SINOVAC BIOTECH LTD. Consolidated Balance Sheets (Unaudited) (Expressed in U.S. Dollars) September 30, December 31, 2009 2008 ASSETS Current assets Cash and cash equivalents $46,579,789 $32,894,102 Accounts receivable - net 36,917,624 19,486,596 Inventories 13,541,462 6,486,351 Income tax refundable - 348,018 Prepaid expenses and deposits 877,260 933,297 Deferred tax assets 678,620 1,189,831 Total current assets 98,594,755 61,338,195 Property, plant and equipment 21,426,879 19,262,099 Long term inventories 3,110,828 942,514 Deferred tax asset 532,854 569,937 Licenses and permits 794,567 1,090,477 Total assets $124,459,883 $83,203,222 LIABILITIES AND STOCKHOLDERS' EQUITY Current liabilities Loans payable $21,937,522 $8,024,277 Accounts payable and accrued liabilities 14,301,303 11,909,037 Income tax payable 2,962,831 - Due to related parties 46,971 46,971 Dividends payable to non-controlling shareholder of Sinovac Beijing 115,957 115,677 Deferred tax liability 768,876 - Deferred research grants 1,051,099 1,182,703 Total current liabilities 41,184,559 21,278,665 Deferred government grants 2,690,382 2,836,994 Loan payable - 2,188,439 Deferred revenue 9,798,760 - Long-term debt 12,489,142 5,025,433 Total liabilities 53,673,701 26,304,098 Commitments and contingencies STOCKHOLDERS' EQUITY Preferred stock - - Authorized 50,000,000 shares at par value of $0.001 each Issued and outstanding: nil Common stock 42,584 42,894 Authorized: 100,000,000 shares at par value of $0.001 each Issued and outstanding: 42,583,761(2008- 42,893,928 ) Additional paid in capital 42,299,500 41,629,506 Accumulated other comprehensive income 4,218,717 4,143,225 Dedicated reserves 5,549,684 5,549,684 Retained earnings (accumulated deficit) 9,407,160 -1,651,534 Total stockholders' equity 61,517,645 49,713,775 Non-controlling interest 9,268,537 7,185,349 Total equity 70,786,182 56,899,124 Total liabilities and equity $124,459,883 $83,203,222 SINOVAC BIOTECH LTD. Consolidated Statements of Income and Comprehensive Income Three Months and Nine Months Ended September 30, 2009 and 2008 (Unaudited) (Expressed in U.S. Dollars) Three months ended Nine months ended September 30 September 30 2009 2008 2009 2008 Sales $21,224,685 $8,753,671 $47,809,111 $34,137,101 Cost of sales - (exclusive of depreciation of land -use rights and amortization of licenses and permits of $104,732 (2008 - $102,742) for three months and $314,081 (2008- $202,575) for nine months 3,675,695 1,658,862 8,886,251 5,320,667 Gross profit 17,548,990 7,094,809 38,922,860 28,816,434 Selling, general and administrative expenses 3,519,977 3,791,916 11,927,879 13,408,452 Research and development expenses - net of 1,443,834 811,901 2,753,009 2,408,745 $133,176 (2008- $16,829) for three months and $261,861 (2008- $147,958) for nine months in government research grants Depreciation of property, plant and equipment and amortization of licenses and permits 179,962 178,404 511,835 526,117 Total operating expenses 5,143,773 4,782,221 15,192,723 16,343,314 Operating income 12,405,217 2,312,588 23,730,137 12,473,120 Interest and financing expenses (246,036) (189,935) (571,349) (747,496) Interest income and other income (expenses) 77,300 58,456 243,451 (36,685) Income before income taxes and non-controlling interest 12,236,481 2,181,109 23,402,239 11,688,939 Income taxes recovery (expense) - Current (3,230,985) (1,005,174) (5,026,902) (4,229,613) - Deferred (551,478) 94,028 (1,399,428) 991,461 Consolidated net income for the period 8,454,018 1,269,963 16,975,909 8,450,787 Less: net income attributable to non-controlling interest (3,228,659) (530,084) (5,917,215) (2,814,703) Net income attributable to the stockholders $5,225,359 $739,879 $11,058,694 $5,636,084 Net income for the period $8,454,018 1,269,963 16,975,909 8,450,787 Other comprehensive income Foreign currency translation adjustment 64,108 33,637 90,728 2,358,956 Total comprehensive income 8,518,126 1,303,600 17,066,637 10,809,743 Less: comprehensive income attributable to non-controlling interest 3,229,599 522,960 5,932,451 2,889,658 Comprehensive income attributable to stockholders $5,288,527 $780,640 $11,134,186 $7,920,085 Earnings per share - basic and diluted $0.12 $0.02 $0.26 $0.13 Weighted average number of shares of common stock outstanding - Basic 42,428,755 42,873,511 42,574,921 42,299,187 - Diluted 43,631,572 43,142,788 42,758,104 42,638,584 SINOVAC BIOTECH LTD. Consolidated Statements of Cash Flows Three Months and Nine Months Ended September 30, 2009 and 2008 (Unaudited) (Expressed in U.S. Dollars) Three Months ended Nine Months ended September 30 September 30 2009 2008 2009 2008 Cash flows from (used in) operating activities Net Income for the period $8,454,018 $1,269,963 $16,975,909 $8,450,787 Adjustments to reconcile net income to net cash used by operating activities: - deferred income taxes 551,478 (94,028) 1,399,428 (991,461) - loss (income) On disposal fixed assets 641 2,249 (6,708) 2,249 - stock-based compensation 180,152 16,635 308,195 49,907 - provision for doubtful debts (1,595,787) 408,289 717,137 1,968,207 - depreciation of property, plant and equipment, and amortization of licenses 529,957 517,751 1,394,064 1,298,314 - research and development expenditures qualified for government grant (133,176) (16,829) (261,861) (147,677) Change in other assets and liabilities - accounts receivable (3,545,198) 4,718,247 (18,088,750)(8,650,832) - inventories (4,063,146) (1,620,126) (9,198,785)(3,934,756) - income tax refundable (payable) 3,482,345 - 3,309,317 - - prepaid expenses and deposits (197,728) 273,079 58,098 188,789 - advance from stockpiling program 147,160 - 9,791,728 - - accounts payable and accrued liabilities 3,646,229 (2,168,844) 2,362,439 1,973,562 Net cash provided by operating activities 7,456,945 3,306,386 8,760,211 207,089 Cash flows from (used in) Financing activities Loan proceeds - (3,572,010) 16,074,281 - Loan repayment (4,384,356) 2,143,206 (4,384,356) (3,572,010) Proceeds from issuance of common stock 693,285 - 693,285 2,143,206 Repurchase of common shares - - (335,831) 9,854,560 Loan repayment from non- controlling shareholder of Sinovac Beijing 1,461,298 - - - Proceeds from shares subscribed 4,035 20,060 4,035 20,060 Dividends paid to non- controlling shareholder of Sinovac Beijing (3,846,501) - (3,846,501) (2,947,877) Government grant received 171,326 143,626 171,326 214,321 Net cash provided by (used in) financing activities (5,900,913) (1,265,118) 8,376,239 5,712,260 Cash flows from (used in) investing activities Restricted cash - 434,196 - (725) Acquisition of property, plant and equipment (1,718,443) (1,046,849) (3,480,444)(3,283,424) Net cash used in investing activities (1,718,443) (612,653) (3,480,444)(3,284,149) Exchange effect on cash and equivalents 37,748 303,614 29,681 845,803 Increase (decrease) in cash and cash equivalents (124,663) 1,732,229 13,685,687 3,481,003 Cash and cash equivalents, beginning of period 46,704,452 18,820,271 32,894,102 17,071,497 Cash and cash equivalents, end of period $46,579,789 $20,552,500 $46,579,789 $20,552,500 Cash paid for interest, net of interest capitalized $285,423 $150,657 $615,691 $456,665 Cash paid (received) for income taxes $(251,359) $1,502,166 $1,717,585 $2,812,129 DATASOURCE: Sinovac Biotech Co., Ltd. CONTACT: Helen G. Yang of Sinovac Biotech Ltd., Tel: +86-10-8289-0088 x9871, Fax: +86-10-6296-6910, or ; Investors: Amy Glynn, +1-646-536-7023, or , or Stephanie Carrington, +1-646-536-7017, or , Media: Janine McCargo, +1-656-536-7033, or , all of The Ruth Group for Sinovac Biotech Ltd. Web Site: http://www.sinovac.com/

Copyright

1 Year Sinovac Biotech Chart

1 Year Sinovac Biotech Chart

1 Month Sinovac Biotech Chart

1 Month Sinovac Biotech Chart

Your Recent History

Delayed Upgrade Clock