ADVFN Logo ADVFN

We could not find any results for:
Make sure your spelling is correct or try broadening your search.

Trending Now

Toplists

It looks like you aren't logged in.
Click the button below to log in and view your recent history.

Hot Features

Registration Strip Icon for charts Register for streaming realtime charts, analysis tools, and prices.

ABCB Ameris Bancorp

60.00
0.00 (0.00%)
25 Jul 2024 - Closed
Delayed by 15 minutes
Share Name Share Symbol Market Type
Ameris Bancorp NASDAQ:ABCB NASDAQ Common Stock
  Price Change % Change Share Price Bid Price Offer Price High Price Low Price Open Price Shares Traded Last Trade
  0.00 0.00% 60.00 58.84 61.16 0 01:00:00

Ameris Bancorp Reports Second Quarter 2009 Results

21/07/2009 9:00pm

PR Newswire (US)


Ameris Bancorp (NASDAQ:ABCB)
Historical Stock Chart


From Jul 2019 to Jul 2024
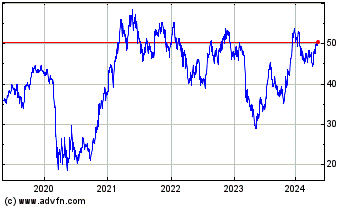
Click Here for more Ameris Bancorp Charts.
MOULTRIE, Ga., July 21 /PRNewswire-FirstCall/ -- AMERIS BANCORP (NASDAQ-GS: ABCB) today reported a net loss available to common shareholders of $3.36 million, or $0.25 per diluted share, for the quarter ended June 30, 2009, compared to net income of $3.15 million, or $0.23 per diluted share, for the second quarter of 2008. For the first half of 2009, Ameris Bancorp reported a net loss available to common shareholders of $4.58 million, or $0.34 per diluted share, compared to net income of $6.12 million, or $0.45 per diluted share, for the first half of 2008. Improvements in the Company's net interest margin and continued strong capital position were overshadowed by larger than normal loan loss provisions. (Logo: http://www.newscom.com/cgi-bin/prnh/20051117/CLTH039LOGO ) Net Interest Margin Improves for the Third Consecutive Quarter During the second quarter of 2009, the Company reported net interest income of $18.5 million and a net interest margin of 3.58%, compared to $16.9 million and 3.21%, respectively, for the first quarter of 2009. A significant improvement in the Company's cost of funds, together with stable yields on earning assets, was the primary driver in margin improvement and helped lift net interest income by $1.57 million, or 9.3%, when compared to the first quarter of 2009. The current quarter's net interest margin and net interest income compare less favorably to the same quarter in 2008 when the Company reported a margin of 3.96% and net interest income of $19.1 million. These declines are representative of the lower interest rate environment that began to materialize in the second half of 2008. Maintaining stable to slightly increasing yields on earning assets over the recent quarters has been critical to the Company's improvement in pre-tax, pre-provision earnings. Yields on earning assets were 5.60% during the second quarter of 2009, compared to 5.57% in the first quarter of 2009 and 6.64% in the second quarter of 2008. Loan yields were flat during the current quarter at 6.21% when compared to the first quarter of 2009. Yields on current loan production for new and renewed loans are at higher levels than the Company's quarter end yield on loans outstanding. Yields on investment securities were relatively unchanged at 5.01% for the second quarter of 2009 when compared to the second quarter of 2008 but were up from 4.33% in the first quarter of 2009. During the latter part of the first quarter, a low-yielding portion of the portfolio matured and had not been re-invested as of the end of the second quarter. Interest expense fell during the current quarter to $10.56 million compared to $12.65 million in the prior quarter and $13.19 million in the same quarter in 2008. Similarly, deposit costs fell during the current quarter to 2.04% compared to 2.46% in the first quarter of 2009 and 2.80% in the same quarter of 2008. Increasing liquidity in the marketplace and better pricing disciplines in the banking industry allowed the Company to achieve significant cost savings with regard to customer deposits. In addition, a shift in the Company's deposit mix continues with demand deposits (interest bearing and non-interest bearing) now totaling 54.9% of total deposits compared to 45.6% in the same quarter of 2008. Time deposits at the end of the second quarter of 2009 were 42.3% of total deposits compared to 51.3% at the end of the second quarter of 2008. Non-deposit borrowings totaled only 3.22% of total funding at June 30, 2009 compared to 10.83% at June 30, 2008. Non-Interest Income Non-interest income during the quarter totaled $4.60 million, a decrease of 13.7% from the same quarter in 2008. Several non-recurring amounts are included in both quarters, including a gain on VISA stock recognized in the second quarter of 2008 totaling approximately $409,000 and a gain on the sale of investment securities in the second quarter of 2009 totaling $101,000. Excluding these charges, non-interest income would have decreased $423,000, or 8.60%, compared to the same quarter in 2008. Service charges on deposit accounts were $3.39 million during the second quarter of 2009 compared to $3.66 million during the second quarter of 2008. The decrease relates primarily to fewer insufficient funds charges across the Company's retail checking accounts than had been seen in prior periods. Mortgage related revenue increased slightly to $877,000 in the current quarter when compared to the same quarter in 2008. Although governmental action to keep mortgage rates low has succeeded, new and existing home sales have not yet recovered to pre-recession levels, keeping mortgage activity somewhat muted. Non-interest Expense Operating expenses totaled $17.73 million for the quarter, an increase over the same quarter in 2008 when the Company reported $15.98 million in total non-interest expense. Salaries and benefits in the current quarter were $7.90 million compared to $8.66 million in the second quarter of 2008, a decrease of 8.8%. Decreases in total headcount by 9.5% or 62 positions, and lower levels of incentive pay accounted for the majority of the decrease in personnel costs. Occupancy and equipment costs as well as communications and data processing costs increased only slightly during the quarter when compared to the same quarter in 2008 despite the additional costs incurred from several new branch openings. Renegotiation of certain operating contracts and efforts to reduce controllable expenses across the Company have succeeded in holding increases in operating expenses to a minimum. Other operating expenses increased from $2.6 million in the second quarter of 2008 to $5.3 million in the second quarter of 2009. FDIC insurance expense during the second quarter was $1.58 million, a $1.41 million increase when compared to the second quarter of 2008. Costs associated with OREO and problem loans totaled $1.41 million in the current quarter compared to $314,000 during the same quarter in 2008. Credit Quality Trends Economic challenges in our markets continue to affect credit quality and the Company's provision for loan losses. During the current quarter, the Company expensed $9.4 million of loan loss provision, an increase of $5.7 million compared to the same quarter in 2008. These loan loss provisions were 138% of the current quarter's net charge-offs, allowing the Company to continue to build its loan loss reserves to 2.68% of total loans, compared to 1.71% at the same time in 2008. Annualized net charge-offs for the quarter were 1.62% of total loans compared to 0.75% in the second quarter of 2008. Non-performing assets during the quarter increased to 5.19% of total loans and foreclosed assets, compared to 4.63% at the end of the first quarter of 2009 and 2.09% at June 30, 2008. At June 30, 2009, 22% of the Company's non-performing assets were in OREO compared to only 7% at the end of 2008. Strong Capital Levels The Company's capital ratios at the end of the quarter continued to be very strong. Tier one and total risk based capital ratios at June 30, 2009 were approximately 9.38% and 13.56%, respectively, compared to 9.42% and 13.13%, respectively, at December 31, 2008. The Company's total risk based capital is approximately 70% over the regulatory guidelines to be adequately capitalized which illustrates the Company's strong capital position. Tangible common equity ended the current quarter at 5.77%, an increase when compared to 5.74% at December 31, 2008. Edwin W. Hortman, Jr., President and CEO, commented on the Company's capital and credit quality, saying "Our efforts to dramatically improve our core earnings have been successful and have allowed us to deal with economic challenges in our credit quality with little or no effect on our tangible capital. Efforts to further increase our core earnings are underway and I expect that higher net interest margins and lower operating expenses in the coming quarters will result and continue to buffer our Company's capital ratios from impacts related to credit quality." Ameris Bancorp is headquartered in Moultrie, Georgia, and at the end of the most recent quarter, had 50 locations in Georgia, Alabama, northern Florida and South Carolina. Ameris Bancorp Common Stock is quoted on the NASDAQ Global Select Market under the symbol "ABCB". The preceding release contains statements that constitute "forward-looking statements" within the meaning of Section 27A of the Securities Act of 1933, as amended, and Section 21E of the Securities Exchange Act of 1934, as amended. The words "believe", "estimate", "expect", "intend", "anticipate" and similar expressions and variations thereof identify certain of such forward-looking statements, which speak only as of the dates which they were made. The Company undertakes no obligation to publicly update or revise any forward-looking statements, whether as a result of new information, future events, or otherwise. Readers are cautioned that any such forward-looking statements are not guarantees of future performance and involve risks and uncertainties, and that actual results may differ materially from those indicated in the forward-looking statements as a result of various factors. Readers are cautioned not to place undue reliance on these forward-looking statements. AMERIS BANCORP FINANCIAL HIGHLIGHTS (unaudited) (dollars in thousands except per share data and FTE headcount) Three Months Ended ------------------ June Mar. Dec. Sept June 2009 2009 2008 2008 2008 ---- ---- ---- ---- ---- EARNINGS Net Income/(Loss) Available to Common Shareholders $(3,359) $(1,225) $(10,725) $366 $3,149 PER COMMON SHARE DATA Earnings per share available to common shareholders: Basic $(0.25) $(0.09) $(0.79) $0.03 $0.23 Diluted $(0.25) $(0.09) $(0.79) $0.03 $0.23 Cash Dividends per share $0.05 $0.05 $0.05 $0.05 $0.14 Book value per share (period end) $13.54 $13.90 $14.06 $14.25 $14.20 Tangible book value per share (period end) $9.26 $9.61 $9.74 $9.92 $9.84 Weighted average number of shares: Basic 13,543,468 13,527,437 13,532,521 13,515,767 13,510,907 Diluted 13,543,468 13,527,437 13,532,521 13,543,612 13,563,032 Period-end number of shares 13,581,179 13,584,107 13,534,601 13,564,032 13,564,032 Market data: High closing price $8.09 $11.73 $14.21 $15.07 $16.48 Low closing price $5.29 $3.66 $7.19 $7.82 $8.70 Period end closing price $6.32 $4.71 $11.85 $14.85 $8.70 Average daily volume 28,778 31,931 31,527 43,464 62,739 PERFORMANCE RATIOS Return on average assets (0.59%) (0.21%) (1.81%) 0.07% 0.59% Return on average common equity (7.15%) (2.61%) (22.17%) 0.78% 6.58% Earning asset yield (TE) 5.60% 5.57% 5.58% 6.38% 6.64% Total cost of funds 2.08% 2.45% 2.72% 2.54% 2.74% Net interest margin (TE) 3.58% 3.21% 2.92% 3.87% 3.96% Non-interest income excluding securities transactions, as a percent of total revenue (TE) 13.26% 12.02% 11.66% 12.49% 14.01% Efficiency ratio 76.63% 70.01% 80.67% 61.97% 65.52% CAPITAL ADEQUACY Common equity to assets 8.05% 8.05% 7.91% 8.56% 8.78% Tangible common equity to tangible assets 5.77% 5.83% 5.74% 6.12% 6.26% OTHER PERIOD- END DATA FTE Headcount 589 597 595 601 651 Assets per FTE $3,880 $3,930 $4,046 $3,756 $3,369 Branch locations 50 48 50 50 48 Deposits per branch location $39,527 $42,264 $40,271 $36,127 $36,893 Six Months Ended ---------------- June June 2009 2008 ---- ---- EARNINGS Net Income/(Loss) Available to Common Shareholders $(4,584) $6,115 PER COMMON SHARE DATA Earnings per share available to common shareholders: Basic $(0.34) $0.45 Diluted $(0.34) $0.45 Cash Dividends per share $0.10 $0.28 Book value per share (period end) $13.54 $14.20 Tangible book value per share (period end) $9.26 $9.84 Weighted average number of shares: Basic 13,534,166 13,557,704 Diluted 13,534,166 13,561,397 Period-end number of shares 13,581,179 13,564,032 Market data: High closing price $11.73 $16.55 Low closing price $3.66 $8.70 Period end closing price $6.32 $8.70 Average daily volume 30,329 62,271 PERFORMANCE RATIOS Return on average assets (0.40%) 0.58% Return on average common equity (4.88%) 6.42% Earning asset yield (TE) 5.59% 6.91% Total cost of funds 2.27% 3.02% Net interest margin (TE) 3.39% 3.94% Non-interest income excluding securities transactions, as a percent of total revenue (TE) 12.63% 13.14% Efficiency ratio 73.37% 66.29% CAPITAL ADEQUACY Common equity to assets 8.05% 8.78% Tangible common equity to tangible assets 5.77% 6.26% OTHER PERIOD-END DATA FTE Headcount 589 651 Assets per FTE $3,880 $3,369 Branch locations 50 48 Deposits per branch location $39,527 $36,893 AMERIS BANCORP FINANCIAL HIGHLIGHTS (unaudited) (dollars in thousands except per share data and FTE headcount) Three Months Ended ------------------ June Mar. Dec. Sept June 2009 2009 2008 2008 2008 ---- ---- ---- ---- ---- INCOME STATEMENT Interest income Interest and fees on loans $25,829 $25,727 $26,582 $28,280 $28,339 Interest on taxable securities 2,906 3,657 3,677 3,563 3,646 Interest on nontaxable securities 255 167 171 169 173 Interest on deposits in other banks 109 25 123 100 91 Interest on federal funds sold 1 41 5 - - -- -- -- -- -- Total interest income 29,100 29,617 30,558 32,112 32,249 ------ ------ ------ ------ ------ Interest expense Interest on deposits $10,030 $12,155 $13,769 $11,717 $12,314 Interest on other borrowings 531 494 817 1,218 879 --- --- --- ----- --- Total interest expense 10,561 12,649 14,586 12,935 13,193 ------ ------ ------ ------ ------ Net interest income 18,539 16,968 15,972 19,177 19,056 Provision for loan losses 9,390 7,912 19,890 8,220 3,720 ----- ----- ------ ----- ----- Net interest income/ (loss) after provision for loan losses $9,149 $9,056 $(3,918) $10,957 $15,336 ------ ------ ------- ------- ------- Noninterest income Service charges on deposit accounts $3,393 $3,035 $3,279 $3,657 $3,664 Mortgage banking activity 877 763 711 745 855 Other service charges, commissions and fees 77 63 90 120 220 Gain(loss) on sale of securities 101 713 316 - - Other non- interest income 148 922 (3) 112 588 --- --- -- --- --- Total noninterest income 4,596 5,496 4,393 4,634 5,327 ----- ----- ----- ----- ----- Noninterest expense Salaries and employee benefits 7,899 7,991 7,309 7,113 8,660 Occupancy and equipment expense 2,224 2,158 2,070 1,904 2,103 Amortization of intangible assets 147 146 291 293 293 Data processing & communications costs 1,704 1,627 1,600 1,678 1,655 Advertising & marketing fees 439 574 739 818 656 Other operating expenses 5,316 3,231 4,419 2,950 2,609 ----- ----- ----- ----- ----- Total noninterest expense 17,729 15,727 16,428 14,756 15,976 ------ ------ ------ ------ ------ Operating profit/(loss) $(3,984) $(1,175) $(15,953) $835 $4,687 Income tax (benefit)/ expense (1,290) (539) (5,556) 469 1,538 ------ ---- ------ --- ----- Net income/(loss) $(2,694) $(636) $(10,397) $366 $3,149 ======= ===== ======== ==== ====== Preferred stock dividends 665 589 328 - - --- --- --- --- --- Net income/(loss) available to common shareholders $(3,359) $(1,225) $(10,725) $366 $3,149 ======= ======= ======== ==== ====== Diluted earnings available to common shareholders (0.25) (0.09) (0.79) 0.03 0.23 ===== ===== ===== ==== ==== Six Months Ended ---------------- June June 2009 2008 ---- ---- INCOME STATEMENT Interest income Interest and fees on loans $51,556 $58,473 Interest on taxable securities 6,563 7,228 Interest on nontaxable securities 422 346 Interest on deposits in other banks 134 291 Interest on federal funds sold 42 - --- --- Total interest income 58,717 66,338 ------ ------ Interest expense Interest on deposits $22,185 26,456 Interest on other borrowings 1,025 2,366 ----- ----- Total interest expense 23,210 28,822 ------ ------ Net interest income 35,507 37,515 Provision for loan losses 17,302 6,920 ------ ----- Net interest income/(loss) after provision for loan losses 18,205 30,595 ------ ------ Noninterest income Service charges on deposit accounts $6,428 6,980 Mortgage banking activity 1,640 1,725 Other service charges, commissions and fees 140 498 Gain(loss) on sale of securities 814 - Other non-interest income 1,070 953 ----- --- Total noninterest income 10,092 10,156 ------ ------ Noninterest expense Salaries and employee benefits 15,890 17,278 Occupancy and equipment expense 4,382 4,095 Amortization of intangible assets 293 585 Data processing & communications costs 3,331 3,178 Advertising & marketing fees 1,013 1,534 Other operating expenses 8,547 4,931 ----- ----- Total noninterest expense 33,456 31,601 ------ ------ Operating profit/(loss) (5,159) 9,151 Income tax (benefit)/expense (1,829) 3,034 ------ ----- Net income/(loss) $(3,330) $6,115 ======= ====== Preferred stock dividends 1,254 - ----- --- Net income/(loss) available to common shareholders $(4,584) $6,115 ======= ====== Diluted earnings available to common shareholders (0.34) 0.45 ===== ==== AMERIS BANCORP FINANCIAL HIGHLIGHTS (unaudited) (dollars in thousands except per share data and FTE headcount) Three Months Ended ------------------ June Mar. Dec. Sept. June 2009 2009 2008 2008 2008 ---- ---- ---- ---- ---- PERIOD-END BALANCE SHEET Assets Cash and due from banks $46,773 $54,758 $66,787 $43,549 $47,720 Federal funds sold and interest bearing balances 163,343 137,770 144,383 75,458 38,125 Investment securities available for sale, at fair value 257,771 344,032 367,894 286,002 291,813 Other investments 6,229 5,702 8,627 11,624 11,439 Loans, net of unearned income 1,677,045 1,672,923 1,695,777 1,710,109 1,678,147 Less allowance for loan losses 44,998 42,417 39,652 30,144 28,660 ------ ------ ------ ------ ------ Loans, net 1,632,047 1,630,506 1,656,125 1,679,965 1,649,487 --------- --------- --------- --------- --------- Premises and equipment, net 67,334 65,152 66,107 65,868 63,291 Intangible assets, net 3,339 3,485 3,631 3,924 4,217 Goodwill 54,813 54,813 54,813 54,813 54,813 Other assets 53,596 50,060 38,723 36,440 32,116 ------ ------ ------ ------ ------ Total assets $2,285,245 $2,346,278 $2,407,090 $2,257,643 $2,193,021 ========== ========== ========== ========== ========== Liabilities Deposits: Noninterest- bearing $210,456 $207,686 $208,532 $198,900 $200,936 Interest- bearing 1,765,915 1,820,998 1,804,993 1,607,439 1,569,925 --------- --------- --------- --------- --------- Total deposits 1,976,371 2,028,684 2,013,525 1,806,339 1,770,861 Federal funds purchased & securities sold under agreements to repurchase 16,484 18,295 27,416 63,973 39,795 Other borrowings 7,000 7,000 72,000 138,600 133,000 Other liabilities 9,967 12,046 12,521 13,118 14,541 Subordinated deferrable interest debentures 42,269 42,269 42,269 42,269 42,269 ------ ------ ------ ------ ------ Total liabilities 2,052,091 2,108,294 2,167,731 2,064,299 2,000,466 --------- --------- --------- --------- --------- Stockholders' equity Preferred stock $49,279 $49,140 $49,028 $- $- Common stock 14,915 14,915 14,866 14,895 14,895 Capital surplus 86,286 86,141 86,038 83,453 83,308 Retained earnings 87,451 91,619 93,696 105,117 105,430 Accumulated other comprehensive loss 6,033 6,956 6,518 666 (291) Less treasury stock (10,810) (10,787) (10,787) (10,787) (10,787) ------- ------- ------- ------- ------- Total stockholders' equity 233,154 237,984 239,359 193,344 192,555 ------- ------- ------- ------- ------- Total liabilities and stockholders' equity $2,285,245 $2,346,278 $2,407,090 $2,257,643 $2,193,021 ========== ========== ========== ========== ========== Other Data Earning Assets 2,104,388 2,160,427 2,216,681 2,083,193 2,019,524 Intangible Assets 58,152 58,298 58,444 58,737 59,030 Interest Bearing Liabilities 1,831,668 1,888,562 1,946,678 1,852,281 1,784,989 Average Assets 2,285,190 2,346,958 2,354,142 2,192,501 2,141,940 Average Common Stockholders' Equity 188,442 190,395 192,479 186,541 192,605 AMERIS BANCORP FINANCIAL HIGHLIGHTS (unaudited) (dollars in thousands except per share data and FTE headcount) Three Months Ended ------------------ June Mar. Dec. Sept June 2009 2009 2008 2008 2008 ---- ---- ---- ---- ---- ASSET QUALITY INFORMATION Allowance for loan losses Balance at beginning of period $42,417 $39,652 $30,144 $28,660 $28,094 Provision for loan loss 9,390 7,912 19,890 8,220 3,720 Charge-offs 7,102 5,521 10,648 6,946 3,801 Recoveries 293 374 266 210 647 --- --- --- --- --- Net charge-offs (recoveries) 6,809 5,147 10,382 6,736 3,154 Ending balance $44,998 $42,417 $39,652 $30,144 $28,660 ======= ======= ======= ======= ======= As a percentage of loans 2.68% 2.54% 2.34% 1.76% 1.71% As a percentage of nonperforming loans 65.35% 66.37% 60.62% 76.46% 89.27% As a percentage of nonperforming assets 51.11% 54.25% 56.52% 69.84% 81.55% Net charge-off information Charge-offs Commercial, Financial & Agricultural $815 $1,389 $1,090 $963 $282 Real Estate - Residential 1,364 1,738 1,951 989 902 Real Estate - Commercial & Farmland 902 277 1,288 628 49 Real Estate - Construction & Development 3,731 1,930 5,932 4,165 2,320 Consumer Installment 290 187 387 201 248 Other 0 - - - - - - - - - Total charge-offs 7,102 5,521 10,648 6,946 3,801 ----- ----- ------ ----- ----- Recoveries Commercial, Financial & Agricultural 16 82 11 71 102 Real Estate - Residential 216 8 30 54 90 Real Estate - Commercial & Farmland 13 230 10 10 68 Real Estate - Construction & Development 8 10 27 26 323 Consumer Installment 40 44 187 49 64 Other 0 - 1 - - - - - - - Total recoveries 293 374 266 210 647 --- --- --- --- --- Net charge-offs (recoveries) $6,809 $5,147 $10,382 $6,736 $3,154 ====== ====== ======= ====== ====== Non-accrual loans 68,858 63,908 65,414 39,427 32,106 Foreclosed assets 19,180 14,271 4,742 3,734 3,032 Accruing loans delinquent 90 days or more 0 2 2 - 5 - - - - - Total non-performing assets 88,038 78,181 70,158 43,161 35,143 ------ ------ ------ ------ ------ Non-performing assets as a percent of loans and foreclosed assets 5.19% 4.63% 4.13% 2.52% 2.09% Net charge offs as a percent of loans (Annualized) 1.63% 1.23% 2.45% 1.58% 0.75% Six Months Ended ---------------- June June 2009 2008 ---- ---- ASSET QUALITY INFORMATION Allowance for loan losses Balance at beginning of period $39,652 $27,640 Provision for loan loss 17,302 6,920 Charge-offs 12,623 6,745 Recoveries 667 845 --- --- Net charge-offs (recoveries) 11,956 5,900 Ending balance $44,998 $28,660 ======= ======= As a percentage of loans 2.68% 1.71% As a percentage of nonperforming loans 65.35% 89.27% As a percentage of nonperforming assets 51.11% 81.55% Net charge-off information Charge-offs Commercial, Financial & Agricultural $2,204 $673 Real Estate - Residential 3,102 1,574 Real Estate - Commercial & Farmland 1,179 348 Real Estate - Construction & Development 5,661 3,624 Consumer Installment 477 527 Other - - --- --- Total charge-offs 12,623 6,745 ------ ----- Recoveries Commercial, Financial & Agricultural 98 120 Real Estate - Residential 224 115 Real Estate - Commercial & Farmland 243 99 Real Estate - Construction & Development 18 356 Consumer Installment 84 154 Other 0 - --- --- Total recoveries 667 845 --- --- Net charge-offs (recoveries) $11,956 $5,900 ======= ====== Non-accrual loans 68,858 32,106 Foreclosed assets 19,180 3,032 Accruing loans delinquent 90 days or more - 5 --- --- Total non-performing assets 88,038 35,143 ------ ------ Non-performing assets as a percent of loans and foreclosed assets 5.19% 2.09% Net charge offs as a percent of loans (Annualized) 1.44% 0.70% AMERIS BANCORP FINANCIAL HIGHLIGHTS (unaudited) (dollars in thousands except per share data and FTE headcount) Three Months Ended ------------------ June Mar. Dec. Sept June 2009 2009 2008 2008 2008 ---- ---- ---- ---- ---- AVERAGE BALANCES Federal funds sold $2,444 $33,034 $9,516 $- $- Interest bearing deposits in banks 159,510 83,424 123,876 21,219 18,236 Investment securities - taxable 231,281 341,296 310,824 269,501 277,300 Investment securities - nontaxable 27,488 18,458 18,132 18,472 19,297 Other investments 6,226 6,797 8,902 11,591 10,707 Loans 1,671,808 1,683,615 1,703,137 1,698,024 1,650,781 --------- --------- --------- --------- --------- Total Earning Assets $2,098,757 $2,166,624 $2,174,387 $2,018,807 $1,976,321 ---------- ---------- ---------- ---------- ---------- Noninterest bearing deposits $205,403 $204,010 $203,810 $200,357 $197,662 NOW accounts 475,498 369,774 306,483 280,892 261,953 MMDA 333,998 268,946 276,106 326,642 345,824 Savings accounts 57,503 55,529 53,055 55,143 54,973 Retail CDs < $100,000 365,771 439,781 443,358 342,136 345,968 Retail CDs > $100,000 381,719 474,956 486,833 405,126 404,455 Brokered CDs 151,780 189,538 218,195 182,525 153,232 ------- ------- ------- ------- ------- Total Deposits 1,971,672 2,002,534 1,987,840 1,792,821 1,764,067 --------- --------- --------- --------- --------- FHLB advances 2,000 25,214 70,630 130,849 111,922 Subordinated debentures 42,269 42,269 42,269 42,269 42,269 Repurchase agreements 15,211 19,233 22,158 12,082 3,721 Correspondent bank line of credit and other 5,000 5,000 5,000 18,631 10,094 ----- ----- ----- ------ ------ Total Non- Deposit Funding 64,480 91,716 140,057 203,831 168,006 ------ ------ ------- ------- ------- ---------- ---------- ---------- ---------- ---------- Total Funding $2,036,152 $2,094,250 $2,127,897 $1,996,652 $1,932,073 ---------- ---------- ---------- ---------- ---------- Six Months Ended ---------------- June June 2009 2008 ---- ---- AVERAGE BALANCES Federal funds sold $17,739 - Interest bearing deposits in banks 121,467 20,858 Investment securities - taxable 286,289 270,345 Investment securities - nontaxable 22,973 18,832 Other investments 6,511 10,329 Loans 1,677,712 1,634,386 --------- --------- Total Earning Assets $2,132,691 1,954,750 ---------- --------- Noninterest bearing deposits $204,706 194,761 NOW accounts 422,636 262,747 MMDA 301,472 347,248 Savings accounts 56,516 54,597 Retail CDs < $100,000 402,776 350,910 Retail CDs > $100,000 428,338 400,118 Brokered CDs 170,659 146,134 ------- ------- Total Deposits 1,987,103 1,756,514 --------- --------- FHLB advances 13,607 104,542 Subordinated debentures 42,269 42,269 Repurchase agreements 17,222 5,848 Correspondent bank line of credit and other 5,000 9,805 ----- ----- Total Non-Deposit Funding 78,098 162,464 ------ ------- ---------- ---------- Total Funding $2,065,201 $1,918,978 ---------- ---------- AMERIS BANCORP FINANCIAL HIGHLIGHTS (unaudited) (dollars in thousands except per share data and FTE headcount) Three Months Ended ------------------ June Mar. Dec. Sept June 2009 2009 2008 2008 2008 ---- ---- ---- ---- ---- INTEREST INCOME/ EXPENSE INTEREST INCOME Federal funds sold $1 $41 $5 $- $- Interest bearing deposits in banks 109 25 118 99 91 Investment securities - taxable 2,890 3,640 3,662 3,488 3,489 Investment securities - nontaxable (TE) 392 258 262 260 267 Other investments 18 17 16 76 156 Loans (TE) 25,886 25,794 26,514 28,559 28,704 ------ ------ ------ ------ ------ Total Earning Assets $29,296 $29,775 $30,577 $32,482 $32,707 ------- ------- ------- ------- ------- INTEREST EXPENSE Non-interest bearing deposits $- $- $- $- $- NOW accounts 1,504 966 924 793 584 MMDA 1,404 1,051 1,444 1,929 1,996 Savings accounts 106 105 123 121 129 Retail CDs < $100,000 2,625 3,936 4,181 3,038 3,463 Retail CDs > $100,000 2,970 4,594 4,836 3,818 4,287 Brokered CDs 1,424 1,503 2,260 2,018 1,855 ----- ----- ----- ----- ----- Total Deposits 10,033 12,155 13,768 11,717 12,314 ------ ------ ------ ------ ------ FHLB advances 31 (8) 186 359 302 Subordinated debentures 443 436 494 493 487 Repurchase agreements 33 38 73 69 15 Correspondent bank line of credit and other 35 28 65 153 75 -- -- -- --- -- Total Non- Deposit Funding 542 494 818 1,074 879 --- --- --- ----- --- ------- ------- ------- ------- ------- Total Funding $10,575 $12,649 $14,586 $12,791 $13,193 ------- ------- ------- ------- ------- ------- ------- ------- ------- ------- Net Interest Income (TE) $18,721 $17,126 $15,991 $19,691 $19,513 ------- ------- ------- ------- ------- Six Months Ended ---------------- June June 2009 2008 ---- ---- INTEREST INCOME/EXPENSE INTEREST INCOME Federal funds sold $42 $- Interest bearing deposits in banks 134 292 Investment securities - taxable 6,530 6,918 Investment securities - nontaxable (TE) 650 532 Other investments 35 296 Loans (TE) 51,680 59,113 ------ ------ Total Earning Assets 59,071 67,151 ------ ------ INTEREST EXPENSE Non-interest bearing deposits $- $- NOW accounts 2,470 1,251 MMDA 2,455 4,779 Savings accounts 211 247 Retail CDs < $100,000 6,561 7,521 Retail CDs > $100,000 7,564 9,039 Brokered CDs 2,927 3,620 ----- ----- Total Deposits 22,188 26,457 ------ ------ FHLB advances 23 955 Subordinated debentures 879 1,173 Repurchase agreements 71 48 Correspondent bank line of credit and other 63 190 -- --- Total Non-Deposit Funding 1,036 2,366 ----- ----- ------- ------- Total Funding $23,224 $28,823 ------- ------- ------- ------- Net Interest Income (TE) $35,847 $38,328 ------- ------- AMERIS BANCORP FINANCIAL HIGHLIGHTS (unaudited) (dollars in thousands except per share data and FTE headcount) Three Months Ended ------------------ June Mar. Dec. Sept June 2009 2009 2008 2008 2008 ---- ---- ---- ---- ---- YIELDS (1) Federal funds sold 0.16% 0.50% 0.21% 0.00% 0.00% Interest bearing deposits in banks 0.27% 0.12% 0.38% 1.85% 2.00% Investment securities - taxable 5.01% 4.33% 4.67% 5.13% 5.05% Investment securities - nontaxable 5.72% 5.67% 5.73% 5.58% 5.55% Other investments 1.16% 1.01% 0.71% 2.60% 5.84% Loans 6.21% 6.21% 6.18% 6.67% 6.97% ---- ---- ---- ---- ---- Total Earning Assets 5.60% 5.57% 5.58% 6.38% 6.64% Noninterest bearing deposits 0.00% 0.00% 0.00% 0.00% 0.00% NOW accounts 1.27% 1.06% 1.20% 1.12% 0.89% MMDA 1.69% 1.58% 2.07% 2.34% 2.32% Savings accounts 0.74% 0.77% 0.92% 0.87% 0.94% Retail CDs < $100,000 2.88% 3.63% 3.74% 3.52% 4.01% Retail CDs > $100,000 3.12% 3.92% 3.94% 3.74% 4.25% Brokered CDs 3.76% 3.22% 4.11% 4.39% 4.86% ---- ---- ---- ---- ---- Total Deposits 2.04% 2.46% 2.75% 2.59% 2.80% FHLB advances 6.22% (0.13%) 1.04% 1.09% 1.08% Subordinated debentures 4.20% 4.18% 4.64% 4.63% 4.62% Repurchase agreements 0.87% 0.80% 1.31% 2.27% 1.62% Correspondent bank line of credit and other 2.81% 2.27% 5.16% 3.26% 2.98% ---- ---- ---- ---- ---- Total Non- Deposit Funding 3.37% 2.18% 2.32% 2.09% 2.10% ---- ---- ---- ---- ---- Total funding (3) 2.08% 2.45% 2.72% 2.54% 2.74% ---- ---- ---- ---- ---- Net interest spread 3.52% 3.12% 2.86% 3.84% 3.90% ---- ---- ---- ---- ---- Net interest margin 3.58% 3.21% 2.92% 3.87% 3.96% ==== ==== ==== ==== ==== Six Months Ended ---------- June June 2009 2008 ---- ---- YIELDS (1) Federal funds sold 0.48% 0.00% Interest bearing deposits in banks 0.22% 2.82% Investment securities - taxable 4.60% 5.15% Investment securities - nontaxable 5.71% 5.68% Other investments 1.08% 5.76% Loans 6.21% 7.27% ---- ---- Total Earning Assets 5.59% 6.91% Noninterest bearing deposits 0.00% 0.00% NOW accounts 1.18% 1.91% MMDA 1.64% 5.54% Savings accounts 0.75% 1.82% Retail CDs < $100,000 3.28% 4.31% Retail CDs > $100,000 3.56% 4.54% Brokered CDs 3.46% 4.98% ---- ---- Total Deposits 2.25% 3.03% FHLB advances 0.34% 1.84% Subordinated debentures 4.19% 5.58% Repurchase agreements 0.83% 1.65% Correspondent bank line of credit and other 2.54% 3.90% ---- ---- Total Non-Deposit Funding 2.68% 2.93% ---- ---- Total funding (3) 2.27% 3.02% ---- ---- Net interest spread 3.32% 3.89% ---- ---- Net interest margin 3.39% 3.94% ==== ==== (1) Interest and average rates are calculated on a tax-equivalent basis using an effective tax rate of 35%. (2) Rate calculated based on average earning assets. (3) Rate calculated based on total average funding including non-interest bearing liabilities. http://www.newscom.com/cgi-bin/prnh/20051117/CLTH039LOGODATASOURCE: Ameris Bancorp CONTACT: Dennis J. Zember Jr., Executive Vice President & CFO, Ameris Bancorp, +1-229-890-1111 Web Site: http://www.amerisbank.com/

Copyright

1 Year Ameris Bancorp Chart

1 Year Ameris Bancorp Chart

1 Month Ameris Bancorp Chart

1 Month Ameris Bancorp Chart

Your Recent History

Delayed Upgrade Clock