ADVFN Logo ADVFN

We could not find any results for:
Make sure your spelling is correct or try broadening your search.

Trending Now

Toplists

It looks like you aren't logged in.
Click the button below to log in and view your recent history.

Hot Features

Registration Strip Icon for discussion Register to chat with like-minded investors on our interactive forums.

ABCB Ameris Bancorp

60.00
0.00 (0.00%)
25 Jul 2024 - Closed
Delayed by 15 minutes
Share Name Share Symbol Market Type
Ameris Bancorp NASDAQ:ABCB NASDAQ Common Stock
  Price Change % Change Share Price Bid Price Offer Price High Price Low Price Open Price Shares Traded Last Trade
  0.00 0.00% 60.00 58.84 61.16 0 01:00:00

Ameris Bancorp Reports Results for Third Quarter of 2008

21/10/2008 2:00pm

PR Newswire (US)


Ameris Bancorp (NASDAQ:ABCB)
Historical Stock Chart


From Jul 2019 to Jul 2024
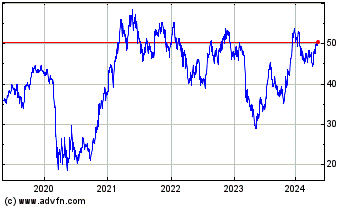
Click Here for more Ameris Bancorp Charts.
MOULTRIE, Ga., Oct. 21 /PRNewswire-FirstCall/ -- AMERIS BANCORP (NASDAQ: ABCB), reported net income of $366,000, or $0.03 per share, for the quarter ended September 30, 2008, compared to net income for the same quarter in 2007 of $3.6 million, or $0.26 per share. Net income for the year-to-date period totaled $6.5 million, or $0.48 per share, compared to $14.0 million, or $1.02 per share for the same period in 2007. Unusually high levels of loan loss provision have been required as several of the Company's markets have been adversely affected by increasingly negative economic trends. (Logo: http://www.newscom.com/cgi-bin/prnh/20051117/CLTH039LOGO ) Provision for Loan Losses and Credit Quality The Company's provision for loan losses during the third quarter amounted to $8.2 million, an increase of $5.2 million over the $3.0 million recorded in the third quarter of 2007. Similarly, provision for loan losses for the year- to-date period increased $10.7 million to $15.1 million for the first nine months of 2008, compared to 2007. Non-performing assets increased during the current quarter to 2.52% of total loans, compared to 2.09% for the second quarter of 2008 and 1.57% at December 31, 2007. Net charge-offs on loans during the third quarter of 2008 increased to $6.7 million, compared to $3.2 million in the second quarter of 2008 and $1.6 million in the same quarter of 2007. The Company's credit quality has declined as real estate activity and valuations continue to fall. Construction and development loans account for approximately 61% and 59% of the net charge-offs in the current quarter and year-to-date periods ended September 30, 2008, respectively. In addition to losses in the construction and development portfolio, residential real estate loans account for approximately 14% and 19% of the net charge-offs in the current quarter and year-to-date periods ended September 30, 2008, respectively. Construction and development loans account for approximately 21.1% and 24.7% of total loans for the period ended September 30, 2008 and September 30, 2007, respectively, while residential real estate loans account for approximately 20.3% and 19.2% of total loans during that same time period. Trends in Net Interest Income and Net Interest Margin Total net interest income of $19.2 million for the third quarter of 2008 represented only a slight increase over the $19.1 million recorded in the third quarter of 2007. Similarly, the year-to-date period reflected small increases in total net interest income, increasing 1.5% to $56.7 million. Lower levels of growth in net interest income were the result of modest levels of loan growth combined with declining overall margins. The Company's net interest margin declined in the current quarter to 3.87%, compared to 4.03% in the same quarter in 2007. For the year-to-date period ended September 30, 2008, the Company reported a decline in the net interest margin to 3.92% from 4.05% in the same period in 2007. Increases in non-performing assets of $21.2 million from September 30, 2007, to September 30, 2008, accounted for 44% of the decline in net interest margin. Yields on earning assets declined to 6.38% in the current quarter, from 7.87% in the same quarter in 2007. This decline in overall yields resulted primarily from changes in loan yields, which fell from 8.48% during the third quarter of 2007 to 6.67% during the third quarter of 2008. Decreases in interest income on loans were partially offset by increases in investment securities, the yields on which increased to 5.06% for the third quarter of 2008, compared to 4.96% in the third quarter of 2007. Funding costs also offset some of the declines in earning asset yields. Total funding costs declined to 2.54% in the third quarter of 2008, compared to 3.90% in the same quarter of 2007. Declines in the yields on time deposits accounted for most of the decline in funding costs, falling to 3.79% in the current quarter, compared to 5.08% in the third quarter of 2007. The cost of non-deposit borrowing fell significantly to 2.09% in the third quarter of 2008, from 5.78% in the third quarter of 2007. The majority of the Company's non-deposit borrowings are LIBOR-based and have benefited materially from both declining rates and interest rate floors tied to the Company's borrowings from the FHLB. Non-Interest Income Total non-interest income remained virtually unchanged during the third quarter at $4.6 million when compared to the third quarter of 2007. Increases in service charges on deposit accounts to $3.7 million offset smaller declines in the other non-interest income categories, including mortgage banking activities. Increases in charges and fees have allowed the Company to experience better than average growth in fee income while slower activity in residential real estate in many of the Company's markets has slowed the growth of mortgage-related revenue. Non-Interest Expense Total non-interest expense for the third quarter of 2008 was $14.8 million, a decrease of approximately $408,000 from the same period in 2007. Salaries and benefits in the current quarter decreased approximately 4.4% to $7.1 million, when compared to the third quarter of 2007. This decline is primarily attributable to a reduction in incentive pay expense of approximately $1.3 million. Although the Company's previously announced workforce reduction was completed during the third quarter, the impact will not begin to be realized until the fourth quarter of 2008 due to its timing during the quarter and the related severance expense. Occupancy and equipment expense increased during the quarter to $1.9 million, an increase of 8.4% when compared to the same period in 2007. Additional offices, primarily in South Carolina and Jacksonville, Florida, are the primary reasons for the additional occupancy expenses. Ameris Bancorp is headquartered in Moultrie, Georgia, and at the end of the most recent quarter, had 50 locations in Georgia, Alabama, northern Florida and South Carolina. *********************************************************************** Ameris Bancorp Common Stock is quoted on the NASDAQ Global Select Market under the symbol "ABCB". The preceding release contains statements that constitute "forward-looking statements" within the meaning of Section 27A of the Securities Act of 1933, as amended, and Section 21E of the Securities Exchange Act of 1934, as amended. The words "believe", "estimate", "expect", "intend", "anticipate" and similar expressions and variations thereof identify certain of such forward-looking statements, which speak only as of the dates which they were made. The Company undertakes no obligation to publicly update or revise any forward-looking statements, whether as a result of new information, future events, or otherwise. Readers are cautioned that any such forward-looking statements are not guarantees of future performance and involve risks and uncertainties, and that actual results may differ materially from those indicated in the forward-looking statements as a result of various factors. Readers are cautioned not to place undue reliance on these forward- looking statements. AMERIS BANCORP FINANCIAL HIGHLIGHTS (unaudited) (dollars in thousands except per share data and FTE headcount) Three Months Ended Sept. June Mar. Dec. Sept. 2008 2008 2008 2007 2007 EARNINGS Net Income $366 $3,149 $2,966 $1,197 $3,570 PER COMMON SHARE DATA Earnings per share: Basic 0.03 0.23 0.22 0.09 0.26 Diluted 0.03 0.23 0.22 0.09 0.26 Cash Dividends per share 0.05 0.14 0.14 0.14 0.14 Book value per share (period end) 14.25 14.20 14.48 14.12 13.93 Tangible book value per share (period end) 9.92 9.84 10.11 9.72 9.51 Weighted average number of shares: Basic 13,515,767 13,510,907 13,550,744 13,485,765 13,501,663 Diluted 13,543,612 13,563,032 13,559,761 13,573,626 13,620,069 Period-end number of shares 13,564,032 13,564,032 13,556,770 13,539,985 13,539,195 Market data: High closing price 15.02 16.20 16.41 18.67 23.05 Low closing price 7.79 8.70 12.49 13.73 17.72 Period end closing price 14.85 8.70 16.06 16.85 18.08 Average daily volume 43,464 62,739 61,780 51,604 50,547 PERFORMANCE RATIOS Return on average assets 0.07% 0.59% 0.56% 0.23% 0.68% Return on average equity 0.78% 6.58% 6.15% 2.49% 7.56% Earning asset yield (TE) 6.38% 6.64% 7.17% 7.66% 7.87% Total cost of funds 2.54% 2.74% 3.30% 3.79% 3.90% Net interest margin (TE) 3.87% 3.96% 3.91% 3.92% 4.03% Non-interest income excluding securities transactions, as a percent of total revenue (TE) 12.50% 13.97% 12.33% 10.09% 10.87% Efficiency ratio 61.98% 65.50% 67.12% 67.21% 64.08% CAPITAL ADEQUACY Equity to assets 8.56% 8.78% 9.27% 9.06% 8.96% Tangible common equity to assets 6.12% 6.26% 6.66% 6.41% 6.30% OTHER PERIOD-END DATA FTE Headcount 601 651 634 620 621 Assets per FTE $3,756 $3,369 $3,341 $3,407 $3,390 Branch locations 50 48 45 46 47 Deposits per branch location $36,127 $36,893 $39,651 $38,201 $36,345 Nine Months Ended Sept. Sept. 2008 2007 EARNINGS Net Income $ 6,481 $13,967 PER COMMON SHARE DATA Earnings per share: Basic 0.48 1.04 Diluted 0.48 1.02 Cash Dividends per share 0.33 0.42 Book value per share (period end) 14.25 13.93 Tangible book value per share (period end) 9.92 9.51 Weighted average number of shares: Basic 13,508,006 13,477,065 Diluted 13,555,469 13,650,217 Period-end number of shares 13,564,032 13,539,195 Market data: High closing price 16.20 27.94 Low closing price 7.79 17.72 Period end closing price 14.85 18.08 Average daily volume 55,903 43,565 PERFORMANCE RATIOS Return on average assets 0.40% 0.92% Return on average equity 4.53% 10.10% Earning asset yield (TE) 6.73% 7.84% Total cost of funds 2.86% 3.85% Net interest margin (TE) 3.92% 4.05% Non-interest income excluding securities transactions, as a percent of total revenue (TE) 12.93% 11.17% Efficiency ratio 64.86% 62.36% CAPITAL ADEQUACY Equity to assets 8.56% 8.96% Tangible common equity to assets 6.12% 6.30% OTHER PERIOD-END DATA FTE Headcount 601 621 Assets per FTE $3,756 $3,390 Branch locations 50 47 Deposits per branch location $36,127 $36,345 AMERIS BANCORP FINANCIAL HIGHLIGHTS (unaudited) (dollars in thousands except per share data and FTE headcount) Three Months Ended Nine Months Ended Sept. June Mar. Dec. Sept. Sept. Sept. 2008 2008 2008 2007 2007 2008 2007 INCOME STATEMENT Interest income Interest and fees on loans 28,280 28,339 30,134 32,999 33,479 $86,752 $95,811 Interest on taxable securities 3,563 3,646 3,583 3,576 3,480 10,793 10,252 Interest on nontaxable securities 169 173 172 158 175 514 530 Interest on deposits in other banks 100 91 200 259 317 391 2,017 Interest on federal funds sold 0 0 0 (20) 0 0 92 Total interest income 32,112 32,249 34,089 36,972 37,451 98,450 108,702 Interest expense Interest on deposits 11,717 12,314 14,142 15,620 15,877 38,173 46,621 Interest on other borrowings 1,218 879 1,487 2,367 2,493 3,584 6,252 Total interest expense 12,935 13,193 15,629 17,987 18,370 41,757 52,873 Net interest income 19,177 19,056 18,460 18,985 19,081 56,693 55,829 Provision for loan losses 8,220 3,720 3,200 6,914 2,964 15,140 4,407 Net interest income after provision for loan losses 10,957 15,336 15,260 12,071 16,117 41,553 51,422 Noninterest income Service charges on deposit accounts 3,657 3,664 3,316 3,310 3,197 10,637 9,133 Mortgage banking activity 745 855 869 827 783 2,469 2,265 Other service charges, commissions and fees 120 220 278 942 203 618 1,008 Gain(loss) on sale of securities 0 0 0 (236) (69) 0 (61) Other non- interest income 117 574 379 (677) 477 1,070 1,414 Total non interest income 4,639 5,313 4,842 4,166 4,591 14,794 13,759 Noninterest expense Salaries and employee benefits 7,113 8,660 8,618 7,122 7,438 24,391 22,662 Equipment and occupancy expense 1,904 2,103 1,992 2,118 1,757 5,999 5,151 Amortization of intangible assets 293 293 293 324 324 879 973 Data Processing Fees 1,238 1,226 1,093 1,096 1,110 3,557 3,436 Other operating expenses 4,213 3,680 3,644 4,900 4,540 11,537 11,171 Total non interest expense 14,761 15,962 15,640 15,560 15,169 46,363 43,393 Operating Profit 835 4,687 4,462 677 5,539 9,984 21,788 Provision for income taxes 469 1,538 1,496 (520) 1,969 3,503 7,821 Net Income 366 3,149 2,966 1,197 3,570 $6,481 $13,967 Diluted earnings per share 0.03 0.23 0.22 0.09 0.26 0.48 1.02 AMERIS BANCORP FINANCIAL HIGHLIGHTS (unaudited) (dollars in thousands except per share data and FTE headcount) Three Months Ended Sept. June Mar. Dec. Sept. 2008 2008 2008 2007 2007 PERIOD-END BALANCE SHEET Assets Cash and due from banks $43,549 $47,720 $63,401 $59,804 $58,634 Federal funds sold and interest bearing balances 75,458 38,125 4,389 12,022 22,910 Securities available for sale, at fair value 287,790 293,601 297,589 291,170 301,978 Restricted equity securities, at cost 9,836 9,651 6,996 7,559 8,729 Loans, net of unearned income 1,710,109 1,678,147 1,622,437 1,614,048 1,593,014 Less allowance for loan losses 30,144 28,660 28,094 27,640 26,434 Loans, net 1,679,965 1,649,487 1,594,343 1,586,408 1,566,580 Premises and equipment, net 65,868 63,291 60,053 59,132 54,639 Intangible assets, net 3,924 4,217 4,509 4,802 5,126 Goodwill 54,813 54,813 54,675 54,813 54,675 Other assets 36,440 32,116 32,288 36,353 31,923 Total Assets $2,257,643 $2,193,021 $2,118,243 $2,112,063 $2,105,194 Liabilities Deposits: Noninterest- bearing $198,900 $200,936 $199,692 $197,345 $185,803 Interest- bearing 1,607,439 1,569,925 1,584,599 1,559,920 1,522,405 Total deposits 1,806,339 1,770,861 1,784,291 1,757,265 1,708,208 Federal funds purchased & securities sold under agreements to repurchase 63,973 39,795 4,987 14,705 32,359 Other borrowings 138,600 133,000 74,500 90,500 116,500 Other liabilities 13,118 14,541 15,888 16,075 17,262 Subordinated deferrable interest debentures 42,269 42,269 42,269 42,269 42,269 Total liabilities 2,064,299 2,000,466 1,921,935 1,920,814 1,916,598 Stockholders' equity Common stock 14,895 14,895 14,887 14,870 14,869 Capital surplus 83,453 83,308 82,920 82,750 82,308 Retained earnings 105,117 105,430 104,182 103,095 103,803 Accumulated other comprehensive loss 666 (291) 5,093 1,303 (1,616) Less treasury stock (10,787) (10,787) (10,774) (10,769) (10,768) Total stockholders' equity 193,344 192,555 196,308 191,249 188,596 Total liabilities and stockholders' equity $2,257,643 $2,193,021 $2,118,243 $2,112,063 $2,105,194 Other Data Earning Assets 2,073,357 2,009,873 1,924,415 1,917,240 1,917,902 Intangible Assets 58,737 59,030 59,184 59,615 59,801 Interest Bearing Liabilities 1,852,281 1,784,989 1,706,355 1,707,394 1,713,533 Average Assets 2,192,501 2,141,940 2,115,561 2,102,579 2,069,715 Average Stockholders' Equity 186,541 192,605 193,971 191,124 187,290 AMERIS BANCORP FINANCIAL HIGHLIGHTS (unaudited) (dollars in thousands except per share data and FTE headcount) Three Months Ended Nine Months Ended Sept. June Mar. Dec. Sept. Sept. Sept. 2008 2008 2008 2007 2007 2008 2007 ASSET QUALITY INFORMATION Allowance for loan losses Balance at beginning of period $28,660 $28,094 $27,640 $26,434 $25,032 $27,640 $24,863 Provision for loan loss 8,220 3,720 3,200 6,914 2,964 15,140 4,407 Charge-offs 6,946 3,800 2,945 6,465 1,807 13,691 3,921 Recoveries 210 646 199 757 245 1,055 1,086 Net charge- offs (recoveries) 6,736 3,154 2,746 5,708 1,562 12,636 2,835 Ending balance $30,144 $28,660 $28,094 $27,640 $26,434 $30,144 $26,435 As a percentage of loans 1.76% 1.71% 1.73% 1.71% 1.66% 1.76% 1.66% As a percentage of nonperforming loans 76.46% 89.27% 104.78% 149.66% 135.81% 76.46% 135.82% As a percentage of nonperforming assets 69.84% 81.56% 86.34% 108.56% 120.37% 69.84% 120.37% Net Charge-off information Charge-offs Commercial, Financial & Agricultural $963 $282 $390 $421 $353 $1,635 $757 Real Estate - Residential 989 902 672 1,262 433 2,563 1,007 Real Estate - Commercial & Farmland 628 49 299 621 119 976 622 Real Estate - Construction & Development 4,165 2,319 1,305 3,899 709 7,789 1,114 Consumer Installment 201 248 279 262 193 728 421 Other 0 0 0 0 0 0 0 Total charge -offs 6,946 3,800 2,945 6,465 1,807 13,691 3,921 Recoveries Commercial, Financial & Agricultural $83 $102 $18 $95 $41 $203 $494 Real Estate - Residential 54 90 25 14 48 169 116 Real Estate - Commercial & Farmland (3) 68 31 159 79 96 181 Real Estate - Construction & Development 26 322 34 401 13 382 14 Consumer Installment 50 64 90 88 64 204 281 Other 0 0 1 0 0 1 0 Total recoveries 210 - 646 - 199 - 757 Net charge- offs (recoveries) $6,736 $3,154 $2,746 $5,708 $1,562 $12,636 $2,835 Non-accrual loans 39,427 32,106 26,812 18,468 19,464 39,427 19,464 Foreclosed assets 3,734 3,032 5,727 6,993 2,497 3,734 2,497 Total non- performing assets 43,161 35,138 32,539 25,461 21,961 43,161 21,961 Non-performing assets as a percent of loans and foreclosed assets 2.52% 2.09% 2.00% 1.57% 1.38% 2.52% 1.38% Net charge offs as a percent of loans (Annualized) 1.58% 0.75% 0.68% 1.41% 0.39% 2.22% 0.53% AMERIS BANCORP FINANCIAL HIGHLIGHTS (unaudited) (dollars in thousands except per share data and FTE headcount) Three Months Ended Sept. June Mar. Dec. Sept. 2008 2008 2008 2007 2007 AVERAGE BALANCES Short term assets $21,219 $18,236 $23,480 $21,826 $26,212 Investment securities 299,564 307,304 291,708 297,380 299,925 Loans 1,698,024 1,650,781 1,617,991 1,605,006 1,569,906 Total Earning Assets 2,018,807 1,976,321 1,933,179 1,924,212 1,896,043 Noninterest bearing deposits 200,357 197,662 191,860 187,908 190,315 Interest bearing deposits 607,534 607,777 612,212 596,053 575,415 Savings 55,143 54,973 54,221 55,305 58,778 CDs 929,787 903,655 890,668 886,117 870,731 Deposits 1,792,821 1,764,067 1,748,961 1,725,383 1,695,239 FHLB advances 130,849 111,922 97,162 105,570 110,056 Subordinated debentures 42,269 42,269 42,269 42,269 42,269 Other borrowings 30,713 13,815 17,490 22,298 18,878 Total non- deposit funding 203,831 168,006 156,921 170,137 171,203 Total funding $1,996,652 $1,932,073 $1,905,882 $1,895,520 $1,866,442 Nine Months Ended Sept. Sept. 2008 2007 AVERAGE BALANCES Short term assets $20,978 $53,570 Investment securities 299,525 298,251 Loans 1,655,599 1,513,321 Total Earning Assets 1,976,102 1,865,142 Noninterest bearing deposits 196,626 194,131 Interest bearing deposits 609,174 567,448 Savings 54,779 61,148 CDs 908,037 870,774 Deposits 1,768,616 1,693,501 FHLB advances 113,311 88,237 Subordinated debentures 42,269 42,269 Other borrowings 20,673 14,467 Total non-deposit funding 176,253 144,973 Total funding $1,944,869 $1,838,474 AMERIS BANCORP FINANCIAL HIGHLIGHTS (unaudited) (dollars in thousands except per share data and FTE headcount) Three Months Ended Nine Months Ended Sept. June Mar. Dec. Sept. Sept. Sept. 2008 2008 2008 2007 2007 2008 2007 INTEREST INCOME/ EXPENSE Short term assets $100 $91 $193 $239 $317 $384 $2,111 Investment securities (TE) 3,823 3,912 3,842 3,818 3,750 11,577 11,067 Loans (TE) 28,559 28,704 30,409 33,078 33,560 87,672 96,239 Total Earning Assets 32,482 32,707 34,444 37,135 37,627 99,633 109,417 Noninterest bearing deposits - - - - - - - Interest bearing deposits 2,722 2,580 3,450 4,238 4,577 8,752 13,153 Savings 121 129 118 142 154 368 481 CDs 8,874 9,605 10,575 11,379 11,146 29,054 32,987 Deposits 11,717 12,314 14,143 15,759 15,877 38,174 46,621 FHLB advances 359 302 653 1,299 1,461 1,314 3,433 Subordinated debentures 493 487 686 832 811 1,666 2,333 Other borrowings 222 90 148 236 221 460 486 Total non- deposit funding 1,074 879 1,487 2,367 2,493 3,440 6,252 Total funding $12,791 $13,193 $15,630 $18,126 $18,370 $41,614 $52,873 Net Interest Income (TE) $19,691 $19,514 $18,814 $19,009 $19,257 $58,019 $56,544 AMERIS BANCORP FINANCIAL HIGHLIGHTS (unaudited) (dollars in thousands except per share data and FTE headcount) Nine Three Months Ended Months Ended Sept. June Mar. Dec. Sept. Sept. Sept. 2008 2008 2008 2007 2007 2008 2007 YIELDS (1) Short term assets 1.87% 2.00% 3.31% 4.34% 4.80% 2.45% 5.27% Investment securities 5.06% 5.11% 5.30% 5.09% 4.96% 5.16% 4.96% Loans 6.67% 6.97% 7.56% 8.18% 8.48% 7.07% 8.50% Total Earning Assets (2) 6.38% 6.64% 7.17% 7.66% 7.87% 6.73% 7.84% Noninterest bearing deposits Interest bearing deposits 1.78% 1.70% 2.27% 2.82% 3.16% 1.92% 3.10% Savings 0.87% 0.94% 0.88% 1.02% 1.04% 0.90% 1.05% CDs 3.79% 4.26% 4.78% 5.09% 5.08% 4.27% 5.06% Deposits 2.59% 2.80% 3.25% 3.62% 3.72% 2.88% 3.68% FHLB advances 1.09% 1.08% 2.70% 4.88% 5.27% 1.55% 5.20% Subordinated debentures 4.63% 4.62% 6.53% 7.81% 7.61% 5.26% 7.38% Other borrowings 2.87% 2.61% 3.40% 4.20% 4.64% 2.97% 4.49% Total non- deposit funding 2.09% 2.10% 3.81% 5.52% 5.78% 2.61% 5.77% Total funding (3) 2.54% 2.74% 3.30% 3.79% 3.90% 2.86% 3.85% Net interest spread 3.84% 3.90% 3.87% 3.86% 3.97% 3.88% 4.00% Net interest margin 3.87% 3.96% 3.91% 3.92% 4.03% 3.92% 4.05% (1) Interest and average rates are calculated on a tax-equivalent basis using an effective tax rate of 35%. (2) Rate calculated based on average earning assets. (3) Rate calculated based on average interest bearing liabilities. http://www.newscom.com/cgi-bin/prnh/20051117/CLTH039LOGO http://photoarchive.ap.org/ DATASOURCE: Ameris Bancorp CONTACT: Dennis J. Zember Jr., Executive Vice President & CFO, +1-229- 890-1111 Web site: http://www.amerisbank.com/

Copyright

1 Year Ameris Bancorp Chart

1 Year Ameris Bancorp Chart

1 Month Ameris Bancorp Chart

1 Month Ameris Bancorp Chart

Your Recent History

Delayed Upgrade Clock