ADVFN Logo ADVFN

We could not find any results for:
Make sure your spelling is correct or try broadening your search.

Trending Now

Toplists

It looks like you aren't logged in.
Click the button below to log in and view your recent history.

Hot Features

Registration Strip Icon for discussion Register to chat with like-minded investors on our interactive forums.

ABCB Ameris Bancorp

60.00
0.00 (0.00%)
25 Jul 2024 - Closed
Delayed by 15 minutes
Share Name Share Symbol Market Type
Ameris Bancorp NASDAQ:ABCB NASDAQ Common Stock
  Price Change % Change Share Price Bid Price Offer Price High Price Low Price Open Price Shares Traded Last Trade
  0.00 0.00% 60.00 58.84 61.16 0 01:00:00

Ameris Bancorp Reports Results for 2008

29/01/2009 9:00pm

PR Newswire (US)


Ameris Bancorp (NASDAQ:ABCB)
Historical Stock Chart


From Jul 2019 to Jul 2024
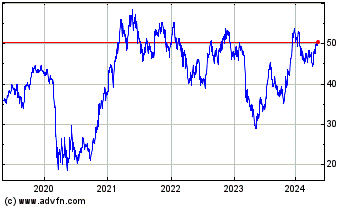
Click Here for more Ameris Bancorp Charts.
MOULTRIE, Ga., Jan. 29 /PRNewswire-FirstCall/ -- AMERIS BANCORP (NASDAQ: ABCB) today reported a net loss of $4.2 million, or $0.31 per diluted share, for the year ended December 31, 2008, compared to net income of $15.2 million, or $1.11 per diluted share, for 2007. For the fourth quarter of 2008, the Company reported a net loss of $10.7 million, or $0.79 per diluted share, compared to net income of $1.2 million, or $0.09 per diluted share, during the fourth quarter of 2007. The Company's net loss for the year and the fourth quarter resulted primarily from increased provisions for loan losses which were associated with continued declines in credit quality. In addition, deposit funding costs remained extraordinarily high as financial institutions placed a premium on liquidity. (Logo: http://www.newscom.com/cgi-bin/prnh/20051117/CLTH039LOGO ) Strong Capital and Liquidity Positions During the fourth quarter, the Company took several steps to further improve its already strong capital and liquidity positions. In November 2008, the Company sold preferred stock and a common stock purchase warrant to the U.S. Treasury for $52 million as part of the Treasury's Capital Purchase Program. The Company's total capital to risk-based assets at December 31, 2008 increased to approximately 13.25% compared to 11.6% at December 31, 2007. To further strengthen its liquidity position, the Company implemented several deposit campaigns focused on attracting less volatile, local-market deposits. These sales efforts were successful in raising significant amounts of new funding and when combined with approximately $600 million of available lines of credit at December 31, 2008 provide Ameris Bank with very strong liquidity ratios. Provision for Loan Losses and Credit Quality Non-performing assets continued to increase during the fourth quarter, ending 2008 at $70.2 million, or 4.13% of total loans, an increase from the $43.2 million, or 2.52% of total loans reported at the end of the third quarter of 2008. Net charge-offs in 2008 were $23.0 million, or 1.36% of total loans compared to $8.5 million, or 0.53% of total loans in 2007. This increase in non-performing assets and the accelerating level of net charge-offs led to a provision for loan losses of $19.9 million for the fourth quarter of 2008 compared to $6.9 million in the same quarter in 2007. For the year, provision for loan losses amounted to $35.0 million compared to $11.3 million during 2007. Included in the current quarter's provision for loan losses was a $5.0 million charge to establish a reserve component reflecting economic uncertainties that management believes is prudent and timely given the economic outlook. Management anticipates a quarterly evaluation of economic trends and may increase or decrease this portion of the reserve in future periods. "Although our credit quality metrics are disappointing, our Company continues to benefit from a conservative lending philosophy and several important decisions that we made before the current economic crisis began," said Edwin W. Hortman, Jr., President and Chief Executive Officer. "Most importantly, our lending philosophy focuses on relationship banking, forcing us to know and bank the customer rather than simply understanding a loan transaction. Second, we originate our loans in local markets instead of relying on loan participations or deals outside the areas that we know best. Lastly, we have resisted the trend to loan larger sums to individual borrowers for the sake of growth. Our average loan size is only $88,500 and our largest loan is $9.8 million compared to our legal lending limit of $30 million. We still face issues, despite these advantages, but we remain committed to working through the current credit crisis in a timely and prudent fashion," finished Hortman. Trends in Net Interest Income and Net Interest Margin The Company's net interest margin fell during the fourth quarter of 2008 to 2.92% compared to 3.92% during the same quarter in 2007. For the year to date period, the Company's net interest margin was 3.65% compared to 4.02% in 2007. Reversals of interest on new non-accrual loans, increased levels of non-earning assets and relatively expensive funding costs combined to produce the lower margins in the current quarter and year-to-date periods. Yields on earning assets fell to 5.58% during the current quarter, compared to 7.66% in the fourth quarter of 2007. For the year, yields on earning assets fell to 6.43% from 7.79% in 2007. The Company's mix of earning assets played a significant role in producing lower yields on earning assets as did short-term rates and lending benchmark rates at historically low levels. During the quarter, as the Company added to its liquidity position, short-term assets and investment securities with final maturities of less than 12 months increased to 10.8% of total earning assets compared to 0.8% at December 31, 2007. The Company's efforts during 2007 and 2008 to establish floors on variable rate loans cushioned the impact of sharp declines in indexes on which the Company normally loans money. Still, approximately 16.6% of the Company's total loan portfolio at December 31, 2008 were variable rate loans with no established floor and, as a result, produced only marginally profitable yields. Deposit costs increased during the quarter as a result of several campaigns designed to bolster the Company's liquidity using local-market deposits instead of brokered deposits or wholesale borrowings. During the quarter, the Company saw total customer deposits increase by $198.6 million to $1.82 billion, an increase of 12.3% over the most recent linked quarter. At December 31, 2008, the Company had $195.3 million in brokered deposits, which represents 9.06% of total funding and an increase of $67.3 million from the end of 2007. The reduced level of volatility in local-market deposits versus the increasingly unfavorable opinions of brokered deposits by regulatory agencies have caused a significant rise in the cost of customer deposits relative to market yields on assets. Profitability levels on deposit funding began to improve late in the fourth quarter, and if these trends continue, the Company expects wider spreads and margins to follow. Commenting on pricing challenges, Mr. Hortman said, "Significant disruption in our industry in the fourth quarter of 2008 created unique opportunities for new deposit accounts. Our bankers responded with exceptionally strong sales in our local market, opening over 6,500 new accounts. In 2009, our challenge will be to systematically reduce deposit pricing while we improve our deposit mix to be concentrated more heavily in low-cost, transaction-oriented business. Success in this initiative will combine with greatly improved loan pricing and allow the Company to quickly return to acceptable net interest margins." Non-Interest Income Total non-interest income for 2008 increased 8.3% to $19.1 million. Service charges on deposit accounts increased 11.7% to $13.9 million. This increase in service charges came as a result of significantly more transaction accounts as well as slight increases in related fee schedules. Mortgage income increased slightly in 2008 to $3.2 million from $3.1 million in 2007. As mortgage rates continue to fall to historically low levels, activity in the Company's mortgage division has increased and higher levels of loan closings and revenue are anticipated. Non-Interest Expense Total operating expenses for 2008 increased 6.4% to $62.7 million. Salaries and benefits during 2008 were $31.7 million, an increase of 6.2% when compared to $29.8 million in 2007. These increases are mostly the result of expansion efforts in larger metro markets where the Company opened nine offices during 2008. To help offset this expense, Ameris Bank announced seven branch office closings during 2008, including two in the fourth quarter of 2008. Speaking on management's efforts to balance the Company's short-term and long-term decision making, Mr. Hortman said, "In 2009, we will focus more aggressively on reaching important levels of profitability in the offices we have opened since the beginning of 2007 and pause with additional de-novo branch projects. We expect all markets in which we have expanded to be profitable in 2009 despite the challenges with credit and revenue growth." Occupancy and equipment expense increased during 2008 to $8.1 million, an increase of 7.0% when compared to 2007. This increase also relates to expansion efforts in metro markets, the costs of which were offset to some degree by savings from branch closings during 2008. Other operating expenses increased $1.3 million during 2008 to $17.1 million. These increases were primarily the result of additional legal and collection expenses associated with non-performing assets as well as increases in advertising and marketing expense aimed at attracting new deposit accounts. Ameris Bancorp is headquartered in Moultrie, Georgia, and at the end of the most recent quarter, had 50 locations in Georgia, Alabama, northern Florida and South Carolina. Ameris Bancorp Common Stock is quoted on the NASDAQ Global Select Market under the symbol "ABCB". The preceding release contains statements that constitute "forward-looking statements" within the meaning of Section 27A of the Securities Act of 1933, as amended, and Section 21E of the Securities Exchange Act of 1934, as amended. The words "believe", "estimate", "expect", "intend", "anticipate" and similar expressions and variations thereof identify certain of such forward-looking statements, which speak only as of the dates which they were made. The Company undertakes no obligation to publicly update or revise any forward-looking statements, whether as a result of new information, future events, or otherwise. Readers are cautioned that any such forward-looking statements are not guarantees of future performance and involve risks and uncertainties, and that actual results may differ materially from those indicated in the forward-looking statements as a result of various factors. Readers are cautioned not to place undue reliance on these forward- looking statements. AMERIS BANCORP FINANCIAL HIGHLIGHTS (unaudited) (dollars in thousands except per share data and FTE headcount) Three Months Ended Dec. Sept June Mar. 2008 2008 2008 2008 EARNINGS Net Income/(Loss) Available to Common Shareholders $(10,724) $366 $3,149 $2,966 PER COMMON SHARE DATA Earnings per share: Basic (0.79) 0.03 0.23 0.22 Diluted (0.79) 0.03 0.23 0.22 Cash Dividends per share 0.05 0.05 0.14 0.14 Book value per share (period end) 14.06 14.25 14.20 14.48 Tangible book value per share (period end) 9.74 9.92 9.84 10.11 Weighted average number of shares: Basic 13,532,521 13,515,767 13,510,907 13,497,344 Diluted 13,562,286 13,543,612 13,563,032 13,559,761 Period-end number of shares 13,534,601 13,564,032 13,564,032 13,556,770 Market data: High closing price 14.21 15.07 16.48 16.55 Low closing price 7.19 7.82 8.70 12.60 Period end closing price 11.85 14.85 8.70 16.06 Average daily volume 31,527 43,464 62,739 61,780 PERFORMANCE RATIOS Return on average assets (1.81%) 0.07% 0.59% 0.56% Return on average common equity (22.16%) 0.78% 6.58% 6.15% Earning asset yield (TE) 5.58% 6.38% 6.64% 7.17% Total cost of funds 2.72% 2.54% 2.74% 3.30% Net interest margin (TE) 2.92% 3.87% 3.96% 3.91% Non-interest income excluding securities transactions, as a percent of total revenue (TE) 11.64% 12.49% 14.00% 12.22% Efficiency ratio 80.66% 61.97% 65.52% 67.05% CAPITAL ADEQUACY Common equity to assets 7.91% 8.56% 8.78% 9.27% Tangible common equity to tangible assets 5.62% 6.12% 6.26% 6.66% OTHER PERIOD-END DATA FTE Headcount 595 601 651 634 Assets per FTE $4,046 $3,756 $3,369 $3,341 Branch locations 50 50 48 45 Deposits per branch location $40,271 $36,127 $36,893 $39,651 Three Twelve Months Months Ended Ended Dec. Dec. Dec. 2007 2008 2007 EARNINGS Net Income/(Loss) Available to Common Shareholders $1,197 $(4,243) $15,153 PER COMMON SHARE DATA Earnings per share: Basic 0.09 (0.31) 1.12 Diluted 0.09 (0.31) 1.11 Cash Dividends per share 0.14 0.38 0.56 Book value per share (period end) 14.12 14.06 14.06 Tangible book value per share (period end) 9.72 9.74 9.67 Weighted average number of shares: Basic 13,485,765 13,514,135 13,479,240 Diluted 13,573,626 13,562,690 13,631,069 Period-end number of shares 13,539,985 13,534,601 13,539,985 Market data: High closing price 18.81 16.55 28.48 Low closing price 13.83 7.19 13.83 Period end closing price 16.85 11.85 16.85 Average daily volume 51,604 49,736 45,615 PERFORMANCE RATIOS Return on average assets 0.23% (0.19%) 0.74% Return on average common equity 2.49% (2.22%) 8.14% Earning asset yield (TE) 7.66% 6.43% 7.79% Total cost of funds 3.79% 2.82% 3.83% Net interest margin (TE) 3.92% 3.65% 4.02% Non-interest income excluding securities transactions, as a percent of total revenue (TE) 10.97% 12.60% 10.94% Efficiency ratio 67.31% 68.34% 63.58% CAPITAL ADEQUACY Common equity to assets 9.06% 8.07% 9.06% Tangible common equity to tangible assets 6.41% 5.62% 6.41% OTHER PERIOD-END DATA FTE Headcount 620 595 620 Assets per FTE $3,407 $4,046 $3,407 Branch locations 46 50 46 Deposits per branch location $38,201 $40,271 $38,201 AMERIS BANCORP FINANCIAL HIGHLIGHTS (unaudited) (dollars in thousands except per share data and FTE headcount) Three Months Ended Dec. Sept June Mar. Dec. 2008 2008 2008 2008 2007 INCOME STATEMENT Interest income Interest and fees on loans 26,582 28,280 28,339 30,134 32,999 Interest on taxable securities 3,677 3,563 3,646 3,583 3,576 Interest on nontaxable securities 171 169 173 172 158 Interest on deposits in other banks 123 100 91 200 259 Interest on federal funds sold 5 - - - (20) Total interest income 30,558 32,112 32,249 34,089 36,972 Interest expense Interest on deposits 13,769 11,717 12,314 14,142 15,620 Interest on other borrowings 817 1,218 879 1,487 2,367 Total interest expense 14,586 12,935 13,193 15,629 17,987 Net interest income 15,972 19,177 19,056 18,460 18,985 Provision for loan losses 19,890 8,220 3,720 3,200 6,914 Net interest income/(loss) after provision for loan losses (3,918) 10,957 15,336 15,260 12,071 Noninterest income Service charges on deposit accounts 3,279 3,657 3,664 3,316 3,310 Mortgage banking activity 711 745 855 869 827 Other service charges, commissions and fees 90 120 220 278 233 Gain(loss) on sale of securities 316 - - - (236) Other non-interest income (12) 113 586 333 104 Total noninterest income 4,384 4,635 5,325 4,796 4,238 Noninterest expense Salaries and employee benefits 7,309 7,113 8,660 8,618 7,122 Equipment and occupancy expense 2,070 1,904 2,103 1,992 2,118 Amortization of intangible assets 291 293 293 293 324 Data processing fees 1,169 1,238 1,226 1,093 1,096 Other operating expenses 5,580 4,209 3,692 3,598 4,972 Total noninterest expense 16,419 14,757 15,974 15,594 15,632 Operating profit/(loss) (15,953) 835 4,687 4,462 677 Income tax (benefit)/expense (5,556) 469 1,538 1,496 (520) Net income/(loss) $(10,397) $366 $3,149 $2,966 $1,197 Preferred stock dividends 327 - - - - Net income/(loss) available to common shareholders $(10,724) $366 $3,149 $2,966 $1,197 Diluted earnings available to common shareholders (0.79) 0.03 0.23 0.22 0.09 Twelve Months Ended Dec. Dec. 2008 2007 INCOME STATEMENT Interest income Interest and fees on loans $113,335 $128,869 Interest on taxable securities 14,469 14,171 Interest on nontaxable securities 685 688 Interest on deposits in other banks 514 2,306 Interest on federal funds sold 5 43 Total interest income 129,008 146,077 Interest expense Interest on deposits 51,942 62,380 Interest on other borrowings 4,401 8,619 Total interest expense 56,343 70,999 Net interest income 72,665 75,078 Provision for loan losses 35,030 11,321 Net interest income/(loss) after provision for loan losses 37,635 63,757 Noninterest income Service charges on deposit accounts 13,916 12,455 Mortgage banking activity 3,180 3,093 Other service charges, commissions and fees 708 1,268 Gain(loss) on sale of securities 316 (297) Other non-interest income 1,020 1,147 Total noninterest income 19,140 17,666 Noninterest expense Salaries and employee benefits 31,700 29,844 Equipment and occupancy expense 8,069 7,540 Amortization of intangible assets 1,170 1,297 Data processing fees 4,726 4,532 Other operating expenses 17,079 15,757 Total noninterest expense 62,744 58,970 Operating profit/(loss) (5,969) 22,453 Income tax (benefit)/expense (2,053) 7,300 Net income/(loss) $(3,916) $15,153 Preferred stock dividends 327 - Net income/(loss) available to common shareholders $(4,243) $15,153 Diluted earnings available to common shareholders (0.31) 1.11 AMERIS BANCORP FINANCIAL HIGHLIGHTS (unaudited) (dollars in thousands except per share data and FTE headcount) Three Months Ended Dec. Sept. June 2008 2008 2008 PERIOD-END BALANCE SHEET Assets Cash and due from banks $66,787 $43,549 $47,720 Federal funds sold and interest bearing balances 144,383 75,458 38,125 Securities available for sale, at fair value 369,682 287,790 293,601 Restricted equity securities, at cost 6,839 9,836 9,651 Loans, net of unearned income 1,695,777 1,710,109 1,678,147 Less allowance for loan losses 39,652 30,144 28,660 Loans, net 1,656,125 1,679,965 1,649,487 Premises and equipment, net 66,107 65,868 63,291 Intangible assets, net 3,631 3,924 4,217 Goodwill 54,813 54,813 54,813 Other assets 38,723 36,440 32,116 Total Assets $2,407,090 $2,257,643 $2,193,021 Liabilities Deposits: Noninterest-bearing $208,532 $198,900 $200,936 Interest-bearing 1,804,993 1,607,439 1,569,925 Total deposits 2,013,525 1,806,339 1,770,861 Federal funds purchased & securities sold under agreements to repurchase 27,416 63,973 39,795 Other borrowings 72,000 138,600 133,000 Other liabilities 12,521 13,118 14,541 Subordinated deferrable interest debentures 42,269 42,269 42,269 Total liabilities 2,167,731 2,064,299 2,000,466 Stockholders' equity Preferred Stock $49,028 $- $- Common stock 14,866 14,895 14,895 Capital surplus 86,038 83,453 83,308 Retained earnings 93,696 105,117 105,430 Accumulated other comprehensive loss 6,518 666 (291) Less treasury stock (10,787) (10,787) (10,787) Total stockholders' equity 239,359 193,344 192,555 Total liabilities and stockholders' equity $2,407,090 $2,257,643 $2,193,021 Other Data Earning Assets 2,216,681 2,083,193 2,019,525 Intangible Assets 58,444 58,737 59,030 Interest Bearing Liabilities 1,946,678 1,852,281 1,784,989 Average Assets 2,354,142 2,192,501 2,141,940 Average Common Stockholders' Equity 192,479 186,541 192,605 Three Months Ended Mar. Dec. 2008 2007 PERIOD-END BALANCE SHEET Assets Cash and due from banks $63,401 $59,804 Federal funds sold and interest bearing balances 4,389 12,022 Securities available for sale, at fair value 297,589 291,170 Restricted equity securities, at cost 6,996 7,559 Loans, net of unearned income 1,622,437 1,614,048 Less allowance for loan losses 28,094 27,640 Loans, net 1,594,343 1,586,408 Premises and equipment, net 60,053 59,132 Intangible assets, net 4,509 4,802 Goodwill 54,675 54,813 Other assets 32,288 36,353 Total Assets $2,118,243 $2,112,063 Liabilities Deposits: Noninterest-bearing $199,692 $197,345 Interest-bearing 1,584,599 1,559,920 Total deposits 1,784,291 1,757,265 Federal funds purchased & securities sold under agreements to repurchase 4,987 14,705 Other borrowings 74,500 90,500 Other liabilities 15,888 16,075 Subordinated deferrable interest debentures 42,269 42,269 Total liabilities 1,921,935 1,920,814 Stockholders' equity Preferred Stock $- $- Common stock 14,887 14,870 Capital surplus 82,920 82,750 Retained earnings 104,182 103,095 Accumulated other comprehensive loss 5,093 1,303 Less treasury stock (10,774) (10,769) Total stockholders' equity 196,308 191,249 Total liabilities and stockholders' equity $2,118,243 $2,112,063 Other Data Earning Assets 1,931,411 1,924,799 Intangible Assets 59,184 59,615 Interest Bearing Liabilities 1,706,355 1,707,394 Average Assets 2,115,561 2,102,579 Average Common Stockholders' Equity 193,971 191,124 AMERIS BANCORP FINANCIAL HIGHLIGHTS (unaudited) (dollars in thousands except per share data and FTE headcount) Three Months Ended Dec. Sept June Mar. Dec. 2008 2008 2008 2008 2007 ASSET QUALITY INFORMATION Allowance for loan losses Balance at beginning of period $30,144 $28,660 $28,094 $27,640 $26,434 Provision for loan loss 19,890 8,220 3,720 3,200 6,914 Charge-offs 10,648 6,946 3,801 2,945 6,465 Recoveries 266 210 647 199 757 Net charge-offs (recoveries) 10,382 6,736 3,154 2,746 5,708 Ending balance $39,652 $30,144 $28,660 $28,094 $27,640 As a percentage of loans 2.34% 1.76% 1.71% 1.73% 1.71% As a percentage of nonperforming loans 60.62% 76.46% 89.27% 104.78% 149.66% As a percentage of nonperforming assets 56.52% 69.84% 81.56% 86.34% 108.56% Net Charge-off information Charge-offs Commercial, Financial & Agricultural $1,090 $963 $282 $390 $421 Real Estate - Residential 1,951 989 902 672 1,262 Real Estate - Commercial & Farmland 1,288 628 49 299 621 Real Estate - Construction & Development 5,932 4,165 2,320 1,305 3,899 Consumer Installment 387 201 248 279 262 Other - - - - - Total charge-offs 10,648 6,946 3,801 2,945 6,465 Recoveries Commercial, Financial & Agricultural 11 71 102 18 $95 Real Estate - Residential 30 54 90 25 14 Real Estate - Commercial & Farmland 10 10 68 31 159 Real Estate - Construction & Development 27 26 323 34 401 Consumer Installment 187 49 64 90 88 Other 1 - - 1 - Total recoveries 266 210 647 199 757 Net charge-offs (recoveries) $10,382 $6,736 $3,154 $2,746 $5,708 Non-accrual loans 65,414 39,427 32,106 26,812 18,468 Foreclosed assets 4,742 3,734 3,032 5,727 6,993 Total non-performing assets 70,156 43,161 35,138 32,539 25,461 Non-performing assets as a percent of loans and foreclosed assets 4.13% 2.52% 2.09% 2.00% 1.57% Net charge offs as a percent of loans (Annualized) 2.45% 1.58% 0.75% 0.68% 1.41% Twelve Months Ended Dec. Dec. 2008 2007 ASSET QUALITY INFORMATION Allowance for loan losses Balance at beginning of period $27,640 $24,863 Provision for loan loss 35,030 11,321 Charge-offs 24,340 10,386 Recoveries 1,322 1,842 Net charge-offs (recoveries) 23,018 8,544 Ending balance $39,652 $27,640 As a percentage of loans 2.34% 1.71% As a percentage of nonperforming loans 60.62% 149.66% As a percentage of nonperforming assets 56.52% 108.56% Net Charge-off information Charge-offs Commercial, Financial & Agricultural $2,725 $1,177 Real Estate - Residential 4,514 2,269 Real Estate - Commercial & Farmland 2,264 1,244 Real Estate - Construction & Development 13,722 5,013 Consumer Installment 1,115 683 Other - - Total charge-offs 24,340 10,386 Recoveries Commercial, Financial & Agricultural $202 $583 Real Estate - Residential 199 130 Real Estate - Commercial & Farmland 119 339 Real Estate - Construction & Development 410 415 Consumer Installment 390 369 Other 2 6 Total recoveries 1,322 1,842 Net charge-offs (recoveries) $23,018 $8,544 Non-accrual loans 65,414 18,468 Foreclosed assets 4,742 6,993 Total non-performing assets 70,156 25,461 Non-performing assets as a percent of loans and foreclosed assets 4.13% 1.57% Net charge offs as a percent of loans (Annualized) 1.36% 0.53% AMERIS BANCORP FINANCIAL HIGHLIGHTS (unaudited) (dollars in thousands except per share data and FTE headcount) Three Months Ended Dec. Sept June 2008 2008 2008 AVERAGE BALANCES Short term assets $133,392 $21,219 $18,236 Investment securities 337,858 299,564 307,304 Loans 1,703,137 1,698,024 1,650,781 Total Earning Assets 2,174,387 2,018,807 1,976,321 Noninterest bearing deposits 203,810 200,357 197,662 Interest bearing deposits 582,589 607,534 607,777 Savings 53,055 55,143 54,973 CDs 1,148,386 929,787 903,655 Deposits 1,987,840 1,792,821 1,764,067 FHLB advances 70,630 130,849 111,922 Subordinated debentures 42,269 42,269 42,269 Other borrowings 27,158 30,713 13,815 Total non-deposit funding 140,057 203,831 168,006 Total funding $2,127,897 $1,996,652 $1,932,073 Three Months Ended Mar. Dec. 2008 2007 AVERAGE BALANCES Short term assets $23,480 $21,826 Investment securities 291,708 297,380 Loans 1,617,991 1,605,006 Total Earning Assets 1,933,179 1,924,212 Noninterest bearing deposits 191,860 187,908 Interest bearing deposits 612,212 596,053 Savings 54,221 55,305 CDs 890,668 886,117 Deposits 1,748,961 1,725,383 FHLB advances 97,162 105,570 Subordinated debentures 42,269 42,269 Other borrowings 17,490 22,298 Total non-deposit funding 156,921 170,137 Total funding $1,905,882 $1,895,520 Twelve Months Ended Dec. Dec. 2008 2007 AVERAGE BALANCES Short term assets 49,082 $45,634 Investment securities 309,109 298,036 Loans 1,667,483 1,536,243 Total Earning Assets 2,025,674 1,879,913 Noninterest bearing deposits 198,422 192,575 Interest bearing deposits 602,528 574,600 Savings 54,348 59,687 CDs 968,124 874,609 Deposits 1,823,422 1,701,471 FHLB advances 102,641 92,570 Subordinated debentures 42,269 42,269 Other borrowings 22,294 16,425 Total non-deposit funding 167,204 151,264 Total funding $1,990,626 $1,852,735 AMERIS BANCORP FINANCIAL HIGHLIGHTS (unaudited) (dollars in thousands except per share data and FTE headcount) Three Months Ended Dec. Sept June 2008 2008 2008 INTEREST INCOME/EXPENSE Short term assets $123 $100 $91 Investment securities (TE) 3,940 3,823 3,912 Loans (TE) 26,514 28,559 28,704 Total Earning Assets 30,577 32,482 32,707 Noninterest bearing deposits - - - Interest bearing deposits 2,368 2,722 2,580 Savings 123 121 129 CDs 11,277 8,874 9,605 Deposits 13,768 11,717 12,314 FHLB advances 186 359 302 Subordinated debentures 494 493 487 Other borrowings 138 222 90 Total non-deposit funding 818 1,074 879 Total funding $14,586 $12,791 $13,193 Net Interest Income (TE) $15,991 $19,691 $19,513 Three Months Ended Mar. Dec. 2008 2007 INTEREST INCOME/EXPENSE Short term assets $193 $239 Investment securities (TE) 3,842 3,818 Loans (TE) 30,409 33,078 Total Earning Assets 34,444 37,135 Noninterest bearing deposits - - Interest bearing deposits 3,450 4,238 Savings 118 142 CDs 10,575 11,379 Deposits 14,143 15,759 FHLB advances 653 1,299 Subordinated debentures 686 832 Other borrowings 148 236 Total non-deposit funding 1,487 2,367 Total funding $15,630 $18,126 Net Interest Income (TE) $18,814 $19,008 Twelve Months Ended Dec. Dec. 2008 2007 INTEREST INCOME/EXPENSE Short term assets 507 $2,349 Investment securities (TE) 15,517 14,785 Loans (TE) 114,186 129,376 Total Earning Assets 130,210 146,510 Noninterest bearing deposits - - Interest bearing deposits 11,120 17,391 Savings 491 623 CDs 40,331 44,367 Deposits 51,942 62,381 FHLB advances 1,500 4,732 Subordinated debentures 2,160 3,164 Other borrowings 598 722 Total non-deposit funding 4,258 8,618 Total funding $56,200 $70,999 Net Interest Income (TE) $74,010 $75,511 AMERIS BANCORP FINANCIAL HIGHLIGHTS (unaudited) (dollars in thousands except per share data and FTE headcount) Twelve Months Three Months Ended Ended Dec. Sept June Mar. Dec. Dec. Dec. 2008 2008 2008 2008 2007 2008 2007 YIELDS (1) Short term assets 0.37% 1.87% 2.00% 3.31% 4.34% 1.03% 5.15% Investment securities 4.63% 5.06% 5.11% 5.30% 5.09% 5.02% 4.96% Loans 6.18% 6.67% 6.97% 7.56% 8.18% 6.85% 8.42% Total Earning Assets (2) 5.58% 6.38% 6.64% 7.17% 7.66% 6.43% 7.79% Noninterest bearing deposits Interest bearing deposits 1.61% 1.78% 1.70% 2.27% 2.82% 1.85% 3.03% Savings 0.92% 0.87% 0.94% 0.88% 1.02% 0.90% 1.04% CDs 3.90% 3.79% 4.26% 4.78% 5.09% 4.17% 5.07% Deposits 2.75% 2.59% 2.80% 3.25% 3.62% 2.85% 3.67% FHLB advances 1.04% 1.09% 1.08% 2.70% 4.88% 1.46% 5.11% Subordinated debentures 4.64% 4.63% 4.62% 6.53% 7.81% 5.11% 7.49% Other borrowings 2.02% 2.87% 2.61% 3.40% 4.20% 2.68% 4.40% Total non-deposit funding 2.32% 2.09% 2.10% 3.81% 5.52% 2.55% 5.70% Total funding (3) 2.72% 2.54% 2.74% 3.30% 3.79% 2.82% 3.83% Net interest spread 2.86% 3.84% 3.90% 3.87% 3.86% 3.60% 3.96% Net interest margin 2.92% 3.87% 3.96% 3.91% 3.92% 3.65% 4.02% (1) Interest and average rates are calculated on a tax-equivalent basis using an effective tax rate of 35%. (2) Rate calculated based on average earning assets. (3) Rate calculated based on average interest bearing liabilities. http://www.newscom.com/cgi-bin/prnh/20051117/CLTH039LOGODATASOURCE: Ameris Bancorp CONTACT: Dennis J. Zember Jr., Executive Vice President & CFO of Ameris Bancorp, +1-229-890-1111 Web site: http://www.amerisbank.com/

Copyright

1 Year Ameris Bancorp Chart

1 Year Ameris Bancorp Chart

1 Month Ameris Bancorp Chart

1 Month Ameris Bancorp Chart

Your Recent History

Delayed Upgrade Clock