ADVFN Logo ADVFN

We could not find any results for:
Make sure your spelling is correct or try broadening your search.

Trending Now

Toplists

It looks like you aren't logged in.
Click the button below to log in and view your recent history.

Hot Features

Registration Strip Icon for charts Register for streaming realtime charts, analysis tools, and prices.

MPH Mereo Biopharma Group Plc

26.50
0.00 (0.00%)
21 May 2024 - Closed
Delayed by 15 minutes
Share Name Share Symbol Market Type Share ISIN Share Description
Mereo Biopharma Group Plc LSE:MPH London Ordinary Share GB00BZ4G2K23 ORD GBP0.003 (REG S)
  Price Change % Change Share Price Bid Price Offer Price High Price Low Price Open Price Shares Traded Last Trade
  0.00 0.00% 26.50 26.00 27.00 0.00 01:00:00
Industry Sector Turnover Profit EPS - Basic PE Ratio Market Cap
0 0 N/A 0

Standard & Poor's Reports March Index Returns April 2, 2007

02/04/2007 9:50pm

PR Newswire (US)


Mereo Biopharma (LSE:MPH)
Historical Stock Chart


From May 2019 to May 2024
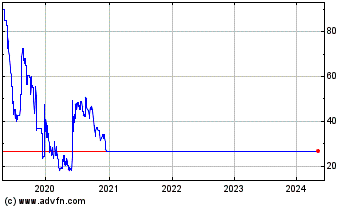
Click Here for more Mereo Biopharma Charts.
NEW YORK, April 2 /PRNewswire-FirstCall/ -- Standard & Poor's Reports March Index Returns April 2, 2007 Dividend Reinvested Index 30-Mar- S&P US Indices Values 07 3 Months YTD S&P 500(1) 4760.422 1.118 0.640 0.640 S&P MidCap 400(2) 1601.492 1.346 5.798 5.798 S&P SmallCap 600(3) 557.271 1.677 3.207 3.207 S&P 900(4) 3925.434 1.138 1.054 1.054 S&P 1000 (4) 5575.367 1.457 4.912 4.912 S&P Composite 1500(4) 394.214 1.159 1.140 1.140 S&P 100(5) 1005.653 1.063 -1.058 -1.058 S&P REIT Composite(6) 387.817 -2.244 3.705 3.705 S&P 500 Equal Weighted(7) 2738.33 0.79 2.83 2.83 S&P 500/Citigroup Value*(8) 2775.824 1.300 1.338 1.338 S&P 500/Citigroup Growth*(8) 1347.816 0.926 -0.094 -0.094 S&P MidCap 400/Citigroup Value*(8) 934.450 1.048 5.674 5.674 S&P MidCap 400/Citigroup Growth*(8) 718.840 1.648 5.927 5.927 S&P SmallCap 600/Citigroup Value*(8) 549.420 1.037 2.170 2.170 S&P SmallCap 600/Citigroup Growth*(8) 355.359 2.364 4.327 4.327 S&P US Indices 12 Months 3 Years 5 Years 10 Years S&P 500(1) 11.830 10.067 6.257 8.202 S&P MidCap 400(2) 8.445 13.367 10.681 14.282 S&P SmallCap 600(3) 5.293 13.903 11.670 12.563 S&P 900(4) 11.524 10.355 6.631 8.634 S&P 1000(4) 7.371 13.519 10.985 13.846 S&P Composite 1500(4) 11.256 10.498 6.820 8.754 S&P 100(5) 13.054 7.896 4.437 7.590 S&P REIT Composite(6) 22.063 22.445 21.884 14.526 S&P 500 Equal Weighted(7) 12.08 13.17 10.67 11.72 S&P 500/Citigroup Value*(8) 15.628 13.206 9.046 9.228 S&P 500/Citigroup Growth*(8) 8.077 6.972 3.444 6.743 S&P MidCap 400/Citigroup Value*(8) 11.048 15.037 12.960 na S&P MidCap 400/Citigroup Growth*(8) 5.566 11.556 8.211 na S&P SmallCap 600/Citigroup Value*(8) 6.904 14.465 11.655 na S&P SmallCap 600/Citigroup Growth*(8) 3.578 13.290 11.490 na Dividend Reinvested Index 30-Mar- S&P Global Indices Values 07 3 Months YTD S&P Asia 50 (US$)(7) 3707.29 1.68 0.67 0.67 S&P Europe 350 (EURO)(7) 1938.63 2.71 2.75 2.75 S&P Europe 350 (US$)(7) 2329.82 3.83 4.15 4.15 S&P Global 100 (US$)(7) 1750.28 1.77 0.18 0.18 S&P Global 1200 (US$)(7) 1990.46 2.01 2.36 2.36 S&P Latin America 40 (US$)(8) 4612.76 6.56 4.95 4.95 S&P/TOPIX 150 (US$)(8) 1793.92 -1.20 3.32 3.32 S&P/TOPIX 150 (YEN)(8) 1633.91 -1.69 2.31 2.31 S&P Euro (Euro)(7) 2139.85 2.87 3.49 3.49 S&P Euro (US$)(7) 2606.15 4.00 4.90 4.90 S&P Euro Plus (EURO)(7) 2058.28 2.88 3.23 3.23 S&P Euro Plus (US$)(7) 2537.41 4.01 4.64 4.64 S&P United Kingdom (PDS)(7) 1706.45 3.12 2.70 2.70 S&P /TSX 60 (CN$)(9) 1492.22 1.39 1.81 1.81 S&P/ASX 50 35852.37 3.15 6.82 6.82 S&P ADR Index (USD) (TR)(7) 2223.42 2.54 2.55 2.55 S&P Japan 500 (YEN) (TR)(7) 1715.33 -1.62 2.41 2.41 S&P 700 (USD) (TR)(7) 2387.84 2.84 3.97 3.97 S&P/MIB Index (EUR) (TR) 52859.64 1.50 0.81 0.81 S&P/ASX 200 (AUD) (TR) 37103.54 3.29 6.89 6.89 S&P/TSX Composite Index (TR) 32025.58 1.17 2.60 2.60 S&P Global Indices 12 Months 3 Years 5 Years 10 Years S&P Asia 50 (US$)(7) 20.96 20.92 17.41 -- S&P Europe 350 (EURO)(7) 14.11 19.08 6.64 12.90 S&P Europe 350 (US$)(7) 25.96 22.46 16.21 11.01 S&P Global 100 (US$)(7) 15.31 11.55 7.58 8.38 S&P Global 1200 (US$)(7) 16.46 15.24 11.00 9.29 S&P Latin America 40 (US$)(8) 29.71 44.79 30.35 18.74 S&P/TOPIX 150 (US$)(8) 3.97 11.82 13.44 4.97 S&P/TOPIX 150 (YEN)(8) 4.30 16.48 10.82 4.62 S&P Euro (Euro)(7) 15.54 20.89 7.24 10.40 S&P Euro (US$)(7) 27.54 24.32 16.86 11.94 S&P Euro Plus (EURO)(7) 14.95 20.75 7.49 10.18 S&P Euro Plus (US$)(7) 26.89 24.18 17.13 11.85 S&P United Kingdom (PDS)(7) 9.60 16.83 7.38 7.65 S&P /TSX 60 (CN$)(9) 12.38 18.75 13.18 10.95 S&P/ASX 50 20.46 24.62 15.38 13.89 S&P ADR Index (USD) (TR)(7) 18.70 19.85 14.92 -- S&P Japan 500 (YEN) (TR)(7) 2.46 16.11 11.71 -- S&P 700 (USD) (TR)(7) 21.03 21.12 16.86 10.30 S&P/MIB Index (EUR) (TR) 14.81 19.68 7.97 -- S&P/ASX 200 (AUD) (TR) 21.78 25.87 16.73 -- S&P/TSX Composite Index (TR) 11.42 17.70 13.10 10.35 Notes: Dividend Reinvested Index Inception Dates: (1)1970, (2)1981, (3)1984, (4)1994, (5)1988, (6)1997, (7)1989, (8)1995, (9)1987, (10)1991, (11)1993 *12 month, 3, 5 and 10 year returns are based on the blended S&P/Barra & S&P/Citigroup Indices. 3, 5 and 10 year total returns are compounded annually. Dividends Monthly % Chg. w/o Dividend Dividends S&P 500(1) 1.660 0.998 S&P MidCap 400(2) 0.891 1.238 S&P SmallCap 600(3) 0.404 1.575 S&P Composite 1500(4) 0.371 1.041 S&P 100(5) 0.686 0.955 S&P REIT Composite(6) 0.000 -2.594 S&P 500/Citigroup Value*(8) 1.370 1.157 S&P 500/Citigroup Growth*(8) 0.853 0.830 S&P MidCap 400/Citigroup Value*(8) 0.576 0.894 S&P MidCap 400/Citigroup Growth*(8) 0.281 1.586 S&P SmallCap 600/Citigroup Value*(8) 0.540 0.885 S&P SmallCap 600/Citigroup Growth*(8) 0.212 2.317 Reinvested Index Value Inception Index Date Value S&P 500(5) 1988 2200.120 S&P MidCap 400(10) 1991 1065.712 S&P SmallCap 600(11) 1993 463.213 For more information contact: Standard & Poor's Index Services at 212.438.2046 or Standard & Poor's, a division of The McGraw-Hill Companies (NYSE:MHP), is the world's foremost provider of independent credit ratings, indices, risk evaluation, investment research and data. With approximately 7,5000 employees located in 21 countries an Founded in 1888, The McGraw-Hill Companies is a leading global information services provider meeting worldwide needs in the financial services, education and business information markets through leading brands such as Standard & Poor's, BusinessWeek and M DATASOURCE: Standard & Poor's CONTACT: Paul Guarino of Standard & Poor's, Web site: http://www.standardandpoors.com/

Copyright

1 Year Mereo Biopharma Chart

1 Year Mereo Biopharma Chart

1 Month Mereo Biopharma Chart

1 Month Mereo Biopharma Chart

Your Recent History

Delayed Upgrade Clock