ADVFN Logo ADVFN

We could not find any results for:
Make sure your spelling is correct or try broadening your search.

Trending Now

Toplists

It looks like you aren't logged in.
Click the button below to log in and view your recent history.

Hot Features

Registration Strip Icon for discussion Register to chat with like-minded investors on our interactive forums.

XEC Cimarex Energy Co

87.20
0.00 (0.00%)
Pre Market
Last Updated: 01:00:00
Delayed by 15 minutes
Share Name Share Symbol Market Type
Cimarex Energy Co NYSE:XEC NYSE Common Stock
  Price Change % Change Share Price High Price Low Price Open Price Shares Traded Last Trade
  0.00 0.00% 87.20 0 01:00:00

Cimarex Announces Second-Quarter Production Volumes and Provides Operations Update

29/07/2009 11:14pm

PR Newswire (US)


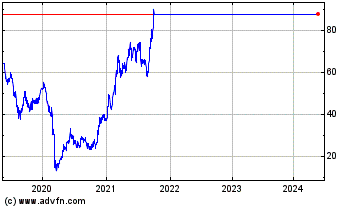
Cimarex Energy (NYSE:XEC)
Historical Stock Chart


From Jul 2019 to Jul 2024

Click Here for more Cimarex Energy Charts.
DENVER, July 29 /PRNewswire-FirstCall/ -- Cimarex Energy Co. (NYSE:XEC) today announced second-quarter oil and gas production volumes averaged 453.9 million cubic feet equivalent per day (MMcfe/d). Average daily equivalent production was comprised of 317.7 million cubic feet of gas and 22,706 barrels of oil. Second-quarter 2008 production averaged 488.4 MMcfe/d and first-quarter 2009 averaged 489.0 MMcfe/d. Daily production decreased as expected and is the result of reduced drilling. Cimarex's second-quarter 2009 operated rig count averaged six as compared to 37 in the comparable period of 2008. Second-quarter 2009 average realized prices are expected to be in the range of $3.40 to $3.50 per thousand cubic feet (Mcf) of gas and $54.35 to $54.85 per barrel of oil. Oil and Gas Hedges Cimarex has entered into NYMEX oil and Mid-Continent natural gas hedge contracts for January through December 2010 covering on average 7,000 barrels per day and 130,000 MMBtu per day, respectively, over that period. This represents approximately 30% of expected 2010 oil production and 40% of gas. The following tables summarize current commodity hedge transactions: Weighted Average Price ---------- Period Commodity Volume/Day Settlement Floor Ceiling ------ --------- ---------- ---------- ----- ------- 2009 Jul Gas 147,000 Mid-Continent $3.00 $5.00 - Dec MMBtu 2010 Jan Oil 7,000 NYMEX $59.68 $89.59 - Dec* barrels 2010 Jan Gas 90,000 Mid-Continent $5.00 $6.66 - Dec MMBtu Period Commodity Volume/Day Settlement Swap Price ------ --------- --------- ---------- ---------- 2010 Jan Gas 40,000 MMBtu Mid-Continent $5.18 - Dec* * Mid-Continent swaps and NYMEX oil collars of 2,000 barrels per day were entered into subsequent to June 30, 2009. Cimarex accounts for these financial commodity derivative contracts using the mark-to-market accounting method. Cimarex will release its second-quarter 2009 financial results on Friday, August 7, 2009, before the market opens. Exploration and Development Highlights Cimarex drilled 65 gross (35 net) wells during the first half of 2009, completing 95% as producers. Cimarex's sharply reduced operated rig count resulted in drilling 74% fewer wells in the first half of 2009 as compared to 2008. Currently, seven operated rigs are drilling; three in western Oklahoma, three in the Permian Basin and one in the Gulf Coast. Mid-Continent Cimarex drilled 41 gross (16 net) wells in the first six months of 2009, completing 98% as producers. Second-quarter 2009 Mid-Continent production averaged 220.8 MMcfe/d, an increase of 1% over second-quarter 2008. Western Oklahoma drilling totaled 36 gross (14 net) wells with 97% being completed as producers. The majority of the drilling occurred in the Anadarko Basin Woodford shale Cana play, where Cimarex participated in 28 gross (11 net) wells. Since the Cana play began in late 2007, Cimarex has participated in a total of 55 wells. Of these wells, 43 have been brought online and the remainder are either in the process of being drilled or awaiting completion. At June 30, 2009, the company's net production from the Cana play was approximately 27 MMcfe/d, up from approximately 5 MMcfe/d a year ago. During the first half of 2009, the company's horizontal wells had an average completed well cost of $8.0 million, average horizontal lateral length of 3,700 feet and average time to drill to total depth of 64 days. During 2008 the average completed well cost was $10.3 million, average horizontal lateral length was 3,500 feet and the average time to drill to total depth was 77 days. For the wells completed and producing in 2009, the current estimate for average gross ultimate recovery is greater than 6.0 Bcfe. Cimarex currently has three operated rigs drilling in the Cana play and expects to drill or participate in approximately 45 gross (20 net) wells during 2009. Permian Basin First-half 2009 Permian Basin drilling totaled 20 gross (15 net) wells, 90% of which were completed as producers. Production averaged 168.1 MMcfe/d (51% oil), a 3% increase over the second quarter of 2008. Second-quarter 2009 Permian Basin oil production averaged of 14,261 barrels per day, a 15% increase over second-quarter 2008. Because of weak oil prices, Cimarex dropped all of its operated rigs in the Permian Basin by the end of the first quarter of 2009. Beginning in the second quarter with improving oil prices and lower service costs Cimarex has brought back three operated rigs drilling horizontal oil wells. Gulf Coast/Gulf of Mexico Cimarex finished drilling and completed three gross (2.9 net) Gulf Coast producers in the first half of 2009. Second-quarter 2009 onshore Gulf Coast production volumes averaged 49.5 MMcfe/d, a 38% decrease compared to second-quarter 2008. Offshore production volumes averaged 12.1 MMcfe/d in the second-quarter of 2009 versus 20.9 MMcfe/d in the second quarter of 2008. Lower production reflects an inactive drilling program and natural reservoir depletion. In the first-half of 2009, Southeast Texas Yegua/Cook Mountain drilling totaled 2 gross (2 net) successful wells. In early July 2009, Cimarex brought on production the Two Sisters #1 (100% working interest, 75% net revenue interest) located near Beaumont in Jefferson County. The well is currently producing approximately 40 MMcfe/d (25 MMcf/d of gas and 2,500 barrels of oil) gross with 6,900 psi flowing pressure. Cimarex continues to operate one rig in the Southeast Texas Yegua/Cook Mountain play. Cimarex will release second-quarter 2009 financial results and update guidance before the market opens on Friday, August 7, 2009. Cimarex will also host a conference call that day at 10:00 a.m. Mountain Time (12:00 p.m. Eastern Time). To access the live, interactive call, please dial (800) 921-0061 and reference call ID # 20269256 ten minutes before the scheduled start time. A digital replay will be available for one week following the live broadcast at (800) 642-1687 and by using the conference ID # 20269256. The listen-only web cast of the call will be accessible via http://www.cimarex.com/. About Cimarex Energy Denver-based Cimarex Energy Co. is an independent oil and gas exploration and production company with principal operations in the Mid-Continent, Permian Basin and Gulf Coast areas of the U.S. This communication contains statements that constitute forward-looking statements within the meaning of the Private Securities Litigation Reform Act of 1995. These statements are based on current expectations and beliefs and are subject to a number of risks, uncertainties and assumptions that could cause actual results to differ materially from those described in the forward-looking statements. These risks and uncertainties are more fully described in SEC reports filed by Cimarex. While Cimarex makes these forward-looking statements in good faith, management cannot guarantee that anticipated future results will be achieved. Cimarex assumes no obligation and expressly disclaims any duty to update the information contained herein except as required by law. http://www.cimarex.com/ DATASOURCE: Cimarex Energy Co. CONTACT: Mark Burford, Director of Capital Markets of Cimarex Energy Co., +1-303-295-3995 Web Site: http://www.cimarex.com/

Copyright

1 Year Cimarex Energy Chart

1 Year Cimarex Energy Chart

1 Month Cimarex Energy Chart

1 Month Cimarex Energy Chart

Your Recent History

Delayed Upgrade Clock