ADVFN Logo ADVFN

We could not find any results for:
Make sure your spelling is correct or try broadening your search.

Trending Now

Toplists

It looks like you aren't logged in.
Click the button below to log in and view your recent history.

Hot Features

Registration Strip Icon for default Register for Free to get streaming real-time quotes, interactive charts, live options flow, and more.

WL Wilmington Trust Corp. (DE)

4.45
0.00 (0.00%)
26 Jul 2024 - Closed
Delayed by 15 minutes
Share Name Share Symbol Market Type
Wilmington Trust Corp. (DE) NYSE:WL NYSE Ordinary Share
  Price Change % Change Share Price High Price Low Price Open Price Shares Traded Last Trade
  0.00 0.00% 4.45 0.00 01:00:00

Wilmington Trust Announces Third Quarter Results

20/10/2006 1:00pm

Business Wire


Wilmington (NYSE:WL)
Historical Stock Chart


From Jul 2019 to Jul 2024
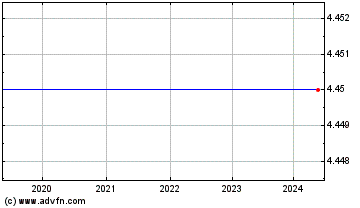
Click Here for more Wilmington Charts.
Wilmington Trust Corporation (NYSE:WL) reported today that net income for the 2006 third quarter was $5.2 million and earnings per share (on a diluted basis) were $0.07 per share. The company recorded a non-cash charge of $72.3 million during the quarter against its valuation of affiliate money manager Roxbury Capital Management (RCM). This non-cash charge reduced operating net income by $41.7 million and reduced earnings per share (on a diluted basis) by $0.60 per share. Absent the non-cash charge, operating net income for the 2006 third quarter would have been $46.9 million and earnings per share (on a diluted basis) would have been $0.67 per share. These amounts would have been increases of 10% and 8%, respectively, from the year-ago third quarter. During the 2006 third quarter, RCM terminated its micro-cap fund and decided to exit its fixed income fund by the end of 2006. These actions caused Wilmington Trust management to reassess the carrying value (the value assigned to the asset) of its ownership position in RCM. On October 17, 2006, management determined that the carrying value of RCM had declined by $72.3 million as of September 30, 2006, and that the decline was other than temporary. The $72.3 million decline in carrying value was recorded on the income statement as a non-cash impairment charge for the 2006 third quarter. The impairment charge was a non-cash item because Wilmington Trust records the majority of RCM's carrying value on its balance sheet as goodwill (a non-cash item). At June 30, 2006, the amount of goodwill associated with RCM was $131.3 million. As of September 30, 2006, following the non-cash charge, the amount of goodwill recorded for RCM was $59.0 million. Wilmington Trust's valuation of RCM is based in large part on its ownership interest in the money manager, which consists of 41.23% of RCM's common shares and a 30% preferred ownership interest. Wilmington Trust's ownership interest in RCM has not changed since the fourth quarter of 2003, and the company said no changes were planned. Ted T. Cecala, Wilmington Trust's chairman and chief executive officer, and David R. Gibson, Wilmington Trust's chief financial officer, remain members of RCM's board of managers. "Roxbury is a profitable growth-style manager. The firm is incubating new products and it has been acquiring other investment managers," Cecala said. "We have high regard for Roxbury's 'boutique among boutiques' market positioning, we have a positive outlook for the firm, and we look forward to maintaining our relationship with the Roxbury team." In addition to reducing net income and earnings per share, the non-cash charge increased noninterest expense, reduced income tax expense, and reduced the returns on average assets and equity. This report includes comparable amounts that exclude the non-cash charge in cases where management believes doing so provides investors with more relevant information about business trends and the company's continuing operations. "Absent the non-cash charge, our third quarter results were positive and each of our three businesses recorded good growth," Cecala said. "Net interest income rose 11%, the net interest margin increased, advisory revenue was 10% higher, and expense growth, excluding the non-cash charge, was less than 6%." For the 2006 third quarter: Total loan balances were $7.76 billion, on average, up 9% from the year-ago third quarter. On average, commercial loan balances rose 11% and consumer loan balances rose 7% year over year. Balance sheet assets surpassed $10.5 billion for the first time on an average balance basis. Net interest income, before the provision for loan losses, was 11% more than for third quarter last year. The net interest margin was 3.83%, up 3 basis points on a linked-quarter basis, and 17 basis points year over year. Wealth Advisory revenue rose 8%; Corporate Client revenue increased 11%; and revenue from affiliate money manager Cramer Rosenthal McGlynn was 35% higher than for the year-ago third quarter. The percentage of loans with pass ratings in the internal risk rating analysis continued to exceed 97%. Credit quality trends remained positive overall, but one commercial loan charge-off during the third quarter increased net charge-offs and the net charge-off ratio, and led to an increase in the provision for loan losses. More details on this are in the credit quality section of this report. On an annualized basis, third quarter 2006 results produced a return on average assets of 0.20% and a return on average equity of 1.91%. Excluding the non-cash charge for RCM, the return on average assets would have been 1.77% and the return on average equity would have been 17.23%. The corresponding returns for the third quarter of 2005 were 1.70% and 17.65%, respectively. CASH DIVIDEND DECLARED On October 19, 2006, the Board of Directors declared a regular quarterly cash dividend of $0.315 per share. The quarterly dividend will be paid on November 15, 2006, to shareholders of record on November 1, 2006. EFFICIENCY RATIO The efficiency ratio is a measure of profitability that reflects how much a company spends to generate revenue. Low efficiency ratios are desirable because they indicate high profitability. The non-cash charge, all of which was attributed to the Affiliate Managers business segment, reduced the company's efficiency ratio for the 2006 third quarter. There is more information about business line profitability in the sections on each business and in the financial reports by business segment in this report. Efficiency ratios   2006 Q3   2006 Q2   2005 Q3 Regional Banking   40.02%   39.22%   42.86% Wealth Advisory Services   77.64%   79.76%   75.53% Corporate Client Services   70.71%   72.56%   76.67% Wilmington Trust consolidated   95.64%   55.29%   56.87% Wilmington Trust consolidated absent non-cash charge   55.18%   --    --  Excluding the non-cash charge, the table above shows that Wilmington Trust spent slightly more than 55 cents for each dollar of revenue recorded for the 2006 third quarter, and that the cost was lower than for prior periods. The efficiency ratio improved from its year-ago level mainly because pre-tax income was higher from the Regional Banking and Corporate Client Services business. The linked-quarter improvement was due to higher levels of pre-tax income from Wealth Advisory Services and Corporate Client Services, as expansion investments and the provision for loan losses reduced pre-tax income from the Regional Banking business. INVESTMENT SECURITIES PORTFOLIO Investment securities portfolio balances for the 2006 third quarter were $1.86 billion, on average. On a percentage basis, the composition of the portfolio was relatively unchanged from prior periods. As of September 30, 2006, approximately 80% of the portfolio was invested in fixed rate instruments. Investment securities portfolio   2006 Q3   2006 Q2   2005 Q3 Average life (in years)   5.39    6.00    6.21  Duration   2.39    2.78    2.74  The average life and duration declined because the company purchased shorter-term U.S. Treasury and government agency securities during the 2006 third quarter and because the downward shift in the yield curve caused prepayments to increase. THE REGIONAL BANKING BUSINESS The Delaware Valley region's economy remained well diversified and economic indicators remained positive. According to the Federal Reserve Bank of Philadelphia, economic activity over the past 12 months (as of August 2006, the most recent data available) increased in Delaware and was stable in Pennsylvania and New Jersey. According to the Federal Deposit Insurance Corporation, job growth in Delaware continued to outpace the national rate, with job losses from consolidation in the financial sector offset by gains in the professional, business, health, and government sectors. According to the U.S. Department of Labor, Delaware's unemployment rate for August 2006 was 3.7%. In comparison, the U.S. rate was 4.7%. Against this backdrop, loan balances rose for the 22nd consecutive quarter and were $7.76 billion, on average. This was 9% higher than for the year-ago third quarter, and 1% higher than for the 2006 second quarter. Commercial real estate/construction loans, consumer loans, and residential mortgage loans accounted for most of the growth. Loans   2006 Q3   2006 Q2   2005 Q3 Total loans outstanding (in billions, on average)   $7.76    $7.68    $7.13                Delaware market loans (in billions, on average)   $5.78    $5.73    $5.37  Delaware market loans as a % of total loans   74%   75%   75%               Pennsylvania market loans (in billions, on average)   $1.74    $1.72    $1.56  Pennsylvania market loans as a % of total loans   22%   22%   22%               Other market loans as a % of total loans   4%   3%   3% Commercial loans Commercial loan balances were $5.23 billion, on average, for the 2006 third quarter. This was 11% higher than for the year-ago third quarter, and 1% higher than for the 2006 second quarter. Almost all of the year-over-year and linked-quarter growth was in commercial real estate/construction (CRE) loans. Commercial loans (in millions, on average)   2006 Q3   2006 Q2   2005 Q3 Commercial, industrial, and agricultural loans   $2,407.7    $2,463.5    $2,449.2  Commercial real estate/construction loans   1,588.7    1,517.5    1,022.9  Commercial mortgage loans   1,238.5    1,212.8    1,232.8  Total commercial loans   $5,234.9    $5,193.8    $4,704.9                % of commercial loans from Delaware market   70%   70%   70% % of commercial loans from Pennsylvania market   29%   29%   29% % of commercial loans from other markets   1%   1%   1% CRE loan balances, on average, increased 55% from the year-ago third quarter, mainly because population growth and high demand for housing continued in Delaware. The Delaware market accounted for approximately 69% of the year-over-year CRE loan growth and the Pennsylvania market accounted for approximately 18%. Residential housing development loans accounted for approximately 72% of the year-over-year CRE loan growth. According to the University of Delaware's Center for Applied Demography, Delaware had a net gain in population between July 2004 and July 2005 (the most recent data available). The Center reported that Delaware's new residents include retirees attracted by the state's relatively low property taxes and lack of a sales tax, as well as working-age people from New Jersey and Pennsylvania who are willing to trade longer commuting time for lower housing prices. Mayflower Transit's 2006 relocation report ranked Delaware as the second most popular relocation destination in the United States. On a linked-quarter basis, the pace of CRE loan growth slowed to 5%, and the new loans were split fairly evenly between the Delaware and Pennsylvania markets. Residential housing development accounted for almost all of the linked-quarter increase. The change in the pace of CRE loan growth reflected a return to more normal market conditions. In September, several housing industry groups, including the National Association of Realtors, Moody's Economy.com, and multiple listing service Trend, predicted any housing downturn in Delaware would be short-lived and less severe than elsewhere in the United States. For the first eight months of 2006, median sale prices for single-family homes in Delaware rose between 6% and 12%, depending on location. Retail loans Retail loans (consumer loans, residential mortgage loans, and loans secured with liquid collateral) for the 2006 third quarter were $2.52 billion, on average. This was 4% higher than for the year-ago third quarter, and 2% higher than for the 2006 second quarter. Consumer loan and residential mortgage loan balances accounted for the growth. Balances of loans secured with liquid collateral declined due to lower demand from Wealth Advisory clients. More than half of total retail loan balances for the 2006 third quarter were consumer loans. Consumer loan balances, on average, were 7% higher than for the year-ago third quarter and 2% higher on a linked-quarter basis. Consumer loans (in millions, on average)   2006 Q3   2006 Q2   2005 Q3 Home equity lines of credit   $319.4    $324.3    $330.6  Indirect loans   657.3    648.4    615.1  Credit card loans   75.1    74.2    71.7  Other consumer loans   418.7    394.7    352.3  Total consumer loans   $1,470.5    $1,441.6    $1,369.7                % of consumer loans from Delaware market   88%   88%   88% % of consumer loans from Pennsylvania market   7%   6%   6% % of consumer loans from other markets   5%   6%   6% The category of consumer loans recorded as "other consumer loans" accounted for the majority of the growth in consumer loan balances. This category comprises a variety of installment loans to individuals, most of which are fixed rate loans, and includes home equity loans. Home equity loan balances increased, while home equity lines of credit decreased, as client demand for fixed rate products increased. Indirect loans, the majority of which are for late-model used cars, also contributed to the increase in consumer loan balances. The percentage of indirect loans from the New Jersey and Pennsylvania markets increased substantially from their year-ago volumes, reflecting the company's expansion in those areas. In the residential mortgage portfolio, balances rose but origination volumes declined, in large part because: Although the company sells most new fixed rate residential mortgage production into the secondary market, mortgages that qualify as low income mortgages for Community Reinvestment Act (CRA) purposes are retained in the portfolio. CRA loans originated during the 2006 third quarter were nearly twice as high as the year-ago third quarter volumes. The average loan amount originated was 12% higher for the 2006 third quarter than for the year-ago third quarter. The pace of refinancings and paydowns slowed. Seasonal cyclicality causes the number of loans originated to fluctuate from period to period. Residential mortgages   2006 Q3   2006 Q2   2005 Q3 Balances (in millions, on average)   $507.8    $484.2    $443.8  Origination volumes (in millions)   $58.6    $67.7    $70.1  Origination units   239    288    321  At September 30, 2006, approximately 74% of the residential mortgage portfolio consisted of fixed rate mortgages, unchanged from September 30, 2005, and June 30, 2006. Core deposits Core deposits (deposits from clients) for the 2006 third quarter were $4.95 billion, on average, up 2% from the year-ago third quarter and up slightly from the 2006 second quarter. Certificate of deposit (CD) and interest bearing demand deposit balances rose, but these increases were offset by a decline in noninterest bearing demand deposit balances. The majority of core deposits continued to come from Delaware clients. Total core deposits (on average)   2006 Q3   2006 Q2   2005 Q3 From Delaware clients   94%   94%   94% From Pennsylvania clients   5%   5%   5% From other markets   1%   1%   1% In December 2005, the company began to shift, or sweep, portions of commercial noninterest bearing demand deposits into money market deposits. This practice lowers deposit reserve requirements mandated by the Federal Reserve, and ultimately reduces the company's borrowing costs and uninvested cash balances. These sweeps accounted for approximately $185 million of the $279 million year-over-year decline in noninterest bearing demand deposits. CDs in amounts under $100,000 were 20% higher on a year-over-year basis, and local CDs in amounts of $100,000 and more were 34% higher. Since local CDs are client deposits, they are recorded as core deposits, not brokered deposits. Commercial banking clients in the Delaware Valley and local municipalities, which frequently use these CDs to generate returns on their excess cash, account for the majority of local CD balances. Local CDs ? $100,000 by client category   2006 Q3   2006 Q2   2005 Q3 Consumer banking clients   73%   74%   66% DE commercial banking clients   10%   12%   11% PA commercial banking clients   10%   7%   6% Wealth Advisory Services clients   7%   7%   16% Corporate Client Services clients   --    --    1% Deposits recorded as national CDs of $100,000 or more (national CDs) are brokered deposits, not client deposits. Since the company gathers deposits mainly in Delaware, but makes loans in four states, national CDs are a cost-effective way to fund loan growth without incurring the expense of building and operating a large-scale branch office network outside Delaware. Credit quality The percentage of loans outstanding with pass ratings from the internal risk rating analysis exceeded 97% for the fourth consecutive quarter, and was higher year-over-year and on a linked-quarter basis. While credit quality trends remained positive overall, net charge-offs and the net charge-off ratio were higher than in prior quarters, primarily because of one loan that was charged-off during the 2006 third quarter. This loan, which was to a Delaware Valley-based client in the dining and entertainment industry, had been recorded in renegotiated loans since the fourth quarter of 2004. As a result of this charge-off, the percentage of loans rated doubtful in the internal risk rating analysis dropped to zero. Renegotiated loans also fell to zero, because this loan was charged off, and the other loan in the category was repaid in July 2006. The net charge-off ratio for the 2006 third quarter was 9 basis points. This brought the net charge-off ratio on an annualized basis to 22 basis points, still below historical levels. Between 1995 and 2005, the annual net charge-off ratio ranged from 24 to 44 basis points. Nonaccruing loans and loans past due 90 days or more were considerably lower than for the year-ago third quarter, but were higher on a linked-quarter basis. Fewer than 10 loans, most of which were commercial loans, accounted for the changes. None of the loans classified as nonaccruing or past due 90 days during the 2006 third quarter were real-estate related. The amount recorded as other real estate owned (OREO) consists of an agricultural parcel in New Jersey. While OREO was higher year-over-year, the amount was unchanged from the 2006 second quarter. The 2006 third quarter provision for loan losses was $6.6 million, compared with $2.9 million for the year-ago third quarter, and $4.2 million for the 2006 second quarter. The reserve for loan losses was $93.6 million at September 30, 2006, which was slightly higher year over year and slightly lower on a linked-quarter basis. The loan loss reserve ratio for the 2006 third quarter was 1.20%, compared with 1.28% for the year-ago third quarter, and 1.22% for the 2006 second quarter. Regional Banking profitability The provision for loan losses and higher expenses due to expansion activities offset increases in net interest income, causing a slight uptick in the efficiency ratio for the Regional Banking business. Efficiency ratios   2006 Q3   2006 Q2   2005 Q3 Regional Banking   40.02%   39.22%   42.86% NET INTEREST MARGIN For the 2006 third quarter, assets continued to reprice faster than liabilities and deposit pricing pressure, other than for CDs, remained relatively modest. In addition, the third quarter was the first full quarter to reflect the effects of the increase in short-term interest rates that the Federal Reserve made on June 29, 2006. These factors contributed to the increase in the net interest margin, which, at 3.83%, was 17 basis points higher than for the year-ago third quarter, and 3 basis points higher than for the 2006 second quarter. Net interest margin   2006 Q3   2006 Q2   2005 Q3 Net interest margin   3.83%   3.80%   3.66% Basis point (bps) increases in yields/rates   9/30/06 vs. 6/30/06   9/30/06 vs. 9/30/05 Total earning assets   25 bps   128 bps Funds to support earning assets   22 bps   111 bps Average balance increases   9/30/06 vs. 6/30/06   9/30/06 vs. 9/30/05 Total earning assets   1%   6% Funds to support earning assets   1%   6% The company’s floating rate loan portfolio is matched closely with floating rate funding. This helps to minimize changes in the net interest margin due to changes in market interest rates. As of September 30, 2006: Approximately 75% of total loans outstanding were floating rate loans. Approximately 81% of floating rate loans were commercial loans, most of which reprice within 30 to 45 days of a rate change. The pricing on approximately 62% of commercial floating rate loans was tied to a prime lending rate of 8.25%. The pricing on approximately 34% of commercial floating rate loans was tied to the 30-day London Interbank Offered Rate (Libor) of 5.32%. As of   Commercial floating rate loans repricing in ? 30 days   National CDs maturing ? 90 days   Short-term borrowings maturing ? 90 days 9/30/06    93%   74%   98% 6/30/06    92%   59%   91% 9/30/05    92%   91%   90% Changes over the past 12 months in the percentage of national CDs maturing in 90 days or less reflected the flat yield curve. With little difference between 90-day rates and longer-term rates, the company opted to purchase the longer-term instruments. THE WEALTH ADVISORY SERVICES BUSINESS Wealth Advisory Services (WAS) revenue for the 2006 third quarter was $47.1 million. This was 8% higher than for the year-ago third quarter, and slightly more than for the 2006 second quarter. Strong growth in revenue from planning and other services, plus higher mutual fund revenue, accounted for the year-over-year increase. The linked-quarter increase came from mutual fund revenue. Most mutual fund fees are based on money market funds. Revenue from trust and investment advisory services was essentially unchanged from the prior-year and prior-quarter levels, as business development was offset by lackluster performance in the financial markets. As of September 30, 2006, approximately 48% of assets managed for WAS clients were invested in equities, and approximately 28% were invested in fixed income instruments. Although markets rallied in September, the timing occurred too late in the quarter to have much of an effect. Revenue from planning and other services for the 2006 third quarter was $8.8 million. This was 38% higher than for the year-ago third quarter, and down slightly from the 2006 second quarter. Planning revenue was affected mainly by activity at Grant Tani Barash & Altman (GTBA), the company's West Coast provider of business management and family office services. Since GTBA's fees are based on the amount of income its clients earn, revenue from GTBA can fluctuate up or down from period to period. Business development remained solid. Year-over-year sales increases were recorded by the California, Maryland, and Delaware markets. Sales attributed to Delaware include business from clients in other states whose accounts are located in Delaware in order to benefit from trust, tax, and legal advantages not available for trusts governed by the laws of other states. On a linked-quarter basis, sales increases were recorded by the California, Florida, Maryland, and Pennsylvania markets. Wealth Advisory Services profitability Pretax income from WAS for the 2006 third quarter was the same as for the year-ago third quarter, but expenses were higher year-over-year because of expansion activities, including the East Coast launch of the Wilmington Family Office practice and the opening of new offices in Pennsylvania and New Jersey. This led to a modest decline, year over year, in the efficiency ratio. On a linked-quarter basis, incentive and employment benefits expenses were lower, which improved the efficiency ratio. Efficiency ratios   2006 Q3   2006 Q2   2005 Q3 Wealth Advisory Services   77.64%   79.76%   75.53% THE CORPORATE CLIENT SERVICES BUSINESS Corporate Client Services (CCS) revenue for the 2006 third quarter was $21.1 million. This was 10% more than for the year-ago third quarter, and slightly higher than for the 2006 second quarter. Fees from entity management, retirement services, and investment and cash management services rose on a year-over-year as well as a linked-quarter basis, but these increases were offset by flatness in capital markets revenue. Capital markets revenue for the 2006 third quarter was $8.2 million, down slightly from the year-ago and prior quarter levels. Weakness in U.S. demand for asset-backed securitizations continued to offset growth in defeasance services (transactions in which one type of collateral is exchanged for another) and insurance premium financing. Entity management revenue for the 2006 third quarter was $6.8 million, up 19% from the year-ago third quarter and 3% on a linked-quarter basis. Business development in Europe and the Cayman Islands accounted for most of the growth. In Europe, business activity reflected demand for independent directorships and administrative services, particularly for asset-backed securitizations in Ireland, England, and Greece. Corporate retirement services for the 2006 third quarter was $3.4 million, up 6% from the year-ago as well as linked quarter, mainly because clients added funds to their retirement plans. While most CCS fees are transaction-based, approximately 55% of retirement services fees are based on the valuation of retirement plan assets for which the company serves as custodian. CCS investment and cash management revenue for the 2006 third quarter was $2.7 million. This was 42% higher than for the year-ago third quarter, and 8% more than for the 2006 second quarter. These increases resulted from higher client demand and more proactive efforts to market these services. Approximately 30% of the 2006 third quarter investment/cash management revenue was tied to the valuations of domestic fixed income instruments, primarily asset-backed, U.S. Treasury, corporate, and other types of investment grade securities. The remainder was based on money market mutual fund balances. Corporate Client Services profitability On a year-over-year as well as linked-quarter basis, net interest and noninterest income growth outpaced expense growth, which caused the CCS efficiency ratio to improve. Efficiency ratios   2006 Q3   2006 Q2   2005 Q3 Corporate Client Services   70.71%   72.56%   76.67% AFFILIATE MONEY MANAGERS Assets under management at value-style affiliate Cramer Rosenthal McGlynn (CRM) were $9.80 billion at September 30, 2006. This was an increase of $1.30 billion, or 15%, from the amount reported at the end of September 2005, and $392.5 million, or 4%, more than at June 30, 2006. Asset inflows, particularly in the mid-cap value product, and market appreciation accounted for the growth. Revenue from CRM for the 2006 third quarter was $4.6 million. This was 35% more than for the year-ago third quarter, and reflected the increase in managed assets. On a linked-quarter basis, revenue from CRM declined opposite the increase in managed assets, mainly because the revenue recorded for the 2006 second quarter included higher levels of hedge fund performance fees. Affiliate managers (in millions)   2006 Q3   2006 Q2   2005 Q3 Managed assets at Cramer Rosenthal McGlynn   $9,784.5    $9,392.0    $8,480.5  Revenue from Cramer Rosenthal McGlynn   $4.6    $5.5    $3.4                Managed assets at Roxbury Capital Management   $3,122.9    $3,253.3    $3,246.6  Revenue from Roxbury Capital Management   --    $0.3    $0.3  Growth-style affiliate Roxbury Capital Management (RCM) terminated its micro-cap product during the 2006 third quarter, which reduced managed asset levels and revenue. In addition, costs associated with the fund termination caused expenses to be higher than usual. As a result, RCM's revenue contribution for the quarter was negative and a nominal loss was recorded. OTHER INCOME ITEMS Other noninterest income was lower on a year-over-year basis because the amount reported for the year-ago third quarter included approximately $2.0 million of gains from executive life insurance policies. On a linked-quarter basis, other noninterest income was lower mainly because the amount recorded for the 2006 second quarter included nonrecurring income of approximately $1.0 million from a gain on the sale of real estate. NONINTEREST EXPENSES Noninterest expenses for the 2006 third quarter were $170.9 million. The non-cash charge for RCM accounted for $72.3 million of this amount. Excluding the non-cash charge, noninterest expenses were $98.6 million. This was 6% more than for the year-ago third quarter, and $300,000 more than for the 2006 second quarter. Expansion initiatives and additions to staff were the primary reasons for the increases. In the past 12 months, the company has: Launched the Wilmington Family Office practice on the East Coast. Opened new offices in Pennsylvania, New Jersey, Connecticut, and Frankfurt, Germany. Expanded existing offices in Delaware, Pennsylvania, Maryland, and New York. Acquired PwC Corporate Services (Cayman). Invested in technology and added staff to expand services that support collateralized debt obligations. At September 30, 2006, there were 2,520 staff members. This was 81 more than at the end of the year-ago third quarter, and 5 more than at the end of the 2006 second quarter. Staffing-related costs continued to account for the majority of noninterest expenses, excluding the non-cash charge. Staffing-related expenses (dollars in millions)   2006 Q3   2006 Q2   2005 Q3 Full-time equivalent staff members   2,520    2,515    2,439  Staffing-related expenses   $59.8    $60.0    $56.3  Among staffing-related expenses, increased salary and wage expenses were offset by accruals for incentives and employment benefits expenses. Effective January 1, 2006, amounts reported for incentive and bonus expense were adjusted to reflect adoption of the retrospective method of accounting for stock-based compensation expense, in accordance with Statement of Financial Accounting Standards No. 123 (revised). Stock-based compensation expense is included in incentive and bonus expense. Incentives and bonuses (in millions)   2006 Q3   2006 Q2   2006 Q1   2005 Q4   2005 Q3 Stock option expense   $1.7    $1.4    $2.0    $1.8    $1.7  Total incentives and bonuses   $8.9    $10.3    $10.3    $8.8    $9.3  CAPITAL RATIOS During a review of risk-based capital calculations, the company discovered that the total risk-based capital ratios reported as of December 31, 2005; March 31, 2006; and June 30, 2006, inadvertently included portions of subordinated long-term debt that should have been excluded due to their approaching maturity. The corrected ratios appear in the table below. The total risk-based capital ratio was the only capital ratio affected. All of the company's capital ratios remained well above the regulatory minimum to be considered a well capitalized institution. Corrections to the total risk-based capital ratio At June 30, 2006   At March 31, 2006   At December 31, 2005   Reported ratio   Corrected ratio   Reported ratio   Corrected ratio   Reported ratio   Corrected ratio Total risk-based capital   12.66%   11.80%   12.72%   12.21%   12.36%   12.02% Regulatory minimums   Adequately capitalized minimum   Well capitalized minimum Total risk-based capital   8%   10% Capital ratios for the three months ended September 30, 2006, and the preceding four quarters are included in the supplemental information section of this release. SHARE REPURCHASES During the 2006 third quarter, the company spent $22.2 million to repurchase 504,515 of its shares. The average price per share was $44.08. This brought the total number of shares repurchased under the current 8-million-share program, which commenced in April 2002, to 1,350,077, leaving 6,649,923 shares available for repurchase. OUTLOOK FOR THE REMAINDER OF 2006 Commenting on the outlook for the remainder of 2006, Cecala said: "Our focus on building and strengthening client relationships, plus the expansion investments we have made, have generated strong momentum in each of our businesses for the first nine months of 2006. We expect that momentum to continue. "Economic indicators remain positive overall for the Delaware Valley region, which will benefit the Regional Banking business. "Population growth in Delaware continues to drive housing demand. The housing market has slowed somewhat, but the level of activity remains within what has been considered a historically normal range. Published reports indicate that Delaware's housing market is not expected to experience as sharp a decline as in other parts of the country. "Core deposit pricing tends to lag behind the Federal Open Market Committee interest rate changes. Absent any additional increases, we expect core deposit pricing to catch up, which will cause the net interest margin to decline modestly. "In terms of credit quality, more than 97% of our loans outstanding have pass ratings. We expect the full-year provision for loan losses to be in line with the levels we have seen over the past 10 years, which have ranged from $12 million to $22 million. "As the percentage of loans generated outside of the Delaware market continues to increase, we will continue to use national CDs to help fund earning asset growth – and to help us manage expense growth and interest rate risk. "In Wealth Advisory Services, we expect to see higher levels of planning revenue due to the expansion of our family office capabilities. The majority of Wealth Advisory revenue, however, is tied to financial market levels. We base trust and investment advisory fees on market levels as of the last business day of each month, so changes in revenue from these services may not correlate directly with changes in financial markets. "Business development continues to be solid in Corporate Client Services, especially in Europe and the Caribbean. To further grow this business, we are considering small acquisitions and looking for opportunities to develop new products. "Asset inflows continue at value-style affiliate Cramer Rosenthal McGlynn (CRM). Revenue from CRM will reflect financial market levels. "Growth-style affiliate Roxbury Capital Management (RCM) continues to be profitable. The changes RCM made during the third quarter should have a positive effect on the firm's continuing operations. "Expense growth will reflect the expansion investments we have made this year in each of our businesses, and should approximate 7% for the full year, plus the $72.3 million impairment expense." CONFERENCE CALL Management will discuss the 2006 third quarter results and outlook for the future in a conference call today at 10:00 a.m. (EDT). Supporting materials, financial statements, and audio streaming will be available at www.wilmingtontrust.com. To access the call from within the United States, dial (877) 258-8842 and enter PIN 7811598. From outside the United States, dial (973) 582-2839 and enter PIN 7811598. A rebroadcast of the call will be available from 12:30 p.m. (EDT) today until 5:00 p.m. (EDT) on Friday, October 27, 2006, by calling (877) 519-4471 inside the United States or (973) 341-3080 from outside the United States. Use PIN 7811598 to access the rebroadcast. FORWARD-LOOKING STATEMENTS This presentation contains forward-looking statements that reflect our current expectations about our future performance. These statements rely on a number of assumptions and estimates and are subject to various risks and uncertainties that could cause our actual results to differ from our expectations. Factors that could affect our future financial results include, among other things, changes in national or regional economic conditions; changes in market interest rates; significant changes in banking laws or regulations; increased competition in our businesses; higher-than-expected credit losses; the effects of acquisitions; the effects of integrating acquired entities; a substantial and permanent loss of either client accounts and/or assets under management at Wilmington Trust and/or our affiliate money managers, Cramer Rosenthal McGlynn and Roxbury Capital Management; unanticipated changes in regulatory, judicial, or legislative tax treatment of business transactions; and economic uncertainty created by unrest in other parts of the world. ABOUT WILMINGTON TRUST Wilmington Trust Corporation (NYSE:WL) is a financial services holding company that provides Regional Banking services throughout the Delaware Valley region, Wealth Advisory Services for high-net-worth clients in 22 countries, and Corporate Client Services for institutional clients in 81 countries. Its wholly owned bank subsidiary, Wilmington Trust Company, which was founded in 1903, is one of the largest personal trust providers in the United States and the leading retail and commercial bank in Delaware. Wilmington Trust Corporation and its affiliates have offices in California, Connecticut, Delaware, Florida, Georgia, Maryland, Nevada, New Jersey, New York, Pennsylvania, South Carolina, Vermont, the Cayman Islands, the Channel Islands, London, Dublin, and Frankfurt. For more information, visit www.wilmingtontrust.com. WILMINGTON TRUST CORPORATION QUARTERLY SUMMARY As of and for the nine months ended September 30, 2006 HIGHLIGHTS   Three Months Ended Nine Months Ended   Sept. 30, Sept. 30, % Sept. 30, Sept. 30, %             2006    2005    Change   2006    2005    Change OPERATING RESULTS (in millions)   Net interest income $ 93.0  $ 83.7  11.1  $ 270.7  $ 241.4  12.1  Provision for loan losses (6.6) (2.9) 127.6  (14.8) (9.8) 51.0  Noninterest income 84.6  79.7  6.1  253.6  233.5  8.6  Noninterest expense 170.9  93.5  82.8  366.8  275.6  33.1  Net income 5.2  42.8  (87.9) 96.3  120.5  (20.1)   PER SHARE DATA Basic net income $ 0.08  $ 0.63  (87.3) $ 1.41  $ 1.78  (20.8) Diluted net income 0.07  0.62  (88.7) 1.38  1.76  (21.6) Dividends paid 0.315  0.30  5.0  0.93  0.885  5.1  Book value at period end 15.55  14.34  8.4  15.55  14.34  8.4  Closing price at period end 44.55  36.45  22.2  44.55  36.45  22.2  Market range: High 45.61  39.36  15.9  45.61  39.36  15.9  Low 40.52  35.35  14.6  38.54  33.01  16.8    AVERAGE SHARES OUTSTANDING (in thousands) Basic 68,647  67,788  1.3  68,399  67,630  1.1  Diluted 69,933  68,699  1.8  69,716  68,440  1.9    AVERAGE BALANCE SHEET (in millions)   Investment portfolio $ 1,857.0  $ 1,930.0  (3.8) $ 1,851.2  $ 1,866.3  (0.8) Loans 7,759.3  7,128.4  8.9  7,628.0  6,946.8  9.8  Earning assets 9,645.1  9,111.3  5.9  9,501.0  8,844.6  7.4  Core deposits 4,950.0  4,853.0  2.0  4,912.6  4,817.4  2.0  Stockholders' equity 1,081.7  962.2  12.4  1,056.3  937.9  12.6      STATISTICS AND RATIOS (net income annualized)   Return on average stockholders' equity 1.91% 17.65% (89.2) 12.19% 17.18% (29.0) Return on average assets 0.20% 1.70% (88.2) 1.24% 1.66% (25.3) Net interest margin (taxable equivalent) 3.83% 3.66% 4.6  3.80% 3.65% 4.1  Dividend payout ratio 415.38% 47.20% N/M  65.94% 49.63% 32.9  Full-time equivalent headcount 2,520  2,439  3.3  2,520  2,439  3.3  Prior period numbers have been adjusted throughout this report for the retrospective adoption of stock-based compensation accounting. WILMINGTON TRUST CORPORATION QUARTERLY SUMMARY As of and for the nine months ended September 30, 2006   QUARTERLY INCOME STATEMENT   Three Months Ended Sept. 30, June 30, Mar. 31, Dec. 31, Sept. 30, % Change From: Prior Prior (in millions) 2006  2006  2006  2005  2005  Quarter Year NET INTEREST INCOME Interest income $175.0  $165.0  $152.8  $146.2  $134.9  6.1  29.7  Interest expense 82.0  74.6  65.5  58.7  51.2  9.9  60.2  Net interest income 93.0  90.4  87.3  87.5  83.7  2.9  11.1  Provision for loan losses (6.6) (4.2) (4.0) (2.0) (2.9) 57.1  127.6  Net interest income after provision for loan losses 86.4  86.2  83.3  85.5  80.8  0.2  6.9  NONINTEREST INCOME Advisory fees: Wealth Advisory Services Trust and investment advisory fees 33.0  33.1  34.3  31.1  32.7  (0.3) 0.9  Mutual fund fees 5.3  5.0  4.7  4.5  4.4  6.0  20.5  Planning and other services 8.8  8.9  7.3  7.1  6.4  (1.1) 37.5  Total Wealth Advisory Services 47.1  47.0  46.3  42.7  43.5  0.2  8.3  Corporate Client Services Capital markets services 8.2  8.5  8.7  8.9  8.3  (3.5) (1.2) Entity management services 6.8  6.6  6.5  6.1  5.7  3.0  19.3  Retirement services 3.4  3.2  3.1  3.3  3.2  6.2  6.2  Investment / cash management services 2.7  2.5  2.1  2.3  1.9  8.0  42.1  Total Corporate Client Services 21.1  20.8  20.4  20.6  19.1  1.4  10.5  Cramer Rosenthal McGlynn 4.6  5.5  4.0  4.3  3.4  (16.4) 35.3  Roxbury Capital Management ----  0.3  0.9  0.6  0.3  (100.0) (100.0) Advisory fees 72.8  73.6  71.6  68.2  66.3  (1.1) 9.8  Amortization of affiliate other intangibles (1.1) (1.0) (1.0) (1.0) (1.0) 10.0  10.0  Advisory fees after amortization of affiliate other intangibles 71.7  72.6  70.6  67.2  65.3  (1.2) 9.8  Service charges on deposit accounts 7.3  7.0  6.9  7.3  7.4  4.3  (1.4) Other noninterest income 5.5  6.8  5.2  5.3  7.0  (19.1) (21.4) Securities gains/(losses) 0.1  (0.1) ----  ----  ----  ----  ----  Total noninterest income 84.6  86.3  82.7  79.8  79.7  (2.0) 6.1  Net interest and noninterest income 171.0  172.5  166.0  165.3  160.5  (0.9) 6.5  NONINTEREST EXPENSE Salaries and wages 39.5  37.8  36.9  36.4  35.4  4.5  11.6  Incentives and bonuses 8.9  10.3  10.3  8.8  9.3  (13.6) (4.3) Employment benefits 11.4  11.9  13.5  11.5  11.6  (4.2) (1.7) Net occupancy 6.7  6.3  5.9  6.1  5.5  6.3  21.8  Furniture, equipment, and supplies 9.2  9.9  9.0  8.4  8.7  (7.1) 5.7  Other noninterest expense: Advertising and contributions 2.2  2.1  1.9  2.5  2.4  4.8  (8.3) Servicing and consulting fees 2.8  2.4  2.3  2.9  2.3  16.7  21.7  Subadvisor expense 2.7  2.9  2.8  2.5  2.7  (6.9) ----  Travel, entertainment, and training 2.5  2.3  2.2  2.6  2.6  8.7  (3.8) Originating and processing fees 2.8  2.4  2.8  2.8  2.8  16.7  ----  Other expense 9.9  10.0  9.9  10.0  10.2  (1.0) (2.9) Total other noninterest expense 22.9  22.1  21.9  23.3  23.0  3.6  (0.4) Total noninterest expense before impairment 98.6  98.3  97.5  94.5  93.5  0.3  5.5  Impairment write-down 72.3  ----  ----  ----  ----  ----  ----  Total noninterest expense 170.9  98.3  97.5  94.5  93.5  73.9  82.8  Income before income taxes and minority interest 0.1  74.2  68.5  70.8  67.0  (99.9) (99.9) Applicable income taxes (5.0) 27.2  24.3  24.3  24.1  ----  ----  Net income before minority interest 5.1  47.0  44.2  46.5  42.9  (89.1) (88.1) Minority interest (0.1) 0.1  0.1  ----  0.1  ----  ----  Net income $5.2  $46.9  $44.1  $46.5  $42.8  (88.9) (87.9) WILMINGTON TRUST CORPORATION QUARTERLY SUMMARY As of and for the nine months ended September 30, 2006   YEAR-TO-DATE INCOME STATEMENT   Nine Months Ended   Sept. 30, Sept. 30, % (in millions)   2006    2005    Change NET INTEREST INCOME Interest income $ 492.9  $ 370.4  33.1  Interest expense     222.2      129.0  72.2  Net interest income 270.7  241.4  12.1  Provision for loan losses     (14.8)     (9.8) 51.0  Net interest income after provision for loan losses   255.9      231.6  10.5  NONINTEREST INCOME Advisory fees: Wealth Advisory Services Trust and investment advisory fees 100.4  92.9  8.1  Mutual fund fees 15.0  13.2  13.6  Planning and other services     25.1      23.3  7.7  Total Wealth Advisory Services   140.5      129.4  8.6  Corporate Client Services Capital markets services 25.4  23.7  7.2  Entity management services 19.8  17.5  13.1  Retirement services 9.8  9.1  7.7  Investment / cash management services     7.3      5.4  35.2  Total Corporate Client Services   62.3      55.7  11.8  Cramer Rosenthal McGlynn 14.1  11.8  19.5  Roxbury Capital Management     1.1      0.8  37.5  Advisory fees 218.0  197.7  10.3  Amortization of affiliate other intangibles     (3.1)     (3.1) ----  Advisory fees after amortization of affiliate other intangibles   214.9      194.6  10.4  Service charges on deposit accounts 21.1  20.9  1.0  Other noninterest income 17.6  17.2  2.3  Securities gains     ----      0.8  (100.0) Total noninterest income   253.6      233.5  8.6  Net interest and noninterest income   509.5      465.1  9.5  NONINTEREST EXPENSE Salaries and wages 114.1  103.3  10.5  Incentives and bonuses 29.5  29.1  1.4  Employment benefits 36.8  35.8  2.8  Net occupancy 19.0  16.3  16.6  Furniture, equipment, and supplies 28.2  26.3  7.2  Other noninterest expense: Advertising and contributions 6.2  6.6  (6.1) Servicing and consulting fees 7.5  7.3  2.7  Subadvisor expense 8.4  6.9  21.7  Travel, entertainment, and training 7.0  6.2  12.9  Originating and processing fees 8.0  7.7  3.9  Other expense     29.8      30.1  (1.0) Total other noninterest expense   66.9      64.8  3.2  Total noninterest expense before impairment 294.5  275.6  6.9  Impairment write-down   72.3      ----  ----  Total noninterest expense   366.8      275.6  33.1  Income before income taxes and minority interest 142.7  189.5  (24.7) Applicable income taxes     46.3      68.8  (32.7) Net income before minority interest 96.4  120.7  (20.1) Minority interest     0.1      0.2  (50.0) Net income $ 96.3    $ 120.5  (20.1) WILMINGTON TRUST CORPORATION QUARTERLY SUMMARY As of and for the nine months ended September 30, 2006   COMPARISON OF RESULTS WITH AND WITHOUT THE IMPAIRMENT WRITE-DOWN     Three months ended September 30, 2006 Nine months ended September 30, 2006 With Without With Without impairment impairment Impairment impairment impairment Impairment OPERATING RESULTS (in millions) Net interest income $ 93.0  $ 93.0  $ ----  $ 270.7  $ 270.7  $ ----  Provision for loan losses (6.6) (6.6) ----  (14.8) (14.8) ----  Noninterest income 84.6  84.6  ----  253.6  253.6  ----  Noninterest expense       170.9      98.6      72.3    366.8      294.5      72.3  Income before taxes and minority interest 0.1  72.4  (72.3) 142.7  215.0  (72.3) Applicable income taxes       (5.0)     25.6      (30.6)   46.3      76.9      (30.6) Net income before minority interest 5.1  46.8  (41.7) 96.4  138.1  (41.7) Minority interest       (0.1)     (0.1)     ----    0.1      0.1      ----  Net income $ 5.2    $ 46.9    $ (41.7) $ 96.3    $ 138.0    $ (41.7)     PER SHARE DATA Diluted shares outstanding (in millions) 69.9  69.9  ----  69.7  69.7  ----  Per-share earnings $ 0.07  $ 0.67  $ (0.60) $ 1.38  $ 1.98  $ (0.60)     STATISTICS AND RATIOS (dollars in millions) Total assets, on average $ 10,522.2  $ 10,523.0  $ (0.8) $ 10,354.4  $ 10,354.6  $ (0.2) Stockholders' equity, on average 1,081.7  1,082.2  (0.5) 1,056.3  1,056.4  (0.1) Return on average assets 0.20% 1.77% (1.57)% 1.24% 1.78% (0.54)% Return on equity 1.91% 17.23% (15.32)% 12.19% 17.47% (5.28)%   Net interest before provision and noninterest income $ 177.6  $ 177.6  $ ----  $ 524.3  $ 524.3  $ ----  Tax equivalent interest income       1.1      1.1      ----    3.2      3.2      ----  $ 178.7  $ 178.7  $ ----  $ 527.5  $ 527.5  $ ----  Noninterest expense $ (170.9)   $ (98.6)   $ (72.3) $ (366.8)   $ (294.5)   $ (72.3) Efficiency ratio 95.64% 55.18% 40.46% 69.54% 55.83% 13.71% WILMINGTON TRUST CORPORATION QUARTERLY SUMMARY As of and for the nine months ended September 30, 2006   STATEMENT OF CONDITION   % Change From: Sept. 30, June 30, Mar. 31, Dec. 31, Sept. 30, Prior Prior (in millions)   2006    2006    2006    2005    2005  Quarter Year ASSETS Cash and due from banks $ 268.4  $ 258.5  $ 219.2  $ 264.0  $ 286.8  3.8  (6.4) Federal funds sold and securities purchased under agreements to resell     38.4    66.7    44.9    14.3    64.0  (42.4) (40.0) Investment securities: U.S. Treasury 230.8  181.4  136.8  161.1  136.8  27.2  68.7  Government agencies 533.0  416.5  394.5  410.8  389.4  28.0  36.9  Obligations of state and political subdivisions 9.4  10.4  10.5  11.0  11.2  (9.6) (16.1) Preferred stock 91.0  88.1  90.2  90.6  91.1  3.3  (0.1) Mortgage-backed securities 726.8  751.0  806.4  852.1  913.9  (3.2) (20.5) Other securities   391.3    389.8    401.9    403.2    384.6  0.4  1.7  Total investment securities 1,982.3    1,837.2    1,840.3    1,928.8    1,927.0  7.9  2.9  Loans: Commercial, financial and agricultural 2,378.1  2,445.5  2,445.9  2,461.3  2,465.9  (2.8) (3.6) Real estate-construction 1,610.9  1,574.3  1,411.9  1,233.9  1,098.9  2.3  46.6  Mortgage-commercial   1,254.5    1,222.8    1,245.4    1,223.9    1,239.4  2.6  1.2  Total commercial loans 5,243.5    5,242.6    5,103.2    4,919.1    4,804.2  ----  9.1  Mortgage-residential 518.7  503.0  473.4  455.5  450.9  3.1  15.0  Consumer 1,489.7  1,452.4  1,408.5  1,438.3  1,414.8  2.6  5.3  Secured with liquid collateral   528.3    557.2    553.9    584.8    622.9  (5.2) (15.2) Total retail loans 2,536.7    2,512.6    2,435.8    2,478.6    2,488.6  1.0  1.9  Total loans net of unearned income 7,780.2  7,755.2  7,539.0  7,397.7  7,292.8  0.3  6.7  Reserve for loan losses   (93.6)   (94.3)   (93.6)   (91.4)   (93.4) (0.7) 0.2  Net loans 7,686.6    7,660.9    7,445.4    7,306.3    7,199.4  0.3  6.8  Premises and equipment 151.6  151.2  148.7  147.6  147.2  0.3  3.0  Goodwill 291.1  363.0  348.5  348.3  344.3  (19.8) (15.5) Other intangibles 38.8  38.9  35.0  36.2  40.2  (0.3) (3.5) Other assets   240.0    214.3    182.6    187.3    189.5  12.0  26.6  Total assets $ 10,697.2  $ 10,590.7  $ 10,264.6  $ 10,232.8  $ 10,198.4  1.0  4.9    LIABILITIES AND STOCKHOLDERS' EQUITY   Deposits: Noninterest-bearing demand $ 861.3  $ 813.8  $ 830.2  $ 1,014.8  $ 1,060.8  5.8  (18.8) Interest-bearing: Savings 292.5  313.1  328.0  326.3  332.7  (6.6) (12.1) Interest-bearing demand 2,417.5  2,355.9  2,352.1  2,360.0  2,317.5  2.6  4.3  Certificates under $100,000 995.5  991.1  960.4  923.0  840.6  0.4  18.4  Local certificates $100,000 and over   574.7    550.6    513.3    436.5    411.0  4.4  39.8  Total core deposits 5,141.5  5,024.5  4,984.0  5,060.6  4,962.6  2.3  3.6  National certificates $100,000 and over   2,742.7    2,760.6    2,707.2    2,228.6    2,586.3  (0.6) 6.0  Total deposits 7,884.2    7,785.1    7,691.2    7,289.2    7,548.9  1.3  4.4  Short-term borrowings: Federal funds purchased and securities sold under agreements to repurchase     1,161.7  1,160.0  984.2  1,355.6  1,104.4  0.1  5.2  U.S. Treasury demand   7.0    24.5    0.6    18.1    12.9  (71.4) (45.7) Total short-term borrowings 1,168.7    1,184.5    984.8    1,373.7    1,117.3  (1.3) 4.6  Other liabilities 184.5  160.5  151.8  151.6  156.2  15.0  18.1  Long-term debt   395.2    393.4    393.2    400.4    403.1  0.5  (2.0) Total liabilities 9,632.6    9,523.5    9,221.0    9,214.9    9,225.5  1.1  4.4  Minority interest 0.3  0.3  0.3  0.2  0.2  ----  50.0  Stockholders' equity   1,064.3    1,066.9    1,043.3    1,017.7    972.7  (0.2) 9.4  Total liabilities and stockholders' equity   $ 10,697.2  $ 10,590.7  $ 10,264.6  $ 10,232.8  $ 10,198.4  1.0  4.9  WILMINGTON TRUST CORPORATION QUARTERLY SUMMARY As of and for the nine months ended September 30, 2006   AVERAGE STATEMENT OF CONDITION   2006  2006  2006  2005  2005  % Change From: Third Second First Fourth Third Prior Prior (in millions)   Quarter   Quarter   Quarter   Quarter   Quarter Quarter Year ASSETS Cash and due from banks $ 206.9  $ 209.3  $ 208.0  $ 237.8  $ 229.6  (1.1) (9.9) Federal funds sold and securities purchased under agreements to resell     28.8    18.8    17.5    40.2    52.9  53.2  (45.6) Investment securities: U.S. Treasury 157.0  146.7  144.6  133.5  134.4  7.0  16.8  Government agencies 475.9  394.1  400.8  406.4  390.7  20.8  21.8  Obligations of state and political subdivisions 9.6  10.5  10.5  11.1  11.3  (8.6) (15.0) Preferred stock 89.4  89.2  91.4  90.0  92.5  0.2  (3.4) Mortgage-backed securities 735.1  780.1  828.4  878.6  931.9  (5.8) (21.1) Other securities   390.0    397.3    403.2    387.4    369.2  (1.8) 5.6  Total investment securities 1,857.0    1,817.9    1,878.9    1,907.0    1,930.0  2.2  (3.8) Loans: Commercial, financial and agricultural 2,407.7  2,463.5  2,448.1  2,465.9  2,449.2  (2.3) (1.7) Real estate-construction 1,588.7  1,517.5  1,322.0  1,161.6  1,022.9  4.7  55.3  Mortgage-commercial   1,238.5    1,212.8    1,229.8    1,239.7    1,232.8  2.1  0.5  Total commercial loans 5,234.9    5,193.8    4,999.9    4,867.2    4,704.9  0.8  11.3  Mortgage-residential 507.8  484.2  463.3  450.8  443.8  4.9  14.4  Consumer 1,470.5  1,441.6  1,423.9  1,412.5  1,369.7  2.0  7.4  Secured with liquid collateral   546.1    556.3    558.2    614.4    610.0  (1.8) (10.5) Total retail loans 2,524.4    2,482.1    2,445.4    2,477.7    2,423.5  1.7  4.2  Total loans net of unearned income 7,759.3  7,675.9  7,445.3  7,344.9  7,128.4  1.1  8.9  Reserve for loan losses   (93.5)   (91.8)   (90.4)   (93.5)   (91.6) 1.9  2.1  Net loans 7,665.8    7,584.1    7,354.9    7,251.4    7,036.8  1.1  8.9  Premises and equipment 152.1  150.3  148.5  147.6  148.2  1.2  2.6  Goodwill 362.3  357.3  348.3  344.4  344.2  1.4  5.3  Other intangibles 38.5  37.3  35.6  39.7  40.9  3.2  (5.9) Other assets   210.8    190.0    180.3    172.1    181.9  10.9  15.9  Total assets $ 10,522.2  $ 10,365.0  $ 10,172.0  $ 10,140.2  $ 9,964.5  1.5  5.6    LIABILITIES AND STOCKHOLDERS' EQUITY   Deposits: Noninterest-bearing demand $ 737.2  $ 742.0  $ 763.5  $ 1,017.4  $ 1,016.4  (0.6) (27.5) Interest-bearing: Savings 304.1  321.2  326.0  325.9  345.1  (5.3) (11.9) Interest-bearing demand 2,374.1  2,364.4  2,346.8  2,321.2  2,257.2  0.4  5.2  Certificates under $100,000 988.1  980.9  938.6  901.5  825.0  0.7  19.8  Local certificates $100,000 and over   546.5    540.0    463.3    446.6    409.3  1.2  33.5  Total core deposits 4,950.0  4,948.5  4,838.2  5,012.6  4,853.0  ----  2.0  National certificates $100,000 and over   2,864.6    2,656.1    2,647.7    2,475.4    2,500.6  7.8  14.6  Total deposits 7,814.6    7,604.6    7,485.9    7,488.0    7,353.6  2.8  6.3    Short-term borrowings: Federal funds purchased and securities sold under agreements to repurchase     1,048.8  1,146.0  1,082.0  1,098.0  1,056.7  (8.5) (0.7) U.S. Treasury demand   6.8    16.0    11.7    7.7    12.1  (57.5) (43.8) Total short-term borrowings 1,055.6    1,162.0    1,093.7    1,105.7    1,068.8  (9.2) (1.2) Other liabilities 175.7  144.8  166.7  163.3  170.9  21.3  2.8  Long-term debt   394.2    393.3    399.0    400.0    408.7  0.2  (3.5) Total liabilities 9,440.1    9,304.7    9,145.3    9,157.0    9,002.0  1.5  4.9  Minority interest 0.4  0.3  0.3  0.2  0.3  33.3  33.3  Stockholders' equity   1,081.7    1,060.0    1,026.4    983.0    962.2  2.0  12.4  Total liabilities and stockholders' equity   $ 10,522.2  $ 10,365.0  $ 10,172.0  $ 10,140.2  $ 9,964.5  1.5  5.6    WILMINGTON TRUST CORPORATION QUARTERLY SUMMARY As of and for the nine months ended September 30, 2006   YIELDS AND RATES     2006  2006  2006  2005  2005  YIELDS/RATES Third Second First Fourth Third (tax-equivalent basis)   Quarter   Quarter   Quarter   Quarter   Quarter EARNING ASSETS: Federal funds sold and securities purchased under agreements to resell     4.55  % 4.93  % 4.11  % 4.02  % 3.45  %   U.S. Treasury 4.06  3.53  3.38  3.27  3.17  Government agencies 4.23  3.93  3.95  3.95  3.87  Obligations of state and political subdivisions 8.75  8.79  8.77  8.78  8.76  Preferred stock 7.63  7.60  7.60  7.58  7.58  Mortgage-backed securities 4.05  4.16  4.17  4.10  4.02  Other securities 6.42  6.14  5.52  5.32  4.84  Total investment securities 4.78  4.67  4.53  4.44  4.27    Commercial, financial and agricultural 7.96  7.61  7.24  6.80  6.32  Real estate-construction 8.60  8.26  7.90  7.39  6.94  Mortgage-commercial 7.98  7.71  7.34  6.96  6.55  Total commercial loans 8.16  7.82  7.44  6.97  6.51  Mortgage-residential 5.81  5.77  5.84  5.82  5.99  Consumer 7.31  7.09  6.85  6.60  6.43  Secured with liquid collateral 6.78  6.36  5.89  5.38  4.89  Total retail loans 6.89  6.67  6.44  6.16  5.96  Total loans 7.75  7.45  7.11  6.70  6.32  Total earning assets 7.15  6.90  6.58  6.22  5.87    FUNDS USED TO SUPPORT EARNING ASSETS: Savings 0.42  0.39  0.32  0.30  0.28  Interest-bearing demand 1.10  1.04  1.02  0.95  0.90  Certificates under $100,000 3.87  3.51  3.27  2.96  2.64  Local certificates $100,000 and over 4.65  4.29  3.89  3.53  3.04  Core interest-bearing deposits 2.16  1.98  1.81  1.64  1.45  National certificates $100,000 and over 5.30  4.98  4.47  4.01  3.51  Total interest-bearing deposits 3.43  3.15  2.86  2.55  2.26    Federal funds purchased and securities sold under agreements to repurchase     4.98  4.67  4.19  3.80  3.37  U.S. Treasury demand 5.09  4.74  4.21  4.22  3.41  Total short-term borrowings 4.98  4.67  4.20  3.80  3.37  Long-term debt 6.85  6.69  6.26  6.01  5.39  Total interest-bearing liabilities 3.78  3.52  3.20  2.89  2.58  Total funds used to support earning assets 3.32  3.10  2.81  2.48  2.21  Net interest margin (tax-equivalent basis) 3.83  3.80  3.77  3.74  3.66    Year to date net interest margin 3.80  3.79  3.77  3.71  3.65    Prime rate 8.25  7.90  7.43  6.97  6.42    Tax-equivalent net interest income (in millions) $ 94.1  $ 91.5  $ 88.3  $ 88.5  $ 84.7    Average earning assets 9,645.1  9,512.6  9,341.7  9,292.1  9,111.3    Average rates are calculated using average balances based on historical cost and do not reflect market valuation adjustments. WILMINGTON TRUST CORPORATION QUARTERLY SUMMARY As of and for the nine months ended September 30, 2006   SUPPLEMENTAL INFORMATION   Three Months Ended % Change From:   Sept. 30, June 30, Mar. 31, Dec. 31, Sept. 30, Prior Prior     2006    2006    2006    2005    2005  Quarter Year NET INCOME Net income per share Basic $ 0.08  $ 0.69  $ 0.65  $ 0.69  $ 0.63  (88.4) (87.3) Diluted 0.07  0.67  0.64  0.67  0.62  (89.6) (88.7) Weighted average shares outstanding (in thousands) Basic 68,647  68,475  68,070  67,861  67,788  Diluted 69,933  69,776  69,434  68,956  68,699  Net income as a percentage of: Average assets 0.20% 1.81% 1.76% 1.82% 1.70% Average stockholders' equity 1.91  17.75  17.42  18.77  17.65    ASSETS UNDER MANAGEMENT * (in billions) Wilmington Trust $ 27.2  $ 26.4  $ 27.2  $ 26.0  $ 26.3  3.0  3.4  Roxbury Capital Management 3.1  3.3  3.5  3.3  3.2  (6.1) (3.1) Cramer Rosenthal McGlynn   9.8    9.4    9.7    8.9    8.5  4.3  15.3  Combined assets under management $ 40.1  $ 39.1  $ 40.4  $ 38.2  $ 38.0  2.6  5.5    * Assets under management include estimates for values associated with certain assets that lack readily ascertainable values, such as limited partnership interests.   ASSETS UNDER ADMINISTRATION ** (in billions) Wilmington Trust $ 100.5  $ 100.7  $ 102.1  $ 100.9  $ 96.9  (0.2) 3.7    ** Includes Wilmington Trust assets under management   FULL-TIME EQUIVALENT HEADCOUNT Full-time equivalent headcount 2,520  2,515  2,475  2,469  2,439    CAPITAL (in millions, except per share amounts) Average stockholders' equity $ 1,081.7  $ 1,060.0  $ 1,026.4  $ 983.0  $ 962.2  2.0  12.4  Period-end primary capital 1,157.9  1,161.2  1,136.9  1,109.1  1,066.1  (0.3) 8.6  Per share: Book value 15.55  15.54  15.30  14.99  14.34  0.1  8.4  Quarterly dividends declared 0.315  0.315  0.30  0.30  0.30  ----  5.0  Year-to-date dividends declared 0.93  0.615  0.30  1.185  0.885  Average stockholders' equity to assets 10.28% 10.23% 10.09% 9.69% 9.66% Total risk-based capital ratio 12.28  11.80  12.21  12.02  12.14  Tier 1 risk-based capital ratio 8.26  7.74  7.77  7.54  7.38  Tier 1 leverage capital ratio 7.34  6.98  6.94  6.74  6.34    CREDIT QUALITY (in millions) Period-end reserve for loan losses $ 93.6  $ 94.3  $ 93.6  $ 91.4  $ 93.4  Period-end non-performing assets: Nonaccrual 32.0  29.5  35.5  39.3  49.9  OREO 4.8  4.8  0.2  0.2  0.2  Renegotiated loans ----  9.9  4.9  4.7  4.8  Period-end past due 90 days 7.7  4.7  10.1  4.1  14.9    Gross charge-offs 8.6  5.7  3.2  7.8  3.1  Recoveries 1.3  2.2  1.4  3.8  1.2  Net charge-offs 7.3  3.5  1.8  4.0  1.9  Year-to-date net charge-offs 12.6  5.3  1.8  10.1  6.1    Ratios: Period-end reserve to loans 1.20% 1.22% 1.24% 1.24% 1.28% Period-end non-performing assets to loans 0.47  0.57  0.54  0.60  0.75  Period-end loans past due 90 days to total loans 0.10  0.06  0.13  0.06  0.20  Net charge-offs to average loans 0.09  0.05  0.02  0.05  0.03      INTERNAL RISK RATING Pass 97.41% 97.28% 97.20% 97.24% 96.96% Watchlisted 1.73  1.89  1.97  1.96  2.00  Substandard 0.86  0.76  0.76  0.73  0.82  Doubtful ----  0.07  0.07  0.07  0.22  WILMINGTON TRUST CORPORATION QUARTERLY SUMMARY As of and for the nine months ended September 30, 2006   QUARTERLY BUSINESS SEGMENT REPORT   Three Months Ended   Sept. 30, June 30, Mar. 31, Dec. 31, Sept. 30, (in millions)   2006    2006    2006    2005    2005  REGIONAL BANKING Net interest income $ 85.7  $ 83.9  $ 80.9  $ 80.1  $ 77.4  Provision for loan losses (6.7) (3.7) (3.8) (1.9) (2.7) Noninterest income 13.1  13.1  12.1  12.5  14.1  Noninterest expense   39.9    38.4    39.1    39.5    39.6  Income before taxes & minority interest 52.2  54.9  50.1  51.2  49.2    Regional Banking efficiency ratio 40.02% 39.22% 41.64% 42.29% 42.86%   WEALTH ADVISORY SERVICES Net interest income $ 6.4  $ 6.3  $ 6.5  $ 6.6  $ 6.2  Provision for loan losses 0.1  (0.5) (0.2) (0.1) (0.2) Noninterest income 43.6  44.5  43.4  39.7  40.7  Noninterest expense   38.9    40.6    38.5    36.7    35.5  Income before taxes & minority interest 11.2  9.7  11.2  9.5  11.2    Wealth Advisory Services efficiency ratio 77.64% 79.76% 77.00% 79.09% 75.53%   CORPORATE CLIENT SERVICES Net interest income $ 4.4  $ 3.4  $ 2.9  $ 3.6  $ 2.6  Provision for loan losses ----  ----  ----  ----  ----  Noninterest income 23.5  23.1  22.5  22.9  21.4  Noninterest expense   19.8    19.3    19.9    18.3    18.4  Income before taxes & minority interest 8.1  7.2  5.5  8.2  5.6    Corporate Client Services efficiency ratio 70.71% 72.56% 78.35% 68.80% 76.67%   AFFILIATE MANAGERS * Net interest income $ (3.5) $ (3.2) $ (3.0) $ (2.8) $ (2.5) Provision for loan losses ----  ----  ----  ----  ----  Noninterest income 4.4  5.6  4.7  4.7  3.5  Noninterest expense   72.3    ----    ----    ----    ----  Income before taxes & minority interest (71.4) 2.4  1.7  1.9  1.0    TOTAL WILMINGTON TRUST CORPORATION Net interest income $ 93.0  $ 90.4  $ 87.3  $ 87.5  $ 83.7  Provision for loan losses (6.6) (4.2) (4.0) (2.0) (2.9) Noninterest income 84.6  86.3  82.7  79.8  79.7  Noninterest expense   170.9    98.3    97.5    94.5    93.5  Income before taxes & minority interest $ 0.1  $ 74.2  $ 68.5  $ 70.8  $ 67.0    Corporation efficiency ratio 95.64% 55.29% 57.02% 56.15% 56.87%   * Affiliate managers comprise Cramer Rosenthal McGlynn and Roxbury Capital Management.   Segment data for prior periods may differ from previously published figures due to changes in reporting methodology and/or organizational structure as well as the adjustment for the adoption of stock-based compensation. WILMINGTON TRUST CORPORATION QUARTERLY SUMMARY As of and for the nine months ended September 30, 2006   YEAR-TO-DATE BUSINESS SEGMENT REPORT   Nine Months Ended   Sept. 30, Sept. 30, $ % (in millions)   2006    2005    Change Change REGIONAL BANKING Net interest income $ 250.5  $ 223.3  $ 27.2  12.2% Provision for loan losses (14.1) (9.3) 4.8  51.6  Noninterest income 38.3  38.6  (0.3) (0.8) Noninterest expense   117.4    112.7    4.7  4.2  Income before taxes & minority interest 157.3  139.9  17.4  12.4    Regional Banking efficiency ratio 40.25% 42.61%   WEALTH ADVISORY SERVICES Net interest income $ 19.1  $ 17.3  $ 1.8  10.4% Provision for loan losses (0.7) (0.5) 0.2  40.0  Noninterest income 131.6  121.1  10.5  8.7  Noninterest expense   117.9    107.9    10.0  9.3  Income before taxes & minority interest 32.1  30.0  2.1  7.0    Wealth Advisory Services efficiency ratio 78.13% 77.85%   CORPORATE CLIENT SERVICES Net interest income $ 10.7  $ 7.8  $ 2.9  37.2% Provision for loan losses ----  ----  ----  ----  Noninterest income 69.2  61.7  7.5  12.2  Noninterest expense   59.0    55.0    4.0  7.3  Income before taxes & minority interest 20.9  14.5  6.4  44.1    Corporate Client Services efficiency ratio 73.75% 79.02%   AFFILIATE MANAGERS * Net interest income $ (9.6) $ (7.0) $ (2.6) (37.1)% Provision for loan losses ----  ----  ----  ----  Noninterest income 14.5  12.1  2.4  19.8  Noninterest expense   72.5    ----    72.5  ----  Income before taxes & minority interest (67.6) 5.1  (72.7) ----    TOTAL WILMINGTON TRUST CORPORATION Net interest income $ 270.7  $ 241.4  $ 29.3  12.1% Provision for loan losses (14.8) (9.8) 5.0  51.0  Noninterest income 253.6  233.5  20.1  8.6  Noninterest expense   366.8    275.6    91.2  33.1  Income before taxes & minority interest $ 142.7  $ 189.5  $ (46.8) (24.7)%   Corporation efficiency ratio 69.54% 57.68%   * Affiliate managers comprise Cramer Rosenthal McGlynn and Roxbury Capital Management.   Segment data for prior periods may differ from previously published figures due to changes in reporting methodology and/or organizational structure as well as the adjustment for the adoption of stock-based compensation. Wilmington Trust Corporation (NYSE:WL) reported today that net income for the 2006 third quarter was $5.2 million and earnings per share (on a diluted basis) were $0.07 per share. The company recorded a non-cash charge of $72.3 million during the quarter against its valuation of affiliate money manager Roxbury Capital Management (RCM). This non-cash charge reduced operating net income by $41.7 million and reduced earnings per share (on a diluted basis) by $0.60 per share. Absent the non-cash charge, operating net income for the 2006 third quarter would have been $46.9 million and earnings per share (on a diluted basis) would have been $0.67 per share. These amounts would have been increases of 10% and 8%, respectively, from the year-ago third quarter. During the 2006 third quarter, RCM terminated its micro-cap fund and decided to exit its fixed income fund by the end of 2006. These actions caused Wilmington Trust management to reassess the carrying value (the value assigned to the asset) of its ownership position in RCM. On October 17, 2006, management determined that the carrying value of RCM had declined by $72.3 million as of September 30, 2006, and that the decline was other than temporary. The $72.3 million decline in carrying value was recorded on the income statement as a non-cash impairment charge for the 2006 third quarter. The impairment charge was a non-cash item because Wilmington Trust records the majority of RCM's carrying value on its balance sheet as goodwill (a non-cash item). At June 30, 2006, the amount of goodwill associated with RCM was $131.3 million. As of September 30, 2006, following the non-cash charge, the amount of goodwill recorded for RCM was $59.0 million. Wilmington Trust's valuation of RCM is based in large part on its ownership interest in the money manager, which consists of 41.23% of RCM's common shares and a 30% preferred ownership interest. Wilmington Trust's ownership interest in RCM has not changed since the fourth quarter of 2003, and the company said no changes were planned. Ted T. Cecala, Wilmington Trust's chairman and chief executive officer, and David R. Gibson, Wilmington Trust's chief financial officer, remain members of RCM's board of managers. "Roxbury is a profitable growth-style manager. The firm is incubating new products and it has been acquiring other investment managers," Cecala said. "We have high regard for Roxbury's 'boutique among boutiques' market positioning, we have a positive outlook for the firm, and we look forward to maintaining our relationship with the Roxbury team." In addition to reducing net income and earnings per share, the non-cash charge increased noninterest expense, reduced income tax expense, and reduced the returns on average assets and equity. This report includes comparable amounts that exclude the non-cash charge in cases where management believes doing so provides investors with more relevant information about business trends and the company's continuing operations. "Absent the non-cash charge, our third quarter results were positive and each of our three businesses recorded good growth," Cecala said. "Net interest income rose 11%, the net interest margin increased, advisory revenue was 10% higher, and expense growth, excluding the non-cash charge, was less than 6%." For the 2006 third quarter: -- Total loan balances were $7.76 billion, on average, up 9% from the year-ago third quarter. -- On average, commercial loan balances rose 11% and consumer loan balances rose 7% year over year. -- Balance sheet assets surpassed $10.5 billion for the first time on an average balance basis. -- Net interest income, before the provision for loan losses, was 11% more than for third quarter last year. -- The net interest margin was 3.83%, up 3 basis points on a linked-quarter basis, and 17 basis points year over year. -- Wealth Advisory revenue rose 8%; Corporate Client revenue increased 11%; and revenue from affiliate money manager Cramer Rosenthal McGlynn was 35% higher than for the year-ago third quarter. -- The percentage of loans with pass ratings in the internal risk rating analysis continued to exceed 97%. Credit quality trends remained positive overall, but one commercial loan charge-off during the third quarter increased net charge-offs and the net charge-off ratio, and led to an increase in the provision for loan losses. More details on this are in the credit quality section of this report. On an annualized basis, third quarter 2006 results produced a return on average assets of 0.20% and a return on average equity of 1.91%. Excluding the non-cash charge for RCM, the return on average assets would have been 1.77% and the return on average equity would have been 17.23%. The corresponding returns for the third quarter of 2005 were 1.70% and 17.65%, respectively. CASH DIVIDEND DECLARED On October 19, 2006, the Board of Directors declared a regular quarterly cash dividend of $0.315 per share. The quarterly dividend will be paid on November 15, 2006, to shareholders of record on November 1, 2006. EFFICIENCY RATIO The efficiency ratio is a measure of profitability that reflects how much a company spends to generate revenue. Low efficiency ratios are desirable because they indicate high profitability. The non-cash charge, all of which was attributed to the Affiliate Managers business segment, reduced the company's efficiency ratio for the 2006 third quarter. There is more information about business line profitability in the sections on each business and in the financial reports by business segment in this report. -0- *T Efficiency ratios 2006 Q3 2006 Q2 2005 Q3 ---------------------------------------------------------------------- Regional Banking 40.02% 39.22% 42.86% ---------------------------------------------------------------------- Wealth Advisory Services 77.64% 79.76% 75.53% ---------------------------------------------------------------------- Corporate Client Services 70.71% 72.56% 76.67% ---------------------------------------------------------------------- Wilmington Trust consolidated 95.64% 55.29% 56.87% ---------------------------------------------------------------------- Wilmington Trust consolidated absent non-cash charge 55.18% -- -- ---------------------------------------------------------------------- *T Excluding the non-cash charge, the table above shows that Wilmington Trust spent slightly more than 55 cents for each dollar of revenue recorded for the 2006 third quarter, and that the cost was lower than for prior periods. The efficiency ratio improved from its year-ago level mainly because pre-tax income was higher from the Regional Banking and Corporate Client Services business. The linked-quarter improvement was due to higher levels of pre-tax income from Wealth Advisory Services and Corporate Client Services, as expansion investments and the provision for loan losses reduced pre-tax income from the Regional Banking business. INVESTMENT SECURITIES PORTFOLIO Investment securities portfolio balances for the 2006 third quarter were $1.86 billion, on average. On a percentage basis, the composition of the portfolio was relatively unchanged from prior periods. As of September 30, 2006, approximately 80% of the portfolio was invested in fixed rate instruments. -0- *T Investment securities portfolio 2006 Q3 2006 Q2 2005 Q3 ---------------------------------------------------------------------- Average life (in years) 5.39 6.00 6.21 ---------------------------------------------------------------------- Duration 2.39 2.78 2.74 ---------------------------------------------------------------------- *T The average life and duration declined because the company purchased shorter-term U.S. Treasury and government agency securities during the 2006 third quarter and because the downward shift in the yield curve caused prepayments to increase. THE REGIONAL BANKING BUSINESS The Delaware Valley region's economy remained well diversified and economic indicators remained positive. According to the Federal Reserve Bank of Philadelphia, economic activity over the past 12 months (as of August 2006, the most recent data available) increased in Delaware and was stable in Pennsylvania and New Jersey. According to the Federal Deposit Insurance Corporation, job growth in Delaware continued to outpace the national rate, with job losses from consolidation in the financial sector offset by gains in the professional, business, health, and government sectors. According to the U.S. Department of Labor, Delaware's unemployment rate for August 2006 was 3.7%. In comparison, the U.S. rate was 4.7%. Against this backdrop, loan balances rose for the 22nd consecutive quarter and were $7.76 billion, on average. This was 9% higher than for the year-ago third quarter, and 1% higher than for the 2006 second quarter. Commercial real estate/construction loans, consumer loans, and residential mortgage loans accounted for most of the growth. -0- *T Loans 2006 Q3 2006 Q2 2005 Q3 ---------------------------------------------------------------------- Total loans outstanding (in billions, on average) $7.76 $7.68 $7.13 ---------------------------------------------------------------------- ---------------------------------------------------------------------- Delaware market loans (in billions, on average) $5.78 $5.73 $5.37 ---------------------------------------------------------------------- Delaware market loans as a % of total loans 74% 75% 75% ---------------------------------------------------------------------- ---------------------------------------------------------------------- Pennsylvania market loans (in billions, on average) $1.74 $1.72 $1.56 ---------------------------------------------------------------------- Pennsylvania market loans as a % of total loans 22% 22% 22% ---------------------------------------------------------------------- ---------------------------------------------------------------------- Other market loans as a % of total loans 4% 3% 3% ---------------------------------------------------------------------- *T Commercial loans Commercial loan balances were $5.23 billion, on average, for the 2006 third quarter. This was 11% higher than for the year-ago third quarter, and 1% higher than for the 2006 second quarter. Almost all of the year-over-year and linked-quarter growth was in commercial real estate/construction (CRE) loans. -0- *T Commercial loans (in millions, on 2006 Q3 2006 Q2 2005 Q3 average) ---------------------------------------------------------------------- Commercial, industrial, and agricultural loans $2,407.7 $2,463.5 $2,449.2 ---------------------------------------------------------------------- Commercial real estate/construction loans 1,588.7 1,517.5 1,022.9 ---------------------------------------------------------------------- Commercial mortgage loans 1,238.5 1,212.8 1,232.8 ---------------------------------------------------------------------- Total commercial loans $5,234.9 $5,193.8 $4,704.9 ---------------------------------------------------------------------- ---------------------------------------------------------------------- % of commercial loans from Delaware market 70% 70% 70% ---------------------------------------------------------------------- % of commercial loans from Pennsylvania market 29% 29% 29% ---------------------------------------------------------------------- % of commercial loans from other markets 1% 1% 1% ---------------------------------------------------------------------- *T CRE loan balances, on average, increased 55% from the year-ago third quarter, mainly because population growth and high demand for housing continued in Delaware. The Delaware market accounted for approximately 69% of the year-over-year CRE loan growth and the Pennsylvania market accounted for approximately 18%. Residential housing development loans accounted for approximately 72% of the year-over-year CRE loan growth. According to the University of Delaware's Center for Applied Demography, Delaware had a net gain in population between July 2004 and July 2005 (the most recent data available). The Center reported that Delaware's new residents include retirees attracted by the state's relatively low property taxes and lack of a sales tax, as well as working-age people from New Jersey and Pennsylvania who are willing to trade longer commuting time for lower housing prices. Mayflower Transit's 2006 relocation report ranked Delaware as the second most popular relocation destination in the United States. On a linked-quarter basis, the pace of CRE loan growth slowed to 5%, and the new loans were split fairly evenly between the Delaware and Pennsylvania markets. Residential housing development accounted for almost all of the linked-quarter increase. The change in the pace of CRE loan growth reflected a return to more normal market conditions. In September, several housing industry groups, including the National Association of Realtors, Moody's Economy.com, and multiple listing service Trend, predicted any housing downturn in Delaware would be short-lived and less severe than elsewhere in the United States. For the first eight months of 2006, median sale prices for single-family homes in Delaware rose between 6% and 12%, depending on location. Retail loans Retail loans (consumer loans, residential mortgage loans, and loans secured with liquid collateral) for the 2006 third quarter were $2.52 billion, on average. This was 4% higher than for the year-ago third quarter, and 2% higher than for the 2006 second quarter. Consumer loan and residential mortgage loan balances accounted for the growth. Balances of loans secured with liquid collateral declined due to lower demand from Wealth Advisory clients. More than half of total retail loan balances for the 2006 third quarter were consumer loans. Consumer loan balances, on average, were 7% higher than for the year-ago third quarter and 2% higher on a linked-quarter basis. -0- *T Consumer loans (in millions, on average) 2006 Q3 2006 Q2 2005 Q3 ---------------------------------------------------------------------- Home equity lines of credit $319.4 $324.3 $330.6 ---------------------------------------------------------------------- Indirect loans 657.3 648.4 615.1 ---------------------------------------------------------------------- Credit card loans 75.1 74.2 71.7 ---------------------------------------------------------------------- Other consumer loans 418.7 394.7 352.3 ---------------------------------------------------------------------- Total consumer loans $1,470.5 $1,441.6 $1,369.7 ---------------------------------------------------------------------- ---------------------------------------------------------------------- % of consumer loans from Delaware market 88% 88% 88% ---------------------------------------------------------------------- % of consumer loans from Pennsylvania market 7% 6% 6% ---------------------------------------------------------------------- % of consumer loans from other markets 5% 6% 6% ---------------------------------------------------------------------- *T The category of consumer loans recorded as "other consumer loans" accounted for the majority of the growth in consumer loan balances. This category comprises a variety of installment loans to individuals, most of which are fixed rate loans, and includes home equity loans. Home equity loan balances increased, while home equity lines of credit decreased, as client demand for fixed rate products increased. Indirect loans, the majority of which are for late-model used cars, also contributed to the increase in consumer loan balances. The percentage of indirect loans from the New Jersey and Pennsylvania markets increased substantially from their year-ago volumes, reflecting the company's expansion in those areas. In the residential mortgage portfolio, balances rose but origination volumes declined, in large part because: -- Although the company sells most new fixed rate residential mortgage production into the secondary market, mortgages that qualify as low income mortgages for Community Reinvestment Act (CRA) purposes are retained in the portfolio. CRA loans originated during the 2006 third quarter were nearly twice as high as the year-ago third quarter volumes. -- The average loan amount originated was 12% higher for the 2006 third quarter than for the year-ago third quarter. -- The pace of refinancings and paydowns slowed. -- Seasonal cyclicality causes the number of loans originated to fluctuate from period to period. -0- *T Residential mortgages 2006 Q3 2006 Q2 2005 Q3 ---------------------------------------------------------------------- Balances (in millions, on average) $507.8 $484.2 $443.8 ---------------------------------------------------------------------- Origination volumes (in millions) $58.6 $67.7 $70.1 ---------------------------------------------------------------------- Origination units 239 288 321 ---------------------------------------------------------------------- *T At September 30, 2006, approximately 74% of the residential mortgage portfolio consisted of fixed rate mortgages, unchanged from September 30, 2005, and June 30, 2006. Core deposits Core deposits (deposits from clients) for the 2006 third quarter were $4.95 billion, on average, up 2% from the year-ago third quarter and up slightly from the 2006 second quarter. Certificate of deposit (CD) and interest bearing demand deposit balances rose, but these increases were offset by a decline in noninterest bearing demand deposit balances. The majority of core deposits continued to come from Delaware clients. -0- *T Total core deposits (on average) 2006 Q3 2006 Q2 2005 Q3 ---------------------------------------------------------------------- From Delaware clients 94% 94% 94% ---------------------------------------------------------------------- From Pennsylvania clients 5% 5% 5% ---------------------------------------------------------------------- From other markets 1% 1% 1% ---------------------------------------------------------------------- *T In December 2005, the company began to shift, or sweep, portions of commercial noninterest bearing demand deposits into money market deposits. This practice lowers deposit reserve requirements mandated by the Federal Reserve, and ultimately reduces the company's borrowing costs and uninvested cash balances. These sweeps accounted for approximately $185 million of the $279 million year-over-year decline in noninterest bearing demand deposits. CDs in amounts under $100,000 were 20% higher on a year-over-year basis, and local CDs in amounts of $100,000 and more were 34% higher. Since local CDs are client deposits, they are recorded as core deposits, not brokered deposits. Commercial banking clients in the Delaware Valley and local municipalities, which frequently use these CDs to generate returns on their excess cash, account for the majority of local CD balances. -0- *T Local CDs greater than or equal to $100,000 by client category 2006 Q3 2006 Q2 2005 Q3 ---------------------------------------------------------------------- Consumer banking clients 73% 74% 66% ---------------------------------------------------------------------- DE commercial banking clients 10% 12% 11% ---------------------------------------------------------------------- PA commercial banking clients 10% 7% 6% ---------------------------------------------------------------------- Wealth Advisory Services clients 7% 7% 16% ---------------------------------------------------------------------- Corporate Client Services clients -- -- 1% ---------------------------------------------------------------------- *T Deposits recorded as national CDs of $100,000 or more (national CDs) are brokered deposits, not client deposits. Since the company gathers deposits mainly in Delaware, but makes loans in four states, national CDs are a cost-effective way to fund loan growth without incurring the expense of building and operating a large-scale branch office network outside Delaware. Credit quality The percentage of loans outstanding with pass ratings from the internal risk rating analysis exceeded 97% for the fourth consecutive quarter, and was higher year-over-year and on a linked-quarter basis. While credit quality trends remained positive overall, net charge-offs and the net charge-off ratio were higher than in prior quarters, primarily because of one loan that was charged-off during the 2006 third quarter. This loan, which was to a Delaware Valley-based client in the dining and entertainment industry, had been recorded in renegotiated loans since the fourth quarter of 2004. As a result of this charge-off, the percentage of loans rated doubtful in the internal risk rating analysis dropped to zero. Renegotiated loans also fell to zero, because this loan was charged off, and the other loan in the category was repaid in July 2006. The net charge-off ratio for the 2006 third quarter was 9 basis points. This brought the net charge-off ratio on an annualized basis to 22 basis points, still below historical levels. Between 1995 and 2005, the annual net charge-off ratio ranged from 24 to 44 basis points. Nonaccruing loans and loans past due 90 days or more were considerably lower than for the year-ago third quarter, but were higher on a linked-quarter basis. Fewer than 10 loans, most of which were commercial loans, accounted for the changes. None of the loans classified as nonaccruing or past due 90 days during the 2006 third quarter were real-estate related. The amount recorded as other real estate owned (OREO) consists of an agricultural parcel in New Jersey. While OREO was higher year-over-year, the amount was unchanged from the 2006 second quarter. The 2006 third quarter provision for loan losses was $6.6 million, compared with $2.9 million for the year-ago third quarter, and $4.2 million for the 2006 second quarter. The reserve for loan losses was $93.6 million at September 30, 2006, which was slightly higher year over year and slightly lower on a linked-quarter basis. The loan loss reserve ratio for the 2006 third quarter was 1.20%, compared with 1.28% for the year-ago third quarter, and 1.22% for the 2006 second quarter. Regional Banking profitability The provision for loan losses and higher expenses due to expansion activities offset increases in net interest income, causing a slight uptick in the efficiency ratio for the Regional Banking business. -0- *T Efficiency ratios 2006 Q3 2006 Q2 2005 Q3 ---------------------------------------------------------------------- Regional Banking 40.02% 39.22% 42.86% ---------------------------------------------------------------------- *T NET INTEREST MARGIN For the 2006 third quarter, assets continued to reprice faster than liabilities and deposit pricing pressure, other than for CDs, remained relatively modest. In addition, the third quarter was the first full quarter to reflect the effects of the increase in short-term interest rates that the Federal Reserve made on June 29, 2006. These factors contributed to the increase in the net interest margin, which, at 3.83%, was 17 basis points higher than for the year-ago third quarter, and 3 basis points higher than for the 2006 second quarter. -0- *T Net interest margin 2006 Q3 2006 Q2 2005 Q3 ---------------------------------------------------------------------- Net interest margin 3.83% 3.80% 3.66% ---------------------------------------------------------------------- *T -0- *T 9/30/06 vs. 9/30/06 vs. Basis point (bps) increases in yields/rates 6/30/06 9/30/05 ---------------------------------------------------------------------- Total earning assets 25 bps 128 bps ---------------------------------------------------------------------- Funds to support earning assets 22 bps 111 bps ---------------------------------------------------------------------- *T -0- *T 9/30/06 vs. 9/30/06 vs. Average balance increases 6/30/06 9/30/05 ---------------------------------------------------------------------- Total earning assets 1% 6% ---------------------------------------------------------------------- Funds to support earning assets 1% 6% ---------------------------------------------------------------------- *T The company's floating rate loan portfolio is matched closely with floating rate funding. This helps to minimize changes in the net interest margin due to changes in market interest rates. As of September 30, 2006: -- Approximately 75% of total loans outstanding were floating rate loans. -- Approximately 81% of floating rate loans were commercial loans, most of which reprice within 30 to 45 days of a rate change. -- The pricing on approximately 62% of commercial floating rate loans was tied to a prime lending rate of 8.25%. -- The pricing on approximately 34% of commercial floating rate loans was tied to the 30-day London Interbank Offered Rate (Libor) of 5.32%. -0- *T Commercial floating rate loans repricing National CDs Short-term in maturing borrowings maturing less than or equal to less than or less than or equal As of 30 days equal to 90 days to 90 days ---------------------------------------------------------------------- 9/30/06 93% 74% 98% ---------------------------------------------------------------------- 6/30/06 92% 59% 91% ---------------------------------------------------------------------- 9/30/05 92% 91% 90% ---------------------------------------------------------------------- *T Changes over the past 12 months in the percentage of national CDs maturing in 90 days or less reflected the flat yield curve. With little difference between 90-day rates and longer-term rates, the company opted to purchase the longer-term instruments. THE WEALTH ADVISORY SERVICES BUSINESS Wealth Advisory Services (WAS) revenue for the 2006 third quarter was $47.1 million. This was 8% higher than for the year-ago third quarter, and slightly more than for the 2006 second quarter. Strong growth in revenue from planning and other services, plus higher mutual fund revenue, accounted for the year-over-year increase. The linked-quarter increase came from mutual fund revenue. Most mutual fund fees are based on money market funds. Revenue from trust and investment advisory services was essentially unchanged from the prior-year and prior-quarter levels, as business development was offset by lackluster performance in the financial markets. As of September 30, 2006, approximately 48% of assets managed for WAS clients were invested in equities, and approximately 28% were invested in fixed income instruments. Although markets rallied in September, the timing occurred too late in the quarter to have much of an effect. Revenue from planning and other services for the 2006 third quarter was $8.8 million. This was 38% higher than for the year-ago third quarter, and down slightly from the 2006 second quarter. Planning revenue was affected mainly by activity at Grant Tani Barash & Altman (GTBA), the company's West Coast provider of business management and family office services. Since GTBA's fees are based on the amount of income its clients earn, revenue from GTBA can fluctuate up or down from period to period. Business development remained solid. Year-over-year sales increases were recorded by the California, Maryland, and Delaware markets. Sales attributed to Delaware include business from clients in other states whose accounts are located in Delaware in order to benefit from trust, tax, and legal advantages not available for trusts governed by the laws of other states. On a linked-quarter basis, sales increases were recorded by the California, Florida, Maryland, and Pennsylvania markets. Wealth Advisory Services profitability Pretax income from WAS for the 2006 third quarter was the same as for the year-ago third quarter, but expenses were higher year-over-year because of expansion activities, including the East Coast launch of the Wilmington Family Office practice and the opening of new offices in Pennsylvania and New Jersey. This led to a modest decline, year over year, in the efficiency ratio. On a linked-quarter basis, incentive and employment benefits expenses were lower, which improved the efficiency ratio. -0- *T Efficiency ratios 2006 Q3 2006 Q2 2005 Q3 ---------------------------------------------------------------------- Wealth Advisory Services 77.64% 79.76% 75.53% ---------------------------------------------------------------------- *T THE CORPORATE CLIENT SERVICES BUSINESS Corporate Client Services (CCS) revenue for the 2006 third quarter was $21.1 million. This was 10% more than for the year-ago third quarter, and slightly higher than for the 2006 second quarter. Fees from entity management, retirement services, and investment and cash management services rose on a year-over-year as well as a linked-quarter basis, but these increases were offset by flatness in capital markets revenue. Capital markets revenue for the 2006 third quarter was $8.2 million, down slightly from the year-ago and prior quarter levels. Weakness in U.S. demand for asset-backed securitizations continued to offset growth in defeasance services (transactions in which one type of collateral is exchanged for another) and insurance premium financing. Entity management revenue for the 2006 third quarter was $6.8 million, up 19% from the year-ago third quarter and 3% on a linked-quarter basis. Business development in Europe and the Cayman Islands accounted for most of the growth. In Europe, business activity reflected demand for independent directorships and administrative services, particularly for asset-backed securitizations in Ireland, England, and Greece. Corporate retirement services for the 2006 third quarter was $3.4 million, up 6% from the year-ago as well as linked quarter, mainly because clients added funds to their retirement plans. While most CCS fees are transaction-based, approximately 55% of retirement services fees are based on the valuation of retirement plan assets for which the company serves as custodian. CCS investment and cash management revenue for the 2006 third quarter was $2.7 million. This was 42% higher than for the year-ago third quarter, and 8% more than for the 2006 second quarter. These increases resulted from higher client demand and more proactive efforts to market these services. Approximately 30% of the 2006 third quarter investment/cash management revenue was tied to the valuations of domestic fixed income instruments, primarily asset-backed, U.S. Treasury, corporate, and other types of investment grade securities. The remainder was based on money market mutual fund balances. Corporate Client Services profitability On a year-over-year as well as linked-quarter basis, net interest and noninterest income growth outpaced expense growth, which caused the CCS efficiency ratio to improve. -0- *T Efficiency ratios 2006 Q3 2006 Q2 2005 Q3 ---------------------------------------------------------------------- Corporate Client Services 70.71% 72.56% 76.67% ---------------------------------------------------------------------- *T AFFILIATE MONEY MANAGERS Assets under management at value-style affiliate Cramer Rosenthal McGlynn (CRM) were $9.80 billion at September 30, 2006. This was an increase of $1.30 billion, or 15%, from the amount reported at the end of September 2005, and $392.5 million, or 4%, more than at June 30, 2006. Asset inflows, particularly in the mid-cap value product, and market appreciation accounted for the growth. Revenue from CRM for the 2006 third quarter was $4.6 million. This was 35% more than for the year-ago third quarter, and reflected the increase in managed assets. On a linked-quarter basis, revenue from CRM declined opposite the increase in managed assets, mainly because the revenue recorded for the 2006 second quarter included higher levels of hedge fund performance fees. -0- *T Affiliate managers (in millions) 2006 Q3 2006 Q2 2005 Q3 ---------------------------------------------------------------------- Managed assets at Cramer Rosenthal McGlynn $9,784.5 $9,392.0 $8,480.5 ---------------------------------------------------------------------- Revenue from Cramer Rosenthal McGlynn $4.6 $5.5 $3.4 ---------------------------------------------------------------------- ---------------------------------------------------------------------- Managed assets at Roxbury Capital Management $3,122.9 $3,253.3 $3,246.6 ---------------------------------------------------------------------- Revenue from Roxbury Capital Management -- $0.3 $0.3 ---------------------------------------------------------------------- *T Growth-style affiliate Roxbury Capital Management (RCM) terminated its micro-cap product during the 2006 third quarter, which reduced managed asset levels and revenue. In addition, costs associated with the fund termination caused expenses to be higher than usual. As a result, RCM's revenue contribution for the quarter was negative and a nominal loss was recorded. OTHER INCOME ITEMS Other noninterest income was lower on a year-over-year basis because the amount reported for the year-ago third quarter included approximately $2.0 million of gains from executive life insurance policies. On a linked-quarter basis, other noninterest income was lower mainly because the amount recorded for the 2006 second quarter included nonrecurring income of approximately $1.0 million from a gain on the sale of real estate. NONINTEREST EXPENSES Noninterest expenses for the 2006 third quarter were $170.9 million. The non-cash charge for RCM accounted for $72.3 million of this amount. Excluding the non-cash charge, noninterest expenses were $98.6 million. This was 6% more than for the year-ago third quarter, and $300,000 more than for the 2006 second quarter. Expansion initiatives and additions to staff were the primary reasons for the increases. In the past 12 months, the company has: -- Launched the Wilmington Family Office practice on the East Coast. -- Opened new offices in Pennsylvania, New Jersey, Connecticut, and Frankfurt, Germany. -- Expanded existing offices in Delaware, Pennsylvania, Maryland, and New York. -- Acquired PwC Corporate Services (Cayman). -- Invested in technology and added staff to expand services that support collateralized debt obligations. At September 30, 2006, there were 2,520 staff members. This was 81 more than at the end of the year-ago third quarter, and 5 more than at the end of the 2006 second quarter. Staffing-related costs continued to account for the majority of noninterest expenses, excluding the non-cash charge. -0- *T Staffing-related expenses (dollars in millions) 2006 Q3 2006 Q2 2005 Q3 ---------------------------------------------------------------------- Full-time equivalent staff members 2,520 2,515 2,439 ---------------------------------------------------------------------- Staffing-related expenses $59.8 $60.0 $56.3 ---------------------------------------------------------------------- *T Among staffing-related expenses, increased salary and wage expenses were offset by accruals for incentives and employment benefits expenses. Effective January 1, 2006, amounts reported for incentive and bonus expense were adjusted to reflect adoption of the retrospective method of accounting for stock-based compensation expense, in accordance with Statement of Financial Accounting Standards No. 123 (revised). Stock-based compensation expense is included in incentive and bonus expense. -0- *T Incentives and bonuses (in millions) 2006 Q3 2006 Q2 2006 Q1 2005 Q4 2005 Q3 ---------------------------------------------------------------------- Stock option expense $1.7 $1.4 $2.0 $1.8 $1.7 ---------------------------------------------------------------------- Total incentives and bonuses $8.9 $10.3 $10.3 $8.8 $9.3 ---------------------------------------------------------------------- *T CAPITAL RATIOS During a review of risk-based capital calculations, the company discovered that the total risk-based capital ratios reported as of December 31, 2005; March 31, 2006; and June 30, 2006, inadvertently included portions of subordinated long-term debt that should have been excluded due to their approaching maturity. The corrected ratios appear in the table below. The total risk-based capital ratio was the only capital ratio affected. All of the company's capital ratios remained well above the regulatory minimum to be considered a well capitalized institution. -0- *T Corrections At June 30, 2006 At March 31, 2006 At December 31, 2005 to the ---------------------------------------------------------- total risk-based capital Reported Corrected Reported Corrected Reported Corrected ratio ratio ratio ratio ratio ratio ratio ---------------------------------------------------------------------- Total risk- based capital 12.66% 11.80% 12.72% 12.21% 12.36% 12.02% ---------------------------------------------------------------------- *T -0- *T Adequately capitalized Well capitalized Regulatory minimums minimum minimum ---------------------------------------------------------------------- Total risk-based capital 8% 10% ---------------------------------------------------------------------- *T Capital ratios for the three months ended September 30, 2006, and the preceding four quarters are included in the supplemental information section of this release. SHARE REPURCHASES During the 2006 third quarter, the company spent $22.2 million to repurchase 504,515 of its shares. The average price per share was $44.08. This brought the total number of shares repurchased under the current 8-million-share program, which commenced in April 2002, to 1,350,077, leaving 6,649,923 shares available for repurchase. OUTLOOK FOR THE REMAINDER OF 2006 Commenting on the outlook for the remainder of 2006, Cecala said: -- "Our focus on building and strengthening client relationships, plus the expansion investments we have made, have generated strong momentum in each of our businesses for the first nine months of 2006. We expect that momentum to continue. -- "Economic indicators remain positive overall for the Delaware Valley region, which will benefit the Regional Banking business. -- "Population growth in Delaware continues to drive housing demand. The housing market has slowed somewhat, but the level of activity remains within what has been considered a historically normal range. Published reports indicate that Delaware's housing market is not expected to experience as sharp a decline as in other parts of the country. -- "Core deposit pricing tends to lag behind the Federal Open Market Committee interest rate changes. Absent any additional increases, we expect core deposit pricing to catch up, which will cause the net interest margin to decline modestly. -- "In terms of credit quality, more than 97% of our loans outstanding have pass ratings. We expect the full-year provision for loan losses to be in line with the levels we have seen over the past 10 years, which have ranged from $12 million to $22 million. -- "As the percentage of loans generated outside of the Delaware market continues to increase, we will continue to use national CDs to help fund earning asset growth - and to help us manage expense growth and interest rate risk. -- "In Wealth Advisory Services, we expect to see higher levels of planning revenue due to the expansion of our family office capabilities. The majority of Wealth Advisory revenue, however, is tied to financial market levels. We base trust and investment advisory fees on market levels as of the last business day of each month, so changes in revenue from these services may not correlate directly with changes in financial markets. -- "Business development continues to be solid in Corporate Client Services, especially in Europe and the Caribbean. To further grow this business, we are considering small acquisitions and looking for opportunities to develop new products. -- "Asset inflows continue at value-style affiliate Cramer Rosenthal McGlynn (CRM). Revenue from CRM will reflect financial market levels. -- "Growth-style affiliate Roxbury Capital Management (RCM) continues to be profitable. The changes RCM made during the third quarter should have a positive effect on the firm's continuing operations. -- "Expense growth will reflect the expansion investments we have made this year in each of our businesses, and should approximate 7% for the full year, plus the $72.3 million impairment expense." CONFERENCE CALL Management will discuss the 2006 third quarter results and outlook for the future in a conference call today at 10:00 a.m. (EDT). Supporting materials, financial statements, and audio streaming will be available at www.wilmingtontrust.com. To access the call from within the United States, dial (877) 258-8842 and enter PIN 7811598. From outside the United States, dial (973) 582-2839 and enter PIN 7811598. A rebroadcast of the call will be available from 12:30 p.m. (EDT) today until 5:00 p.m. (EDT) on Friday, October 27, 2006, by calling (877) 519-4471 inside the United States or (973) 341-3080 from outside the United States. Use PIN 7811598 to access the rebroadcast. FORWARD-LOOKING STATEMENTS This presentation contains forward-looking statements that reflect our current expectations about our future performance. These statements rely on a number of assumptions and estimates and are subject to various risks and uncertainties that could cause our actual results to differ from our expectations. Factors that could affect our future financial results include, among other things, changes in national or regional economic conditions; changes in market interest rates; significant changes in banking laws or regulations; increased competition in our businesses; higher-than-expected credit losses; the effects of acquisitions; the effects of integrating acquired entities; a substantial and permanent loss of either client accounts and/or assets under management at Wilmington Trust and/or our affiliate money managers, Cramer Rosenthal McGlynn and Roxbury Capital Management; unanticipated changes in regulatory, judicial, or legislative tax treatment of business transactions; and economic uncertainty created by unrest in other parts of the world. ABOUT WILMINGTON TRUST Wilmington Trust Corporation (NYSE:WL) is a financial services holding company that provides Regional Banking services throughout the Delaware Valley region, Wealth Advisory Services for high-net-worth clients in 22 countries, and Corporate Client Services for institutional clients in 81 countries. Its wholly owned bank subsidiary, Wilmington Trust Company, which was founded in 1903, is one of the largest personal trust providers in the United States and the leading retail and commercial bank in Delaware. Wilmington Trust Corporation and its affiliates have offices in California, Connecticut, Delaware, Florida, Georgia, Maryland, Nevada, New Jersey, New York, Pennsylvania, South Carolina, Vermont, the Cayman Islands, the Channel Islands, London, Dublin, and Frankfurt. For more information, visit www.wilmingtontrust.com. -0- *T WILMINGTON TRUST CORPORATION QUARTERLY SUMMARY As of and for the nine months ended September 30, 2006 HIGHLIGHTS Three Months Ended Nine Months Ended --------------------------- -------------------------- Sept. 30, Sept. 30, % Sept. 30, Sept. 30, % 2006 2005 Change 2006 2005 Change ---------------------------------------------------------------------- OPERATING RESULTS (in millions) Net interest income $ 93.0 $ 83.7 11.1 $ 270.7 $ 241.4 12.1 Provision for loan losses (6.6) (2.9) 127.6 (14.8) (9.8) 51.0 Noninterest income 84.6 79.7 6.1 253.6 233.5 8.6 Noninterest expense 170.9 93.5 82.8 366.8 275.6 33.1 Net income 5.2 42.8 (87.9) 96.3 120.5 (20.1) PER SHARE DATA Basic net income $ 0.08 $ 0.63 (87.3)$ 1.41 $ 1.78 (20.8) Diluted net income 0.07 0.62 (88.7) 1.38 1.76 (21.6) Dividends paid 0.315 0.30 5.0 0.93 0.885 5.1 Book value at period end 15.55 14.34 8.4 15.55 14.34 8.4 Closing price at period end 44.55 36.45 22.2 44.55 36.45 22.2 Market range: High 45.61 39.36 15.9 45.61 39.36 15.9 Low 40.52 35.35 14.6 38.54 33.01 16.8 AVERAGE SHARES OUTSTANDING (in thousands) Basic 68,647 67,788 1.3 68,399 67,630 1.1 Diluted 69,933 68,699 1.8 69,716 68,440 1.9 AVERAGE BALANCE SHEET (in millions) Investment portfolio $ 1,857.0 $ 1,930.0 (3.8)$ 1,851.2 $ 1,866.3 (0.8) Loans 7,759.3 7,128.4 8.9 7,628.0 6,946.8 9.8 Earning assets 9,645.1 9,111.3 5.9 9,501.0 8,844.6 7.4 Core deposits 4,950.0 4,853.0 2.0 4,912.6 4,817.4 2.0 Stockholders' equity 1,081.7 962.2 12.4 1,056.3 937.9 12.6 STATISTICS AND RATIOS (net income annualized) Return on average stockholders' equity 1.91% 17.65% (89.2) 12.19% 17.18% (29.0) Return on average assets 0.20% 1.70% (88.2) 1.24% 1.66% (25.3) Net interest margin (taxable equivalent) 3.83% 3.66% 4.6 3.80% 3.65% 4.1 Dividend payout ratio 415.38% 47.20% N/M 65.94% 49.63% 32.9 Full-time equivalent headcount 2,520 2,439 3.3 2,520 2,439 3.3 *T -0- *T Prior period numbers have been adjusted throughout this report for the retrospective adoption of stock-based compensation accounting. *T -0- *T WILMINGTON TRUST CORPORATION QUARTERLY SUMMARY As of and for the nine months ended September 30, 2006 QUARTERLY INCOME STATEMENT Three Months Ended ------------------------------------------------- % Change From: Sept. June Mar. Dec. Sept. -------------- 30, 30, 31, 31, 30, Prior Prior (in millions) 2006 2006 2006 2005 2005 Quarter Year ---------------------------------------------------------------------- NET INTEREST INCOME Interest income $175.0 $165.0 $152.8 $146.2 $134.9 6.1 29.7 Interest expense 82.0 74.6 65.5 58.7 51.2 9.9 60.2 -------------------------------------------------------- Net interest income 93.0 90.4 87.3 87.5 83.7 2.9 11.1 Provision for loan losses (6.6) (4.2) (4.0) (2.0) (2.9) 57.1 127.6 -------------------------------------------------------- Net interest income after provision for loan losses 86.4 86.2 83.3 85.5 80.8 0.2 6.9 ----------------------------------- NONINTEREST INCOME Advisory fees: Wealth Advisory Services Trust and investment advisory fees 33.0 33.1 34.3 31.1 32.7 (0.3) 0.9 Mutual fund fees 5.3 5.0 4.7 4.5 4.4 6.0 20.5 Planning and other services 8.8 8.9 7.3 7.1 6.4 (1.1) 37.5 -------------------------------------------------------- Total Wealth Advisory Services 47.1 47.0 46.3 42.7 43.5 0.2 8.3 ----------------------------------- Corporate Client Services Capital markets services 8.2 8.5 8.7 8.9 8.3 (3.5) (1.2) Entity management services 6.8 6.6 6.5 6.1 5.7 3.0 19.3 Retirement services 3.4 3.2 3.1 3.3 3.2 6.2 6.2 Investment / cash management services 2.7 2.5 2.1 2.3 1.9 8.0 42.1 -------------------------------------------------------- Total Corporate Client Services 21.1 20.8 20.4 20.6 19.1 1.4 10.5 ----------------------------------- Cramer Rosenthal McGlynn 4.6 5.5 4.0 4.3 3.4 (16.4) 35.3 Roxbury Capital Management ---- 0.3 0.9 0.6 0.3 (100.0)(100.0) -------------------------------------------------------- Advisory fees 72.8 73.6 71.6 68.2 66.3 (1.1) 9.8 Amortization of affiliate other intangibles (1.1) (1.0) (1.0) (1.0) (1.0) 10.0 10.0 -------------------------------------------------------- Advisory fees after amortization of affiliate other intangibles 71.7 72.6 70.6 67.2 65.3 (1.2) 9.8 ----------------------------------- Service charges on deposit accounts 7.3 7.0 6.9 7.3 7.4 4.3 (1.4) Other noninterest income 5.5 6.8 5.2 5.3 7.0 (19.1) (21.4) Securities gains/(losses) 0.1 (0.1) ---- ---- ---- ---- ---- -------------------------------------------------------- Total noninterest income 84.6 86.3 82.7 79.8 79.7 (2.0) 6.1 ----------------------------------- Net interest and noninterest income 171.0 172.5 166.0 165.3 160.5 (0.9) 6.5 ----------------------------------- NONINTEREST EXPENSE Salaries and wages 39.5 37.8 36.9 36.4 35.4 4.5 11.6 Incentives and bonuses 8.9 10.3 10.3 8.8 9.3 (13.6) (4.3) Employment benefits 11.4 11.9 13.5 11.5 11.6 (4.2) (1.7) Net occupancy 6.7 6.3 5.9 6.1 5.5 6.3 21.8 Furniture, equipment, and supplies 9.2 9.9 9.0 8.4 8.7 (7.1) 5.7 Other noninterest expense: Advertising and contributions 2.2 2.1 1.9 2.5 2.4 4.8 (8.3) Servicing and consulting fees 2.8 2.4 2.3 2.9 2.3 16.7 21.7 Subadvisor expense 2.7 2.9 2.8 2.5 2.7 (6.9) ---- Travel, entertainment, and training 2.5 2.3 2.2 2.6 2.6 8.7 (3.8) Originating and processing fees 2.8 2.4 2.8 2.8 2.8 16.7 ---- Other expense 9.9 10.0 9.9 10.0 10.2 (1.0) (2.9) -------------------------------------------------------- Total other noninterest expense 22.9 22.1 21.9 23.3 23.0 3.6 (0.4) ----------------------------------- Total noninterest expense before impairment 98.6 98.3 97.5 94.5 93.5 0.3 5.5 Impairment write- down 72.3 ---- ---- ---- ---- ---- ---- ----------------------------------- Total noninterest expense 170.9 98.3 97.5 94.5 93.5 73.9 82.8 ----------------------------------- Income before income taxes and minority interest 0.1 74.2 68.5 70.8 67.0 (99.9) (99.9) Applicable income taxes (5.0) 27.2 24.3 24.3 24.1 ---- ---- -------------------------------------------------------- Net income before minority interest 5.1 47.0 44.2 46.5 42.9 (89.1) (88.1) Minority interest (0.1) 0.1 0.1 ---- 0.1 ---- ---- -------------------------------------------------------- Net income $5.2 $46.9 $44.1 $46.5 $42.8 (88.9) (87.9) =================================== *T -0- *T WILMINGTON TRUST CORPORATION QUARTERLY SUMMARY As of and for the nine months ended September 30, 2006 YEAR-TO-DATE INCOME STATEMENT Nine Months Ended -------------------------------- Sept. 30, Sept. 30, % (in millions) 2006 2005 Change ---------------------------------------------------------------------- NET INTEREST INCOME Interest income $ 492.9 $ 370.4 33.1 Interest expense 222.2 129.0 72.2 ------------------------------------------------------------- Net interest income 270.7 241.4 12.1 Provision for loan losses (14.8) (9.8) 51.0 ------------------------------------------------------------- Net interest income after provision for loan losses 255.9 231.6 10.5 ----------------------- NONINTEREST INCOME Advisory fees: Wealth Advisory Services Trust and investment advisory fees 100.4 92.9 8.1 Mutual fund fees 15.0 13.2 13.6 Planning and other services 25.1 23.3 7.7 ------------------------------------------------------------- Total Wealth Advisory Services 140.5 129.4 8.6 ----------------------- Corporate Client Services Capital markets services 25.4 23.7 7.2 Entity management services 19.8 17.5 13.1 Retirement services 9.8 9.1 7.7 Investment / cash management services 7.3 5.4 35.2 ------------------------------------------------------------- Total Corporate Client Services 62.3 55.7 11.8 ----------------------- Cramer Rosenthal McGlynn 14.1 11.8 19.5 Roxbury Capital Management 1.1 0.8 37.5 ------------------------------------------------------------- Advisory fees 218.0 197.7 10.3 Amortization of affiliate other intangibles (3.1) (3.1) ---- ------------------------------------------------------------- Advisory fees after amortization of affiliate other intangibles 214.9 194.6 10.4 ----------------------- Service charges on deposit accounts 21.1 20.9 1.0 Other noninterest income 17.6 17.2 2.3 Securities gains ---- 0.8 (100.0) ------------------------------------------------------------- Total noninterest income 253.6 233.5 8.6 ----------------------- Net interest and noninterest income 509.5 465.1 9.5 ----------------------- NONINTEREST EXPENSE Salaries and wages 114.1 103.3 10.5 Incentives and bonuses 29.5 29.1 1.4 Employment benefits 36.8 35.8 2.8 Net occupancy 19.0 16.3 16.6 Furniture, equipment, and supplies 28.2 26.3 7.2 Other noninterest expense: Advertising and contributions 6.2 6.6 (6.1) Servicing and consulting fees 7.5 7.3 2.7 Subadvisor expense 8.4 6.9 21.7 Travel, entertainment, and training 7.0 6.2 12.9 Originating and processing fees 8.0 7.7 3.9 Other expense 29.8 30.1 (1.0) ------------------------------------------------------------- Total other noninterest expense 66.9 64.8 3.2 ----------------------- Total noninterest expense before impairment 294.5 275.6 6.9 Impairment write-down 72.3 ---- ---- ----------------------- Total noninterest expense 366.8 275.6 33.1 ----------------------- Income before income taxes and minority interest 142.7 189.5 (24.7) Applicable income taxes 46.3 68.8 (32.7) ------------------------------------------------------------- Net income before minority interest 96.4 120.7 (20.1) Minority interest 0.1 0.2 (50.0) ------------------------------------------------------------- Net income $ 96.3 $ 120.5 (20.1) ======================= *T -0- *T WILMINGTON TRUST CORPORATION QUARTERLY SUMMARY As of and for the nine months ended September 30, 2006 COMPARISON OF RESULTS WITH AND WITHOUT THE IMPAIRMENT WRITE-DOWN Three months ended September 30, 2006 ----------------------------------- With Without impairment impairment Impairment ---------- ---------- ---------- OPERATING RESULTS (in millions) Net interest income $ 93.0 $ 93.0 $ ---- Provision for loan losses (6.6) (6.6) ---- Noninterest income 84.6 84.6 ---- Noninterest expense 170.9 98.6 72.3 ---------------------------------------------------------------------- Income before taxes and minority interest 0.1 72.4 (72.3) Applicable income taxes (5.0) 25.6 (30.6) ---------------------------------------------------------------------- Net income before minority interest 5.1 46.8 (41.7) Minority interest (0.1) (0.1) ---- ---------------------------------------------------------------------- Net income $ 5.2 $ 46.9 $ (41.7) =================================== PER SHARE DATA Diluted shares outstanding (in millions) 69.9 69.9 ---- Per-share earnings $ 0.07 $ 0.67 $ (0.60) STATISTICS AND RATIOS (dollars in millions) Total assets, on average $ 10,522.2 $ 10,523.0 $ (0.8) Stockholders' equity, on average 1,081.7 1,082.2 (0.5) Return on average assets 0.20% 1.77% (1.57)% Return on equity 1.91% 17.23% (15.32)% Net interest before provision and noninterest income $ 177.6 $ 177.6 $ ---- Tax equivalent interest income 1.1 1.1 ---- ---------------------------------------------------------------------- $ 178.7 $ 178.7 $ ---- Noninterest expense $ (170.9) $ (98.6) $ (72.3) ----------------------------------- Efficiency ratio 95.64% 55.18% 40.46% Nine months ended September 30, 2006 ----------------------------------- With Without impairment impairment Impairment ---------- ---------- ---------- OPERATING RESULTS (in millions) Net interest income $ 270.7 $ 270.7 $ ---- Provision for loan losses (14.8) (14.8) ---- Noninterest income 253.6 253.6 ---- Noninterest expense 366.8 294.5 72.3 ---------------------------------------------------------------------- Income before taxes and minority interest 142.7 215.0 (72.3) Applicable income taxes 46.3 76.9 (30.6) ---------------------------------------------------------------------- Net income before minority interest 96.4 138.1 (41.7) Minority interest 0.1 0.1 ---- ---------------------------------------------------------------------- Net income $ 96.3 $ 138.0 $ (41.7) =================================== PER SHARE DATA Diluted shares outstanding (in millions) 69.7 69.7 ---- Per-share earnings $ 1.38 $ 1.98 $ (0.60) STATISTICS AND RATIOS (dollars in millions) Total assets, on average $ 10,354.4 $ 10,354.6 $ (0.2) Stockholders' equity, on average 1,056.3 1,056.4 (0.1) Return on average assets 1.24% 1.78% (0.54)% Return on equity 12.19% 17.47% (5.28)% Net interest before provision and noninterest income $ 524.3 $ 524.3 $ ---- Tax equivalent interest income 3.2 3.2 ---- ---------------------------------------------------------------------- $ 527.5 $ 527.5 $ ---- Noninterest expense $ (366.8) $ (294.5) $ (72.3) ----------------------------------- Efficiency ratio 69.54% 55.83% 13.71% *T -0- *T WILMINGTON TRUST CORPORATION QUARTERLY SUMMARY As of and for the nine months ended September 30, 2006 STATEMENT OF CONDITION Sept. 30, June 30, Mar. 31, Dec. 31, Sept. 30, (in millions) 2006 2006 2006 2005 2005 ---------------------------------------------------------------------- ASSETS Cash and due from banks $ 268.4 $ 258.5 $ 219.2 $ 264.0 $ 286.8 ------------------------------------------------- Federal funds sold and securities purchased under agreements to resell 38.4 66.7 44.9 14.3 64.0 ------------------------------------------------- Investment securities: U.S. Treasury 230.8 181.4 136.8 161.1 136.8 Government agencies 533.0 416.5 394.5 410.8 389.4 Obligations of state and political subdivisions 9.4 10.4 10.5 11.0 11.2 Preferred stock 91.0 88.1 90.2 90.6 91.1 Mortgage-backed securities 726.8 751.0 806.4 852.1 913.9 Other securities 391.3 389.8 401.9 403.2 384.6 ---------------------------------------------------------------------- Total investment securities 1,982.3 1,837.2 1,840.3 1,928.8 1,927.0 ------------------------------------------------- Loans: Commercial, financial and agricultural 2,378.1 2,445.5 2,445.9 2,461.3 2,465.9 Real estate- construction 1,610.9 1,574.3 1,411.9 1,233.9 1,098.9 Mortgage-commercial 1,254.5 1,222.8 1,245.4 1,223.9 1,239.4 ---------------------------------------------------------------------- Total commercial loans 5,243.5 5,242.6 5,103.2 4,919.1 4,804.2 ------------------------------------------------- Mortgage- residential 518.7 503.0 473.4 455.5 450.9 Consumer 1,489.7 1,452.4 1,408.5 1,438.3 1,414.8 Secured with liquid collateral 528.3 557.2 553.9 584.8 622.9 ---------------------------------------------------------------------- Total retail loans 2,536.7 2,512.6 2,435.8 2,478.6 2,488.6 ------------------------------------------------- Total loans net of unearned income 7,780.2 7,755.2 7,539.0 7,397.7 7,292.8 Reserve for loan losses (93.6) (94.3) (93.6) (91.4) (93.4) ---------------------------------------------------------------------- Net loans 7,686.6 7,660.9 7,445.4 7,306.3 7,199.4 ------------------------------------------------- Premises and equipment 151.6 151.2 148.7 147.6 147.2 Goodwill 291.1 363.0 348.5 348.3 344.3 Other intangibles 38.8 38.9 35.0 36.2 40.2 Other assets 240.0 214.3 182.6 187.3 189.5 ---------------------------------------------------------------------- Total assets $10,697.2 $10,590.7 $10,264.6 $10,232.8 $10,198.4 ================================================= LIABILITIES AND STOCKHOLDERS' EQUITY Deposits: Noninterest-bearing demand $ 861.3 $ 813.8 $ 830.2 $ 1,014.8 $ 1,060.8 Interest-bearing: Savings 292.5 313.1 328.0 326.3 332.7 Interest-bearing demand 2,417.5 2,355.9 2,352.1 2,360.0 2,317.5 Certificates under $100,000 995.5 991.1 960.4 923.0 840.6 Local certificates $100,000 and over 574.7 550.6 513.3 436.5 411.0 ---------------------------------------------------------------------- Total core deposits 5,141.5 5,024.5 4,984.0 5,060.6 4,962.6 National certificates $100,000 and over 2,742.7 2,760.6 2,707.2 2,228.6 2,586.3 ---------------------------------------------------------------------- Total deposits 7,884.2 7,785.1 7,691.2 7,289.2 7,548.9 ------------------------------------------------- Short-term borrowings: Federal funds purchased and securities sold under agreements to repurchase 1,161.7 1,160.0 984.2 1,355.6 1,104.4 U.S. Treasury demand 7.0 24.5 0.6 18.1 12.9 ---------------------------------------------------------------------- Total short-term borrowings 1,168.7 1,184.5 984.8 1,373.7 1,117.3 ------------------------------------------------- Other liabilities 184.5 160.5 151.8 151.6 156.2 Long-term debt 395.2 393.4 393.2 400.4 403.1 ---------------------------------------------------------------------- Total liabilities 9,632.6 9,523.5 9,221.0 9,214.9 9,225.5 ------------------------------------------------- Minority interest 0.3 0.3 0.3 0.2 0.2 Stockholders' equity 1,064.3 1,066.9 1,043.3 1,017.7 972.7 ---------------------------------------------------------------------- Total liabilities and stockholders' equity $10,697.2 $10,590.7 $10,264.6 $10,232.8 $10,198.4 ================================================= % Change From: -------------------- Prior Prior (in millions) Quarter Year ---------------------------------------- ASSETS Cash and due from banks 3.8 (6.4) Federal funds sold and securities purchased under agreements to resell (42.4) (40.0) Investment securities: U.S. Treasury 27.2 68.7 Government agencies 28.0 36.9 Obligations of state and political subdivisions (9.6) (16.1) Preferred stock 3.3 (0.1) Mortgage-backed securities (3.2) (20.5) Other securities 0.4 1.7 -------------------- Total investment securities 7.9 2.9 Loans: Commercial, financial and agricultural (2.8) (3.6) Real estate- construction 2.3 46.6 Mortgage-commercial 2.6 1.2 -------------------- Total commercial loans ---- 9.1 Mortgage- residential 3.1 15.0 Consumer 2.6 5.3 Secured with liquid collateral (5.2) (15.2) -------------------- Total retail loans 1.0 1.9 Total loans net of unearned income 0.3 6.7 Reserve for loan losses (0.7) 0.2 -------------------- Net loans 0.3 6.8 Premises and equipment 0.3 3.0 Goodwill (19.8) (15.5) Other intangibles (0.3) (3.5) Other assets 12.0 26.6 -------------------- Total assets 1.0 4.9 LIABILITIES AND STOCKHOLDERS' EQUITY Deposits: Noninterest-bearing demand 5.8 (18.8) Interest-bearing: Savings (6.6) (12.1) Interest-bearing demand 2.6 4.3 Certificates under $100,000 0.4 18.4 Local certificates $100,000 and over 4.4 39.8 -------------------- Total core deposits 2.3 3.6 National certificates $100,000 and over (0.6) 6.0 -------------------- Total deposits 1.3 4.4 Short-term borrowings: Federal funds purchased and securities sold under agreements to repurchase 0.1 5.2 U.S. Treasury demand (71.4) (45.7) -------------------- Total short-term borrowings (1.3) 4.6 Other liabilities 15.0 18.1 Long-term debt 0.5 (2.0) -------------------- Total liabilities 1.1 4.4 Minority interest ---- 50.0 Stockholders' equity (0.2) 9.4 -------------------- Total liabilities and stockholders' equity 1.0 4.9 *T -0- *T WILMINGTON TRUST CORPORATION QUARTERLY SUMMARY As of and for the nine months ended September 30, 2006 AVERAGE STATEMENT OF CONDITION 2006 2006 2006 2005 2005 Third Second First Fourth Third (in millions) Quarter Quarter Quarter Quarter Quarter ---------------------------------------------------------------------- ASSETS Cash and due from banks $ 206.9 $ 209.3 $ 208.0 $ 237.8 $ 229.6 ------------------------------------------------ Federal funds sold and securities purchased under agreements to resell 28.8 18.8 17.5 40.2 52.9 ------------------------------------------------ Investment securities: U.S. Treasury 157.0 146.7 144.6 133.5 134.4 Government agencies 475.9 394.1 400.8 406.4 390.7 Obligations of state and political subdivisions 9.6 10.5 10.5 11.1 11.3 Preferred stock 89.4 89.2 91.4 90.0 92.5 Mortgage-backed securities 735.1 780.1 828.4 878.6 931.9 Other securities 390.0 397.3 403.2 387.4 369.2 ---------------------------------------------------------------------- Total investment securities 1,857.0 1,817.9 1,878.9 1,907.0 1,930.0 ------------------------------------------------ Loans: Commercial, financial and agricultural 2,407.7 2,463.5 2,448.1 2,465.9 2,449.2 Real estate- construction 1,588.7 1,517.5 1,322.0 1,161.6 1,022.9 Mortgage-commercial 1,238.5 1,212.8 1,229.8 1,239.7 1,232.8 ---------------------------------------------------------------------- Total commercial loans 5,234.9 5,193.8 4,999.9 4,867.2 4,704.9 ------------------------------------------------ Mortgage-residential 507.8 484.2 463.3 450.8 443.8 Consumer 1,470.5 1,441.6 1,423.9 1,412.5 1,369.7 Secured with liquid collateral 546.1 556.3 558.2 614.4 610.0 ---------------------------------------------------------------------- Total retail loans 2,524.4 2,482.1 2,445.4 2,477.7 2,423.5 ------------------------------------------------ Total loans net of unearned income 7,759.3 7,675.9 7,445.3 7,344.9 7,128.4 Reserve for loan losses (93.5) (91.8) (90.4) (93.5) (91.6) ---------------------------------------------------------------------- Net loans 7,665.8 7,584.1 7,354.9 7,251.4 7,036.8 ------------------------------------------------ Premises and equipment 152.1 150.3 148.5 147.6 148.2 Goodwill 362.3 357.3 348.3 344.4 344.2 Other intangibles 38.5 37.3 35.6 39.7 40.9 Other assets 210.8 190.0 180.3 172.1 181.9 ---------------------------------------------------------------------- Total assets $10,522.2 $10,365.0 $10,172.0 $10,140.2 $9,964.5 ================================================ LIABILITIES AND STOCKHOLDERS' EQUITY Deposits: Noninterest-bearing demand $ 737.2 $ 742.0 $ 763.5 $ 1,017.4 $1,016.4 Interest-bearing: Savings 304.1 321.2 326.0 325.9 345.1 Interest-bearing demand 2,374.1 2,364.4 2,346.8 2,321.2 2,257.2 Certificates under $100,000 988.1 980.9 938.6 901.5 825.0 Local certificates $100,000 and over 546.5 540.0 463.3 446.6 409.3 ---------------------------------------------------------------------- Total core deposits 4,950.0 4,948.5 4,838.2 5,012.6 4,853.0 National certificates $100,000 and over 2,864.6 2,656.1 2,647.7 2,475.4 2,500.6 ---------------------------------------------------------------------- Total deposits 7,814.6 7,604.6 7,485.9 7,488.0 7,353.6 ------------------------------------------------ Short-term borrowings: Federal funds purchased and securities sold under agreements to repurchase 1,048.8 1,146.0 1,082.0 1,098.0 1,056.7 U.S. Treasury demand 6.8 16.0 11.7 7.7 12.1 ---------------------------------------------------------------------- Total short-term borrowings 1,055.6 1,162.0 1,093.7 1,105.7 1,068.8 ------------------------------------------------ Other liabilities 175.7 144.8 166.7 163.3 170.9 Long-term debt 394.2 393.3 399.0 400.0 408.7 ---------------------------------------------------------------------- Total liabilities 9,440.1 9,304.7 9,145.3 9,157.0 9,002.0 ------------------------------------------------ Minority interest 0.4 0.3 0.3 0.2 0.3 Stockholders' equity 1,081.7 1,060.0 1,026.4 983.0 962.2 ---------------------------------------------------------------------- Total liabilities and stockholders' equity $10,522.2 $10,365.0 $10,172.0 $10,140.2 $9,964.5 ================================================ % Change From: -------------------- Prior Prior (in millions) Quarter Year ----------------------------------------- ASSETS Cash and due from banks (1.1) (9.9) Federal funds sold and securities purchased under agreements to resell 53.2 (45.6) Investment securities: U.S. Treasury 7.0 16.8 Government agencies 20.8 21.8 Obligations of state and political subdivisions (8.6) (15.0) Preferred stock 0.2 (3.4) Mortgage-backed securities (5.8) (21.1) Other securities (1.8) 5.6 --------------------- Total investment securities 2.2 (3.8) Loans: Commercial, financial and agricultural (2.3) (1.7) Real estate- construction 4.7 55.3 Mortgage-commercial 2.1 0.5 --------------------- Total commercial loans 0.8 11.3 Mortgage-residential 4.9 14.4 Consumer 2.0 7.4 Secured with liquid collateral (1.8) (10.5) --------------------- Total retail loans 1.7 4.2 Total loans net of unearned income 1.1 8.9 Reserve for loan losses 1.9 2.1 --------------------- Net loans 1.1 8.9 Premises and equipment 1.2 2.6 Goodwill 1.4 5.3 Other intangibles 3.2 (5.9) Other assets 10.9 15.9 --------------------- Total assets 1.5 5.6 LIABILITIES AND STOCKHOLDERS' EQUITY Deposits: Noninterest-bearing demand (0.6) (27.5) Interest-bearing: Savings (5.3) (11.9) Interest-bearing demand 0.4 5.2 Certificates under $100,000 0.7 19.8 Local certificates $100,000 and over 1.2 33.5 --------------------- Total core deposits ---- 2.0 National certificates $100,000 and over 7.8 14.6 --------------------- Total deposits 2.8 6.3 Short-term borrowings: Federal funds purchased and securities sold under agreements to repurchase (8.5) (0.7) U.S. Treasury demand (57.5) (43.8) --------------------- Total short-term borrowings (9.2) (1.2) Other liabilities 21.3 2.8 Long-term debt 0.2 (3.5) --------------------- Total liabilities 1.5 4.9 Minority interest 33.3 33.3 Stockholders' equity 2.0 12.4 --------------------- Total liabilities and stockholders' equity 1.5 5.6 *T -0- *T WILMINGTON TRUST CORPORATION QUARTERLY SUMMARY As of and for the nine months ended September 30, 2006 YIELDS AND RATES 2006 2006 2006 2005 2005 YIELDS/RATES Third Second First Fourth Third (tax-equivalent basis) Quarter Quarter Quarter Quarter Quarter --------------------------------------------------------------------- EARNING ASSETS: Federal funds sold and securities purchased under agreements to resell 4.55 % 4.93 % 4.11 % 4.02 % 3.45 % U.S. Treasury 4.06 3.53 3.38 3.27 3.17 Government agencies 4.23 3.93 3.95 3.95 3.87 Obligations of state and political subdivisions 8.75 8.79 8.77 8.78 8.76 Preferred stock 7.63 7.60 7.60 7.58 7.58 Mortgage-backed securities 4.05 4.16 4.17 4.10 4.02 Other securities 6.42 6.14 5.52 5.32 4.84 Total investment securities 4.78 4.67 4.53 4.44 4.27 Commercial, financial and agricultural 7.96 7.61 7.24 6.80 6.32 Real estate-construction 8.60 8.26 7.90 7.39 6.94 Mortgage-commercial 7.98 7.71 7.34 6.96 6.55 Total commercial loans 8.16 7.82 7.44 6.97 6.51 Mortgage-residential 5.81 5.77 5.84 5.82 5.99 Consumer 7.31 7.09 6.85 6.60 6.43 Secured with liquid collateral 6.78 6.36 5.89 5.38 4.89 Total retail loans 6.89 6.67 6.44 6.16 5.96 Total loans 7.75 7.45 7.11 6.70 6.32 Total earning assets 7.15 6.90 6.58 6.22 5.87 FUNDS USED TO SUPPORT EARNING ASSETS: Savings 0.42 0.39 0.32 0.30 0.28 Interest-bearing demand 1.10 1.04 1.02 0.95 0.90 Certificates under $100,000 3.87 3.51 3.27 2.96 2.64 Local certificates $100,000 and over 4.65 4.29 3.89 3.53 3.04 Core interest-bearing deposits 2.16 1.98 1.81 1.64 1.45 National certificates $100,000 and over 5.30 4.98 4.47 4.01 3.51 Total interest-bearing deposits 3.43 3.15 2.86 2.55 2.26 Federal funds purchased and securities sold under agreements to repurchase 4.98 4.67 4.19 3.80 3.37 U.S. Treasury demand 5.09 4.74 4.21 4.22 3.41 Total short-term borrowings 4.98 4.67 4.20 3.80 3.37 Long-term debt 6.85 6.69 6.26 6.01 5.39 Total interest-bearing liabilities 3.78 3.52 3.20 2.89 2.58 Total funds used to support earning assets 3.32 3.10 2.81 2.48 2.21 Net interest margin (tax-equivalent basis) 3.83 3.80 3.77 3.74 3.66 Year to date net interest margin 3.80 3.79 3.77 3.71 3.65 Prime rate 8.25 7.90 7.43 6.97 6.42 Tax-equivalent net interest income (in millions) $ 94.1 $ 91.5 $ 88.3 $ 88.5 $ 84.7 Average earning assets 9,645.1 9,512.6 9,341.7 9,292.1 9,111.3 Average rates are calculated using average balances based on historical cost and do not reflect market valuation adjustments. *T -0- *T WILMINGTON TRUST CORPORATION QUARTERLY SUMMARY As of and for the nine months ended September 30, 2006 SUPPLEMENTAL INFORMATION Three Months Ended --------------------------------------------- Sept. Sept. 30, June 30, Mar. 31, Dec. 31, 30, 2006 2006 2006 2005 2005 ---------------------------------------------------------------------- NET INCOME Net income per share Basic $ 0.08 $ 0.69 $ 0.65 $ 0.69 $ 0.63 Diluted 0.07 0.67 0.64 0.67 0.62 Weighted average shares outstanding (in thousands) Basic 68,647 68,475 68,070 67,861 67,788 Diluted 69,933 69,776 69,434 68,956 68,699 Net income as a percentage of: Average assets 0.20% 1.81% 1.76% 1.82% 1.70% Average stockholders' equity 1.91 17.75 17.42 18.77 17.65 ASSETS UNDER MANAGEMENT * (in billions) Wilmington Trust $ 27.2 $ 26.4 $ 27.2 $ 26.0 $ 26.3 Roxbury Capital Management 3.1 3.3 3.5 3.3 3.2 Cramer Rosenthal McGlynn 9.8 9.4 9.7 8.9 8.5 ---------------------------------------------------------------------- Combined assets under management $ 40.1 $ 39.1 $ 40.4 $ 38.2 $ 38.0 ============================================= * Assets under management include estimates for values associated with certain assets that lack readily ascertainable values, such as limited partnership interests. ASSETS UNDER ADMINISTRATION ** (in billions) Wilmington Trust $ 100.5 $ 100.7 $ 102.1 $ 100.9 $ 96.9 ** Includes Wilmington Trust assets under management FULL-TIME EQUIVALENT HEADCOUNT Full-time equivalent headcount 2,520 2,515 2,475 2,469 2,439 CAPITAL (in millions, except per share amounts) Average stockholders' equity $1,081.7 $1,060.0 $1,026.4 $ 983.0 $ 962.2 Period-end primary capital 1,157.9 1,161.2 1,136.9 1,109.1 1,066.1 Per share: Book value 15.55 15.54 15.30 14.99 14.34 Quarterly dividends declared 0.315 0.315 0.30 0.30 0.30 Year-to-date dividends declared 0.93 0.615 0.30 1.185 0.885 Average stockholders' equity to assets 10.28% 10.23% 10.09% 9.69% 9.66% Total risk-based capital ratio 12.28 11.80 12.21 12.02 12.14 Tier 1 risk-based capital ratio 8.26 7.74 7.77 7.54 7.38 Tier 1 leverage capital ratio 7.34 6.98 6.94 6.74 6.34 CREDIT QUALITY (in millions) Period-end reserve for loan losses $ 93.6 $ 94.3 $ 93.6 $ 91.4 $ 93.4 Period-end non- performing assets: Nonaccrual 32.0 29.5 35.5 39.3 49.9 OREO 4.8 4.8 0.2 0.2 0.2 Renegotiated loans ---- 9.9 4.9 4.7 4.8 Period-end past due 90 days 7.7 4.7 10.1 4.1 14.9 Gross charge-offs 8.6 5.7 3.2 7.8 3.1 Recoveries 1.3 2.2 1.4 3.8 1.2 Net charge-offs 7.3 3.5 1.8 4.0 1.9 Year-to-date net charge- offs 12.6 5.3 1.8 10.1 6.1 Ratios: Period-end reserve to loans 1.20% 1.22% 1.24% 1.24% 1.28% Period-end non- performing assets to loans 0.47 0.57 0.54 0.60 0.75 Period-end loans past due 90 days to total loans 0.10 0.06 0.13 0.06 0.20 Net charge-offs to average loans 0.09 0.05 0.02 0.05 0.03 INTERNAL RISK RATING Pass 97.41% 97.28% 97.20% 97.24% 96.96% Watchlisted 1.73 1.89 1.97 1.96 2.00 Substandard 0.86 0.76 0.76 0.73 0.82 Doubtful ---- 0.07 0.07 0.07 0.22 WILMINGTON TRUST CORPORATION QUARTERLY SUMMARY As of and for the nine months ended September 30, 2006 SUPPLEMENTAL INFORMATION Three Months Ended --------------------------- % Change From: --------------------------- Prior Prior Quarter Year ------------------------ --------------------------- NET INCOME Net income per share Basic (88.4) (87.3) Diluted (89.6) (88.7) Weighted average shares outstanding (in thousands) Basic Diluted Net income as a percentage of: Average assets Average stockholders' equity ASSETS UNDER MANAGEMENT * (in billions) Wilmington Trust 3.0 3.4 Roxbury Capital Management (6.1) (3.1) Cramer Rosenthal McGlynn 4.3 15.3 ------------------------ Combined assets under management 2.6 5.5 * Assets under management include estimates for values associated with certain assets that lack readily ascertainable values, such as limited partnership interests. ASSETS UNDER ADMINISTRATION ** (in billions) Wilmington Trust (0.2) 3.7 ** Includes Wilmington Trust assets under management FULL-TIME EQUIVALENT HEADCOUNT Full-time equivalent headcount CAPITAL (in millions, except per share amounts) Average stockholders' equity 2.0 12.4 Period-end primary capital (0.3) 8.6 Per share: Book value 0.1 8.4 Quarterly dividends declared ---- 5.0 Year-to-date dividends declared Average stockholders' equity to assets Total risk-based capital ratio Tier 1 risk-based capital ratio Tier 1 leverage capital ratio CREDIT QUALITY (in millions) Period-end reserve for loan losses Period-end non- performing assets: Nonaccrual OREO Renegotiated loans Period-end past due 90 days Gross charge-offs Recoveries Net charge-offs Year-to-date net charge- offs Ratios: Period-end reserve to loans Period-end non- performing assets to loans Period-end loans past due 90 days to total loans Net charge-offs to average loans INTERNAL RISK RATING Pass Watchlisted Substandard Doubtful *T -0- *T WILMINGTON TRUST CORPORATION QUARTERLY SUMMARY As of and for the nine months ended September 30, 2006 QUARTERLY BUSINESS SEGMENT REPORT Three Months Ended --------------------------------------- Sept. June Mar. Dec. Sept. 30, 30, 31, 31, 30, (in millions) 2006 2006 2006 2005 2005 ---------------------------------------------------------------------- REGIONAL BANKING Net interest income $ 85.7 $ 83.9 $ 80.9 $ 80.1 $ 77.4 Provision for loan losses (6.7) (3.7) (3.8) (1.9) (2.7) Noninterest income 13.1 13.1 12.1 12.5 14.1 Noninterest expense 39.9 38.4 39.1 39.5 39.6 ---------------------------------------------------------------------- Income before taxes & minority interest 52.2 54.9 50.1 51.2 49.2 Regional Banking efficiency ratio 40.02% 39.22% 41.64% 42.29% 42.86% WEALTH ADVISORY SERVICES Net interest income $ 6.4 $ 6.3 $ 6.5 $ 6.6 $ 6.2 Provision for loan losses 0.1 (0.5) (0.2) (0.1) (0.2) Noninterest income 43.6 44.5 43.4 39.7 40.7 Noninterest expense 38.9 40.6 38.5 36.7 35.5 ---------------------------------------------------------------------- Income before taxes & minority interest 11.2 9.7 11.2 9.5 11.2 Wealth Advisory Services efficiency ratio 77.64% 79.76% 77.00% 79.09% 75.53% CORPORATE CLIENT SERVICES Net interest income $ 4.4 $ 3.4 $ 2.9 $ 3.6 $ 2.6 Provision for loan losses ---- ---- ---- ---- ---- Noninterest income 23.5 23.1 22.5 22.9 21.4 Noninterest expense 19.8 19.3 19.9 18.3 18.4 ---------------------------------------------------------------------- Income before taxes & minority interest 8.1 7.2 5.5 8.2 5.6 Corporate Client Services efficiency ratio 70.71% 72.56% 78.35% 68.80% 76.67% AFFILIATE MANAGERS * Net interest income $ (3.5) $ (3.2) $ (3.0) $ (2.8) $ (2.5) Provision for loan losses ---- ---- ---- ---- ---- Noninterest income 4.4 5.6 4.7 4.7 3.5 Noninterest expense 72.3 ---- ---- ---- ---- ---------------------------------------------------------------------- Income before taxes & minority interest (71.4) 2.4 1.7 1.9 1.0 TOTAL WILMINGTON TRUST CORPORATION Net interest income $ 93.0 $ 90.4 $ 87.3 $ 87.5 $ 83.7 Provision for loan losses (6.6) (4.2) (4.0) (2.0) (2.9) Noninterest income 84.6 86.3 82.7 79.8 79.7 Noninterest expense 170.9 98.3 97.5 94.5 93.5 ---------------------------------------------------------------------- Income before taxes & minority interest $ 0.1 $ 74.2 $ 68.5 $ 70.8 $ 67.0 ======================================= Corporation efficiency ratio 95.64% 55.29% 57.02% 56.15% 56.87% * Affiliate managers comprise Cramer Rosenthal McGlynn and Roxbury Capital Management. Segment data for prior periods may differ from previously published figures due to changes in reporting methodology and/or organizational structure as well as the adjustment for the adoption of stock-based compensation. *T -0- *T WILMINGTON TRUST CORPORATION QUARTERLY SUMMARY As of and for the nine months ended September 30, 2006 YEAR-TO-DATE BUSINESS SEGMENT REPORT Nine Months Ended ------------------------------------- Sept. 30, Sept. 30, $ % (in millions) 2006 2005 Change Change ---------------------------------------------------------------------- REGIONAL BANKING Net interest income $ 250.5 $ 223.3 $ 27.2 12.2% Provision for loan losses (14.1) (9.3) 4.8 51.6 Noninterest income 38.3 38.6 (0.3) (0.8) Noninterest expense 117.4 112.7 4.7 4.2 ---------------------------------------------------------------------- Income before taxes & minority interest 157.3 139.9 17.4 12.4 Regional Banking efficiency ratio 40.25% 42.61% WEALTH ADVISORY SERVICES Net interest income $ 19.1 $ 17.3 $ 1.8 10.4% Provision for loan losses (0.7) (0.5) 0.2 40.0 Noninterest income 131.6 121.1 10.5 8.7 Noninterest expense 117.9 107.9 10.0 9.3 ---------------------------------------------------------------------- Income before taxes & minority interest 32.1 30.0 2.1 7.0 Wealth Advisory Services efficiency ratio 78.13% 77.85% CORPORATE CLIENT SERVICES Net interest income $ 10.7 $ 7.8 $ 2.9 37.2% Provision for loan losses ---- ---- ---- ---- Noninterest income 69.2 61.7 7.5 12.2 Noninterest expense 59.0 55.0 4.0 7.3 ---------------------------------------------------------------------- Income before taxes & minority interest 20.9 14.5 6.4 44.1 Corporate Client Services efficiency ratio 73.75% 79.02% AFFILIATE MANAGERS * Net interest income $ (9.6) $ (7.0) $ (2.6)(37.1)% Provision for loan losses ---- ---- ---- ---- Noninterest income 14.5 12.1 2.4 19.8 Noninterest expense 72.5 ---- 72.5 ---- ---------------------------------------------------------------------- Income before taxes & minority interest (67.6) 5.1 (72.7) ---- TOTAL WILMINGTON TRUST CORPORATION Net interest income $ 270.7 $ 241.4 $ 29.3 12.1% Provision for loan losses (14.8) (9.8) 5.0 51.0 Noninterest income 253.6 233.5 20.1 8.6 Noninterest expense 366.8 275.6 91.2 33.1 ---------------------------------------------------------------------- Income before taxes & minority interest $ 142.7 $ 189.5 $ (46.8)(24.7)% ==================================== Corporation efficiency ratio 69.54% 57.68% * Affiliate managers comprise Cramer Rosenthal McGlynn and Roxbury Capital Management. Segment data for prior periods may differ from previously published figures due to changes in reporting methodology and/or organizational structure as well as the adjustment for the adoption of stock-based compensation. *T

1 Year Wilmington Chart

1 Year Wilmington Chart

1 Month Wilmington Chart

1 Month Wilmington Chart

Your Recent History

Delayed Upgrade Clock