We could not find any results for:
Make sure your spelling is correct or try broadening your search.
| Name | Symbol | Market | Type |
|---|---|---|---|
| Tata Motors Ltd | NYSE:TTM | NYSE | Depository Receipt |
| Price Change | % Change | Price | High Price | Low Price | Open Price | Traded | Last Trade | |
|---|---|---|---|---|---|---|---|---|
| 0.00 | 0.00% | 25.14 | 0 | 00:00:00 |
SECURITIES AND EXCHANGE COMMISSION
Washington, D.C. 20549
FORM 6-K
Report of Foreign Issuer
Pursuant to Rule 13a-16 or 15d-16
of the Securities Exchange Act of 1934
For the Month of November 2023
Commission File Number: 001-32294

TATA MOTORS LIMITED
(Translation of registrant’s name into English)
BOMBAY HOUSE
24, HOMI MODY STREET,
MUMBAI 400 001, MAHARASHTRA, INDIA
Telephone # 91 22 6665 8282 Fax # 91 22 6665 7799
(Address of principal executive office)
Indicate by check mark whether the registrant files or will file annual reports under cover Form 20-F or Form 40-F.
Form 20-F ☒ Form 40-F ☐
Indicate by check mark if the registrant is submitting the Form 6-K in paper as permitted by Regulation S-T Rule 101(b)(1):
Yes ☐ No ☒
Indicate by check mark if the registrant is submitting the Form 6-K in paper as permitted by Regulation S-T Rule 101(b)(7):
Yes ☐ No ☒
Indicate by check mark whether by furnishing the information contained in this Form, the Registrant is also thereby furnishing the information to the Commission pursuant to Rule 12g3-2(b) under the Securities Exchange Act of 1934:
Yes ☐ No ☒
If “Yes” is marked, indicate below the file number assigned to the registrant in connection with Rule 12g 3-2(b): Not Applicable
SIGNATURE
Pursuant to the requirements of the Securities Exchange Act of 1934, the registrant has duly caused this report to be signed on its behalf by the undersigned, thereunto duly authorised.
| Tata Motors Limited | ||
| By: | /s/ Mr Maloy Kumar Gupta | |
| Name: | Mr Maloy Kumar Gupta | |
| Title: | Company Secretary | |
Dated: November 6, 2023
| 4 | ||||
| 4 | ||||
| 5 | ||||
| 6 | ||||
| 7 | ||||
| 8 | ||||
| 8 | ||||
| 8 | ||||
| 8 | ||||
| 8 | ||||
| 9 |
Group, Company, Jaguar Land Rover, JLR plc and JLR refers to Jaguar Land Rover Automotive plc and its subsidiaries. Note 2 to the Condensed consolidated interim financial statements defines a series of alternative performance measures some of which are stated below, along with certain abbreviations.
| Adjusted EBITDA margin | measured as adjusted EBITDA as a percentage of revenue. | |
| Adjusted EBIT margin | measured as adjusted EBIT as a percentage of revenue. | |
| Net debt/cash | defined by the Company as cash and cash equivalents plus short-term deposits and other investments less total balance sheet borrowings. | |
| Q2 FY24 | 3 months ended 30 September 2023 | |
| Q1 FY24 Q2 FY23 H1 FY24 H1 FY23 |
3 months ended 30 June 2023 3 months ended 30 September 2022 6-months ending 30 September 2023 6-months ending 30 September 2022 | |
| China Joint Venture | Chery Jaguar Land Rover Automotive Co., Ltd. | |
3
Management’s discussion and analysis of financial condition and results of operations
Revenue was £6.9 billion in Q2 FY24, up 30% year-on-year from Q2 FY23 reflecting higher volume and model mix, favourable pricing and FX, offset partially by planned marketing, selling expenses and inflationary costs. Wholesale volumes (excluding China Joint Venture) of 96,817 up 28.6% year-on-year and up 3.8% compared to the prior quarter. The order book remained strong with over 168,000 client orders at quarter end, reducing from 185,000 at 30 June 2023 in line with expectations, as chip and other supply constraints continue to improve. Range Rover, Range Rover Sport and Defender demand remains particularly strong, representing 77% of the order book.
Market environment and business developments
| • | Wholesale volumes continued to increase significantly year-on-year reflecting continuing improvement in supply, allowing JLR to deliver more vehicles to clients. |
| • | Strong order book of 168,000 client orders at quarter end, a reduction of c. 17,000 units since 30 June 2023 in line with expectations; 77% of the order book is for our three most profitable models, the Range Rover, Range Rover Sport and Defender. |
| • | Chip supply is expected to continue to gradually improve, and partnership agreements put in place with key chip suppliers are continuing to provide greater visibility over near-term supply. General supply is being monitored with the help of AI analytics tools. We expect production and wholesale volumes to increase in the second half of the financial year. |
| • | The UK has experienced market volatility during the quarter, with the GBP weakening vs USD by 3% from 30 June 2023 to 30 September 2023. |
| • | Interest rates (including the UK, USA and Europe) seem to have stabilised somewhat but are expected to remain at elevated levels for the foreseeable future. The impact of these higher rates will flow through into financing costs for consumers and could impact future demand. |
Revenue and profits, quarter ending 30 September 2023
| • | Revenue was £6.9 billion in Q2 FY24, up 30.4% from Q2 FY23 reflecting favourable volumes, model mix, pricing and FX |
| • | Adjusted EBITDA1 was £1,021 million (EBITDA margin: 14.9%) in Q2 FY24, up from £557 million (EBITDA margin: 10.6%) in Q2 FY23 |
| • | Adjusted EBIT1 was £501 million (7.3%) in Q2 FY24, up from £54 million (1.0%) in Q2 FY23 |
| • | The profit before tax and exceptional items was £442 million in Q2 FY24 compared to a loss before tax and exceptional items of £(173) million in Q2 FY23. The year-on-year improvement primarily reflects the following factors: |
| • | £425 million favourable volume and mix |
| • | £199 million favourable pricing, offset slightly by £(24) million higher variable marketing costs |
| • | £14 million reduction in material and manufacturing costs as a result of some lower commodity prices YoY, offset by a £(39) million increase in warranty costs |
| • | £(77) million increase in structural costs, reflecting SG&A (up £(96)m primarily for planned marketing & selling expenses) and depreciation and amortisation up by £(32)m, slightly offset by £51m favourable engineering & capitalisation |
| • | £107 million for FX and commodities, which includes £(251) million adverse impact of operational exchange caused by the strengthening of GBP year-on-year, largely offset by £210 million of favourable realised derivatives as a result of the hedging policy as well as £105 million of favourable revaluation and £43 million of unrealised commodity derivatives. |
| • | Profit after tax was £272 million (after a tax charge of £(170) million) for Q2 FY24, an improvement from a loss of £(98) million in Q2 FY23 (including a tax rebate of £75 million) |
Revenue and profits, fiscal year to date
| • | Revenue was £13.8 billion for the six months to 30 September 2023, up 42.4% compared to the same period a year ago reflecting improvements in volumes, model mix and pricing |
| • | Adjusted EBITDA2 was £2,144 million (EBITDA margin: 15.6%), up from £850 million (EBITDA margin: 8.8%) for the same period a year ago |
| • | Adjusted EBIT1 was £1,096 million (8.0%) for H1 FY24, up from a loss of £142 million (-1.5%) for the six months to 30 September 2022 |
| 1 | Please see note 2 of the financial statements for alternative performance measures |
| 2 | Please see note 2 of the financial statements for alternative performance measures |
4
| • | The profit before tax and exceptional items was £877 million for H1 FY24 compared to a loss before tax and exceptional items of £(697) million in the prior year. The year-on-year improvement primarily reflects the following factors: |
| • | £1,158 million favourable volume and mix |
| • | £372 million favourable pricing and lower variable marketing costs |
| • | £(46) million increase in material and manufacturing costs as a results of inflationary pressures, plus a £(57) million increase in warranty costs |
| • | £(195)m increase in structural costs, reflecting £(196) million increase in FME and selling, admin expenses up by £(85) million, £134 million favourable engineering and capitalisation, £(88)m depreciation and amortisation, £39 million increase in interest earned due to higher cash balances and market rates and £1 million of other. |
| • | £236 million for FX and commodities, including £230 million FX revaluation, £(316) million of the strengthening pound on revenue and costs offset by £247 million realised derivatives and £75 million unrealised commodities derivatives |
| • | Profit after tax was £595 million (after a tax charge of £(282) million) for the six month period to 30 September 2023, an improvement from a loss of £(580) million in H1 FY23 (including a tax charge of £38 million) |
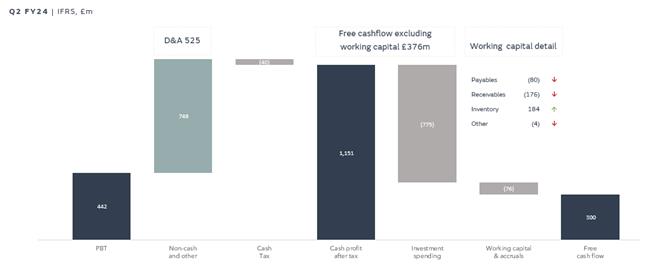
| • | Free cash flow1 was £300 million in Q2 FY24 compared to negative free cashflow of £(15) million in Q2 FY23 |
| • | Working capital movements in the quarter were £(76) million (vs £(1401) million in Q2 FY23) with a decrease in inventories of £184 million offset by higher receivables of £(176) million, a decrease in payables of £(80) million and other of £(4) million since 30 June 2023 |
| • | Investment spending of £775 million in the quarter was up from £526 million in Q2 FY23 and includes £577 million of engineering spend, of which 64% was capitalised, and £197 million of capital investments |
| 1 | Restated from £(124)m due to a change in definition of free cash flow |
5
Retail sales for the second quarter were 106,561 units, up 20.9% compared to the same quarter a year ago and up 4.5% compared to the prior quarter ending 30 June 2023.
Wholesale volumes in the period were 96,817 units (excluding the Chery Jaguar Land Rover China JV), up 28.6% compared to the same quarter a year ago, and up 3.8% compared to the quarter ended 30 June 2023, notwithstanding the annual two-week summer plant shutdown. Wholesale volumes for the first half of the financial year were 190,070, up 29.2% compared to the prior year.
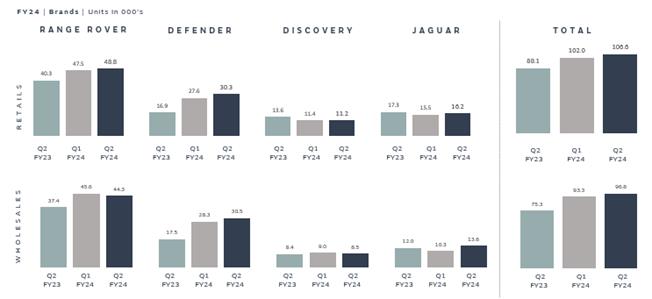

Range Rover brand includes the models Range Rover, Range Rover Sport, Range Rover Velar and Range Rover Evoque. Defender brand includes Defender 90, Defender 110 and Defender 130. Discovery brand includes the models Discovery and Discovery Sport. Jaguar brand includes the Jaguar XE, XF, F-Type, E-Pace, F-Pace and I-Pace models.
6
Total cash and cash equivalents, deposits and investments at 30 September 2023 were £4.3 billion (£4.0 billion at 30 June 2023) comprising £4.1 billion of cash and cash equivalents and £236 million of short-term deposits and other investments. The cash and financial deposits include an amount of £442 million held in subsidiaries of Jaguar Land Rover outside of the United Kingdom. The cash in some of these jurisdictions may be subject to impediments to remitting cash to the UK other than through annual dividends.
The following table shows details of the Company’s financing arrangements at 30 September 2023:
| £ millions |
Facility amount |
Amount outstanding |
Undrawn amount |
|||||||||
| €650m 2.200% Senior Notes due Jan 2024 |
563 | 563 | — | |||||||||
| €500m 5.875% Senior Notes due Nov 2024 |
433 | 433 | — | |||||||||
| $700m 7.750% Senior Notes due Oct 2025 |
572 | 572 | — | |||||||||
| €500m 4.500% Senior Notes due Jan 20265 |
433 | 433 | — | |||||||||
| €500m 6.875% Senior Notes due Nov 2026 |
433 | 433 | — | |||||||||
| $500m 4.500% Senior Notes due Oct 2027 |
408 | 408 | — | |||||||||
| $650m 5.875% Senior Notes due Jan 20285 |
531 | 531 | — | |||||||||
| €500m 4.500% Senior Notes due Jul 2028 |
433 | 433 | — | |||||||||
| $500m 5.500% Senior Notes due Jul 20295 |
408 | 408 | — | |||||||||
| $800m Syndicated Loan due Jan 2025 |
652 | 652 | — | |||||||||
| China RMB 5,000m revolving facility due Mar 20241 |
561 | 561 | — | |||||||||
| UKEF amortising loan due Oct 2024 |
135 | 135 | — | |||||||||
| UKEF amortising loan due Dec 2026 |
406 | 406 | — | |||||||||
|
|
|
|
|
|
|
|||||||
| Subtotal |
5,968 | 5,968 | — | |||||||||
|
|
|
|
|
|
|
|||||||
| Lease obligations2 |
693 | 693 | — | |||||||||
| Other3 |
36 | 36 | — | |||||||||
| Prepaid costs |
(19 | ) | (19 | ) | — | |||||||
| Fair value adjustments4 |
(136 | ) | (136 | ) | — | |||||||
|
|
|
|
|
|
|
|||||||
| Total |
6,542 | 6,542 | — | |||||||||
|
|
|
|
|
|
|
|||||||
| Undrawn RCF |
1,520 | — | 1,520 | |||||||||
|
|
|
|
|
|
|
|||||||
| Total including RCF |
8,062 | 6,542 | 1,520 | |||||||||
|
|
|
|
|
|
|
|||||||
| 1 | The China RMB 5 billion 3-year syndicated revolving loan facility is subject to an annual confirmatory review in January each year. RMB 2 billion was repaid on 12/10/2023 (not reflected in the above) |
| 2 | Lease obligations accounted for as debt under IFRS 16 |
| 3 | Primarily an advance as part of a sale and leaseback transaction |
| 4 | Fair value adjustments relate to hedging arrangements for the $500m 2027 Notes and €500m 2026 Notes |
| 5 | These series of notes were tendered for buy back on 06/10/2023. Settlement of the tendered amount - totalling $400m equivalent across the three series of notes (not reflected in the above) - took place on 18/10/2023 |
7
There are a number of potential risks which could have a material impact on the Group’s performance and could cause actual results to differ materially from expected and/or historical results, particularly those risks relating to continuing supply shortages of semiconductors, and those discussed on pages 46-49 of the Annual Report 2022/23 of the Group (available at www.jaguarlandrover.com/annual-report-2023) along with mitigating factors. The principal risks discussed in the Group’s Annual Report FY23 are competitive business efficiency, global economic and geopolitical environment, brand positioning, rapid technology change, environmental regulations and compliance, litigation / regulatory, supply chain disruptions, information security, client service delivery, manufacturing operations, and human capital.
There were no material acquisitions or disposals in Q2 FY24.
Off-balance sheet financial arrangements
At 30 September 2023, Jaguar Land Rover Limited (a subsidiary of the Company) had sold £491 million equivalent of receivables under a $900 million invoice discounting facility signed in March 2023.
At 30 September 2023, Jaguar Land Rover employed 42,560 people worldwide, including agency personnel, compared to 38,880 at 30 September 2022.
The following table provides information with respect to the members of the Board of Directors of Jaguar Land Rover Automotive plc as at 30 September 2023:
| Name | Position | Year appointed | ||
| Natarajan Chandrasekaran | Chairman and Director | 2017 | ||
| Adrian Mardell | Chief Executive Officer and Director | 2022 | ||
| Prof Sir Ralf D Speth1 | Vice Chairman and Director | 2020 | ||
| Mr P B Balaji | Director | 2017 | ||
| Hanne Sorensen | Director | 2018 | ||
| Charles Nichols | Director | 2022 | ||
| Al-Noor Ramji | Director | 2022 | ||
| 1 | Previously appointed as CEO and Director in 2010 and subsequently Vice Chairman and Director in 2020 |
8
Condensed Consolidated Income Statement
| £ millions |
Note | Three months ended | Six months ended | |||||||||||||||||
| 30 September 2023 |
30 September 2022 Restated* |
30 September 2023 |
30 September 2022 Restated* |
|||||||||||||||||
| Revenue |
3 | 6,857 | 5,260 | 13,760 | 9,666 | |||||||||||||||
| Material and other cost of sales |
(4,166 | ) | (3,212 | ) | (8,192 | ) | (5,974 | ) | ||||||||||||
| Employee costs |
4 | (713 | ) | (604 | ) | (1,429 | ) | (1,174 | ) | |||||||||||
| Other expenses |
9 | (1,425 | ) | (1,180 | ) | (2,801 | ) | (2,189 | ) | |||||||||||
| Exceptional items |
4 | — | — | — | 155 | |||||||||||||||
| Engineering costs capitalised |
5 | 368 | 155 | 688 | 245 | |||||||||||||||
| Other income |
6 | 94 | 78 | 168 | 144 | |||||||||||||||
| Depreciation and amortisation |
(525 | ) | (509 | ) | (1,063 | ) | (1,000 | ) | ||||||||||||
| Foreign exchange and fair value adjustments |
7 | 31 | (55 | ) | (87 | ) | (204 | ) | ||||||||||||
| Finance income |
8 | 41 | 11 | 74 | 18 | |||||||||||||||
| Finance expense (net) |
8 | (125 | ) | (123 | ) | (256 | ) | (237 | ) | |||||||||||
| Share of profit of equity accounted investments |
5 | 6 | 15 | 8 | ||||||||||||||||
|
|
|
|
|
|
|
|
|
|||||||||||||
| Profit/(loss) before tax |
442 | (173 | ) | 877 | (542 | ) | ||||||||||||||
|
|
|
|
|
|
|
|
|
|||||||||||||
| Income tax (expense)/credit |
17 | (170 | ) | 75 | (282 | ) | (38 | ) | ||||||||||||
|
|
|
|
|
|
|
|
|
|||||||||||||
| Profit/(loss) for the period |
272 | (98 | ) | 595 | (580 | ) | ||||||||||||||
|
|
|
|
|
|
|
|
|
|||||||||||||
| * | See note 1 for details of restatement as a result of a change in accounting policy. |
The notes on pages 14 to 37 are an integral part of these condensed consolidated financial statements.
9
Condensed Consolidated Statement of Comprehensive Income and Expense
| Three months ended | Six months ended | |||||||||||||||
| £ millions |
30 September 2023 |
30 September 2022 |
30 September 2023 |
30 September 2022 |
||||||||||||
| Profit/(loss) for the period |
272 | (98 | ) | 595 | (580 | ) | ||||||||||
| Items that will not be reclassified subsequently to profit or loss: |
||||||||||||||||
| Remeasurement of net defined benefit obligation |
3 | 58 | (127 | ) | 437 | |||||||||||
| Income tax related to items that will not be reclassified |
(1 | ) | (14 | ) | 32 | (109 | ) | |||||||||
|
|
|
|
|
|
|
|
|
|||||||||
| 2 | 44 | (95 | ) | 328 | ||||||||||||
|
|
|
|
|
|
|
|
|
|||||||||
| Items that may be reclassified subsequently to profit or loss: |
||||||||||||||||
| (Loss)/gain on cash flow hedges (net) |
(369 | ) | (841 | ) | 282 | (1,492 | ) | |||||||||
| Currency translation differences |
17 | 26 | (25 | ) | 44 | |||||||||||
| Income tax related to items that may be reclassified |
67 | (140 | ) | 44 | 21 | |||||||||||
|
|
|
|
|
|
|
|
|
|||||||||
| (285 | ) | (955 | ) | 301 | (1,427 | ) | ||||||||||
|
|
|
|
|
|
|
|
|
|||||||||
| Other comprehensive (expense)/income net of tax |
(283 | ) | (911 | ) | 206 | (1,099 | ) | |||||||||
|
|
|
|
|
|
|
|
|
|||||||||
| Total comprehensive (expense)/income attributable to shareholder |
(11 | ) | (1,009 | ) | 801 | (1,679 | ) | |||||||||
|
|
|
|
|
|
|
|
|
|||||||||
The notes on pages 14 to 37 are an integral part of these condensed consolidated financial statements.
10
Condensed Consolidated Balance Sheet
| As at (£ millions) |
Note | 30 September 2023 |
31 March 2023 Restated* |
30 September 2022 Restated* |
||||||||||||
| Non-current assets |
||||||||||||||||
| Investments in equity accounted investees |
324 | 329 | 346 | |||||||||||||
| Other non-current investments |
51 | 43 | 43 | |||||||||||||
| Other financial assets |
14 | 144 | 149 | 372 | ||||||||||||
| Property, plant and equipment |
11 | 5,851 | 5,842 | 6,213 | ||||||||||||
| Intangible assets |
12 | 5,068 | 4,864 | 4,872 | ||||||||||||
| Right-of-use assets |
13 | 620 | 635 | 646 | ||||||||||||
| Pension asset |
25 | 552 | 659 | 1,062 | ||||||||||||
| Other non-current assets |
16 | 170 | 75 | 70 | ||||||||||||
| Deferred tax assets |
384 | 357 | 337 | |||||||||||||
|
|
|
|
|
|
|
|||||||||||
| Total non-current assets |
13,164 | 12,953 | 13,961 | |||||||||||||
|
|
|
|
|
|
|
|||||||||||
| Current assets |
||||||||||||||||
| Cash and cash equivalents |
4,057 | 3,687 | 3,555 | |||||||||||||
| Short-term deposits and other investments |
236 | 105 | 161 | |||||||||||||
| Trade receivables |
1,117 | 1,013 | 810 | |||||||||||||
| Other financial assets |
14 | 498 | 375 | 487 | ||||||||||||
| Inventories |
15 | 3,509 | 3,238 | 3,227 | ||||||||||||
| Other current assets |
16 | 606 | 607 | 529 | ||||||||||||
| Current tax assets |
2 | 16 | 29 | |||||||||||||
| Assets classified as held for sale |
60 | 62 | 28 | |||||||||||||
|
|
|
|
|
|
|
|||||||||||
| Total current assets |
10,085 | 9,103 | 8,826 | |||||||||||||
|
|
|
|
|
|
|
|||||||||||
| Total assets |
23,249 | 22,056 | 22,787 | |||||||||||||
|
|
|
|
|
|
|
|||||||||||
| Current liabilities |
||||||||||||||||
| Accounts payable |
6,040 | 5,891 | 5,216 | |||||||||||||
| Short-term borrowings |
21 | 1,341 | 1,478 | 1,908 | ||||||||||||
| Other financial liabilities |
18 | 944 | 923 | 1,385 | ||||||||||||
| Provisions |
19 | 1,097 | 1,089 | 1,089 | ||||||||||||
| Other current liabilities |
20 | 925 | 590 | 749 | ||||||||||||
| Current tax liabilities |
137 | 110 | 102 | |||||||||||||
|
|
|
|
|
|
|
|||||||||||
| Total current liabilities |
10,484 | 10,081 | 10,449 | |||||||||||||
|
|
|
|
|
|
|
|||||||||||
| Non-current liabilities |
||||||||||||||||
| Long-term borrowings |
21 | 4,508 | 4,600 | 5,574 | ||||||||||||
| Other financial liabilities |
18 | 984 | 1,123 | 1,974 | ||||||||||||
| Provisions |
19 | 1,188 | 1,091 | 1,121 | ||||||||||||
| Retirement benefit obligation |
25 | 22 | 22 | 27 | ||||||||||||
| Other non-current liabilities |
20 | 863 | 772 | 662 | ||||||||||||
| Deferred tax liabilities |
159 | 128 | 113 | |||||||||||||
|
|
|
|
|
|
|
|||||||||||
| Total non-current liabilities |
7,724 | 7,736 | 9,471 | |||||||||||||
|
|
|
|
|
|
|
|||||||||||
| Total liabilities |
18,208 | 17,817 | 19,920 | |||||||||||||
|
|
|
|
|
|
|
|||||||||||
| Equity attributable to shareholders |
||||||||||||||||
| Ordinary shares |
1,501 | 1,501 | 1,501 | |||||||||||||
| Capital redemption reserve |
167 | 167 | 167 | |||||||||||||
| Other reserves |
23 | 3,373 | 2,571 | 1,199 | ||||||||||||
|
|
|
|
|
|
|
|||||||||||
| Equity attributable to shareholders |
5,041 | 4,239 | 2,867 | |||||||||||||
|
|
|
|
|
|
|
|||||||||||
| Total liabilities and equity |
23,249 | 22,056 | 22,787 | |||||||||||||
|
|
|
|
|
|
|
|||||||||||
| * | See note 1 for details of restatement as a result of a change in accounting policy. |
The notes on pages 14 to 37 are an integral part of these condensed consolidated financial statements.
These condensed consolidated interim financial statements were approved by the JLR plc Board and authorised for issue on 2 November 2023.
Company registered number: 06477691
11
Condensed Consolidated Statement of Changes in Equity
| £ millions |
Ordinary shares |
Capital redemption reserve |
Other reserves |
Total equity |
||||||||||||
| Balance at 1 April 2023 |
1,501 | 167 | 2,571 | 4,239 | ||||||||||||
| Profit for the period |
— | — | 595 | 595 | ||||||||||||
| Other comprehensive income for the period |
— | — | 206 | 206 | ||||||||||||
|
|
|
|
|
|
|
|
|
|||||||||
| Total comprehensive income |
— | — | 801 | 801 | ||||||||||||
|
|
|
|
|
|
|
|
|
|||||||||
| Amounts removed from hedge reserve and recognised in inventory |
— | — | 2 | 2 | ||||||||||||
| Income tax related to amounts removed from hedge reserve and recognised in inventory |
— | — | (1 | ) | (1 | ) | ||||||||||
|
|
|
|
|
|
|
|
|
|||||||||
| Balance at 30 September 2023 |
1,501 | 167 | 3,373 | 5,041 | ||||||||||||
|
|
|
|
|
|
|
|
|
|||||||||
| £ millions |
Ordinary shares |
Capital redemption reserve |
Other reserves |
Total equity |
||||||||||||
| Balance at 1 April 2022 |
1,501 | 167 | 2,835 | 4,503 | ||||||||||||
| Loss for the period |
— | — | (580 | ) | (580 | ) | ||||||||||
| Other comprehensive expense for the period |
— | — | (1,099 | ) | (1,099 | ) | ||||||||||
|
|
|
|
|
|
|
|
|
|||||||||
| Total comprehensive expense |
— | — | (1,679 | ) | (1,679 | ) | ||||||||||
|
|
|
|
|
|
|
|
|
|||||||||
| Amounts removed from hedge reserve and recognised in inventory |
— | — | 53 | 53 | ||||||||||||
| Income tax related to amounts removed from hedge reserve and recognised in inventory |
— | — | (10 | ) | (10 | ) | ||||||||||
|
|
|
|
|
|
|
|
|
|||||||||
| Balance at 30 September 2022 |
1,501 | 167 | 1,199 | 2,867 | ||||||||||||
|
|
|
|
|
|
|
|
|
|||||||||
The notes on pages 14 to 37 are an integral part of these condensed consolidated financial statements.
12
Condensed Consolidated Cash Flow Statement
| Three months ended | Six months ended | |||||||||||||||||||
| £ millions |
Note | 30 September 2023 |
30 September 2022 |
30 September 2023 |
30 September 2022 |
|||||||||||||||
| Cash flows from operating activities |
||||||||||||||||||||
| Cash generated from operations |
28 | 965 | 416 | 2,109 | 82 | |||||||||||||||
| Dividends received |
— | — | 2 | — | ||||||||||||||||
| Income tax paid |
(40 | ) | (26 | ) | (140 | ) | (127 | ) | ||||||||||||
|
|
|
|
|
|
|
|
|
|||||||||||||
| Net cash generated from/(used in) operating activities |
925 | 390 | 1,971 | (45 | ) | |||||||||||||||
|
|
|
|
|
|
|
|
|
|||||||||||||
| Cash flows from investing activities |
||||||||||||||||||||
| Purchases of other investments |
(1 | ) | (3 | ) | (3 | ) | (3 | ) | ||||||||||||
|
|
|
|
|
|
|
|
|
|||||||||||||
| Investment in other restricted deposits |
(13 | ) | (11 | ) | (15 | ) | (17 | ) | ||||||||||||
| Redemption of other restricted deposits |
3 | 2 | 14 | 14 | ||||||||||||||||
|
|
|
|
|
|
|
|
|
|||||||||||||
| Movements in other restricted deposits |
(10 | ) | (9 | ) | (1 | ) | (3 | ) | ||||||||||||
|
|
|
|
|
|
|
|
|
|||||||||||||
| Investment in short-term deposits and other investments |
(143 | ) | (40 | ) | (285 | ) | (308 | ) | ||||||||||||
| Redemption of short-term deposits and other investments |
92 | 172 | 156 | 352 | ||||||||||||||||
|
|
|
|
|
|
|
|
|
|||||||||||||
| Movements in short-term deposits and other investments |
(51 | ) | 132 | (129 | ) | 44 | ||||||||||||||
| Purchases of property, plant and equipment |
(182 | ) | (122 | ) | (342 | ) | (252 | ) | ||||||||||||
| Purchases of other assets acquired with view to resale |
|
— | (12 | ) | — | (24 | ) | |||||||||||||
| Proceeds from sale of property, plant and equipment |
6 | — | 6 | — | ||||||||||||||||
| Net cash outflow relating to intangible asset expenditure |
(383 | ) | (164 | ) | (715 | ) | (264 | ) | ||||||||||||
| Issuance of loans to related parties |
— | — | (20 | ) | — | |||||||||||||||
| Repayment of loans to related parties |
20 | — | 20 | — | ||||||||||||||||
| Finance income received |
38 | 9 | 68 | 15 | ||||||||||||||||
| Disposal of subsidiaries (net of cash disposed) |
9 | — | 9 | 2 | ||||||||||||||||
|
|
|
|
|
|
|
|
|
|||||||||||||
| Net cash used in investing activities |
(554 | ) | (169 | ) | (1,107 | ) | (485 | ) | ||||||||||||
|
|
|
|
|
|
|
|
|
|||||||||||||
| Cash flows from financing activities |
||||||||||||||||||||
| Finance expenses and fees paid |
(124 | ) | (116 | ) | (237 | ) | (216 | ) | ||||||||||||
| Proceeds from issuance of borrowings |
— | — | — | 594 | ||||||||||||||||
| Repayment of borrowings |
(62 | ) | (63 | ) | (195 | ) | (719 | ) | ||||||||||||
| Payments of lease obligations |
(18 | ) | (17 | ) | (35 | ) | (35 | ) | ||||||||||||
|
|
|
|
|
|
|
|
|
|||||||||||||
| Net cash used in financing activities |
(204 | ) | (196 | ) | (467 | ) | (376 | ) | ||||||||||||
|
|
|
|
|
|
|
|
|
|||||||||||||
| Net increase/(decrease) in cash and cash equivalents |
167 | 25 | 397 | (906 | ) | |||||||||||||||
| Cash and cash equivalents at beginning of period |
3,829 | 3,411 | 3,687 | 4,223 | ||||||||||||||||
| Effect of foreign exchange on cash and cash equivalents |
61 | 119 | (27 | ) | 238 | |||||||||||||||
|
|
|
|
|
|
|
|
|
|||||||||||||
| Cash and cash equivalents at end of period |
4,057 | 3,555 | 4,057 | 3,555 | ||||||||||||||||
|
|
|
|
|
|
|
|
|
|||||||||||||
The notes on pages 14 to 37 are an integral part of these condensed consolidated financial statements.
13
Notes (forming part of the condensed consolidated interim financial statements)
| 1 | Accounting policies |
Basis of preparation
The financial information in these interim financial statements is unaudited and does not constitute statutory accounts as defined in Section 435 of the Companies Act 2006. The condensed consolidated interim financial statements of Jaguar Land Rover Automotive plc have been prepared in accordance with International Accounting Standard 34, ‘Interim Financial Reporting’ in accordance with the requirements of UK-adopted international accounting standards. The balance sheet and accompanying notes as at 30 September 2022 have been disclosed solely for the information of the users.
The comparative figures for the financial year ended 31 March 2023 are not the company’s statutory accounts for that financial year but are derived from those accounts. Those accounts have been reported on by the company’s auditor and delivered to the registrar of companies. The report of the auditor was (i) unqualified, (ii) did not include a reference to any matters to which the auditor drew attention by way of emphasis without qualifying their report; and (iii) did not contain a statement under section 498 (2) or (3) of the Companies Act 2006.
The condensed consolidated interim financial statements have been prepared on a historical cost basis except for certain financial instruments held at fair value as highlighted in note 22.
The condensed consolidated interim financial statements should be read in conjunction with the annual consolidated financial statements for the year ended 31 March 2023, which were prepared in accordance with UK-adopted international accounting standards.
The condensed consolidated interim financial statements have been prepared on the going concern basis as set out within the directors’ report of the Group’s Annual Report for the year ended 31 March 2023.
The accounting policies applied are consistent with those of the annual consolidated financial statements for the year ended 31 March 2023, as described in those financial statements, except as described below.
Change in accounting policy
During the six months ended 30 September 2023, the Group reviewed its accounting policy choice over the net presentation of grants relating to property, plant and equipment and intangible assets.
As a result, it was considered more appropriate to adopt a policy to present grants related to property, plant and equipment and intangible assets gross as separate liabilities instead of deducting them from the cost of the assets; and to present the unwind of the grant over the useful economic lives of the assets in ‘Other income’, rather than a reduction of ‘Depreciation and amortisation’.
Separate disclosure of amounts received for grants in relation to capital assets more closely aligns the presentation of assets in the consolidated balance sheet with the Group’s reported cash flows from investing activities; and improves transparency of the financial statements by allowing users to better understand the extent of grant income supporting investments. The policy is also aligned to that of the Group’s ultimate parent company and therefore enhances comparability with its other subsidiaries.
The prior period comparatives have been represented on this basis. The impact on the consolidated income statement for the three and six months ended 30 September 2022, and on the consolidated balance sheet at 30 September 2022 and 31 March 2023 are shown below:
Consolidated income statement (extract)
| Three months ended 30 September 2022 | Six months ended 30 September 2022 | |||||||||||||||||||||||
| £ millions |
As reported | Restatement | Restated | As reported | Restatement | Restated | ||||||||||||||||||
| Other income |
62 | 16 | 78 | 114 | 30 | 144 | ||||||||||||||||||
| Depreciation and amortisation |
(493 | ) | (16 | ) | (509 | ) | (970 | ) | (30 | ) | (1,000 | ) | ||||||||||||
|
|
|
|
|
|
|
|
|
|
|
|
|
|||||||||||||
14
Notes (forming part of the condensed consolidated interim financial statements)
| 1 | Accounting policies (continued) |
Change in accounting policy (continued)
Consolidated balance sheet (extract)
| As at 31 March 2023 | As at 30 September 2022 | |||||||||||||||||||||||
| £ millions |
As reported | Restatement | Restated | As reported | Restatement | Restated | ||||||||||||||||||
| Non-current assets |
||||||||||||||||||||||||
| Property, plant and equipment |
5,759 | 83 | 5,842 | 6,133 | 80 | 6,213 | ||||||||||||||||||
| Intangible assets |
4,600 | 264 | 4,864 | 4,634 | 238 | 4,872 | ||||||||||||||||||
| Current liabilities |
||||||||||||||||||||||||
| Other current liabilities |
(528 | ) | (62 | ) | (590 | ) | (688 | ) | (61 | ) | (749 | ) | ||||||||||||
| Non-current liabilities |
||||||||||||||||||||||||
| Other non-current liabilities |
(487 | ) | (285 | ) | (772 | ) | (405 | ) | (257 | ) | (662 | ) | ||||||||||||
|
|
|
|
|
|
|
|
|
|
|
|
|
|||||||||||||
There is no impact to profit/loss before or after taxation, reported equity, or net assets in any of the previous financial periods.
The revised accounting policy is given below.
Government grants
Government grants are recognised when there is reasonable assurance that the Group will comply with the relevant conditions and the grant will be received.
Government grants are recognised in the consolidated income statement, either on a systematic basis when the Group recognises, as expenses, the related costs that the grants are intended to compensate or immediately, if the costs have already been incurred.
Government grants related to income are presented as an offset against the related expenditure except in cases where there are no ongoing performance obligations to the Group, in which case the government grant is recognised as other income in the period in which the Group becomes entitled to the grant.
Government grants related to assets are presented gross as separate liabilities and unwound over the useful economic lives of the assets as other income.
Cash flows arising from grants related to income and assets are presented within cash flows from operating activities in the consolidated cash flow statement.
The terms and treatment of each grant is assessed on a case by case basis.
Sales tax incentives received from governments are recognised in the consolidated income statement at the reduced tax rate, and revenue is reported net of these sales tax incentives.
Estimates and judgements
The preparation of interim financial statements requires management to make judgements, estimates and assumptions that affect the application of accounting policies and the reported amounts of assets and liabilities, income and expense. Actual results may differ from these estimates.
In preparing these condensed interim financial statements, the significant judgements made by management in applying the Group’s accounting policies and the key sources of estimate uncertainty were the same as those applied to the consolidated financial statements for the year ended 31 March 2023.
15
Notes (forming part of the condensed consolidated interim financial statements)
| 1 | Accounting policies (continued) |
Going concern
The condensed consolidated interim financial statements have been prepared on a going concern basis, which the Directors consider appropriate for the reasons set out below.
The Directors have assessed the financial position of the Group as at 30 September 2023, and the projected cash flows of the Group for at least twelve-month period from the date of authorisation of the condensed consolidated interim financial statements (the ‘going concern assessment period’).
The Group had available liquidity of £5.8 billion at 30 September 2023, £4.3 billion of which is cash with the remainder the undrawn RCF facility. Within the going concern assessment period there is a £1 billion minimum quarter-end liquidity covenant attached to the Group’s UKEF loans and forward start RCF facility. There is £1.7 billion of maturing debt in the going concern assessment period, comprising UKEF and CNY loan repayments, EUR bond repayments and early repayment of EUR and USD bonds in October 2023 (see note 30). No new funding is assumed.
The Group has assessed its projected cash flows over the going concern assessment period. This base case uses the most recent Board-approved forecasts that include the going concern assessment period; taking into account the Group’s expectations of improved semiconductor supply, optimisation of production to prioritise the highest margin products along with the expectations relating to prevailing economic conditions, including the impact of inflationary pressures on material costs and environmental, social and governance (“ESG”) commitments.
The base case assumes a steady improvement in wholesale volumes, with associated increases in EBIT, in the going concern assessment period compared to the previous 12 months as semiconductor supply related production constraints progressively ease, supported by new partnership agreements with key semiconductor suppliers.
The Group has carried out a reverse stress test against the base case to determine the decline in wholesale volumes over a twelve-month period that would result in a liquidity level that breaches the £1 billion liquidity financing covenant. The reverse stress test assumes continued supply constraints over the 12-month period and optimisation of production to maximise production of higher margin products.
In order to reach a liquidity level that breaches covenants, it would require a sustained decline in wholesale volumes of more than 65% compared to the base case over a 12-month period. The reverse stress test reflects the variable profit impact of the wholesale volume decline, and assumes all other assumptions are held in line with the base case. It does not reflect other potential upside measures that could be taken in such a reduced volume scenario; nor any new funding.
The Group does not consider this scenario to be plausible given that the stress test volumes are significantly lower than the volumes achieved during both the peak of the COVID-19 pandemic and the worst quarter of semiconductor shortages. The Group has a strong order bank and is confident that it can significantly exceed reverse stress test volumes.
The Group has considered the impact of severe but plausible downside scenarios, including scenarios that reflect a decrease in variable profit per unit compared with the base case to include additional increases in material and other related production costs. The expected wholesale volumes under all of these scenarios is higher than under the reverse stress test.
The Directors, after making appropriate enquiries and taking into consideration the risks and uncertainties facing the Group, consider that the Group has adequate financial resources to continue operating throughout the going concern assessment period, meeting its liabilities as they fall due. Accordingly, the Directors continue to adopt the going concern basis in preparing these condensed consolidated interim financial statements.
16
Notes (forming part of the condensed consolidated interim financial statements)
| 2 | Alternative Performance Measures |
In reporting financial information, the Group presents alternative performance measures (‘APMs’) which are not defined or specified under the requirements of IFRS. The Group believes that these APMs, which are not considered to be a substitute for or superior to IFRS measures, provide stakeholders with additional helpful information on the performance of the business.
The APMs used by the Group are defined below.
| Alternative Performance |
Definition | |
| Adjusted EBITDA | Adjusted EBITDA is defined as profit before: income tax expense; exceptional items; finance expense (net of capitalised interest) and finance income; gains/losses on debt and unrealised derivatives, realised derivatives entered into for the purpose of hedging debt, and equity or debt investments held at fair value; foreign exchange gains/losses on other assets and liabilities, including short-term deposits and cash and cash equivalents; share of profit/loss from equity accounted investments; depreciation and amortisation. | |
| Adjusted EBIT | Adjusted EBIT is defined as for adjusted EBITDA but including share of profit/loss from equity accounted investments, depreciation and amortisation. | |
| Profit/(loss) before tax and exceptional items | Profit/(loss) before tax excluding exceptional items. | |
| Free cash flow | Net cash generated from operating activities less net cash used in automotive investing activities, excluding investments in joint ventures, associates and subsidiaries and movements in financial investments, and after finance expenses and fees paid. Financial investments are those reported as cash and cash equivalents, short-term deposits and other investments, and equity or debt investments held at fair value. | |
| Total product and other investment | Cash used in the purchase of property, plant and equipment, intangible assets, investments in equity accounted investments and other trading investments, acquisition of subsidiaries and expensed research and development costs. | |
| Working capital and accruals | Changes in assets and liabilities as presented in note 28. This comprises movements in assets and liabilities excluding movements relating to financing or investing cash flows or non-cash items that are not included in adjusted EBIT or adjusted EBITDA. | |
| Total cash and cash equivalents, deposits and investments | Defined as cash and cash equivalents, short-term deposits and other investments, marketable securities and any other items defined as cash and cash equivalents in accordance with IFRS. | |
| Available liquidity | Defined as total cash and cash equivalents, deposits and investments plus committed undrawn credit facilities. | |
| Net debt | Total cash and cash equivalents, deposits and investments less total interest-bearing loans and borrowings. | |
| Retail sales | Jaguar Land Rover retail sales represent vehicle sales made by dealers to end customers and include the sale of vehicles produced by our Chinese joint venture, Chery Jaguar Land Rover Automotive Company Ltd. | |
| Wholesales | Wholesales represent vehicle sales made to dealers. The Group recognises revenue on wholesales. | |
The Group uses adjusted EBITDA as an APM to review and measure the underlying profitability of the Group on an ongoing basis for comparability as it recognises that increased capital expenditure year-on-year will lead to a corresponding increase in depreciation and amortisation expense recognised within the consolidated income statement.
The Group uses adjusted EBIT as an APM to review and measure the underlying profitability of the Group on an ongoing basis as this excludes volatility on unrealised foreign exchange transactions. Due to the significant level of debt and currency derivatives, unrealised foreign exchange distorts the financial performance of the Group from one period to another.
17
Notes (forming part of the condensed consolidated interim financial statements)
| 2 | Alternative Performance Measures (continued) |
Free cash flow is considered by the Group to be a key measure in assessing and understanding the total operating performance of the Group and to identify underlying trends.
During the year ended 31 March 2023, the definition of ‘Free cash flow’ was amended to exclude investments in associates, joint ventures and subsidiaries. The Group considers the amended Free cash flow measure to be more useful as it provides a clearer view of recurring cash flows that is not distorted by the impact of one-off transactions. Free cash flow for the three and six month periods ended 30 September 2022 prior to the change was £(15) million and £(784) million respectively.
Total product and other investment is considered by the Group to be a key measure in assessing cash invested in the development of future new models and infrastructure supporting the growth of the Group.
Working capital and accruals is considered by the Group to be a key measure in assessing assets and liabilities that are expected to be converted into cash within the next 12-month period; as well as over the longer term.
Total cash and cash equivalents, deposits and investments and available liquidity are measures used by the Group to assess liquidity and the availability of funds for future spend and investment.
Exceptional items are defined in note 4.
Reconciliations between these alternative performance measures and statutory reported measures are shown below and on the next page.
Adjusted EBIT and Adjusted EBITDA
| Three months ended | Six months ended | |||||||||||||||||||
| £ millions |
Note | 30 September 2023 |
30 September 2022 Restated* |
30 September 2023 |
30 September 2022 Restated* |
|||||||||||||||
| Adjusted EBITDA |
1,021 | 557 | 2,144 | 850 | ||||||||||||||||
| Depreciation and amortisation |
(525 | ) | (509 | ) | (1,063 | ) | (1,000 | ) | ||||||||||||
| Share of profit of equity accounted investments |
5 | 6 | 15 | 8 | ||||||||||||||||
|
|
|
|
|
|
|
|
|
|||||||||||||
| Adjusted EBIT |
501 | 54 | 1,096 | (142 | ) | |||||||||||||||
|
|
|
|
|
|
|
|
|
|||||||||||||
| Foreign exchange on debt, derivatives and balance sheet revaluation |
28 | (11 | ) | (116 | ) | 2 | (230 | ) | ||||||||||||
| Unrealised gain/(loss) on commodities |
28 | 35 | (8 | ) | (43 | ) | (117 | ) | ||||||||||||
| Finance income |
8 | 41 | 11 | 74 | 18 | |||||||||||||||
| Finance expense (net) |
8 | (125 | ) | (123 | ) | (256 | ) | (237 | ) | |||||||||||
| Fair value gain on equity investments |
28 | 1 | 9 | 4 | 11 | |||||||||||||||
|
|
|
|
|
|
|
|
|
|||||||||||||
| Profit/(loss) before tax and exceptional items |
442 | (173 | ) | 877 | (697 | ) | ||||||||||||||
|
|
|
|
|
|
|
|
|
|||||||||||||
| Exceptional items |
4 | — | — | — | 155 | |||||||||||||||
|
|
|
|
|
|
|
|
|
|||||||||||||
| Profit/(loss) before tax |
442 | (173 | ) | 877 | (542 | ) | ||||||||||||||
|
|
|
|
|
|
|
|
|
|||||||||||||
| * | See note 1 for details of restatement as a result of a change in accounting policy. |
18
Notes (forming part of the condensed consolidated interim financial statements)
| 2 | Alternative Performance Measures (continued) |
Free cash flow
| Three months ended | Six months ended | |||||||||||||||
| £ millions |
30 September 2023 |
30 September 2022 |
30 September 2023 |
30 September 2022 Restated* |
||||||||||||
| Net cash generated from/(used in) operating activities |
925 | 390 | 1,971 | (45 | ) | |||||||||||
| Purchases of property, plant and equipment |
(182 | ) | (122 | ) | (342 | ) | (252 | ) | ||||||||
| Net cash outflow relating to intangible asset expenditure |
(383 | ) | (164 | ) | (715 | ) | (264 | ) | ||||||||
| Proceeds from sale of property, plant and equipment |
6 | — | 6 | — | ||||||||||||
| Issuance of loans to related parties |
— | — | (20 | ) | — | |||||||||||
| Repayment of loans to related parties |
20 | — | 20 | — | ||||||||||||
| Purchases of other assets acquired with view to resale |
— | (12 | ) | — | (24 | ) | ||||||||||
| Finance expenses and fees paid |
(124 | ) | (116 | ) | (237 | ) | (216 | ) | ||||||||
| Finance income received |
38 | 9 | 68 | 15 | ||||||||||||
|
|
|
|
|
|
|
|
|
|||||||||
| Free cash flow |
300 | (15 | ) | 751 | (786 | ) | ||||||||||
|
|
|
|
|
|
|
|
|
|||||||||
| * | Comparative information has been restated for the change in definition explained on the previous page. |
Total product and other investment
| Three months ended | Six months ended | |||||||||||||||||||
| £ millions |
Note | 30 September 2023 |
30 September 2022 |
30 September 2023 |
30 September 2022 |
|||||||||||||||
| Purchases of property, plant and equipment |
182 | 122 | 342 | 252 | ||||||||||||||||
| Net cash outflow relating to intangible asset expenditure |
383 | 164 | 715 | 264 | ||||||||||||||||
| Engineering costs expensed |
5 | 209 | 237 | 412 | 496 | |||||||||||||||
| Purchases of other investments |
1 | 3 | 3 | 3 | ||||||||||||||||
|
|
|
|
|
|
|
|
|
|||||||||||||
| Total product and other investment |
775 | 526 | 1,472 | 1,015 | ||||||||||||||||
|
|
|
|
|
|
|
|
|
|||||||||||||
Total cash and cash equivalents, deposits and investments
| As at (£ millions) |
30 September 2023 |
31 March 2023 |
30 September 2022 |
|||||||||
| Cash and cash equivalents |
4,057 | 3,687 | 3,555 | |||||||||
| Short-term deposits and other investments |
236 | 105 | 161 | |||||||||
|
|
|
|
|
|
|
|||||||
| Total cash and cash equivalents, deposits and investments |
4,293 | 3,792 | 3,716 | |||||||||
|
|
|
|
|
|
|
|||||||
Available liquidity
| As at (£ millions) |
Note | 30 September 2023 |
31 March 2023 |
30 September 2022 |
||||||||||||
| Cash and cash equivalents |
4,057 | 3,687 | 3,555 | |||||||||||||
| Short-term deposits and other investments |
236 | 105 | 161 | |||||||||||||
| Committed undrawn credit facilities |
21 | 1,520 | 1,520 | 1,500 | ||||||||||||
|
|
|
|
|
|
|
|||||||||||
| Available liquidity |
5,813 | 5,312 | 5,216 | |||||||||||||
|
|
|
|
|
|
|
|||||||||||
Net debt
| As at (£ millions) |
Note | 30 September 2023 |
31 March 2023 |
30 September 2022 |
||||||||||||
| Cash and cash equivalents |
4,057 | 3,687 | 3,555 | |||||||||||||
| Short-term deposits and other investments |
236 | 105 | 161 | |||||||||||||
| Interest-bearing loans and borrowings |
21 | (6,542 | ) | (6,788 | ) | (8,216 | ) | |||||||||
|
|
|
|
|
|
|
|||||||||||
| Net debt |
(2,249 | ) | (2,996 | ) | (4,500 | ) | ||||||||||
|
|
|
|
|
|
|
|||||||||||
19
Notes (forming part of the condensed consolidated interim financial statements)
| 2 | Alternative Performance Measures (continued) |
Retails and wholesales
| Three months ended | Six months ended | |||||||||||||||
| Units |
30 September 2023 |
30 September 2022 |
30 September 2023 |
30 September 2022 |
||||||||||||
| Retail sales |
106,561 | 88,121 | 208,555 | 166,946 | ||||||||||||
|
|
|
|
|
|
|
|
|
|||||||||
| Wholesales* |
96,817 | 75,307 | 190,070 | 147,122 | ||||||||||||
|
|
|
|
|
|
|
|
|
|||||||||
| * | Wholesale volumes exclude sales from Chery Jaguar Land Rover – Q2 FY24: 12,346 units, Q2 FY23: 14,589 units, H1 FY24: 25,378 units, H1 FY23: 25,361 units. |
| 3 | Disaggregation of revenue |
| Three months ended | Six months ended | |||||||||||||||
| £ millions |
30 September 2023 |
30 September 2022 |
30 September 2023 |
30 September 2022 |
||||||||||||
| Revenue recognised for sales of vehicles, parts and accessories |
6,493 | 5,122 | 13,114 | 9,335 | ||||||||||||
| Revenue recognised for services transferred |
85 | 82 | 167 | 156 | ||||||||||||
| Revenue - other |
256 | 220 | 515 | 415 | ||||||||||||
|
|
|
|
|
|
|
|
|
|||||||||
| Total revenue excluding realised revenue hedges |
6,834 | 5,424 | 13,796 | 9,906 | ||||||||||||
|
|
|
|
|
|
|
|
|
|||||||||
| Realised revenue hedges |
23 | (164 | ) | (36 | ) | (240 | ) | |||||||||
|
|
|
|
|
|
|
|
|
|||||||||
| Total revenue |
6,857 | 5,260 | 13,760 | 9,666 | ||||||||||||
|
|
|
|
|
|
|
|
|
|||||||||
| 4 | Exceptional items |
| Three months ended | Six months ended | |||||||||||||||
| £ millions |
30 September 2023 |
30 September 2022 |
30 September 2023 |
30 September 2022 |
||||||||||||
| Employee costs excluding exceptional items |
(713 | ) | (604 | ) | (1,429 | ) | (1,174 | ) | ||||||||
| Impact of: |
||||||||||||||||
| Past service credit |
— | — | — | 155 | ||||||||||||
|
|
|
|
|
|
|
|
|
|||||||||
| Employee costs including exceptional items |
(713 | ) | (604 | ) | (1,429 | ) | (1,019 | ) | ||||||||
|
|
|
|
|
|
|
|
|
|||||||||
The exceptional item recognised during the six months ended 30 September 2022 comprised of a pension past service credit of £155 million due to a change in inflation index from RPI to CPI.
| 5 | Engineering costs capitalised |
| Three months ended | Six months ended | |||||||||||||||
| £ millions |
30 September 2023 |
30 September 2022 Restated* |
30 September 2023 |
30 September 2022 Restated* |
||||||||||||
| Total engineering costs incurred |
577 | 392 | 1,100 | 741 | ||||||||||||
| Engineering costs expensed |
(209 | ) | (237 | ) | (412 | ) | (496 | ) | ||||||||
|
|
|
|
|
|
|
|
|
|||||||||
| Engineering costs capitalised |
368 | 155 | 688 | 245 | ||||||||||||
|
|
|
|
|
|
|
|
|
|||||||||
| Interest capitalised in engineering costs capitalised |
18 | 2 | 31 | 7 | ||||||||||||
|
|
|
|
|
|
|
|
|
|||||||||
| Total internally developed intangible additions |
386 | 157 | 719 | 252 | ||||||||||||
|
|
|
|
|
|
|
|
|
|||||||||
| * | See note 1 for details of restatement as a result of a change in accounting policy. |
20
Notes (forming part of the condensed consolidated interim financial statements)
| 6 | Other income |
| Three months ended | Six months ended | |||||||||||||||
| £ millions |
30 September 2023 |
30 September 2022 Restated* |
30 September 2023 |
30 September 2022 Restated* |
||||||||||||
| Grant income |
64 | 51 | 112 | 89 | ||||||||||||
| Commissions |
7 | 7 | 10 | 13 | ||||||||||||
| Other |
23 | 20 | 46 | 42 | ||||||||||||
|
|
|
|
|
|
|
|
|
|||||||||
| Total other income |
94 | 78 | 168 | 144 | ||||||||||||
|
|
|
|
|
|
|
|
|
|||||||||
| * | See note 1 for details of restatement as a result of a change in accounting policy. |
| 7 | Foreign exchange and fair value adjustments |
| Three months ended | Six months ended | |||||||||||||||
| £ millions |
30 September 2023 |
30 September 2022 |
30 September 2023 |
30 September 2022 |
||||||||||||
| Foreign exchange and fair value adjustments on loans |
(65 | ) | (279 | ) | 41 | (533 | ) | |||||||||
| Foreign exchange gain/(loss) on economic hedges of loans |
51 | 186 | (61 | ) | 334 | |||||||||||
| Foreign exchange gain/(loss) on derivatives |
4 | (23 | ) | 4 | (36 | ) | ||||||||||
| Other foreign exchange gain/(loss) |
21 | 57 | (5 | ) | 107 | |||||||||||
| Realised (loss)/gain on commodities |
(16 | ) | 3 | (27 | ) | 30 | ||||||||||
| Unrealised gain/(loss) on commodities |
35 | (8 | ) | (43 | ) | (117 | ) | |||||||||
| Fair value gain on equity investments |
1 | 9 | 4 | 11 | ||||||||||||
|
|
|
|
|
|
|
|
|
|||||||||
| Foreign exchange and fair value adjustments |
31 | (55 | ) | (87 | ) | (204 | ) | |||||||||
|
|
|
|
|
|
|
|
|
|||||||||
| 8 | Finance income and expense |
| Three months ended | Six months ended | |||||||||||||||
| £ millions |
30 September 2023 |
30 September 2022 |
30 September 2023 |
30 September 2022 |
||||||||||||
| Finance income |
41 | 11 | 74 | 18 | ||||||||||||
|
|
|
|
|
|
|
|
|
|||||||||
| Total finance income |
41 | 11 | 74 | 18 | ||||||||||||
|
|
|
|
|
|
|
|
|
|||||||||
| Interest expense on lease liabilities |
(14 | ) | (14 | ) | (28 | ) | (26 | ) | ||||||||
| Interest expense on financial liabilities measured at amortised cost other than lease liabilities |
(104 | ) | (104 | ) | (210 | ) | (205 | ) | ||||||||
| Interest expense on derivatives designated as a fair value hedge of financial liabilities |
(7 | ) | (4 | ) | (13 | ) | (4 | ) | ||||||||
| Unwind of discount on provisions |
(19 | ) | (3 | ) | (38 | ) | (11 | ) | ||||||||
| Interest capitalised |
19 | 2 | 33 | 9 | ||||||||||||
|
|
|
|
|
|
|
|
|
|||||||||
| Total finance expense (net) |
(125 | ) | (123 | ) | (256 | ) | (237 | ) | ||||||||
|
|
|
|
|
|
|
|
|
|||||||||
The capitalisation rate used to calculate borrowing costs eligible for capitalisation during the six month period ended 30 September 2023 was 6.2% (six month period ended 30 September 2022: 5.1%).
| 9 | Other expenses |
| Three months ended | Six months ended | |||||||||||||||
| £ millions |
30 September 2023 |
30 September 2022 |
30 September 2023 |
30 September 2022 |
||||||||||||
| Stores, spare parts and tools |
28 | 25 | 58 | 48 | ||||||||||||
| Freight cost |
170 | 144 | 342 | 296 | ||||||||||||
| Works, operations and other costs |
745 | 593 | 1,480 | 1,106 | ||||||||||||
| Power and fuel |
28 | 58 | 60 | 96 | ||||||||||||
| Product warranty |
267 | 234 | 490 | 403 | ||||||||||||
| Publicity |
187 | 126 | 371 | 240 | ||||||||||||
|
|
|
|
|
|
|
|
|
|||||||||
| Total other expenses |
1,425 | 1,180 | 2,801 | 2,189 | ||||||||||||
|
|
|
|
|
|
|
|
|
|||||||||
21
Notes (forming part of the condensed consolidated interim financial statements)
| 10 | Allowances for trade and other receivables |
| Six months ended | ||||||||
| £ millions |
30 September 2023 |
30 September 2022 |
||||||
| At beginning of period |
4 | 4 | ||||||
| Charged during the period |
4 | 1 | ||||||
|
|
|
|
|
|||||
| At end of period |
8 | 5 | ||||||
|
|
|
|
|
|||||
| 11 | Property, plant and equipment |
| £ millions |
Land and Buildings |
Plant and equipment |
Vehicles | IT equipment |
Fixtures and fittings |
Heritage vehicles |
Under construction |
Total | ||||||||||||||||||||||||
| Cost |
||||||||||||||||||||||||||||||||
| Balance at 1 April 2023 restated* |
2,646 | 11,360 | 14 | 213 | 140 | 40 | 388 | 14,801 | ||||||||||||||||||||||||
| Additions |
— | — | — | — | — | — | 527 | 527 | ||||||||||||||||||||||||
| Transfers |
60 | 146 | — | 2 | — | — | (208 | ) | — | |||||||||||||||||||||||
| Disposals |
(6 | ) | (265 | ) | — | (4 | ) | (3 | ) | (25 | ) | — | (303 | ) | ||||||||||||||||||
| Foreign currency translation |
(6 | ) | (9 | ) | — | — | — | — | — | (15 | ) | |||||||||||||||||||||
|
|
|
|
|
|
|
|
|
|
|
|
|
|
|
|
|
|||||||||||||||||
| Balance at 30 September 2023 |
2,694 | 11,232 | 14 | 211 | 137 | 15 | 707 | 15,010 | ||||||||||||||||||||||||
|
|
|
|
|
|
|
|
|
|
|
|
|
|
|
|
|
|||||||||||||||||
| Depreciation and impairment |
| |||||||||||||||||||||||||||||||
| Balance at 1 April 2023 restated* |
736 | 7,953 | 11 | 132 | 93 | 34 | — | 8,959 | ||||||||||||||||||||||||
| Depreciation charge for the period |
62 | 415 | — | 8 | 4 | — | — | 489 | ||||||||||||||||||||||||
| Disposals |
(6 | ) | (245 | ) | — | (4 | ) | (3 | ) | (25 | ) | — | (283 | ) | ||||||||||||||||||
| Foreign currency translation |
(3 | ) | (2 | ) | — | — | (1 | ) | — | — | (6 | ) | ||||||||||||||||||||
|
|
|
|
|
|
|
|
|
|
|
|
|
|
|
|
|
|||||||||||||||||
| Balance at 30 September 2023 |
789 | 8,121 | 11 | 136 | 93 | 9 | — | 9,159 | ||||||||||||||||||||||||
|
|
|
|
|
|
|
|
|
|
|
|
|
|
|
|
|
|||||||||||||||||
| Net book value |
||||||||||||||||||||||||||||||||
| At 1 April 2023 restated* |
1,910 | 3,407 | 3 | 81 | 47 | 6 | 388 | 5,842 | ||||||||||||||||||||||||
|
|
|
|
|
|
|
|
|
|
|
|
|
|
|
|
|
|||||||||||||||||
| At 30 September 2023 |
1,905 | 3,111 | 3 | 75 | 44 | 6 | 707 | 5,851 | ||||||||||||||||||||||||
|
|
|
|
|
|
|
|
|
|
|
|
|
|
|
|
|
|||||||||||||||||
| * | See note 1 for details of restatement as a result of a change in accounting policy. |
22
Notes (forming part of the condensed consolidated interim financial statements)
| 11 | Property, plant and equipment (continued) |
| £ millions |
Land and Buildings |
Plant and equipment |
Vehicles | IT equipment |
Fixtures and fittings |
Heritage vehicles |
Under construction |
Total | ||||||||||||||||||||||||
| Cost |
||||||||||||||||||||||||||||||||
| Balance at 1 April 2022 restated* |
2,639 | 11,264 | 15 | 195 | 134 | 46 | 231 | 14,524 | ||||||||||||||||||||||||
| Additions |
— | — | — | 6 | — | — | 302 | 308 | ||||||||||||||||||||||||
| Transfers |
44 | 203 | — | — | — | — | (247 | ) | — | |||||||||||||||||||||||
| Transfers to right-of-use assets |
(13 | ) | — | — | — | — | — | — | (13 | ) | ||||||||||||||||||||||
| Disposals |
— | (9 | ) | (2 | ) | — | — | — | — | (11 | ) | |||||||||||||||||||||
| Foreign currency translation |
17 | 20 | (1 | ) | 1 | (1 | ) | — | — | 36 | ||||||||||||||||||||||
|
|
|
|
|
|
|
|
|
|
|
|
|
|
|
|
|
|||||||||||||||||
| Balance at 30 September 2022 |
2,687 | 11,478 | 12 | 202 | 133 | 46 | 286 | 14,844 | ||||||||||||||||||||||||
|
|
|
|
|
|
|
|
|
|
|
|
|
|
|
|
|
|||||||||||||||||
| Depreciation and impairment |
| |||||||||||||||||||||||||||||||
| Balance at 1 April 2022 restated* |
619 | 7,321 | 10 | 117 | 87 | 34 | — | 8,188 | ||||||||||||||||||||||||
| Depreciation charge for the period |
57 | 369 | — | 8 | 4 | — | — | 438 | ||||||||||||||||||||||||
| Disposals |
— | (7 | ) | (1 | ) | — | — | — | — | (8 | ) | |||||||||||||||||||||
| Foreign currency translation |
4 | 9 | — | — | — | — | — | 13 | ||||||||||||||||||||||||
|
|
|
|
|
|
|
|
|
|
|
|
|
|
|
|
|
|||||||||||||||||
| Balance at 30 September 2022 |
680 | 7,692 | 9 | 125 | 91 | 34 | — | 8,631 | ||||||||||||||||||||||||
|
|
|
|
|
|
|
|
|
|
|
|
|
|
|
|
|
|||||||||||||||||
| Net book value |
||||||||||||||||||||||||||||||||
| At 1 April 2022 restated* |
2,020 | 3,943 | 5 | 78 | 47 | 12 | 231 | 6,336 | ||||||||||||||||||||||||
|
|
|
|
|
|
|
|
|
|
|
|
|
|
|
|
|
|||||||||||||||||
| At 30 September 2022 |
2,007 | 3,786 | 3 | 77 | 42 | 12 | 286 | 6,213 | ||||||||||||||||||||||||
|
|
|
|
|
|
|
|
|
|
|
|
|
|
|
|
|
|||||||||||||||||
| * | See note 1 for details of restatement as a result of a change in accounting policy. |
23
Notes (forming part of the condensed consolidated interim financial statements)
| 12 | Intangible assets |
| £ millions |
Software | Patents and technological know-how |
Customer related |
Intellectual property rights and other intangibles |
Product development - completed |
Product development - in progress |
Total | |||||||||||||||||||||
| Cost |
||||||||||||||||||||||||||||
| Balance at 1 April 2023 restated* |
948 | 147 | 61 | 650 | 9,150 | 793 | 11,749 | |||||||||||||||||||||
| Additions - externally purchased |
28 | — | — | — | — | — | 28 | |||||||||||||||||||||
| Additions - internally developed |
— | — | — | — | — | 719 | 719 | |||||||||||||||||||||
| Transfers |
— | — | — | — | 74 | (74 | ) | — | ||||||||||||||||||||
| Disposals |
(95 | ) | — | — | — | (222 | ) | — | (317 | ) | ||||||||||||||||||
|
|
|
|
|
|
|
|
|
|
|
|
|
|
|
|||||||||||||||
| Balance at 30 September 2023 |
881 | 147 | 61 | 650 | 9,002 | 1,438 | 12,179 | |||||||||||||||||||||
|
|
|
|
|
|
|
|
|
|
|
|
|
|
|
|||||||||||||||
| Amortisation and impairment |
| |||||||||||||||||||||||||||
| Balance at 1 April 2023 restated* |
743 | 147 | 48 | 173 | 5,774 | — | 6,885 | |||||||||||||||||||||
| Amortisation in the period |
37 | — | 5 | 1 | 488 | — | 531 | |||||||||||||||||||||
| Disposals |
(83 | ) | — | — | — | (222 | ) | — | (305 | ) | ||||||||||||||||||
|
|
|
|
|
|
|
|
|
|
|
|
|
|
|
|||||||||||||||
| Balance at 30 September 2023 |
697 | 147 | 53 | 174 | 6,040 | — | 7,111 | |||||||||||||||||||||
|
|
|
|
|
|
|
|
|
|
|
|
|
|
|
|||||||||||||||
| Net book value |
||||||||||||||||||||||||||||
| At 1 April 2023 restated* |
205 | — | 13 | 477 | 3,376 | 793 | 4,864 | |||||||||||||||||||||
|
|
|
|
|
|
|
|
|
|
|
|
|
|
|
|||||||||||||||
| At 30 September 2023 |
184 | — | 8 | 476 | 2,962 | 1,438 | 5,068 | |||||||||||||||||||||
|
|
|
|
|
|
|
|
|
|
|
|
|
|
|
|||||||||||||||
| * | See note 1 for details of restatement as a result of a change in accounting policy. |
| £ millions |
Software | Patents and technological know-how |
Customer related |
Intellectual property rights and other intangibles |
Product development - completed |
Product development - in progress |
Total | |||||||||||||||||||||
| Cost |
||||||||||||||||||||||||||||
| Balance at 1 April 2022 restated* |
894 | 147 | 61 | 650 | 9,500 | 574 | 11,826 | |||||||||||||||||||||
| Additions - externally purchased |
18 | — | — | — | — | — | 18 | |||||||||||||||||||||
| Additions - internally developed |
— | — | — | — | — | 252 | 252 | |||||||||||||||||||||
| Transfers |
— | — | — | — | 517 | (517 | ) | — | ||||||||||||||||||||
| Disposals |
— | — | — | — | (865 | ) | — | (865 | ) | |||||||||||||||||||
|
|
|
|
|
|
|
|
|
|
|
|
|
|
|
|||||||||||||||
| Balance at 30 September 2022 |
912 | 147 | 61 | 650 | 9,152 | 309 | 11,231 | |||||||||||||||||||||
|
|
|
|
|
|
|
|
|
|
|
|
|
|
|
|||||||||||||||
| Amortisation and impairment |
| |||||||||||||||||||||||||||
| Balance at 1 April 2022 restated* |
674 | 147 | 46 | 170 | 5,670 | — | 6,707 | |||||||||||||||||||||
| Amortisation in the period |
33 | — | 1 | 2 | 481 | — | 517 | |||||||||||||||||||||
| Disposals |
— | — | — | — | (865 | ) | — | (865 | ) | |||||||||||||||||||
|
|
|
|
|
|
|
|
|
|
|
|
|
|
|
|||||||||||||||
| Balance at 30 September 2022 |
707 | 147 | 47 | 172 | 5,286 | — | 6,359 | |||||||||||||||||||||
|
|
|
|
|
|
|
|
|
|
|
|
|
|
|
|||||||||||||||
| Net book value |
||||||||||||||||||||||||||||
| At 1 April 2022 restated* |
220 | — | 15 | 480 | 3,830 | 574 | 5,119 | |||||||||||||||||||||
|
|
|
|
|
|
|
|
|
|
|
|
|
|
|
|||||||||||||||
| At 30 September 2022 |
205 | — | 14 | 478 | 3,866 | 309 | 4,872 | |||||||||||||||||||||
|
|
|
|
|
|
|
|
|
|
|
|
|
|
|
|||||||||||||||
| * | See note 1 for details of restatement as a result of a change in accounting policy. |
24
Notes (forming part of the condensed consolidated interim financial statements)
| 13 | Right-of-use assets |
| £ millions |
Land and buildings |
IT equipment |
Plant and equipment |
Vehicles | Fixtures and fittings |
Other | Total | |||||||||||||||||||||
| Cost |
||||||||||||||||||||||||||||
| Balance at 1 April 2023 |
781 | 17 | 94 | 7 | 17 | 4 | 920 | |||||||||||||||||||||
| Additions |
14 | 1 | 13 | 1 | — | — | 29 | |||||||||||||||||||||
| Other |
4 | — | — | — | — | (1 | ) | 3 | ||||||||||||||||||||
| Disposals |
(15 | ) | (4 | ) | (13 | ) | (1 | ) | — | (2 | ) | (35 | ) | |||||||||||||||
|
|
|
|
|
|
|
|
|
|
|
|
|
|
|
|||||||||||||||
| Balance at 30 September 2023 |
784 | 14 | 94 | 7 | 17 | 1 | 917 | |||||||||||||||||||||
|
|
|
|
|
|
|
|
|
|
|
|
|
|
|
|||||||||||||||
| Accumulated depreciation |
| |||||||||||||||||||||||||||
| Balance at 1 April 2023 |
208 | 9 | 57 | 3 | 5 | 3 | 285 | |||||||||||||||||||||
| Depreciation in the period |
33 | 2 | 6 | 1 | 1 | — | 43 | |||||||||||||||||||||
| Disposals |
(11 | ) | (4 | ) | (13 | ) | (1 | ) | — | (2 | ) | (31 | ) | |||||||||||||||
|
|
|
|
|
|
|
|
|
|
|
|
|
|
|
|||||||||||||||
| Balance at 30 September 2023 |
230 | 7 | 50 | 3 | 6 | 1 | 297 | |||||||||||||||||||||
|
|
|
|
|
|
|
|
|
|
|
|
|
|
|
|||||||||||||||
| Net book value |
||||||||||||||||||||||||||||
| At 1 April 2023 |
573 | 8 | 37 | 4 | 12 | 1 | 635 | |||||||||||||||||||||
|
|
|
|
|
|
|
|
|
|
|
|
|
|
|
|||||||||||||||
| At 30 September 2023 |
554 | 7 | 44 | 4 | 11 | — | 620 | |||||||||||||||||||||
|
|
|
|
|
|
|
|
|
|
|
|
|
|
|
|||||||||||||||
| £ millions |
Land and buildings |
IT equipment |
Plant and equipment |
Vehicles | Fixtures and fittings |
Other | Total | |||||||||||||||||||||
| Cost |
||||||||||||||||||||||||||||
| Balance at 1 April 2022 |
672 | 24 | 101 | 14 | 17 | 5 | 833 | |||||||||||||||||||||
| Additions |
96 | 2 | 6 | 2 | — | — | 106 | |||||||||||||||||||||
| Other |
14 | — | 1 | — | — | — | 15 | |||||||||||||||||||||
| Foreign currency translation |
2 | — | 2 | — | — | — | 4 | |||||||||||||||||||||
| Disposals |
(1 | ) | — | — | — | — | — | (1 | ) | |||||||||||||||||||
|
|
|
|
|
|
|
|
|
|
|
|
|
|
|
|||||||||||||||
| Balance at 30 September 2022 |
783 | 26 | 110 | 16 | 17 | 5 | 957 | |||||||||||||||||||||
|
|
|
|
|
|
|
|
|
|
|
|
|
|
|
|||||||||||||||
| Accumulated depreciation |
||||||||||||||||||||||||||||
| Balance at 1 April 2022 |
168 | 18 | 60 | 11 | 4 | 4 | 265 | |||||||||||||||||||||
| Depreciation in the period |
31 | 2 | 8 | 2 | 2 | — | 45 | |||||||||||||||||||||
| Other |
(1 | ) | — | — | — | — | — | (1 | ) | |||||||||||||||||||
| Foreign currency translation |
2 | — | 1 | — | — | — | 3 | |||||||||||||||||||||
| Disposals |
(1 | ) | — | — | — | — | — | (1 | ) | |||||||||||||||||||
|
|
|
|
|
|
|
|
|
|
|
|
|
|
|
|||||||||||||||
| Balance at 30 September 2022 |
199 | 20 | 69 | 13 | 6 | 4 | 311 | |||||||||||||||||||||
|
|
|
|
|
|
|
|
|
|
|
|
|
|
|
|||||||||||||||
| Net book value |
||||||||||||||||||||||||||||
| At 1 April 2022 |
504 | 6 | 41 | 3 | 13 | 1 | 568 | |||||||||||||||||||||
|
|
|
|
|
|
|
|
|
|
|
|
|
|
|
|||||||||||||||
| At 30 September 2022 |
584 | 6 | 41 | 3 | 11 | 1 | 646 | |||||||||||||||||||||
|
|
|
|
|
|
|
|
|
|
|
|
|
|
|
|||||||||||||||
25
Notes (forming part of the condensed consolidated interim financial statements)
| 14 | Other financial assets |
| As at (£ millions) |
30 September 2023 | 31 March 2023 | 30 September 2022 | |||||||||
| Non-current |
||||||||||||
| Restricted cash |
9 | 9 | 11 | |||||||||
| Derivative financial instruments |
66 | 71 | 291 | |||||||||
| Warranty reimbursement and other receivables |
53 | 54 | 54 | |||||||||
| Other |
16 | 15 | 16 | |||||||||
|
|
|
|
|
|
|
|||||||
| Total non-current other financial assets |
144 | 149 | 372 | |||||||||
|
|
|
|
|
|
|
|||||||
| Current |
||||||||||||
| Restricted cash |
12 | 11 | 17 | |||||||||
| Derivative financial instruments |
220 | 101 | 208 | |||||||||
| Warranty reimbursement and other receivables |
102 | 85 | 90 | |||||||||
| Accrued income |
35 | 40 | 47 | |||||||||
| Other |
129 | 138 | 125 | |||||||||
|
|
|
|
|
|
|
|||||||
| Total current other financial assets |
498 | 375 | 487 | |||||||||
|
|
|
|
|
|
|
|||||||
| 15 | Inventories |
| As at (£ millions) |
30 September 2023 | 31 March 2023 | 30 September 2022 | |||||||||
| Raw materials and consumables |
165 | 148 | 139 | |||||||||
|
Work-in-progress |
499 | 504 | 737 | |||||||||
| Finished goods |
2,845 | 2,589 | 2,345 | |||||||||
| Inventory basis adjustment |
— | (3 | ) | 6 | ||||||||
|
|
|
|
|
|
|
|||||||
| Total inventories |
3,509 | 3,238 | 3,227 | |||||||||
|
|
|
|
|
|
|
|||||||
Inventories of finished goods include £461 million (31 March 2023: £402 million, 30 September 2022: £388 million) relating to vehicles sold to rental car companies, fleet clients and others with guaranteed repurchase arrangements.
During the six month period ending 30 September 2023, the Group recorded an inventory write-down expense of £46 million (six month period ended 30 September 2022: £21 million). The write-down is included in “Material and other cost of sales”.
| 16 | Other assets |
| As at (£ millions) |
30 September 2023 | 31 March 2023 | 30 September 2022 | |||||||||
| Non-current |
||||||||||||
| Prepaid expenses |
76 | 66 | 26 | |||||||||
| Research and development expenditure credit |
84 | 3 | 36 | |||||||||
| Other |
10 | 6 | 8 | |||||||||
|
|
|
|
|
|
|
|||||||
| Total non-current other assets |
170 | 75 | 70 | |||||||||
|
|
|
|
|
|
|
|||||||
| Current |
||||||||||||
| Recoverable VAT |
204 | 252 | 237 | |||||||||
| Prepaid expenses |
287 | 219 | 216 | |||||||||
| Research and development expenditure credit |
100 | 121 | 61 | |||||||||
| Other |
15 | 15 | 15 | |||||||||
|
|
|
|
|
|
|
|||||||
| Total current other assets |
606 | 607 | 529 | |||||||||
|
|
|
|
|
|
|
|||||||
| 17 | Taxation |
Recognised in the income statement
Income tax for the six month period ending 30 September 2023 and 30 September 2022 is charged at the estimated effective tax rate expected to apply for the applicable financial year ends and adjusted for relevant deferred tax amounts where applicable.
A tax charge of £282 million was incurred in the six month period ending 30 September 2023. The effective tax rate of 32% is impacted by the ability of the UK to shelter UK tax liabilities with UK deferred tax assets which are currently not fully recognised on the balance sheet.
26
Notes (forming part of the condensed consolidated interim financial statements)
| 18 | Other financial liabilities |
| As at (£ millions) |
30 September 2023 | 31 March 2023 | 30 September 2022 | |||||||||
| Current |
||||||||||||
| Lease obligations |
71 | 70 | 65 | |||||||||
| Interest accrued |
104 | 95 | 111 | |||||||||
| Derivative financial instruments |
385 | 461 | 967 | |||||||||
| Liability for vehicles sold under a repurchase arrangement |
384 | 297 | 242 | |||||||||
|
|
|
|
|
|
|
|||||||
| Total current other financial liabilities |
944 | 923 | 1,385 | |||||||||
|
|
|
|
|
|
|
|||||||
| Non-current |
||||||||||||
| Lease obligations |
622 | 640 | 669 | |||||||||
| Derivative financial instruments |
352 | 472 | 1,276 | |||||||||
| Other |
10 | 11 | 29 | |||||||||
|
|
|
|
|
|
|
|||||||
| Total non-current other financial liabilities |
984 | 1,123 | 1,974 | |||||||||
|
|
|
|
|
|
|
|||||||
| 19 | Provisions |
| As at (£ millions) |
30 September 2023 | 31 March 2023 | 30 September 2022* | |||||||||
| Current |
||||||||||||
| Product warranty |
699 | 696 | 623 | |||||||||
| Emissions compliance |
10 | 9 | 146 | |||||||||
| Restructuring |
2 | 5 | 26 | |||||||||
| Third party claims and obligations |
315 | 300 | 263 | |||||||||
| Other provisions |
71 | 79 | 31 | |||||||||
|
|
|
|
|
|
|
|||||||
| Total current provisions |
1,097 | 1,089 | 1,089 | |||||||||
|
|
|
|
|
|
|
|||||||
| Non-current |
||||||||||||
| Product warranty |
1,054 | 976 | 1,023 | |||||||||
| Emissions compliance |
85 | 71 | 51 | |||||||||
| Other provisions |
49 | 44 | 47 | |||||||||
|
|
|
|
|
|
|
|||||||
| Total non-current provisions |
1,188 | 1,091 | 1,121 | |||||||||
|
|
|
|
|
|
|
|||||||
| * | The comparatives at 30 September 2022 have been re-presented to align with presentation changes made during the year ended 31 March 2023. Product warranty and Restructuring amounts are consistent with previous periods. Legal and product liability amounts disclosed in previous periods are now split into Emissions compliance, Third party claims and obligations and Other provisions. Provisions for residual risk, environmental liability and other employee benefits obligations amounts disclosed in previous periods are now grouped in Other provisions. This has not resulted in any change to reported ‘Total current provisions’ or ‘Total non-current provisions’. |
| £ millions |
Product warranty |
Emissions compliance |
Restructuring | Third party claims and obligations |
Other provisions |
Total | ||||||||||||||||||
| Balance at 1 April 2023 |
1,672 | 80 | 5 | 300 | 123 | 2,180 | ||||||||||||||||||
| Provisions made during the period |
461 | 42 | — | 321 | 16 | 840 | ||||||||||||||||||
| Provisions used during the period |
(391 | ) | (9 | ) | (2 | ) | (245 | ) | (6 | ) | (653 | ) | ||||||||||||
| Unused amounts reversed in the period |
(27 | ) | (19 | ) | (1 | ) | (61 | ) | (4 | ) | (112 | ) | ||||||||||||
| Impact of unwind of discounting |
38 | — | — | — | — | 38 | ||||||||||||||||||
| Foreign currency translation |
— | 1 | — | — | (9 | ) | (8 | ) | ||||||||||||||||
|
|
|
|
|
|
|
|
|
|
|
|
|
|||||||||||||
| Balance at 30 September 2023 |
1,753 | 95 | 2 | 315 | 120 | 2,285 | ||||||||||||||||||
|
|
|
|
|
|
|
|
|
|
|
|
|
|||||||||||||
27
Notes (forming part of the condensed consolidated interim financial statements)
| 20 | Other liabilities |
| As at (£ millions) |
30 September 2023 | 31 March 2023 Restated* |
30 September 2022 Restated* |
|||||||||
| Current |
||||||||||||
| Liabilities for advances received |
186 | 51 | 80 | |||||||||
| Ongoing service obligations |
314 | 301 | 310 | |||||||||
| VAT |
112 | 98 | 95 | |||||||||
| Deferred grant income |
68 | 62 | 61 | |||||||||
| Other taxes payable |
234 | 70 | 199 | |||||||||
| Other |
11 | 8 | 4 | |||||||||
|
|
|
|
|
|
|
|||||||
| Total current other liabilities |
925 | 590 | 749 | |||||||||
|
|
|
|
|
|
|
|||||||
| Non-current |
||||||||||||
| Ongoing service obligations |
549 | 478 | 397 | |||||||||
| Deferred grant income |
312 | 291 | 263 | |||||||||
| Other |
2 | 3 | 2 | |||||||||
|
|
|
|
|
|
|
|||||||
| Total non-current other liabilities |
863 | 772 | 662 | |||||||||
|
|
|
|
|
|
|
|||||||
| * | See note 1 for details of restatement as a result of a change in accounting policy. |
| 21 | Interest bearing loans and borrowings |
| As at (£ millions) |
30 September 2023 | 31 March 2023 | 30 September 2022 | |||||||||
| Short-term borrowings |
||||||||||||
| Bank loans |
561 | 658 | 632 | |||||||||
| Current portion of long-term EURO MTF listed debt |
562 | 571 | 848 | |||||||||
| Current portion of long-term loans |
218 | 249 | 428 | |||||||||
|
|
|
|
|
|
|
|||||||
| Short-term borrowings |
1,341 | 1,478 | 1,908 | |||||||||
|
|
|
|
|
|
|
|||||||
| Long-term borrowings |
||||||||||||
| EURO MTF listed debt |
3,503 | 3,512 | 4,294 | |||||||||
| Bank loans |
969 | 1,053 | 1,245 | |||||||||
| Other unsecured |
36 | 35 | 35 | |||||||||
|
|
|
|
|
|
|
|||||||
| Long-term borrowings |
4,508 | 4,600 | 5,574 | |||||||||
|
|
|
|
|
|
|
|||||||
| Lease obligations |
693 | 710 | 734 | |||||||||
|
|
|
|
|
|
|
|||||||
| Total debt |
6,542 | 6,788 | 8,216 | |||||||||
|
|
|
|
|
|
|
|||||||
Undrawn facilities
As at 30 September 2023, the Group has a fully undrawn revolving credit facility of £1,520 million (31 March 2023: £1,520 million, 30 September 2022: £1,500 million), with maturity date of April 2026
| 22 | Financial instruments |
The condensed consolidated interim financial statements have been prepared on a historical cost basis except for certain financial instruments held at fair value. These financial instruments are classified as either level 2 fair value measurements, as defined by IFRS 13, being those derived from inputs other than quoted prices which are observable, or level 3 fair value measurements, being those derived from significant unobservable inputs. There have been no changes in the valuation techniques used or transfers between fair value levels from those set out in note 37 to the annual consolidated financial statements for the year ended 31 March 2023.
28
Notes (forming part of the condensed consolidated interim financial statements)
| 22 | Financial instruments (continued) |
The tables below show the carrying amounts and fair value of each category of financial assets and liabilities, other than those with carrying amounts that are reasonable approximations of fair values.
| Fair Value Through Profit and Loss | ||||||||||||||||||||||||
| As at 30 September 2023 |
Amortised cost |
Financial assets |
Derivatives other than in hedging relationship |
Derivatives in hedging relationship |
Total carrying value |
Total fair value |
||||||||||||||||||
| Cash and cash equivalents |
4,057 | — | — | — | 4,057 | 4,057 | ||||||||||||||||||
| Short-term deposits and other investments |
236 | — | — | — | 236 | 236 | ||||||||||||||||||
| Trade receivables |
1,117 | — | — | — | 1,117 | 1,117 | ||||||||||||||||||
| Other non-current investments |
— | 51 | — | — | 51 | 51 | ||||||||||||||||||
| Other financial assets - current |
278 | — | 137 | 83 | 498 | 498 | ||||||||||||||||||
| Other financial assets - non-current |
78 | — | 1 | 65 | 144 | 144 | ||||||||||||||||||
|
|
|
|
|
|
|
|
|
|
|
|
|
|||||||||||||
| Total financial assets |
5,766 | 51 | 138 | 148 | 6,103 | 6,103 | ||||||||||||||||||
|
|
|
|
|
|
|
|
|
|
|
|
|
|||||||||||||
| Accounts payable |
6,040 | — | — | — | 6,040 | 6,040 | ||||||||||||||||||
| Short-term borrowings |
1,341 | — | — | — | 1,341 | 1,338 | ||||||||||||||||||
| Long-term borrowings* |
4,508 | — | — | — | 4,508 | 4,434 | ||||||||||||||||||
| Other financial liabilities - current |
559 | — | 65 | 320 | 944 | 944 | ||||||||||||||||||
| Other financial liabilities - non-current |
632 | — | 38 | 314 | 984 | 960 | ||||||||||||||||||
|
|
|
|
|
|
|
|
|
|
|
|
|
|||||||||||||
| Total financial liabilities |
13,080 | — | 103 | 634 | 13,817 | 13,716 | ||||||||||||||||||
|
|
|
|
|
|
|
|
|
|
|
|
|
|||||||||||||
| * | Included in the long-term borrowings shown in other financial liabilities is £432 million that is designated as the hedged item in a fair value hedge relationship. Included within long-term borrowings is £(136) million of fair value adjustments of which £(113) million relates to the ongoing hedge relationship and £(23) million relates to hedge relationships that were discontinued during the year ended 31 March 2023. Included in the long-term borrowings is £980 million that is designated as a hedging instrument in a cash flow hedge relationship. |
| Fair Value Through Profit and Loss | ||||||||||||||||||||||||
| As at 31 March 2023 |
Amortised cost |
Financial assets |
Derivatives other than in hedging relationship |
Derivatives in hedging relationship |
Total carrying value |
Total fair value |
||||||||||||||||||
| Cash and cash equivalents |
3,687 | — | — | — | 3,687 | 3,687 | ||||||||||||||||||
| Short-term deposits and other investments |
105 | — | — | — | 105 | 105 | ||||||||||||||||||
| Trade receivables |
1,013 | — | — | — | 1,013 | 1,013 | ||||||||||||||||||
| Other non-current investments |
— | 43 | — | — | 43 | 43 | ||||||||||||||||||
| Other financial assets - current |
274 | — | 55 | 46 | 375 | 375 | ||||||||||||||||||
| Other financial assets - non-current |
78 | — | 51 | 20 | 149 | 149 | ||||||||||||||||||
|
|
|
|
|
|
|
|
|
|
|
|
|
|||||||||||||
| Total financial assets |
5,157 | 43 | 106 | 66 | 5,372 | 5,372 | ||||||||||||||||||
|
|
|
|
|
|
|
|
|
|
|
|
|
|||||||||||||
| Accounts payable |
5,891 | — | — | — | 5,891 | 5,891 | ||||||||||||||||||
| Short-term borrowings |
1,478 | — | — | — | 1,478 | 1,476 | ||||||||||||||||||
| Long-term borrowings* |
4,600 | — | — | — | 4,600 | 4,376 | ||||||||||||||||||
| Other financial liabilities - current |
462 | — | 89 | 372 | 923 | 923 | ||||||||||||||||||
| Other financial liabilities - non-current |
651 | — | 20 | 452 | 1,123 | 1,080 | ||||||||||||||||||
|
|
|
|
|
|
|
|
|
|
|
|
|
|||||||||||||
| Total financial liabilities |
13,082 | — | 109 | 824 | 14,015 | 13,746 | ||||||||||||||||||
|
|
|
|
|
|
|
|
|
|
|
|
|
|||||||||||||
| * | Included in the long-term borrowings shown in other financial liabilities is £438 million that is designated as the hedged item in a fair value hedge relationship. Included within long-term borrowings is £(132) million of fair value adjustments of which £(106) million relates to the ongoing hedge relationship and £(26) million relates to hedge relationships that were discontinued during the year ended 31 March 2023. Included in the long-term borrowings is £968 million that is designated as a hedging instrument in a cash flow hedge relationship. |
29
Notes (forming part of the condensed consolidated interim financial statements)
| 22 | Financial instruments (continued) |
| Fair Value Through Profit and Loss | ||||||||||||||||||||||||
| As at 30 September 2022 |
Amortised cost |
Financial assets |
Derivatives other than in hedging relationship |
Derivatives in hedging relationship |
Total carrying value |
Total fair value |
||||||||||||||||||
| Cash and cash equivalents |
3,555 | — | — | — | 3,555 | 3,555 | ||||||||||||||||||
| Short-term deposits and other investments |
161 | — | — | — | 161 | 161 | ||||||||||||||||||
| Trade receivables |
810 | — | — | — | 810 | 810 | ||||||||||||||||||
| Other non-current investments |
— | 43 | — | — | 43 | 43 | ||||||||||||||||||
| Other financial assets - current |
279 | — | 91 | 117 | 487 | 487 | ||||||||||||||||||
| Other financial assets - non-current |
81 | — | 268 | 23 | 372 | 372 | ||||||||||||||||||
|
|
|
|
|
|
|
|
|
|
|
|
|
|||||||||||||
| Total financial assets |
4,886 | 43 | 359 | 140 | 5,428 | 5,428 | ||||||||||||||||||
|
|
|
|
|
|
|
|
|
|
|
|
|
|||||||||||||
| Accounts payable |
5,216 | — | — | — | 5,216 | 5,216 | ||||||||||||||||||
| Short-term borrowings |
1,908 | — | — | — | 1,908 | 1,887 | ||||||||||||||||||
| Long-term borrowings* |
5,574 | — | — | — | 5,574 | 4,779 | ||||||||||||||||||
| Other financial liabilities - current |
418 | — | 90 | 877 | 1,385 | 1,385 | ||||||||||||||||||
| Other financial liabilities - non-current |
698 | — | 22 | 1,254 | 1,974 | 1,837 | ||||||||||||||||||
|
|
|
|
|
|
|
|
|
|
|
|
|
|||||||||||||
| Total financial liabilities |
13,814 | — | 112 | 2,131 | 16,057 | 15,104 | ||||||||||||||||||
|
|
|
|
|
|
|
|
|
|
|
|
|
|||||||||||||
| * | Included in the long-term borrowings shown in other financial liabilities is £440 million that is designated as the hedged item in a fair value hedge relationship. Included within long-term borrowings is £(126) million of fair value adjustments of which £(97) million relates to the ongoing hedge relationship and £(29) million relates to hedge relationships that were discontinued during the period ended 30 September 2022. |
The following tables show the levels in the fair value hierarchy for financial assets and liabilities where the carrying value is not a reasonable approximation of fair value.
| £ millions |
As at 30 September 2023 | |||||||||||||||
| Level 1 | Level 2 | Level 3 | Total | |||||||||||||
| Financial assets measured at fair value |
||||||||||||||||
| Investments |
— | — | 51 | 51 | ||||||||||||
| Derivative assets |
— | 286 | — | 286 | ||||||||||||
|
|
|
|
|
|
|
|
|
|||||||||
| Total |
— | 286 | 51 | 337 | ||||||||||||
|
|
|
|
|
|
|
|
|
|||||||||
| Financial liabilities measured at fair value |
||||||||||||||||
| Derivative liabilities |
— | 737 | — | 737 | ||||||||||||
|
|
|
|
|
|
|
|
|
|||||||||
| Total |
— | 737 | — | 737 | ||||||||||||
|
|
|
|
|
|
|
|
|
|||||||||
| Financial liabilities not measured at fair value |
||||||||||||||||
| Borrowings |
3,631 | 2,141 | — | 5,772 | ||||||||||||
|
|
|
|
|
|
|
|
|
|||||||||
| Total |
3,631 | 2,141 | — | 5,772 | ||||||||||||
|
|
|
|
|
|
|
|
|
|||||||||
| £ millions |
As at 31 March 2023 | |||||||||||||||
| Level 1 | Level 2 | Level 3 | Total | |||||||||||||
| Financial assets measured at fair value |
||||||||||||||||
| Investments |
— | — | 43 | 43 | ||||||||||||
| Derivative assets |
— | 172 | — | 172 | ||||||||||||
|
|
|
|
|
|
|
|
|
|||||||||
| Total |
— | 172 | 43 | 215 | ||||||||||||
|
|
|
|
|
|
|
|
|
|||||||||
| Financial liabilities measured at fair value |
||||||||||||||||
| Derivative liabilities |
— | 933 | — | 933 | ||||||||||||
|
|
|
|
|
|
|
|
|
|||||||||
| Total |
— | 933 | — | 933 | ||||||||||||
|
|
|
|
|
|
|
|
|
|||||||||
| Financial liabilities not measured at fair value |
||||||||||||||||
| Borrowings |
3,840 | 2,012 | — | 5,852 | ||||||||||||
|
|
|
|
|
|
|
|
|
|||||||||
| Total |
3,840 | 2,012 | — | 5,852 | ||||||||||||
|
|
|
|
|
|
|
|
|
|||||||||
30
Notes (forming part of the condensed consolidated interim financial statements)
| 22 | Financial instruments (continued) |
| £ millions |
As at 30 September 2022 | |||||||||||||||
| Level 1 | Level 2 | Level 3 | Total | |||||||||||||
| Financial assets measured at fair value |
||||||||||||||||
| Investments |
— | — | 43 | 43 | ||||||||||||
| Derivative assets |
— | 499 | — | 499 | ||||||||||||
|
|
|
|
|
|
|
|
|
|||||||||
| Total |
— | 499 | 43 | 542 | ||||||||||||
|
|
|
|
|
|
|
|
|
|||||||||
| Financial liabilities measured at fair value |
||||||||||||||||
| Derivative liabilities |
— | 2,243 | — | 2,243 | ||||||||||||
|
|
|
|
|
|
|
|
|
|||||||||
| Total |
— | 2,243 | — | 2,243 | ||||||||||||
|
|
|
|
|
|
|
|
|
|||||||||
| Financial liabilities not measured at fair value |
||||||||||||||||
| Borrowings |
4,313 | 2,353 | — | 6,666 | ||||||||||||
|
|
|
|
|
|
|
|
|
|||||||||
| Total |
4,313 | 2,353 | — | 6,666 | ||||||||||||
|
|
|
|
|
|
|
|
|
|||||||||
Reconciliation of level 3 fair values
The following table gives a reconciliation of the movements in level 3 financial assets held at fair value.
| £ millions |
Six months ended | |||||||
| 30 September 2023 |
30 September 2022 |
|||||||
| Balance at 1 April |
43 | 30 | ||||||
| Purchased during the period |
3 | 3 | ||||||
| Fair value gain |
4 | 11 | ||||||
| Currency translation |
1 | (1 | ) | |||||
|
|
|
|
|
|||||
| Balance at 30 September |
51 | 43 | ||||||
|
|
|
|
|
|||||
| 23 | Other reserves |
The movement in reserves is as follows:
| £ millions |
Translation reserve |
Hedging reserve |
Cost of hedging reserve |
Retained earnings |
Total other reserves |
|||||||||||||||
| Balance at 1 April 2023 |
(320 | ) | (608 | ) | (34 | ) | 3,533 | 2,571 | ||||||||||||
| Profit for the period |
— | — | — | 595 | 595 | |||||||||||||||
| Remeasurement of defined benefit obligation |
— | — | — | (127 | ) | (127 | ) | |||||||||||||
| Gain on effective cash flow hedges |
— | 215 | 33 | — | 248 | |||||||||||||||
| Income tax related to items recognised in other comprehensive income |
— | 53 | (1 | ) | 32 | 84 | ||||||||||||||
| Cash flow hedges reclassified to profit and loss |
— | 41 | (7 | ) | — | 34 | ||||||||||||||
| Income tax related to items reclassified to profit or loss |
— | (10 | ) | 2 | — | (8 | ) | |||||||||||||
| Amounts removed from hedge reserve and recognised in inventory |
— | 2 | — | — | 2 | |||||||||||||||
| Income tax related to amounts removed from hedge reserve and recognised in inventory |
— | (1 | ) | — | — | (1 | ) | |||||||||||||
| Currency translation differences |
(25 | ) | — | — | — | (25 | ) | |||||||||||||
|
|
|
|
|
|
|
|
|
|
|
|||||||||||
| Balance at 30 September 2023 |
(345 | ) | (308 | ) | (7 | ) | 4,033 | 3,373 | ||||||||||||
|
|
|
|
|
|
|
|
|
|
|
|||||||||||
31
Notes (forming part of the condensed consolidated interim financial statements)
| 23 | Other reserves (continued) |
| £ millions |
Translation reserve |
Hedging reserve |
Cost of hedging reserve |
Retained earnings |
Total other reserves |
|||||||||||||||
| Balance at 1 April 2022 |
(333 | ) | (454 | ) | 19 | 3,603 | 2,835 | |||||||||||||
| Loss for the period |
— | — | — | (580 | ) | (580 | ) | |||||||||||||
| Remeasurement of defined benefit obligation |
— | — | — | 437 | 437 | |||||||||||||||
| Loss on effective cash flow hedges |
— | (1,743 | ) | (1 | ) | — | (1,744 | ) | ||||||||||||
| Income tax related to items recognised in other comprehensive income |
— | 64 | 4 | (109 | ) | (41 | ) | |||||||||||||
| Cash flow hedges reclassified to profit and loss |
— | 260 | (8 | ) | — | 252 | ||||||||||||||
| Income tax related to items reclassified to profit or loss |
— | (48 | ) | 1 | — | (47 | ) | |||||||||||||
| Amounts removed from hedge reserve and recognised in inventory |
— | 48 | 5 | — | 53 | |||||||||||||||
| Income tax related to amounts removed from hedge reserve and recognised in inventory |
— | (9 | ) | (1 | ) | — | (10 | ) | ||||||||||||
| Currency translation differences |
44 | — | — | — | 44 | |||||||||||||||
|
|
|
|
|
|
|
|
|
|
|
|||||||||||
| Balance at 30 September 2022 |
(289 | ) | (1,882 | ) | 19 | 3,351 | 1,199 | |||||||||||||
|
|
|
|
|
|
|
|
|
|
|
|||||||||||
| 24 | Dividends |
During the six-month periods ended 30 September 2023 and 30 September 2022, no ordinary share dividends were proposed or paid.
| 25 | Employee benefits |
The Group has pension arrangements providing employees with defined benefits related to pay and service as set out in the rules of each scheme. The following table sets out the disclosure pertaining to employee benefits of the JLR Automotive Group plc which operates defined benefit pension schemes.
| £ millions |
Six months ended | |||||||
| 30 September 2023 | 30 September 2022 | |||||||
| Change in present value of defined benefit obligation |
||||||||
| Defined benefit obligation at beginning of period |
5,089 | 7,522 | ||||||
| Current service cost |
32 | 43 | ||||||
| Past service credit |
— | (155 | ) | |||||
| Interest expense |
119 | 104 | ||||||
| Actuarial (gains)/losses arising from: |
||||||||
| Changes in demographic assumptions |
(78 | ) | — | |||||
| Changes in financial assumptions |
(509 | ) | (2,484 | ) | ||||
| Experience adjustments |
43 | 115 | ||||||
| Exchange differences on foreign schemes |
(1 | ) | 2 | |||||
| Member contributions |
— | 1 | ||||||
| Benefits paid |
(104 | ) | (253 | ) | ||||
|
|
|
|
|
|||||
| Defined benefit obligation at end of period |
4,591 | 4,895 | ||||||
|
|
|
|
|
|||||
| Change in fair value of scheme assets |
||||||||
| Fair value of schemes’ assets at beginning of period |
5,726 | 7,931 | ||||||
| Interest income |
135 | 117 | ||||||
| Remeasurement loss on the return of plan assets, excluding amounts included in interest income |
(671 | ) | (1,932 | ) | ||||
| Administrative expenses |
(5 | ) | (14 | ) | ||||
| Employer contributions |
40 | 80 | ||||||
| Member contributions |
— | 1 | ||||||
| Benefits paid |
(104 | ) | (253 | ) | ||||
|
|
|
|
|
|||||
| Fair value of schemes’ assets at end of period |
5,121 | 5,930 | ||||||
|
|
|
|
|
|||||
32
Notes (forming part of the condensed consolidated interim financial statements)
| 25 | Employee benefits (continued) |
The principal assumptions used in accounting for the pension schemes are set out below:
| As at |
30 September 2023 | 30 September 2022 | ||||||
| Discount rate |
5.6 | % | 5.2 | % | ||||
| Expected rate of increase in benefit revaluation of covered employees |
2.0 | % | 2.1 | % | ||||
| RPI inflation rate |
3.1 | % | 3.4 | % | ||||
| CPI Inflation rate (capped at 5% p.a.) |
2.6 | % | 2.8 | % | ||||
| CPI Inflation rate (capped at 2.5% p.a.) |
1.8 | % | 1.9 | % | ||||
Amounts recognised in the condensed consolidated balance sheet consist of:
| As at (£ millions) |
30 September 2023 | 31 March 2023 | 30 September 2022 | |||||||||
| Present value of defined benefit obligations |
(4,591 | ) | (5,089 | ) | (4,895 | ) | ||||||
| Fair value of schemes’ assets |
5,121 | 5,726 | 5,930 | |||||||||
|
|
|
|
|
|
|
|||||||
| Net asset |
530 | 637 | 1,035 | |||||||||
|
|
|
|
|
|
|
|||||||
| Non-current assets |
552 | 659 | 1,062 | |||||||||
| Non-current liabilities |
(22 | ) | (22 | ) | (27 | ) | ||||||
In June 2023, the Group was informed that one of the investments held by the UK DB pension schemes has been revalued by the fund’s independent valuation agent and that the valuation of the holding as of 31 March 2023, across the schemes, has been reduced by £78 million to £73 million. This change in asset value is included in OCI as part of the asset and liability movements for the six month period ended 30 September 2023.
For the valuations at 30 September 2023 the mortality assumptions used are the SAPS base table, in particular S3 tables and the Light table for members of the Jaguar Executive Pension Plan.
| • | For the Jaguar Pension Plan, scaling factors of 101 per cent to 115 per cent have been used for male members and scaling factors of 103 per cent to 118 per cent have been used for female members. |
| • | For the Land Rover Pension Scheme, scaling factors of 105 per cent to 117 per cent have been used for male members and scaling factors of 100 per cent to 116 per cent have been used for female members. |
| • | For the Jaguar Executive Pension Plan, an average scaling factor of 93 per cent to 97 per cent has been used for male members and 91 per cent to 96 per cent has been used for female members. |
For the valuations at 31 March 2023 the mortality assumptions used are the SAPS base table, in particular S3 tables and the Light table for members of the Jaguar Executive Pension Plan.
| • | For the Jaguar Pension Plan, scaling factors of 101 per cent to 115 per cent have been used for male members and scaling factors of 103 per cent to 118 per cent have been used for female members. |
| • | For the Land Rover Pension Scheme, scaling factors of 105 per cent to 117 per cent have been used for male members and scaling factors of 100 per cent to 116 per cent have been used for female members. |
| • | For the Jaguar Executive Pension Plan, an average scaling factor of 93 per cent to 97 per cent has been used for male members and 91 per cent to 96 per cent has been used for female members. |
For the valuations at 30 September 2022, the mortality assumptions used are the SAPS base table, in particular S3 tables and the Light table for members of the Jaguar Executive Pension Plan.
| • | For the Jaguar Pension Plan, scaling factors of 101 per cent to 115 per cent were used for male members and 103 per cent to 118 per cent for female members. |
| • | For the Land Rover Pension Scheme, scaling factors of 105 per cent to 117 per cent were used for male members and 100 per cent to 116 per cent for female members. |
| • | For the Jaguar Executive Pension Plan, scaling factors of 93 per cent to 97 per cent were used for male members and 91 per cent to 96 per cent for female members. |
For 30 September 2023 period end calculations there is an allowance for future improvements in line with the CMI (2022) projections and an allowance for long-term improvements of 1.25 per cent per annum and a smoothing parameter of 7.0 (31 March 2023: CMI (2021) projections with 1.25 per cent per annum improvements and a smoothing parameter of 7.5, 30 September 2022: CMI (2021) projections with 1.25 per cent per annum improvements and a smoothing parameter of 7.5).
33
Notes (forming part of the condensed consolidated interim financial statements)
| 26 | Commitments and contingencies |
The following includes a description of contingencies and commitments. The Group assesses such commitments and claims as well as monitors the legal environment on an ongoing basis, with the assistance of external legal counsel wherever necessary. The Group records a liability for any claims where a potential loss is probable and capable of being estimated and disclosures such matters in the financial statements, if material. For potential losses that are considered possible, but not probable, the Group provides disclosure in the consolidated financial statements but does not record a liability unless the loss becomes probable. Such potential losses may be of uncertain timing and / or amounts.
| As at (£ millions) |
30 September 2023 | 31 March 2023 | 30 September 2022* | |||||||||
| Contingencies: |
||||||||||||
| - Third party claims and obligations |
316 | 601 | 397 | |||||||||
| - Taxes and duties |
58 | 61 | 82 | |||||||||
| - Other |
126 | 121 | 129 | |||||||||
| Commitments: |
||||||||||||
| - Plant and equipment |
489 | 386 | 750 | |||||||||
| - Intangible assets |
21 | 15 | 17 | |||||||||
| Pledged as collateral/security against the borrowings and commitments: |
||||||||||||
| - Inventory |
— | — | — | |||||||||
| - Trade receivables |
— | — | — | |||||||||
| - Property, plant and equipment |
— | — | — | |||||||||
| - Other financial assets |
29 | 20 | 14 | |||||||||
| * | The comparatives at 30 September 2022 have been re-presented to align with presentation changes made during the year ended 31 March 2023. Litigation and product related amounts disclosed in previous periods, in addition to third party claims previously disclosed under Other, are now presented together in Third party claims and obligations. This has not resulted in any change to total contingent liabilities and commitments disclosed. |
Contingencies
Contingencies related to legal and constructive obligations to third parties. There are claims and obligations against the Group which management has not recognised, as settlement is not considered probable. These claims and obligations relate primarily to the following:
| - | Third party claims and obligations primarily supplier claims; |
| - | Tax and duty; |
| - | Other including consumer complaints, retailer terminations, employment cases and personal injury claims. |
The decrease in the period is driven mainly by supplier claims related to ongoing negotiations and lower levels of new claims.
Commitments
The Group has entered into various contracts with vendors and contractors for the acquisition of plants and equipment and various civil contracts of a capital nature and the acquisition of intangible assets.
Joint venture
Stipulated within the joint venture agreement for Chery Jaguar Land Rover Automotive Company Ltd., and subsequently amended by a change to the Articles of Association of Chery Jaguar Land Rover Automotive Company Ltd. is a commitment for the Group to contribute a total of CNY 5,000 million of capital. Of this amount, CNY 3,475 million has been contributed as at 30 September 2023. The outstanding commitment of CNY 1,525 million translates to £171 million at the 30 September 2023 exchange rate (30 September 2022: £193 million at the September 2022 exchange rate).
The Group’s share of capital commitments of its joint venture at 30 September 2023 is £7 million (31 March 2023: £12 million, 30 September 2022: £16 million) and contingent liabilities of its joint venture 30 September 2023 is £1 million (31 March 2023 and 30 September 2022: £nil).
34
Notes (forming part of the condensed consolidated interim financial statements)
| 27 | Capital Management |
The Group’s objectives when managing capital are to ensure the going concern operation of all subsidiary companies within the Group and to maintain an efficient capital structure to support ongoing and future operations of the Group and to meet shareholder expectations.
The Group issues debt, primarily in the form of bonds, to meet anticipated funding requirements and maintain sufficient liquidity. The Group also maintains certain undrawn committed credit facilities to provide additional liquidity. These borrowings, together with cash generated from operations, are loaned internally or contributed as equity to certain subsidiaries as required. Surplus cash in subsidiaries is pooled (where practicable) and invested to satisfy security, liquidity and yield requirements.
The capital structure and funding requirements are regularly monitored by the JLR plc Board to ensure sufficient liquidity is maintained by the Group. All debt issuance and capital distributions are approved by the JLR plc Board.
The following table summarises the capital of the Group:
| As at (£ millions) |
30 September 2023 | 31 March 2023 | 30 September 2022 | |||||||||
| Short-term debt |
1,412 | 1,548 | 1,973 | |||||||||
| Long-term debt |
5,130 | 5,240 | 6,243 | |||||||||
|
|
|
|
|
|
|
|||||||
| Total debt* |
6,542 | 6,788 | 8,216 | |||||||||
|
|
|
|
|
|
|
|||||||
| Equity attributable to shareholders |
5,041 | 4,239 | 2,867 | |||||||||
|
|
|
|
|
|
|
|||||||
| Total capital |
11,583 | 11,027 | 11,083 | |||||||||
|
|
|
|
|
|
|
|||||||
| * | Total debt includes lease obligations of £693 million (31 March 2023: £710 million, 30 September 2022: £734 million). |
| 28 | Notes to the consolidated cash flow statement |
Reconciliation of profit/(loss) for the period to cash used in operations
| Three months ended | Six months ended | |||||||||||||||
| £ millions |
30 September 2023 | 30 September 2022 Restated* |
30 September 2023 | 30 September 2022 Restated* |
||||||||||||
| Cash flows from operating activities |
||||||||||||||||
| Profit/(loss) for the period |
272 | (98 | ) | 595 | (580 | ) | ||||||||||
| Adjustments for: |
||||||||||||||||
| Depreciation and amortisation |
525 | 509 | 1,063 | 1,000 | ||||||||||||
| Loss on disposal of assets |
13 | — | 25 | 2 | ||||||||||||
| Income tax expense/(credit) |
170 | (75 | ) | 282 | 38 | |||||||||||
| Finance expense (net) |
125 | 123 | 256 | 237 | ||||||||||||
| Finance income |
(41 | ) | (11 | ) | (74 | ) | (18 | ) | ||||||||
| Foreign exchange on debt, derivatives and balance sheet revaluation |
11 | 116 | (2 | ) | 230 | |||||||||||
| Unrealised (gain)/ loss on commodities |
(35 | ) | 8 | 43 | 117 | |||||||||||
| Share of profit of equity accounted investments |
(5 | ) | (6 | ) | (15 | ) | (8 | ) | ||||||||
| Fair value gain on equity investments |
(1 | ) | (9 | ) | (4 | ) | (11 | ) | ||||||||
| Exceptional items |
— | — | — | (155 | ) | |||||||||||
| Other non-cash adjustments |
7 | (1 | ) | 3 | — | |||||||||||
|
|
|
|
|
|
|
|
|
|||||||||
| Cash flows from operating activities before changes in assets and liabilities |
1,041 | 556 | 2,172 | 852 | ||||||||||||
|
|
|
|
|
|
|
|
|
|||||||||
| Trade receivables and other assets |
(176 | ) | (9 | ) | (185 | ) | (529 | ) | ||||||||
| Other financial assets |
11 | 15 | (9 | ) | 1 | |||||||||||
| Inventories |
184 | (110 | ) | (267 | ) | (468 | ) | |||||||||
| Accounts payable, other liabilities and retirement benefit obligations |
(80 | ) | (234 | ) | 366 | 82 | ||||||||||
| Other financial liabilities |
(22 | ) | 23 | (49 | ) | 67 | ||||||||||
| Provisions |
7 | 175 | 81 | 77 | ||||||||||||
|
|
|
|
|
|
|
|
|
|||||||||
| Cash generated from operations |
965 | 416 | 2,109 | 82 | ||||||||||||
|
|
|
|
|
|
|
|
|
|||||||||
| * | See note 1 for details of restatement as a result of a change in accounting policy. |
35
Notes (forming part of the condensed consolidated interim financial statements)
| 28 | Notes to the consolidated cash flow statement (continued) |
Reconciliation of movements of liabilities to cash flows arising from financing activities
| £ millions |
Borrowings | Lease obligations |
Interest accrued |
Total | ||||||||||||
| Balance at 1 April 2022 |
7,027 | 570 | 95 | 7,692 | ||||||||||||
| Cash flows |
||||||||||||||||
| Proceeds from issue of financing |
594 | — | — | 594 | ||||||||||||
| Repayment of financing |
(719 | ) | (35 | ) | — | (754 | ) | |||||||||
| Interest paid |
— | (26 | ) | (152 | ) | (178 | ) | |||||||||
| Non-cash movements |
||||||||||||||||
| Issue of new leases |
— | 175 | — | 175 | ||||||||||||
| Interest accrued |
— | 26 | 157 | 183 | ||||||||||||
| Foreign exchange |
633 | 25 | 11 | 669 | ||||||||||||
| Lease terminations |
— | (1 | ) | — | (1 | ) | ||||||||||
| Fee amortisation |
6 | — | — | 6 | ||||||||||||
| Fair value adjustment on loans |
(59 | ) | — | — | (59 | ) | ||||||||||
|
|
|
|
|
|
|
|
|
|||||||||
| Balance at 30 September 2022 |
7,482 | 734 | 111 | 8,327 | ||||||||||||
|
|
|
|
|
|
|
|
|
|||||||||
| Balance at 1 April 2023 |
6,078 | 710 | 95 | 6,883 | ||||||||||||
| Cash flows |
||||||||||||||||
| Repayment of financing |
(195 | ) | (35 | ) | — | (230 | ) | |||||||||
| Interest paid |
— | (28 | ) | (177 | ) | (205 | ) | |||||||||
| Non-cash movements |
||||||||||||||||
| Issue of new leases |
— | 22 | — | 22 | ||||||||||||
| Interest accrued |
— | 28 | 186 | 214 | ||||||||||||
| Other lease modification |
— | 5 | — | 5 | ||||||||||||
| Foreign exchange |
(35 | ) | (7 | ) | — | (42 | ) | |||||||||
| Lease terminations |
— | (2 | ) | — | (2 | ) | ||||||||||
| Fee amortisation |
5 | — | — | 5 | ||||||||||||
| Fair value adjustment on loans |
(4 | ) | — | — | (4 | ) | ||||||||||
|
|
|
|
|
|
|
|
|
|||||||||
| Balance at 30 September 2023 |
5,849 | 693 | 104 | 6,646 | ||||||||||||
|
|
|
|
|
|
|
|
|
|||||||||
Included within ‘finance expenses and fees paid’ in the condensed consolidated cash flow statement for the six months ended 30 September 2023 is £32 million (six months ended 30 September 2022: £38 million) of cash interest paid relating to other assets and liabilities not included in the reconciliation above.
36
Notes (forming part of the condensed consolidated interim financial statements)
| 29 | Related party transactions |
Tata Sons Private Limited is a company with significant influence over the Group’s ultimate parent company Tata Motors Limited. The Group’s related parties therefore include Tata Sons Private Limited, subsidiaries and joint ventures of Tata Sons Private Limited and subsidiaries, joint ventures and associates of Tata Motors Limited. The Group routinely enters into transactions with its related parties in the ordinary course of business, including transactions for the sale and purchase of products with its joint ventures, and IT and consultancy services received from subsidiaries of Tata Sons Private Limited.
All transactions with related parties are conducted under normal terms of business and all amounts outstanding are unsecured and will be settled in cash. Transactions and balances with the Group’s own subsidiaries are eliminated on consolidation.
The following tables summarise related party transactions and balances not eliminated in the consolidated condensed interim financial statements.
| Six months ended 30 September 2023 (£ millions) |
With joint ventures of the Group |
With associates of the Group and their subsidiaries |
With Tata Sons Private Limited and its subsidiaries and joint ventures |
With immediate or ultimate parent and its subsidiaries, joint ventures and associates |
||||||||||||
| Sale of products |
114 | — | — | 26 | ||||||||||||
| Purchase of goods |
21 | 76 | — | 67 | ||||||||||||
| Services received |
— | — | 143 | 56 | ||||||||||||
| Services rendered |
45 | — | 4 | 5 | ||||||||||||
| Dividends received |
2 | — | — | — | ||||||||||||
| Trade and other receivables |
27 | — | 5 | 66 | ||||||||||||
| Accounts payable |
7 | 4 | 25 | 37 | ||||||||||||
| Six months ended 30 September 2022 (£ millions) |
With joint ventures of the Group |
With associates of the Group and their subsidiaries |
With Tata Sons Private Limited and its subsidiaries and joint ventures |
With immediate or ultimate parent and its subsidiaries, joint ventures and associates |
||||||||||||
| Sale of products |
144 | — | 1 | 14 | ||||||||||||
| Purchase of goods |
50 | 32 | — | 45 | ||||||||||||
| Services received |
— | — | 91 | 44 | ||||||||||||
| Services rendered |
50 | — | — | 2 | ||||||||||||
| Trade and other receivables |
52 | — | — | 25 | ||||||||||||
| Accounts payable |
11 | 1 | 17 | 19 | ||||||||||||
Compensation of key management personnel
| £ millions | Six months ended | |||||||
| 30 September 2023 | 30 September 2022 | |||||||
| Key management personnel remuneration |
11 | 9 | ||||||
| 30 | Subsequent events |
In October 2023, the Group placed three of its USD and EUR bonds to tender for early redemption. As a result of the tender, on 18 October 2023, the Group repaid £79 million of its $650 million Senior Notes due 2028 for a purchase price of £72 million, £74 million of its $500 million Senior Notes due 2029 for a purchase price of £64 million and £175 million of its €500 million Senior Notes due 2026 for a purchase price of £178 million. The resulting gain of £14 million will be recognised in the Income Statement in the three month period ended 31 December 2023.
In addition, on 12 October 2023, the Group repaid RMB 2 billion (£225 million) of its RMB 5 billion syndicated rolling loan facility.
37
1 Year Tata Motors Chart |
1 Month Tata Motors Chart |

It looks like you are not logged in. Click the button below to log in and keep track of your recent history.
Support: +44 (0) 203 8794 460 | support@advfn.com
By accessing the services available at ADVFN you are agreeing to be bound by ADVFN's Terms & Conditions
 Hot Features