ADVFN Logo ADVFN

We could not find any results for:
Make sure your spelling is correct or try broadening your search.

Trending Now

Toplists

It looks like you aren't logged in.
Click the button below to log in and view your recent history.

Hot Features

Registration Strip Icon for monitor Customisable watchlists with full streaming quotes from leading exchanges, such as LSE, NASDAQ, NYSE, AMEX, Bovespa, BIT and more.

TCO Taubman Centers Inc

42.99
0.00 (0.00%)
10 Jan 2025 - Closed
Delayed by 15 minutes
Share Name Share Symbol Market Type
Taubman Centers Inc NYSE:TCO NYSE Common Stock
  Price Change % Change Share Price High Price Low Price Open Price Shares Traded Last Trade
  0.00 0.00% 42.99 0 00:00:00

Taubman Centers Announces Second Quarter Results

23/07/2009 10:06pm

PR Newswire (US)


Taubman Centers (NYSE:TCO)
Historical Stock Chart


From Jan 2020 to Jan 2025
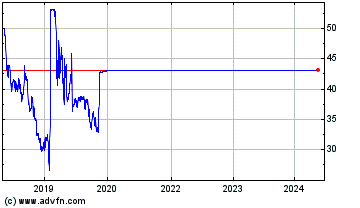
Click Here for more Taubman Centers Charts.
- Managing through Challenging Retail Environment - Results Consistent with Prior Guidance - Cost Saving Initiatives Contribute to Results - Strong Balance Sheet BLOOMFIELD HILLS, Mich., July 23 /PRNewswire-FirstCall/ -- Taubman Centers, Inc. (NYSE:TCO) today announced its financial results for the second quarter of 2009. (Logo: http://www.newscom.com/cgi-bin/prnh/20080428/CLM116LOGO ) Net income allocable to common shareholders per diluted share (EPS) was $0.17 for the quarter ended June 30, 2009, up from $0.01 for the quarter ended June 30, 2008. EPS for the six months ended June 30, 2009 was $0.38, up from $0.09 for the first six months of 2008. Taubman Centers' Funds from Operations (FFO) per diluted share was $0.65 for the quarter ended June 30, 2009 versus $0.66 for the quarter ended June 30, 2008. For the six months ended June 30, 2009, Taubman Centers' FFO per diluted share was $1.35 versus $1.34 for the first six months of 2008. Excluding the restructuring charge incurred in 2009, the company's Adjusted FFO per diluted share for the six months ended June 30, 2009 was $1.38, an increase of 3.0 percent from the first six months of 2008. "The environment for retail real estate continues to be challenging," said Robert S. Taubman, chairman, president and chief executive officer of Taubman Centers. "Lease cancellation income from our tenants offset a decline in rents. In addition, we are very focused on costs throughout our organization, which contributed to our results during the quarter." The company reported a four cent favorable variance in expenses for the quarter. Operating Statistics Ending occupancy for Taubman's portfolio was 88.6 percent on June 30, 2009 versus 90.1 percent on June 30, 2008, a decline primarily due to the closing in late 2008 of three big box store locations at the company's value centers, which were part of national bankruptcies. Average rent per square foot in the company's 16 consolidated properties for the second quarter of 2009 was $43.00, versus $44.40 for the second quarter of 2008. For the six months ended June 30, 2009, average rent per square foot in the consolidated properties was $44.02 versus $44.06 in the six months ended June 30, 2008. Mall tenant sales per square foot declined 11.2 percent from the second quarter of 2008. For the twelve months ended June 30, 2009, mall tenant sales per square foot were down 9.8 percent to $508 per square foot. "Weakness in the U.S. economy continues to impact retailers," said Mr. Taubman. "As expected, this was reflected in our operating results. Nonetheless, leasing continues to be active with retailers planning openings in 2010 and 2011, when they expect conditions to improve." Strong Balance Sheet "Our strong balance sheet is providing the operating flexibility to weather these tough conditions," said Lisa A. Payne, vice chairman and chief financial officer of Taubman Centers. "We have no debt maturities until the fall of 2010 and collectively through 2011, only about 13 percent of our share of total debt matures." The company's secured credit lines total $590 million and mature in 2011 with a one year extension option to 2012 on $550 million of the lines. As of June 30, $382 million was available for use. Guidance The company is modestly narrowing its guidance on 2009 FFO per diluted share from the previously announced $2.69 to $2.94 to $2.70 to $2.90. Excluding the restructuring charge that was recognized in 2009, the company expects 2009 Adjusted FFO per diluted share to be in the range of $2.73 to $2.93. The company also is modestly narrowing its guidance for 2009 EPS to $0.71 to $0.96. Supplemental Investor Information Available The company provides supplemental investor information along with its earnings announcements, available online at http://www.taubman.com/ under "Investor Relations." This includes the following: -- Income Statement -- Earnings Reconciliations -- Changes in Funds from Operations and Earnings Per Share -- Components of Other Income, Other Operating Expense, and Gains on Land Sales and Other Nonoperating Income -- Recoveries Ratio Analysis -- Balance Sheets -- Debt Summary -- Other Debt, Equity and Certain Balance Sheet Information -- Construction -- Capital Spending -- Operational Statistics -- Owned Centers -- Major Tenants in Owned Portfolio -- Anchors in Owned Portfolio Investor Conference Call The company will host a conference call at 11:00 a.m. (EDT) on July 24 to discuss these results, business conditions and the company's outlook for the remainder of 2009. The conference call will be simulcast at http://www.taubman.com/ under "Investor Relations" as well as http://www.earnings.com/ and http://www.streetevents.com/. An online replay will follow shortly after the call and continue for 90 days. Taubman Centers is a real estate investment trust engaged in the development and management of regional and super regional shopping centers. Taubman's 24 U.S. owned and/or managed properties, the most productive in the industry, serve major markets from coast to coast. The company's Taubman Asia subsidiary is working on retail projects in Macao, China and Incheon, South Korea. Taubman Centers is headquartered in Bloomfield Hills, Michigan. For more information about Taubman, visit http://www.taubman.com/. For ease of use, references in this press release to "Taubman Centers," "Taubman," or the "company" mean Taubman Centers, Inc. or one or more of a number of separate, affiliated entities. Business is actually conducted by an affiliated entity rather than Taubman Centers, Inc. itself. This press release may contain forward-looking statements within the meaning of Section 27A of the Securities Act of 1933, as amended, and Section 21E of the Securities Exchange Act of 1934, as amended. These statements reflect management's current views with respect to future events and financial performance. Actual results may differ materially from those expected because of various risks and uncertainties, including, but not limited to the ongoing U.S. recession, the existing global credit and financial crisis and other changes in general economic and real estate conditions, changes in the interest rate environment and the availability of financing, and adverse changes in the retail industry. Other risks and uncertainties are discussed in the company's filings with the Securities and Exchange Commission including its most recent Annual Report on Form 10-K. TAUBMAN CENTERS, INC. Table 1 - Summary of Results For the Periods Ended June 30, 2009 and 2008 -------------------------------------------- (in thousands of dollars, except as indicated) Three Months Ended Six Months Ended ------------------ ---------------- 2009 2008 (1) 2009 2008 (1) ---- -------- ---- -------- Net income (1), (2) 20,866 21,414 45,392 44,930 Noncontrolling share of income of consolidated joint ventures (1) (2,033) (1,130) (3,726) (2,306) Distributions in excess of noncontrolling share of income of consolidated joint ventures (1) (4,258) (6,395) Noncontrolling share of income of TRG (1) (5,290) (4,505) (11,876) (10,421) Distributions in excess of noncontrolling share of income of TRG (1) (6,513) (11,617) TRG preferred distributions (615) (615) (1,230) (1,230) Preferred stock dividends (3,659) (3,659) (7,317) (7,317) Distributions to participating securities of TRG (361) (361) (836) (724) Net income attributable to Taubman Centers, Inc. common shareowners (1) 8,908 373 20,407 4,920 Net income per common share - basic and diluted (1) 0.17 0.01 0.38 0.09 Beneficial interest in EBITDA -Consolidated Businesses (2), (3) 75,087 75,360 152,776 152,577 Beneficial interest in EBITDA -Unconsolidated Joint Ventures (3) 22,536 22,644 46,484 45,758 Funds from Operations (2), (3) 52,390 53,213 108,960 107,969 Funds from Operations attributable to TCO (2), (3) 34,968 35,421 72,726 71,824 Funds from Operations per common share - basic (2), (3) 0.66 0.67 1.37 1.36 Funds from Operations per common share -diluted (2), (3) 0.65 0.66 1.35 1.34 Weighted average number of common shares outstanding - basic 53,120,769 52,859,653 53,093,988 52,767,430 Weighted average number of common shares outstanding - diluted 53,666,868 53,431,974 53,466,563 53,348,232 Common shares outstanding at end of period 53,120,769 52,892,604 Weighted average units - Operating Partnership - basic 79,558,454 79,411,822 79,532,928 79,322,237 Weighted average units - Operating Partnership - diluted 80,975,814 80,855,405 80,776,764 80,774,301 Units outstanding at end of period - Operating Partnership 79,558,454 79,440,048 Ownership percentage of the Operating Partnership at end of period 66.8% 66.6% Number of owned shopping centers at end of period 23 23 23 23 Operating Statistics: Mall tenant sales (4) 994,811 1,116,027 1,936,280 2,199,635 Ending occupancy 88.6% 90.1% 88.6% 90.1% Average occupancy 88.7% 90.0% 88.8% 90.0% Leased space at end of period 91.1% 92.7% 91.1% 92.7% Mall tenant occupancy costs as a percentage of tenant sales - Consolidated Businesses (4) 16.7% 15.4% 17.5% 15.6% Mall tenant occupancy costs as a percentage of tenant sales - Unconsolidated Joint Ventures (4) 15.7% 13.7% 15.9% 13.8% Rent per square foot - Consolidated Businesses 43.00 44.40 44.02 44.06 Rent per square foot - Unconsolidated Joint Ventures 44.24 45.40 44.56 44.84 (1) In January of 2009, the Company adopted Statement No. 160 "Noncontrolling Interests in Consolidated Financial Statements - an amendment of ARB No. 51" (SFAS 160). Consequently, noncontrolling interests in consolidated subsidiaries with equity balances of less than zero are now allocated income equal to their ownership interests in the subsidiaries. Under previous accounting, because the net equity balances of the Operating Partnership and the outside partners in certain consolidated joint ventures were less than zero, the income attributable to the noncontrolling partners was equal to their share of distributions. The net equity of these noncontrolling partners is less than zero due to accumulated distributions in excess of net income and not as a result of operating losses. Net income attributable to Taubman Centers, Inc. common shareowners for the three and six months ended June 30, 2009 would have been $1.6 and $6.1 million, respectively or $0.03 and $0.11 per common share, respectively if accounted for under the previous method of accounting for noncontrolling interests prior to SFAS 160. Certain 2008 amounts within tables 1 to 6 of this press release have been reclassified to conform with 2009 classifications. (2) Includes $0.2 million and $2.6 million of restructuring charges for the three and six months ended June 30, 2009, respectively. No similar charges were incurred in 2008. (3) Beneficial Interest in EBITDA represents the Operating Partnership's share of the earnings before interest, income taxes, and depreciation and amortization of its consolidated and unconsolidated businesses. The Company believes Beneficial Interest in EBITDA provides a useful indicator of operating performance, as it is customary in the real estate and shopping center business to evaluate the performance of properties on a basis unaffected by capital structure. The National Association of Real Estate Investment Trusts (NAREIT) defines Funds from Operations (FFO) as net income (computed in accordance with Generally Accepted Accounting Principles (GAAP)), excluding gains from extraordinary items and sales of properties, plus real estate related depreciation and after adjustments for unconsolidated partnerships and joint ventures. The Company believes that FFO is a useful supplemental measure of operating performance for REITs. Historical cost accounting for real estate assets implicitly assumes that the value of real estate assets diminishes predictably over time. Since real estate values instead have historically risen or fallen with market conditions, the Company and most industry investors and analysts have considered presentations of operating results that exclude historical cost depreciation to be useful in evaluating the operating performance of REITs. FFO is primarily used by the Company in measuring performance and in formulating corporate goals and compensation. These non-GAAP measures as presented by the Company are not necessarily comparable to similarly titled measures used by other REITs due to the fact that not all REITs use common definitions. None of these non-GAAP measures should be considered alternatives to net income as an indicator of the Company's operating performance, and they do not represent cash flows from operating, investing, or financing activities as defined by GAAP. (4) Based on reports of sales furnished by mall tenants. TAUBMAN CENTERS, INC. Table 2 - Income Statement For the Three Months Ended June 30, 2009 and 2008 --------------------------------------------------- (in thousands of dollars) 2009 2008 (1) ---- -------- UNCONSOL- UNCONSOL- IDATED IDATED CONSOLIDATED JOINT CONSOLIDATED JOINT BUSINESSES VENTURES (2) BUSINESSES VENTURES (2) ------------ ------------ ------------ ------------ REVENUES: Minimum rents 84,016 38,553 87,583 38,797 Percentage rents 561 95 1,325 458 Expense recoveries 58,525 23,819 60,384 21,664 Management, leasing, and development services 3,189 3,891 Other 12,648 1,187 7,229 2,578 ------ ----- ----- ----- Total revenues 158,939 63,654 160,412 63,497 EXPENSES: Maintenance, taxes, and utilities 46,946 16,296 46,485 16,080 Other operating 16,352 5,965 19,695 5,587 Restructuring charge (3) 169 Management, leasing, and development services 1,930 2,421 General and administrative 6,847 7,943 Interest expense 36,473 16,120 35,972 16,278 Depreciation and amortization 36,058 9,911 36,179 9,839 ------ ----- ------ ----- Total expenses 144,775 48,292 148,695 47,784 Gains on land sales and other nonoperating income 198 3 1,456 160 Impairment loss on marketable securities (4) (1,666) ------ ------ ------ ------ 12,696 15,365 13,173 15,873 ====== ====== Income tax expense (198) (250) Equity in income of Unconsolidated Joint Ventures 8,368 8,491 ----- ----- Net income 20,866 21,414 Net income attributable to noncontrolling interests: Noncontrolling share of income of consolidated joint ventures (2,033) (1,130) Distributions in excess of noncontrolling share of income of consolidated joint ventures (4,258) TRG series F preferred distributions (615) (615) Noncontrolling share of income of TRG (5,290) (4,505) Distributions in excess of noncontrolling share of income of TRG (6,513) Distributions to participating securities of TRG (361) (361) Preferred stock dividends (3,659) (3,659) ------ ------ Net income attributable to Taubman Centers, Inc. common shareowners 8,908 373 ===== === SUPPLEMENTAL INFORMATION: EBITDA - 100% (3) 85,227 41,396 85,324 41,990 EBITDA - outside partners' share (3) (10,140) (18,860) (9,964) (19,346) ------- ------- ------ ------- Beneficial interest in EBITDA (3) 75,087 22,536 75,360 22,644 Beneficial interest expense (31,538) (8,369) (31,065) (8,457) Beneficial income tax expense (198) (250) Non-real estate depreciation (854) (745) Preferred dividends and distributions (4,274) (4,274) ------ ------ ------ ------ Funds from Operations contribution (3) 38,223 14,167 39,026 14,187 ====== ====== ====== ====== Net straightline adjustments to rental revenue, recoveries, and ground rent expense at TRG % 80 104 475 52 == === === == (1) Certain amounts have been reclassified to conform to 2009 classifications. (2) With the exception of the Supplemental Information, amounts include 100% of the Unconsolidated Joint Ventures. Amounts are net of intercompany transactions. The Unconsolidated Joint Ventures are presented at 100% in order to allow for measurement of their performance as a whole, without regard to the Company's ownership interest. The Company accounts for its investments in the Unconsolidated Joint Ventures under the equity method. (3) In 2009, the Company recognized a restructuring charge which primarily represents the costs of termination of personnel. (4) The marketable securities represent shares in a Vanguard REIT fund that were purchased to facilitate a tax efficient structure for the 2005 disposition of Woodland mall. Until now, the Company marked to market this investment through other comprehensive income on the balance sheet. The Company concluded this quarter that the impairment is no longer temporary, and therefore recognized a loss through its income statement. The balance of the securities was $1.2 million as of June 30, 2009, and is included in Deferred Charges and Other Assets. To preserve the original tax planning it continues to be necessary to carry this investment. There are no other assets of this type on the Company's balance sheet. TAUBMAN CENTERS, INC. Table 3 - Income Statement For the Six Months Ended June 30, 2009 and 2008 ------------------------------------------------- (in thousands of dollars) 2009 2008 (1) ---- -------- UNCONSOL- UNCONSOL- IDATED IDATED CONSOLIDATED JOINT CONSOLIDATED JOINT BUSINESSES VENTURES (2) BUSINESSES VENTURES (2) ------------ ------------ ------------ ------------ REVENUES: Minimum rents 171,452 77,520 174,153 77,208 Percentage rents 2,721 1,203 3,900 1,919 Expense recoveries 115,283 47,645 117,848 44,078 Management, leasing, and development services 6,745 7,585 Other 20,428 3,376 14,343 4,366 ------ ----- ------ ----- Total revenues 316,629 129,744 317,829 127,571 EXPENSES: Maintenance, taxes, and utilities 91,487 32,333 90,025 31,428 Other operating 31,317 12,353 37,996 12,134 Restructuring charge (3) 2,630 Management, leasing, and development services 3,836 4,678 General and administrative 13,735 16,276 Interest expense 72,706 32,070 72,954 32,153 Depreciation and amortization 72,351 19,348 71,514 19,462 ------ ------ ------ ------ Total expenses 288,062 96,104 293,443 95,177 Gains on land sales and other nonoperating income 433 57 3,259 479 Impairment loss on marketable securities (4) (1,666) ------ ------ ------ ------ 27,334 33,697 27,645 32,873 ====== ====== Income tax expense (468) (440) Equity in income of Unconsolidated Joint Ventures 18,526 17,725 ------ ------ Net income 45,392 44,930 Net income attributable to noncontrolling interests: Noncontrolling share of income of consolidated joint ventures (3,726) (2,306) Distributions in excess of noncontrolling share of income of consolidated joint ventures (6,395) TRG series F preferred distributions (1,230) (1,230) Noncontrolling share of income of TRG (11,876) (10,421) Distributions in excess of noncontrolling share of income of TRG (11,617) Distributions to participating securities of TRG (836) (724) Preferred stock dividends (7,317) (7,317) ------ ------ Net income attributable to Taubman Centers, Inc. common shareowners 20,407 4,920 ====== ===== SUPPLEMENTAL INFORMATION: EBITDA - 100% (3) 172,391 85,115 172,113 84,488 EBITDA - outside partners' share (3) (19,615) (38,631) (19,536) (38,730) ------- ------- ------- ------- Beneficial interest in EBITDA (3) 152,776 46,484 152,577 45,758 Beneficial interest expense (62,898) (16,653) (63,219) (16,719) Beneficial income tax expense (468) (440) Non-real estate depreciation (1,734) (1,441) Preferred dividends and distributions (8,547) (8,547) ------ ------ ------ ------ Funds from Operations contribution (3) 79,129 29,831 78,930 29,039 ====== ====== ====== ====== Net straightline adjustments to rental revenue, recoveries, and ground rent expense at TRG % 159 159 1,068 113 === === ===== === (1) Certain amounts have been reclassified to conform to 2009 classifications. (2) With the exception of the Supplemental Information, amounts include 100% of the Unconsolidated Joint Ventures. Amounts are net of intercompany transactions. The Unconsolidated Joint Ventures are presented at 100% in order to allow for measurement of their performance as a whole, without regard to the Company's ownership interest. In its consolidated financial statements, the Company accounts for its investments in the Unconsolidated Joint Ventures under the equity method. (3) In 2009, the Company recognized restructuring charges, which primarily represent the costs of termination of personnel. (4) The marketable securities represent shares in a Vanguard REIT fund that were purchased to facilitate a tax efficient structure for the 2005 disposition of Woodland mall. Until now, the Company marked to market this investment through other comprehensive income on the balance sheet. The Company concluded this quarter that the impairment is no longer temporary, and therefore recognized a loss through its income statement. The balance of the securities was $1.2 million as of June 30, 2009, and is included in Deferred Charges and Other Assets. To preserve the original tax planning it continues to be necessary to carry this investment. There are no other assets of this type on the Company's balance sheet. TAUBMAN CENTERS, INC. Table 4 - Reconciliation of Net Income Attributable to Taubman Centers, Inc. Common Shareowners to Funds from Operations and Adjusted Funds from Operations For the Periods Ended June 30, 2009 and 2008 -------------------------------------------- (in thousands of dollars; amounts attributable to TCO may not recalculate due to rounding) Three Months Ended Year to Date ------------ ------------ 2009 2008 (1) 2009 2008 (1) ---- -------- ---- -------- Net income attributable to TCO common shareowners 8,908 373 20,407 4,920 Add (less) depreciation and amortization: Consolidated businesses at 100% 36,058 36,179 72,351 71,514 Noncontrolling partners in consolidated joint ventures (3,172) (3,927) (6,081) (7,495) Share of Unconsolidated Joint Ventures 5,799 5,696 11,305 11,314 Non-real estate depreciation (854) (745) (1,734) (1,441) Add noncontrolling interests: Noncontrolling share of income of TRG 5,290 4,505 11,876 10,421 Distributions in excess of noncontrolling share of income of TRG 6,513 11,618 Distributions in excess of noncontrolling share of income of consolidated joint ventures 4,258 6,395 Add distributions to participating securities of TRG 361 361 836 723 --- --- --- --- Funds from Operations 52,390 53,213 108,960 107,969 TCO's average ownership percentage of TRG 66.8% 66.6% 66.8% 66.5% ---- ---- ---- ---- Funds from Operations attributable to TCO 34,968 35,421 72,726 71,824 ====== ====== ====== ====== Funds from Operations 52,390 53,213 108,960 107,969 Restructuring charge 169 2,630 --- --- ----- --- Adjusted Funds from Operations (2) 52,559 53,213 111,590 107,969 TCO's average ownership percentage of TRG 66.8% 66.6% 66.8% 66.5% ---- ---- ---- ---- Adjusted Funds from Operations attributable to TCO (2) 35,081 35,421 74,482 71,824 ====== ====== ====== ====== (1) Certain amounts have been reclassified to conform to 2009 classifications. (2) FFO for the three and six months ended June 30, 2009 includes, and Adjusted FFO excludes, the restructuring charges which primarily represent the costs of termination of personnel. The Company discloses this Adjusted FFO due to the significance and infrequent nature of the charges. Given the significance of the charges, the Company believes it is essential to a reader's understanding of the Company's results of operations to emphasize the impact on the Company's earnings measures. The adjusted measures are not and should not be considered alternatives to net income or cash flows from operating, investing, or financing activities as defined by GAAP. TAUBMAN CENTERS, INC. Table 5 - Reconciliation of Net Income to Beneficial Interest in EBITDA For the Periods Ended June 30, 2009 and 2008 -------------------------------------------- (in thousands of dollars; amounts attributable to TCO may not recalculate due to rounding) Three Months Ended Year to Date ------------ ------------ 2009 2008 (1) 2009 2008 (1) ---- -------- ---- -------- Net income 20,866 21,414 45,392 44,930 Add (less) depreciation and amortization: Consolidated businesses at 100% 36,058 36,179 72,351 71,514 Noncontrolling partners in consolidated joint ventures (3,172) (3,927) (6,081) (7,495) Share of Unconsolidated Joint Ventures 5,799 5,696 11,305 11,314 Add (less) interest expense and income tax expense: Interest expense: Consolidated businesses at 100% 36,473 35,972 72,706 72,954 Noncontrolling partners in consolidated joint ventures (4,935) (4,907) (9,808) (9,735) Share of Unconsolidated Joint Ventures 8,369 8,457 16,653 16,719 Income tax expense 198 250 468 440 Less noncontrolling share of income of consolidated joint ventures (2,033) (1,130) (3,726) (2,306) ------ ------ ------ ------ Beneficial Interest in EBITDA 97,623 98,004 199,260 198,335 TCO's average ownership percentage of TRG 66.8% 66.6% 66.8% 66.5% ---- ---- ---- ---- Beneficial Interest in EBITDA attributable to TCO 65,212 65,235 133,004 131,937 ====== ====== ======= ======= (1) Certain amounts have been reclassified to conform to 2009 classifications. TAUBMAN CENTERS, INC. Table 6 - Balance Sheets As of June 30, 2009 and December 31, 2008 ----------------------------------------- (in thousands of dollars) As of -------- June 30, 2009 December 31, 2008 ------------- ----------------- Consolidated Balance Sheet of Taubman Centers, Inc. (1): Assets: Properties 3,708,342 3,699,480 Accumulated depreciation and amortization (1,106,675) (1,049,626) ---------- ---------- 2,601,667 2,649,854 Investment in Unconsolidated Joint Ventures 88,636 89,933 Cash and cash equivalents 11,772 62,126 Accounts and notes receivable, net 32,761 46,732 Accounts receivable from related parties 1,686 1,850 Deferred charges and other assets 121,722 124,487 ------- ------- 2,858,244 2,974,982 ========= ========= Liabilities: Notes payable 2,758,938 2,796,821 Accounts payable and accrued liabilities 234,068 262,226 Dividends and distributions payable 22,002 Distributions in excess of investments in and net income of Unconsolidated Joint Ventures 155,141 154,141 ------- ------- 3,148,147 3,235,190 Equity: Taubman Centers, Inc. Shareowners' Equity: Series B Non-Participating Convertible Preferred Stock 26 26 Series G Cumulative Redeemable Preferred Stock Series H Cumulative Redeemable Preferred Stock Common Stock 531 530 Additional paid-in capital 559,240 556,145 Accumulated other comprehensive income (loss) (26,498) (29,778) Dividends in excess of net income (749,965) (726,097) -------- -------- (216,666) (199,174) Noncontrolling interests: Noncontrolling interests in consolidated joint ventures (90,579) (90,251) Noncontrolling interests in TRG (11,875) Preferred Equity of TRG 29,217 29,217 ------ ------ (73,237) (61,034) ------- ------- (289,903) (260,208) -------- -------- 2,858,244 2,974,982 ========= ========= (1) Certain 2008 amounts have been reclassified to conform to 2009 classifications. Combined Balance Sheet of Unconsolidated Joint Ventures: Assets: Properties 1,090,505 1,087,341 Accumulated depreciation and amortization (381,331) (366,168) -------- -------- 709,174 721,173 Cash and cash equivalents 19,196 28,946 Accounts and notes receivable 18,560 26,603 Deferred charges and other assets 19,904 20,098 ------ ------ 766,834 796,820 ======= ======= Liabilities: Notes payable 1,098,370 1,103,903 Accounts payable and other liabilities, net 42,235 61,570 ------ ------ 1,140,605 1,165,473 Accumulated Deficiency in Assets: Accumulated deficiency in assets - TRG (197,205) (194,178) Accumulated deficiency in assets - Joint Venture Partners (165,452) (160,862) Accumulated other comprehensive income (loss) - TRG (5,970) (7,288) Accumulated other comprehensive income (loss) - Joint Venture Partners (5,144) (6,325) ------ ------ (373,771) (368,653) -------- -------- 766,834 796,820 ======= ======= TAUBMAN CENTERS, INC. Table 7 - Annual Outlook ------------------------- (all dollar amounts per common share on a diluted basis; amounts may not add due to rounding) Range for Year Ended December 31, Range for 2009 Before Restructuring Year Ended Restructuring December Charge Charge (1) 31, 2009 ------------- ---------- --------- Funds from Operations per common share 2.73 2.93 (0.03) 2.70 2.90 Real estate depreciation - TRG (1.84) (1.79) (1.84) (1.79) Distributions on participating securities of TRG (0.02) (0.02) (0.02) (0.02) Depreciation of TCO's additional basis in TRG (0.13) (0.13) (0.13) (0.13) ----- ----- --- ----- ----- Net income attributable to common shareowners, per common share 0.74 0.99 (0.03) 0.71 0.96 ==== ==== ===== ==== ==== (1) In 2009, the Company recognized a restructuring charge of $2.6 million, which represents primarily the cost of terminations of personnel. http://www.newscom.com/cgi-bin/prnh/20080428/CLM116LOGODATASOURCE: Taubman Centers, Inc. CONTACT: Barbara Baker, Vice President, Investor Relations of Taubman, +1-248-258-7367, Web Site: http://www.taubman.com/

Copyright

1 Year Taubman Centers Chart

1 Year Taubman Centers Chart

1 Month Taubman Centers Chart

1 Month Taubman Centers Chart

Your Recent History

Delayed Upgrade Clock