ADVFN Logo ADVFN

We could not find any results for:
Make sure your spelling is correct or try broadening your search.

Trending Now

Toplists

It looks like you aren't logged in.
Click the button below to log in and view your recent history.

Hot Features

Registration Strip Icon for monitor Customisable watchlists with full streaming quotes from leading exchanges, such as LSE, NASDAQ, NYSE, AMEX, Bovespa, BIT and more.

SPW

49.44
0.00 (0.00%)
26 Jul 2024 - Closed
Delayed by 15 minutes
Share Name Share Symbol Market Type
NYSE:SPW NYSE Ordinary Share
  Price Change % Change Share Price High Price Low Price Open Price Shares Traded Last Trade
  0.00 0.00% 49.44 0.00 01:00:00

SPX Reports First Quarter 2006 Results

03/05/2006 1:00pm

PR Newswire (US)


S P X (NYSE:SPW)
Historical Stock Chart


From Jul 2019 to Jul 2024
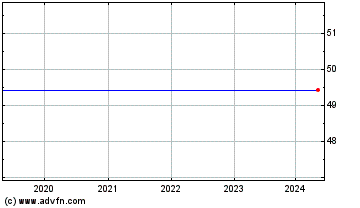
Click Here for more S P X Charts.
Revenues up 9%, Segment Income up 19% CHARLOTTE, N.C., May 3 /PRNewswire-FirstCall/ -- SPX Corporation (NYSE: SPW) today reported results for the first quarter ended March 31, 2006: -- Revenues increased 8.8% to $1.06 billion from $977.6 million in the year-ago quarter. Organic revenue growth (revenue growth over the year-ago quarter excluding the effects of foreign currency fluctuations and acquisitions and divestitures) was 9.8%, while completed acquisitions and the impact of currency fluctuations combined to reduce reported revenues by 1.0%. -- Segment income and margins were $87.6 million and 8.2%, compared with $73.9 million and 7.6% in the year-ago quarter. -- Diluted net income per share from continuing operations was $0.42, compared with a loss of $0.78 in the year-ago quarter. First quarter 2005 results were reduced by costs related to the early extinguishment of debt of $103.5 million, or $0.83 per share. -- Diluted net income per share, including discontinued operations, was $0.35, compared with $9.17 in the year-ago quarter. The first quarter of 2006 included a loss on the disposition of discontinued operations, net of tax, of $4.9 million, or $0.07 per share, while the first quarter of 2005 included a gain on the disposition of discontinued operations, net of tax, of $740.9 million, or $9.94 per share. -- Adjusted free cash flow from continuing operations during the quarter was a negative $48.2 million, compared with a negative $53.2 million of free cash flow in the year-ago quarter. This performance is consistent with the company's historical seasonal patterns of free cash flow. For the year, the company's guidance for adjusted free cash flow remains at $190 million to $210 million. Chris Kearney, President and CEO said, "The first quarter marked our second straight quarter of organic revenue growth of approximately 10.0%, and included double-digit organic growth in three of our four segments. Segment margins expanded 60 points to 8.2%, positioning us well to meet our full year target improvement. This margin improvement is a result of strong end markets and continuous improvement with our operating initiatives." Mr. Kearney continued, "Our first quarter earnings per share were $0.42, well above our previous expectations of $0.27 to $0.30 per share. While a portion of this was due to timing, we are very pleased to announce a $0.10 per share increase in our full year earnings per share guidance range. We are now expecting earnings from continuing operations of $2.85 to $2.95 per share." "SPX is off to a great start in 2006, building on the momentum we established in 2005, and supporting our increased 2006 financial commitments," Mr. Kearney concluded. FINANCIAL HIGHLIGHTS - CONTINUING OPERATIONS Flow Technology Revenues in the first quarter of 2006 were $218.0 million compared to $202.0 million in the first quarter of 2005, an increase of $16.0 million, or 7.9%. The increase was due to organic revenue growth of 10.8%, related primarily to strong demand in the power, mining, oil and gas, and dehydration markets. The impact of currency fluctuations decreased revenues by 2.9% from the year-ago quarter. Segment income was $28.0 million, or 12.8% of revenues, in the first quarter of 2006 compared to $18.4 million, or 9.1% of revenues, in the first quarter of 2005. The increase in segment income and margins was due to the strong level of organic growth, improved pricing, and lean manufacturing initiatives. In addition, the first quarter of 2005 included charges of $4.0 million in connection with operating inefficiencies at a Canadian operation. Test and Measurement Revenues in the first quarter of 2006 were $256.8 million compared to $246.3 million in the first quarter of 2005, an increase of $10.5 million, or 4.3%. The increase was due primarily to the acquisition of CarTool in the fourth quarter of 2005 and organic growth across the segment, partially offset by the impact of currency fluctuations. Segment income was $24.0 million, or 9.3% of revenues, in the first quarter of 2006 compared to $19.2 million, or 7.8% of revenues, in the first quarter of 2005. The increase in segment income and margins was due primarily to improved profitability across the segment, most notably in portable cable and pipe locator product lines, and the acquisition of CarTool. Thermal Equipment and Services Revenues in the first quarter of 2006 were $283.1 million compared to $253.9 million in the first quarter of 2005, an increase of $29.2 million, or 11.5%. The increase was due to organic revenue growth of 14.1%, related largely to the strong demand for thermal service and repair work in Europe and dry cooling products in Asia. The impact of currency fluctuations decreased revenues by 2.6% from the year-ago quarter. Segment income was $11.7 million, or 4.1% of revenues, in the first quarter of 2006 compared to $17.6 million, or 6.9% of revenues, in the first quarter of 2005. The decrease in segment income and margins was due primarily to additional selling, general and administrative costs to support the segment's expansion in Asia and Europe, higher manufacturing costs in the boiler and heating and ventilation businesses, and a decline in income from thermal services and repairs associated with unexpected delays for certain large contracts resulting in under-absorption of fixed costs. Industrial Products and Services Revenues in the first quarter of 2006 were $306.1 million compared to $275.4 million in the first quarter of 2005, an increase of $30.7 million, or 11.1%. The increase was due to organic revenue growth of 11.4%, driven by increases across the segment, with the exception of declines in the domestic automotive market. The most notable organic growth related largely to increased demand for power transformers and industrial and hydraulic tools. The impact of currency fluctuations decreased revenues by 0.3% from the year- ago quarter. Segment income was $23.9 million, or 7.8% of revenues, in the first quarter of 2006 compared to $18.7 million, or 6.8% of revenues, in the first quarter of 2005. The increase in segment income and margins was driven by improvements across the segment and can be attributed to strong organic growth from pricing and end market strength, and manufacturing efficiencies achieved from continuous improvement initiatives, partially offset by the declines in the domestic automotive market. OTHER ITEMS Share Repurchases: During the first quarter of 2006, the company repurchased 4.2 million shares of its common stock for $204.3 million. Year- to-date, the company has repurchased 4.6 million shares of its common stock for $226.6 million. This activity marks the completion of the company's previously announced 10b5-1 trading plan. Since beginning its share repurchase strategy in the second quarter of 2005, the company has repurchased 19.4 million shares for $902.0 million. Debt Refinancing: During the first quarter of 2006, the company borrowed $750.0 million under its delayed draw term loan facility within its senior credit facility. The majority of the proceeds from this borrowing were used to settle $660.2 million of Liquid Yield Option Notes ("LYONs"), which were put to the company during the quarter. The remaining proceeds will be used to fund tax recapture payments related to the LYONs settlement. In connection with the new $750.0 million term loan facility, the company entered into interest rate swap agreements to hedge the potential impact of increases in interest rates on that facility. These swaps are accounted for as cash flow hedges and effectively convert $550.0 million of the borrowing to fixed rates. Discontinued Operations: During the third quarter of 2005, the company committed to a plan to divest Vance, its former global investigation and security firm. During the first quarter of 2006, this disposition was completed and the company received $70.6 million in proceeds. Primarily as a result of this divestiture, the company recorded a loss on the disposition of discontinued operations of $4.9 million, net of tax, during the first quarter of 2006. Dividend: On February 22, 2006, the Board of Directors announced a quarterly dividend of $0.25 per common share payable on April 1, 2006, to shareholders of record on March 15, 2006. This first quarter 2006 dividend was paid on April 3, 2006. Form 10-Q: The company expects to file its quarterly report on Form 10-Q for the quarter ended March 31, 2006 with the Securities and Exchange Commission by May 10, 2006. This press release should be read in conjunction with that filing, which will be available on the company's website at http://www.spx.com/, in the Investor Relations section. SPX Corporation is a leading global provider of flow technology, test and measurement solutions, thermal equipment and services and industrial products and services. For more information visit the company's website at http://www.spx.com/. Certain statements in this press release are forward-looking statements within the meaning of Section 21E of the Securities Exchange Act of 1934, as amended, and are subject to the safe harbor created thereby. Please read these results in conjunction with the company's documents filed with the Securities and Exchange Commission, including the company's annual report on Form 10-K for the year ended December 31, 2005. These filings identify important risk factors and other uncertainties that could cause actual results to differ from those contained in the forward-looking statements. Actual results may differ materially from these statements. The words "believe," "expect," "anticipate," "estimate," "guidance," "target" and similar expressions identify forward-looking statements. Although the company believes that the expectations reflected in its forward-looking statements are reasonable, it can give no assurance that such expectations will prove to be correct. In addition, estimates of future operating results are based on the company's current complement of businesses, which is subject to change. SPX CORPORATION AND SUBSIDIARIES CONDENSED CONSOLIDATED BALANCE SHEETS ($ in millions) March 31, December 31, 2006 2005 (Unaudited) ASSETS Current assets: Cash and equivalents $453.9 $576.3 Accounts receivable, net 1,001.4 961.8 Inventories, net 499.9 463.4 Other current assets 79.8 78.3 Deferred income taxes 138.3 46.4 Assets of discontinued operations - 102.1 Total current assets 2,173.3 2,228.3 Property, plant and equipment Land 29.2 28.9 Buildings and leasehold improvements 245.8 240.8 Machinery and equipment 693.9 686.2 968.9 955.9 Accumulated depreciation (492.8) (481.7) Net property, plant and equipment 476.1 474.2 Goodwill 1,824.4 1,812.2 Intangibles, net 436.2 437.4 Other assets 359.1 354.3 TOTAL ASSETS $5,269.1 $5,306.4 LIABILITIES AND SHAREHOLDERS' EQUITY Current liabilities: Accounts payable $499.2 $535.0 Accrued expenses 689.8 683.2 Income taxes payable 244.2 158.9 Short-term debt 50.9 64.9 Current maturities of long-term debt 27.0 2.6 Liabilities of discontinued operations - 26.1 Total current liabilities 1,511.1 1,470.7 Long-term debt 788.1 720.9 Deferred and other income taxes 343.7 345.1 Other long-term liabilities 664.3 656.6 Total long-term liabilities 1,796.1 1,722.6 Minority interest 2.3 1.9 Shareholders' equity: Common stock 939.9 920.8 Paid-in capital 1,090.1 1,084.8 Retained earnings 1,648.7 1,642.0 Unearned compensation - (55.3) Accumulated other comprehensive loss (161.1) (173.8) Common stock in treasury (1,558.0) (1,307.3) Total shareholders' equity 1,959.6 2,111.2 TOTAL LIABILITIES AND SHAREHOLDERS' EQUITY $5,269.1 $5,306.4 SPX CORPORATION AND SUBSIDIARIES CONDENSED CONSOLIDATED STATEMENTS OF OPERATIONS (Unaudited) (in millions, except per share amounts) Three months ended March 31, 2006 2005 Revenues $1,064.0 $977.6 Costs and expenses: Cost of products sold 795.5 731.2 Selling, general and administrative 218.5 201.4 Intangible amortization 4.0 4.4 Special charges, net 0.4 4.8 Operating income 45.6 35.8 Other expense, net (0.7) (3.2) Interest expense (13.8) (32.3) Interest income 3.2 1.5 Loss on early extinguishment of debt - (103.5) Income (loss) from continuing operations before income taxes 34.3 (101.7) Income tax (provision) benefit (17.6) 38.9 Equity earnings in joint ventures 9.8 4.3 Income (loss) from continuing operations 26.5 (58.5) Income from discontinued operations, net of tax 0.1 1.0 Gain (loss) on disposition of discontinued operations, net of tax (4.9) 740.9 Income (loss) from discontinued operations (4.8) 741.9 Net income $21.7 $683.4 Basic income (loss) per share of common stock Income (loss) from continuing operations $0.44 $(0.78) Income (loss) from discontinued operations (0.08) 9.95 Net income per share $0.36 $9.17 Weighted average number of common shares outstanding - basic 59.971 74.556 Income (loss) from continuing operations for diluted income (loss) per share $27.6 $(58.5) Net income for diluted income per share $22.8 $683.4 Diluted income (loss) per share of common stock (1) Income (loss) from continuing operations 0.42 $(0.78) Income (loss) from discontinued operations (0.07) 9.95 Net income per share $0.35 $9.17 Weighted average number of common shares outstanding - dilutive 65.363 74.556 (1) Diluted loss per share for the quarter ended March 31, 2005 is anti-dilutive and therefore has been adjusted to reflect basic loss per share. SPX CORPORATION AND SUBSIDIARIES RESULTS OF OPERATIONS BY SEGMENT (Unaudited) ($ in millions) Three months ended March 31, 2006 2005 % Flow Technology (1) Revenues $218.0 $202.0 7.9% Gross profit 72.8 62.1 Selling, general and administrative expense 44.6 42.6 Intangible amortization expense 0.2 1.1 Segment income $28.0 $18.4 52.2% as a percent of revenues 12.8% 9.1% Test and Measurement (1) Revenues $256.8 $246.3 4.3% Gross profit 77.3 72.8 Selling, general and administrative expense 51.6 52.7 Intangible amortization expense 1.7 0.9 Segment income $24.0 $19.2 25.0% as a percent of revenues 9.3% 7.8% Thermal Equipment and Services (1) Revenues $283.1 $253.9 11.5% Gross profit 60.3 59.3 Selling, general and administrative expense 47.0 40.0 Intangible amortization expense 1.6 1.7 Segment income $11.7 $17.6 -33.5% as a percent of revenues 4.1% 6.9% Industrial Products and Services (1) Revenues $306.1 $275.4 11.1% Gross profit 62.6 54.9 Selling, general and administrative expense 38.2 35.5 Intangible amortization expense 0.5 0.7 Segment income $23.9 $18.7 27.8% as a percent of revenues 7.8% 6.8% Total segment income 87.6 73.9 Corporate expenses (20.1) (20.3) Pension and postretirement expense (12.1) (7.7) Stock-based compensation expense (9.4) (5.3) Special charges, net (0.4) (4.8) Consolidated Operating Income (1) $45.6 $35.8 (1) Excludes results of discontinued operations. SPX CORPORATION AND SUBSIDIARIES CONDENSED CONSOLIDATED STATEMENTS OF CASH FLOWS (Unaudited) ($ in millions) Three months ended March 31, 2006 2005 Cash flows from (used in) operating activities: Net income $21.7 $683.4 Less: Income (loss) from discontinued operations, net of tax (4.8) 741.9 Income (loss) from continuing operations 26.5 (58.5) Adjustments to reconcile income (loss) from continuing operations to net cash from (used in) operating activities Special charges, net 0.4 4.8 Loss on early extinguishment of debt - 103.5 Deferred and other income taxes 8.4 (38.0) Depreciation 18.9 18.7 Amortization of intangibles and other assets 4.2 4.5 Accretion of LYONs 1.7 4.5 Pension and other employee benefits 16.9 13.3 Stock-based compensation 9.4 5.3 Dividends from joint ventures in excess of equity earnings 2.6 6.6 Other, net 0.4 11.5 Changes in operating assets and liabilities, net of effects from acquisitions and divestitures Accounts receivable and other (44.3) 73.8 Inventories (34.4) (26.1) Accounts payable, accrued expenses and other (37.7) (137.1) Payments to terminate interest rate swap agreements - (13.3) Interest on LYONs repayment (84.3) - Cash spending on restructuring actions (3.1) (6.5) Net cash used in continuing operations (114.4) (33.0) Net cash used in discontinued operations (13.6) (18.1) Net cash used in operating activities (128.0) (51.1) Cash flows from (used in) investing activities: Proceeds from sales of discontinued operations, net of cash sold 73.5 1,859.9 Proceeds from other asset sales 2.3 3.0 Business acquisitions and investments, net of cash acquired (13.1) (2.8) Capital expenditures (18.1) (20.2) Net cash from continuing operations 44.6 1,839.9 Net cash from (used in) discontinued operations 0.9 (2.3) Net cash from investing activities 45.5 1,837.6 Cash flows from (used in) financing activities: Repayments of Tranche A and B term loans - (405.6) Repurchase of senior notes (includes premiums paid of $72.9) - (741.1) Borrowings under delayed draw term loan 750.0 - Repayment of LYONs principal (575.9) - Net repayments under other financing arrangements (14.1) (22.9) Purchases of common stock (248.5) - Proceeds from the exercise of employee stock options 60.7 7.7 Financing fees paid (0.4) - Dividends paid (16.3) (18.5) Net cash used in continuing operations (44.5) (1,180.4) Net cash used in discontinued operations - (17.7) Net cash used in financing activities (44.5) (1,198.1) Change in cash and equivalents due to changes in foreign currency exchange rates 0.7 (12.1) Net change in cash and equivalents (126.3) 576.3 Consolidated cash and equivalents, beginning of period 580.2 586.4 Consolidated cash and equivalents, end of period $453.9 $1,162.7 Cash and equivalents of continuing operations $453.9 $1,154.9 Cash and equivalents of discontinued operations $- $7.8 SPX CORPORATION AND SUBSIDIARIES CASH AND DEBT RECONCILIATION (Unaudited) ($ in millions) Three months ended 3/31/2006 Beginning cash (1) $580.2 Operational cash flow (2) (114.4) Business acquisitions and investments, net of cash acquired (13.1) Capital expenditures (18.1) Proceeds from sales of discontinued operations, net of cash sold 73.5 Proceeds from other asset sales 2.3 Borrowings under delayed draw term loan 750.0 Repayment of LYONs principal (575.9) Net repayments under other financing arrangements (14.1) Purchases of common stock (248.5) Proceeds from the exercise of employee stock options 60.7 Dividends paid (16.3) Financing fees paid (0.4) Cash used in discontinued operations (12.7) Change in cash due to change in foreign currency exchange rates 0.7 Ending cash (1) $453.9 Accretion Debt At and Debt Debt At 12/31/2005 Assumption Borrowings Repayments 3/31/2006 LYONs, net of unamortized discount (2) 658.6 1.7 - (660.2) 0.1 7.5% Senior Notes 28.2 - - - 28.2 6.25% Senior Notes 21.3 - - - 21.3 Delayed draw term loan - - 750.0 - 750.0 Other 80.3 0.2 - (14.1) 66.4 Totals $788.4 $1.9 $750.0 $(674.3) $866.0 (1) Includes cash of discontinued operations of $3.9 as of December 31, 2005. (2) LYONs repayments include $84.3 of accreted interest that is a component of operational cash flow. SPX CORPORATION AND SUBSIDIARIES ADJUSTED FREE CASH FLOW RECONCILIATION (Unaudited) ($ in millions) Three months ended March 31, 2006 2005 Cash used in continuing operations $(114.4) $(33.0) Capital expenditures - continuing operations (18.1) (20.2) Free cash flow used in continuing operations $(132.5) $(53.2) Interest on LYONs repayment 84.3 - Adjusted free cash flow used in continuing operations $(48.2) $(53.2) SPX CORPORATION AND SUBSIDIARIES ORGANIC REVENUE GROWTH RECONCILIATION (Unaudited) Quarter ended March 31, 2006 Net Revenue Acquisitions and Foreign Organic Revenue Growth Other, Net Currency Growth Flow Technology 7.9 % - % (2.9)% 10.8 % Test and Measurement 4.3 % 3.5 % (2.0)% 2.8 % Thermal Equipment and Services 11.5 % - % (2.6)% 14.1 % Industrial Products and Services 11.1 % - % (0.3)% 11.4 % Consolidated 8.8 % 0.9 % (1.9)% 9.8 % DATASOURCE: SPX Corporation CONTACT: Jeremy W. Smeltser, Investors, +1-704-752-4478, ; or Tina Betlejewski, Media, +1-704-752-4454, , both of SPX Corporation Web site: http://www.spx.com/

Copyright

1 Year S P X Chart

1 Year S P X Chart

1 Month S P X Chart

1 Month S P X Chart

Your Recent History

Delayed Upgrade Clock