ADVFN Logo ADVFN

We could not find any results for:
Make sure your spelling is correct or try broadening your search.

Trending Now

Toplists

It looks like you aren't logged in.
Click the button below to log in and view your recent history.

Hot Features

Registration Strip Icon for default Register for Free to get streaming real-time quotes, interactive charts, live options flow, and more.

GWR Genesee and Wyoming Inc

111.88
0.00 (0.00%)
Pre Market
Last Updated: 00:00:00
Delayed by 15 minutes
Share Name Share Symbol Market Type
Genesee and Wyoming Inc NYSE:GWR NYSE Common Stock
  Price Change % Change Share Price High Price Low Price Open Price Shares Traded Last Trade
  0.00 0.00% 111.88 0 00:00:00

Genesee & Wyoming Inc. Reports Traffic for October 2009

12/11/2009 10:38pm

PR Newswire (US)


Genesee and Wyoming (NYSE:GWR)
Historical Stock Chart


From Jan 2020 to Jan 2025
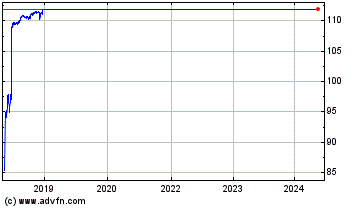
Click Here for more Genesee and Wyoming Charts.
GREENWICH, Conn., Nov. 12, 2009 /PRNewswire-FirstCall/ -- Genesee & Wyoming Inc. (GWI) (NYSE:GWR) today reported traffic volumes for October 2009. GWI's traffic in October 2009 was 62,577 carloads, a decrease of 17,786 carloads, or 22.1 percent, compared with October 2008. The table below sets forth carloading information for October 2009 and October 2008: Genesee & Wyoming Inc. October % of October % of by Commodity Group 2009 Total 2008 Total Coal, Coke & Ores 14,525 23.2% 21,151 26.3% Minerals & Stone 12,387 19.8% 14,728 18.3% Pulp & Paper 6,817 10.9% 9,933 12.4% Metals 5,595 8.9% 6,928 8.6% Lumber & Forest Products 5,344 8.5% 6,943 8.7% Farm & Food Products 4,794 7.7% 5,413 6.7% Chemicals-Plastics 4,122 6.6% 4,527 5.6% Petroleum Products 2,172 3.5% 2,301 2.9% Autos & Auto Parts 828 1.3% 882 1.1% Other 5,993 9.6% 7,557 9.4% Total 62,577 100.0% 80,363 100.0% Coal, coke & ores traffic decreased 6,626 carloads primarily due to lower shipments in GWI's New York/Ohio/Pennsylvania Region and in GWI's Illinois Region, where an expected maintenance outage at a power generation facility reduced traffic volume. Pulp & paper traffic decreased 3,116 carloads primarily due to lower shipments in GWI's Southern, Canada and Rail Link Regions. Minerals & stone traffic decreased 2,341 carloads primarily due to lower shipments in GWI's Australia and Rail Link Regions. All other railroad traffic decreased by a net 5,703 carloads. On June 15, 2009 GWI announced its intent to discontinue operations of its Huron Central Railway (HCRY) in the fourth quarter of 2009. GWI now operates HCRY under a temporary service contract through August 14, 2010. Starting in August 2009 HCRY carloads are no longer included in this press release due to the structure of this temporary contract. To facilitate comparison to the prior year, GWI has excluded 1,165 total HCRY carloads from October 2008 in this press release. However, carloads reported in GWI's Form 10-K will include HCRY traffic for all of 2008. Historically, GWI has found that carload information may be indicative of freight revenues on its railroads, but may not be indicative of total revenues, operating expenses, operating income or net income. GWI owns and operates short line and regional freight railroads in the United States, Canada, Australia and the Netherlands. Operations currently include 62 railroads organized in nine regions, with more than 6,000 miles of owned and leased track and approximately 3,000 additional miles under track access arrangements. GWI provides rail service at 16 ports in North America and Europe and performs contract coal loading and railcar switching for industrial customers. CONTACT: Matthew O. Walsh Senior Vice President - Corporate Development and Treasurer Genesee & Wyoming Inc. 1-203-629-3722 Web Site: http://www.gwrr.com/ DATASOURCE: Genesee & Wyoming Inc. CONTACT: Matthew O. Walsh, Senior Vice President - Corporate Development and Treasurer, Genesee & Wyoming Inc., +1-203-629-3722 Web Site: http://www.gwrr.com/

Copyright

1 Year Genesee and Wyoming Chart

1 Year Genesee and Wyoming Chart

1 Month Genesee and Wyoming Chart

1 Month Genesee and Wyoming Chart