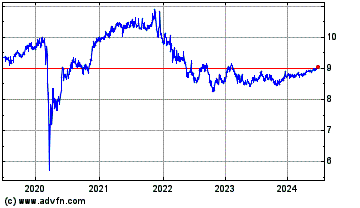
Virtus Convertible and I... (NYSE:CBH)
Historical Stock Chart
From Jan 2020 to Jan 2025
Commerce Bancorp, Inc. and Subsidiaries
Consolidated Statements of Income
(unaudited)
--------------------------------------------------------------------------
Three Months Ended
December 31,
--------------------------------
(dollars in thousands,
except per share amounts) 2006 2005 % Change
--------------------------------------------------------------------------
Interest Interest and fees on loans $262,743 $194,617 35 %
income Interest on investments 342,005 278,317 23
Other interest 4,345 293 1,383
--------------------------------
Total interest income 609,093 473,227 29
--------------------------------
Interest Interest on deposits:
expense Demand 146,773 84,148 74
Savings 72,947 45,866 59
Time 60,134 31,987 88
--------------------------------
Total interest on
deposits 279,854 162,001 73
Interest on other borrowed
money 3,568 12,386 (71)
Interest on long-term debt 0 0 0
--------------------------------
Total interest expense 283,422 174,387 63
--------------------------------
Net interest income 325,671 298,840 9
Provision for credit losses 10,200 5,400 89
--------------------------------
Net interest income after
provision for credit losses 315,471 293,440 8
Non- Deposit charges and service
interest fees 102,840 81,624 26
income Other operating income 61,101 42,600 43
Net investment securities
(losses) gains 2,697 (25,541) (111)
--------------------------------
Total noninterest income 166,638 98,683 69
--------------------------------
Total Revenues 492,309 397,523 24
Non- Salaries and benefits 163,067 145,426 12
interest Occupancy 55,237 46,101 20
expense Furniture and equipment 43,916 36,794 19
Office 17,150 15,708 9
Marketing 12,515 10,544 19
Other 71,289 66,320 7
--------------------------------
Total noninterest
expenses 363,174 320,893 13
--------------------------------
Income before income taxes 118,935 71,230 67
Provision for federal and
state income taxes 40,272 24,292 66
--------------------------------
Net income $78,663 $46,938 68 %
================================
Net income per common and
common equivalent share:
Basic $0.41 $0.27 52 %
--------------------------------
Diluted $0.40 $0.26 54
--------------------------------
Average common and common
equivalent shares
outstanding:
Basic 187,704 174,958 7
--------------------------------
Diluted 196,052 182,801 7
--------------------------------
Cash dividends, common stock $0.13 $0.12 8 %
================================
--------------------------------------------------------------------------
Twelve Months Ended
December 31,
--------------------------------
(dollars in thousands,
except per share amounts) 2006 2005 % Change
--------------------------------------------------------------------------
Interest Interest and fees on loans $970,270 $680,552 43 %
income Interest on investments 1,301,928 981,420 33
Other interest 6,926 3,272 112
--------------------------------
Total interest income 2,279,124 1,665,244 37
--------------------------------
Interest Interest on deposits:
expense Demand 495,147 252,674 96
Savings 261,428 123,419 112
Time 189,944 98,780 92
--------------------------------
Total interest on
deposits 946,519 474,873 99
Interest on other borrowed
money 58,097 28,410 104
Interest on long-term debt 0 8,379 (100)
--------------------------------
Total interest expense 1,004,616 511,662 96
--------------------------------
Net interest income 1,274,508 1,153,582 10
Provision for credit losses 33,700 19,150 76
--------------------------------
Net interest income after
provision for credit losses 1,240,808 1,134,432 9
Non- Deposit charges and service
interest fees 374,210 282,692 32
income Other operating income 214,246 174,132 23
Net investment securities
(losses) gains 2,697 (14,030) (119)
--------------------------------
Total noninterest income 591,153 442,794 34
--------------------------------
Total Revenues 1,865,661 1,596,376 17
Non- Salaries and benefits 614,627 526,428 17
interest Occupancy 196,498 165,077 19
expense Furniture and equipment 161,075 126,986 27
Office 62,234 55,833 11
Marketing 42,737 37,261 15
Other 278,590 234,795 19
--------------------------------
Total noninterest
expenses 1,355,761 1,146,380 18
--------------------------------
Income before income taxes 476,200 430,846 11
Provision for federal and
state income taxes 161,051 147,907 9
--------------------------------
Net income $315,149 $282,939 11 %
================================
Net income per common and
common equivalent share:
Basic $1.70 $1.70 0 %
--------------------------------
Diluted $1.63 $1.61 1
--------------------------------
Average common and common
equivalent shares
outstanding:
Basic 184,919 165,974 11
--------------------------------
Diluted 193,674 179,135 8
--------------------------------
Cash dividends, common stock $0.49 $0.45 9 %
================================
Commerce Bancorp, Inc. and Subsidiaries
Consolidated Statements of Income
(unaudited)
-------------------------------------------------------------------------
Three Months Ended
(dollars in -----------------------------------------------
thousands, Dec. 31, Sept. 30, Dec. 31,
except per -----------------------------------------------
share amounts) 2006 2006 % Change 2005 % Change
-------------------------------------------------------------------------
Inter- Interest and fees
est on loans $262,743 $255,663 3 % $194,617 35 %
income Interest on
investments 342,005 339,825 1 278,317 23
Other interest 4,345 1,918 127 293 1,383
--------------------------- -----------------
Total interest
income 609,093 597,406 2 473,227 29
--------------------------- -----------------
Inter- Interest on
est deposits:
expense Demand 146,773 132,349 11 84,148 74
Savings 72,947 70,320 4 45,866 59
Time 60,134 52,375 15 31,987 88
--------------------------- -----------------
Total interest
on deposits 279,854 255,044 10 162,001 73
Interest on other
borrowed money 3,568 20,392 (83) 12,386 (71)
Interest on long-
term debt 0 0 0 0 0
--------------------------- -----------------
Total interest
expense 283,422 275,436 3 174,387 63
--------------------------- -----------------
Net interest
income 325,671 321,970 1 298,840 9
Provision for
credit losses 10,200 9,499 7 5,400 89
--------------------------- -----------------
Net interest
income after
provision for
credit losses 315,471 312,471 1 293,440 8
Non- Deposit charges
inter- and service fees 102,840 97,436 6 81,624 26
est Other operating
income income 61,101 53,121 15 42,600 43
Net investment
securities
(losses) gains 2,697 0 0 (25,541) (111)
--------------------------- -----------------
Total
noninterest
income 166,638 150,557 11 98,683 69
--------------------------- -----------------
Total
Revenues 492,309 472,527 4 397,523 24
Non- Salaries and
inter- benefits 163,067 156,105 4 145,426 12
est Occupancy 55,237 49,534 12 46,101 20
expense Furniture and
equipment 43,916 41,543 6 36,794 19
Office 17,150 15,213 13 15,708 9
Marketing 12,515 10,712 17 10,544 19
Other 71,289 70,362 1 66,320 7
--------------------------- -----------------
Total
noninterest
expenses 363,174 343,469 6 320,893 13
--------------------------- -----------------
Income before
income taxes 118,935 119,559 (1) 71,230 67
Provision for
federal and state
income taxes 40,272 39,890 1 24,292 66
--------------------------- -----------------
Net income $78,663 $79,669 (1)% $46,938 68 %
=========================== =================
Net income per
common and common
equivalent share:
Basic $0.41 $0.43 (5)% $0.27 52 %
--------------------------- -----------------
Diluted $0.40 $0.41 (2) $0.26 54
--------------------------- -----------------
Average common and
common equivalent
shares
outstanding:
Basic 187,704 186,527 1 174,958 7
--------------------------- -----------------
Diluted 196,052 194,754 1 182,801 7
--------------------------- -----------------
Cash dividends,
common stock $0.13 $0.12 8 % $0.12 8 %
=========================== =================
Return on average
assets 0.71 % 0.74 % 0.50 %
Return on average
equity 11.34 12.06 8.67
Commerce Bancorp, Inc.
Selected Consolidated Financial Data
(unaudited)
Three Months Ended
December 31,
----------------------------------
%
2006 2005 Change
---------- ---------- ------
(dollars and shares in thousands)
Income Statement Data:
Net interest income $325,671 $298,840 9 %
Provision for credit losses 10,200 5,400 89
Noninterest income 166,638 98,683 69
Total revenues 492,309 397,523 24
Noninterest expense 363,174 320,893 13
Net income 78,663 46,938 68
Per Share Data:
Net income - Basic $0.41 $0.27 52 %
Net income - Diluted 0.40 0.26 54
Book value - Basic
Book value - Diluted
Revenue per share - Diluted $10.04 $8.70 15 %
Weighted Average Shares Outstanding:
Basic 187,704 174,958
Diluted 196,052 182,801
Balance Sheet Data:
Total assets
Loans (net)
Allowance for credit losses
Securities available for sale
Securities held to maturity
Total deposits
Core deposits
Stockholders' equity
Capital:
Stockholders' equity to total assets
Risk-based capital ratios:
Tier I
Total capital
Leverage ratio
Performance Ratios:
Cost of funds 2.76 % 2.01 %
Net interest margin 3.25 3.52
Return on average assets 0.71 0.50
Return on average total stockholders'
equity 11.34 8.67
Twelve Months Ended
December 31,
----------------------------------
%
2006 2005 Change
----------- ----------- ------
(dollars and shares in thousands)
Income Statement Data:
Net interest income $1,274,508 $1,153,582 10 %
Provision for credit losses 33,700 19,150 76
Noninterest income 591,153 442,794 34
Total revenues 1,865,661 1,596,376 17
Noninterest expense 1,355,761 1,146,380 18
Net income 315,149 282,939 11
Per Share Data:
Net income - Basic $1.70 $1.70 - %
Net income - Diluted 1.63 1.61 1
Book value - Basic $14.94 $12.92 16 %
Book value - Diluted 14.28 12.38 15
Revenue per share - Diluted $9.63 $8.91 8 %
Weighted Average Shares Outstanding:
Basic 184,919 165,974
Diluted 193,674 179,135
Balance Sheet Data:
Total assets $45,264,760 $38,466,037 18 %
Loans (net) 15,454,996 12,524,988 23
Allowance for credit losses 160,269 141,464 13
Securities available for sale 11,098,113 9,518,821 17
Securities held to maturity 14,884,982 13,005,364 14
Total deposits 41,288,211 34,726,713 19
Core deposits 40,076,568 33,869,540 18
Stockholders' equity 2,816,934 2,309,173 22
Capital:
Stockholders' equity to total assets 6.22 % 6.00 %
Risk-based capital ratios:
Tier I 11.82 11.81
Total capital 12.53 12.58
Leverage ratio 6.22 6.04
Performance Ratios:
Cost of funds 2.59 % 1.65 %
Net interest margin 3.35 3.77
Return on average assets 0.75 0.83
Return on average total
stockholders' equity 12.26 14.90
The following summary presents information regarding non-performing loans
and assets as of December 31, 2006 and the preceding
four quarters (dollar amounts in thousands).
Dec. 31, Sept. 30, June 30, March 31, Dec. 31,
2006 2006 2006 2006 2005
------- -------- -------- -------- --------
Non-accrual loans:
Commercial $33,686 $33,658 $34,904 $16,975 $16,712
Consumer 11,820 9,325 8,927 9,285 8,834
Commercial real estate:
Construction 3,531 496 1,708 1,726 1,763
Mortgage 1,565 1,828 2,523 2,096 4,329
------- -------- -------- -------- --------
Total non-accrual
loans 50,602 45,307 48,062 30,082 31,638
------- -------- -------- -------- --------
Restructured loans:
Commercial - - 2,941 3,037 3,133
Consumer - - - - -
Commercial real estate:
Construction - - - - -
Mortgage - - - - -
------- -------- -------- -------- --------
Total restructured
loans - - 2,941 3,037 3,133
------- -------- -------- -------- --------
Total non-performing
loans 50,602 45,307 51,003 33,119 34,771
------- -------- -------- -------- --------
Other real estate/
foreclosed assets 2,610 2,022 1,369 435 279
------- -------- -------- -------- --------
Total non-performing
assets 53,212 47,329 52,372 33,554 35,050
------- -------- -------- -------- --------
Loans past due
90 days or more
and still accruing 620 441 583 332 248
------- -------- -------- -------- --------
Total non-performing
assets and loans past
due 90 days or more $53,832 $47,770 $52,955 $33,886 $35,298
------- -------- -------- -------- --------
Total non-performing
loans as a percentage
of total period-
end loans 0.32% 0.31% 0.36% 0.25% 0.27%
Total non-performing
assets as a percentage
of total period-end assets 0.12% 0.11% 0.12% 0.08% 0.09%
Total non-performing
assets and loans past
due 90 days or more as
a percentage of total
period-end assets 0.12% 0.11% 0.12% 0.08% 0.09%
Allowance for credit losses
as a percentage of total non-
performing loans 317% 341% 291% 432% 407%
Allowance for credit losses
as a percentage
of total period-end loans 1.03% 1.05% 1.04% 1.06% 1.12%
Total non-performing assets
and loans past due 90 days
or more as a percentage of
stockholders' equity and
allowance for credit losses 2% 2% 2% 1% 1%
The following table presents, for the periods indicated, an analysis of
the allowance for credit losses and other related data: (dollar amounts
in thousands)
Three Months Ended Twelve Months Ended
---------------------- ----------------------
12/31/06 12/31/05 12/31/06 12/31/05
---------- ---------- ---------- ----------
Balance at beginning of
period $154,572 $138,903 $141,464 $135,620
Provisions charged to
operating expenses 10,200 5,400 33,700 19,150
---------- ---------- ---------- ----------
164,772 144,303 175,164 154,770
Recoveries on loans
charged-off:
Commercial 1,652 626 5,987 2,546
Consumer 232 1,234 1,604 2,566
Commercial real estate 10 - 385 80
---------- ---------- ---------- ----------
Total recoveries 1,894 1,860 7,976 5,192
Loans charged-off:
Commercial (3,925) (4,842) (14,107) (13,944)
Consumer (2,376) (2,192) (8,179) (5,912)
Commercial real estate (96) (159) (585) (1,136)
---------- ---------- ---------- ----------
Total charge-offs (6,397) (7,193) (22,871) (20,992)
---------- ---------- ---------- ----------
Net charge-offs (4,503) (5,333) (14,895) (15,800)
---------- ---------- ---------- ----------
Allowance for credit loss
acquired bank 2,494 2,494
---------- ----------
Balance at end of period $160,269 $141,464 $160,269 $141,464
========== ========== ========== ==========
Net charge-offs as a
percentage of
average loans outstanding 0.12 % 0.18 % 0.11 % 0.15 %
Net Allowance Additions $5,697 $2,561 $18,805 $5,844
Commerce Bancorp, Inc. and Subsidiaries Average Balances
and Net Interest Income
(unaudited)
----------------------------------
December 2006
----------------------------------
Average Average
Balance Interest Rate
----------------------------------
(dollars in thousands)
Earning Assets
Investment securities
Taxable $24,610,625 $335,665 5.41 %
Tax-exempt 586,903 8,596 5.81
Trading 103,468 1,157 4.44
------------- ---------- -------
Total investment securities 25,300,996 345,418 5.42
Federal funds sold 323,652 4,345 5.33
Loans
Commercial mortgages 5,192,406 92,553 7.07
Commercial 3,764,466 74,777 7.88
Consumer 5,533,248 88,846 6.37
Tax-exempt 538,746 10,104 7.44
------------- ---------- -------
Total loans 15,028,866 266,280 7.03
------------- ---------- -------
Total earning assets $40,653,514 $616,043 6.01 %
=============
Sources of Funds
Interest-bearing liabilities
Savings $10,643,889 $72,947 2.72 %
Interest bearing demand 16,280,718 146,773 3.58
Time deposits 3,723,163 39,578 4.22
Public funds 1,525,472 20,556 5.35
------------- ---------- -------
Total deposits 32,173,242 279,854 3.45
Other borrowed money 267,992 3,568 5.28
Long-term debt 0 0 0.00
------------- ---------- -------
Total deposits and interest-bearing
liabilities 32,441,234 283,422 3.47
Noninterest-bearing funds (net) 8,212,280
------------- ---------- -------
Total sources to fund earning assets $40,653,514 283,422 2.76
============= ---------- -------
Net interest income and
margin tax-equivalent basis $332,621 3.25 %
========== =======
Other Balances
Cash and due from banks $1,174,831
Other assets 2,451,220
Total assets 44,127,276
Total deposits 40,704,685
Demand deposits (noninterest-bearing) 8,531,443
Other liabilities 378,776
Stockholders' equity 2,775,823
Allowance for loan losses 152,289
----------------------------------
September 2006
----------------------------------
Average Average
Balance Interest Rate
----------------------------------
(dollars in thousands)
Earning Assets
Investment securities
Taxable $24,566,553 $334,250 5.40 %
Tax-exempt 530,542 7,641 5.71
Trading 78,103 934 4.74
------------- ---------- -------
Total investment securities 25,175,198 342,825 5.40
Federal funds sold 145,897 1,918 5.22
Loans
Commercial mortgages 5,001,608 90,050 7.14
Commercial 3,603,790 72,606 7.99
Consumer 5,407,721 87,077 6.39
Tax-exempt 510,950 9,123 7.08
------------- ---------- -------
Total loans 14,524,069 258,856 7.07
------------- ---------- -------
Total earning assets $39,845,164 $603,599 6.01 %
=============
Sources of Funds
Interest-bearing liabilities
Savings $10,592,676 $70,320 2.63 %
Interest bearing demand 14,975,663 132,349 3.51
Time deposits 3,344,257 32,667 3.88
Public funds 1,470,116 19,708 5.32
------------- ---------- -------
Total deposits 30,382,712 255,044 3.33
Other borrowed money 1,543,210 20,392 5.24
Long-term debt 0 0 0.00
------------- ---------- -------
Total deposits and interest-bearing
liabilities 31,925,922 275,436 3.42
Noninterest-bearing funds (net) 7,919,242
------------- ---------- -------
Total sources to fund earning assets $39,845,164 275,436 2.74
============= ---------- -------
Net interest income and
margin tax-equivalent basis $328,163 3.27 %
========== =======
Other Balances
Cash and due from banks $1,219,806
Other assets 2,359,885
Total assets 43,279,878
Total deposits 38,772,316
Demand deposits (noninterest-bearing) 8,389,604
Other liabilities 321,225
Stockholders' equity 2,643,127
Allowance for loan losses 144,977
----------------------------------
December 2005
----------------------------------
Average Average
Balance Interest Rate
----------------------------------
(dollars in thousands)
Earning Assets
Investment securities
Taxable $21,761,130 $273,042 4.98 %
Tax-exempt 518,699 6,279 4.80
Trading 124,625 1,838 5.85
------------- ---------- -------
Total investment securities 22,404,454 281,159 4.98
Federal funds sold 26,165 293 4.44
Loans
Commercial mortgages 4,124,373 68,958 6.63
Commercial 2,893,352 51,892 7.12
Consumer 4,402,231 68,197 6.15
Tax-exempt 487,280 8,570 6.98
------------- ---------- -------
Total loans 11,907,236 197,617 6.58
------------- ---------- -------
Total earning assets $34,337,855 $479,069 5.53 %
=============
Sources of Funds
Interest-bearing liabilities
Savings $8,993,005 $45,866 2.02 %
Interest bearing demand 13,222,933 84,148 2.52
Time deposits 2,970,865 23,540 3.14
Public funds 861,920 8,447 3.89
------------- ---------- -------
Total deposits 26,048,723 162,001 2.47
Other borrowed money 1,213,323 12,386 4.05
Long-term debt 0 0 0.00
------------- ---------- -------
Total deposits and interest-bearing
liabilities 27,262,046 174,387 2.54
Noninterest-bearing funds (net) 7,075,809
------------- ---------- -------
Total sources to fund earning assets $34,337,855 174,387 2.01
============= ---------- -------
Net interest income and
margin tax-equivalent basis $304,682 3.52 %
========== =======
Other Balances
Cash and due from banks $1,304,177
Other assets 1,945,109
Total assets 37,445,373
Total deposits 33,783,365
Demand deposits (noninterest-bearing) 7,734,642
Other liabilities 282,218
Stockholders' equity 2,166,467
Allowance for loan losses 141,768
Notes - Weighted average yields on tax-exempt obligations have been
computed on a tax-equivalent basis assuming a federal tax rate of
35%.
- Non-accrual loans have been included in the average loan balance.
- Consumer loans include loans held for sale.
Commerce Bancorp, Inc. and Subsidiaries
Computation of Net Income Per Share
(dollars in thousands, except per share amounts)
Three Months Ended Twelve Months Ended
December 31, December 31,
------------------ -------------------
2006 2005 2006 2005
--------- -------- --------- --------
Basic:
Net income applicable
to common stock $78,663 $46,938 $315,149 $282,939
========= ======== ======== ========
Average common shares outstanding 187,704 174,958 184,919 165,974
========= ======== ======== ========
Net income per common share $0.41 $0.27 $1.70 $1.70
========= ======== ======== ========
Diluted:
Net income applicable to common
stock on a diluted basis $78,663 $46,938 $315,149 $282,939
Interest expense on trust preferred
securities 5,446
--------- -------- ---------- -------
$78,663 $46,938 $315,149 $288,385
========= ======== ======== ========
Average common shares outstanding 187,704 174,958 184,919 165,974
Additional shares considered in
diluted computation assuming:
Exercise of stock options 8,348 7,843 8,755 7,843
Conversion of trust
preferred securities 5,318
--------- -------- ---------- -------
Average common and common equivalent
shares outstanding 196,052 182,801 193,674 179,135
========= ======== ======== ========
Net income per common and common
equivalent share $0.40 $0.26 $1.63 $1.61
========= ======== ======== ========
DATASOURCE: Commerce Bancorp, Inc.