ADVFN Logo ADVFN

We could not find any results for:
Make sure your spelling is correct or try broadening your search.

Trending Now

Toplists

It looks like you aren't logged in.
Click the button below to log in and view your recent history.

Hot Features

Registration Strip Icon for alerts Register for real-time alerts, custom portfolio, and market movers

AVP Avon Products Inc

5.60
0.00 (0.00%)
After Hours
Last Updated: 01:00:00
Delayed by 15 minutes
Share Name Share Symbol Market Type
Avon Products Inc NYSE:AVP NYSE Common Stock
  Price Change % Change Share Price High Price Low Price Open Price Shares Traded Last Trade
  0.00 0.00% 5.60 0 01:00:00

Avon Reports Fourth-Quarter and 2008 Results

03/02/2009 12:05pm

PR Newswire (US)


Avon Products (NYSE:AVP)
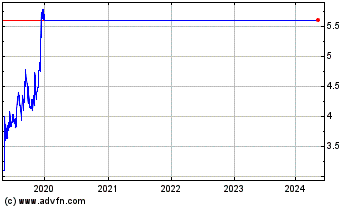
Historical Stock Chart


From Jul 2019 to Jul 2024
Click Here for more Avon Products Charts.
Fourth-Quarter Earnings Per Share Up 80% to $.54 NEW YORK, Feb. 3 /PRNewswire-FirstCall/ -- Avon Products, Inc. (NYSE:AVP) today reported fourth-quarter 2008 earnings per share of $.54, up 80% year over year bringing full-year 2008 earnings per share to $2.04, 69% ahead of the prior year. Fourth-quarter 2008 total revenue of $2.8 billion was 9% lower than 2007's fourth quarter as the impact of a substantial shift in many foreign-currency exchange rates more than offset local-currency revenue growth of 2% year over year. For full-year 2008, Avon reported that total revenue grew 8% (5% in local currency), to a record $10.7 billion. Fourth-quarter 2008 operating profit was $372 million, up 66%, from $225 million in the prior-year quarter, and full-year 2008 operating profit was $1.3 billion, up 53% from 2007's level. The company's fourth-quarter operating margin rose to 13.3%, 600 basis points above 7.3% in the year-ago quarter. Full-year 2008 operating margin was 12.5%, 370 basis points above 2007's 8.8%. Results of both 2008 periods benefited from significantly lower costs associated with the company's restructuring program and Product Line Simplification (PLS) initiative. Details of 2008 Results Fourth-quarter 2008 total revenue benefited 5% from pricing and product mix, units sold decreased 3% and foreign exchange lowered revenue 11% versus the prior-year quarter. For full-year 2008, total revenue benefited 4% from pricing and product mix, units sold increased 1% and foreign exchange increased revenue 3%. Active Representatives grew 4% and 7% year over year in the fourth quarter and full year 2008, respectively. Beauty sales in the fourth quarter 2008 were 7% lower versus the prior-year period as the impact of foreign exchange more than offset a local-currency increase of 4%, which was driven by growth in all categories, particularly: Fragrance and Skin Care. For the full year, Beauty sales rose 10% (7% in local currency). Advertising expense decreased 7% in the fourth quarter to $100 million. On a full-year basis, advertising increased 6% to $391 million. The company invested an incremental $9 million and $83 million of costs versus the prior-year periods, in the fourth quarter and full-year 2008, respectively, for initiatives to improve the Representative Value Proposition. Fourth-quarter 2008 operating profit included costs associated with the company's restructuring program of $7 million ($.01 per share). This compared with costs of $205 million ($.34 per share) related to the company's restructuring program ($101 million) and PLS initiative ($104 million) in the prior-year period. Likewise, both 2008 and 2007 full-year results included costs associated with the restructuring program, and 2007 also included significant costs associated with the company's PLS initiative. Those costs totaled $61 million ($.09 per share) and $346 million ($.56 per share) in 2008 and 2007, respectively. Avon continues to expect to achieve annualized savings of approximately $430 million once all initiatives of its multi-year restructuring program, launched in late 2005, are fully implemented by 2011 - 2012. Those savings are expected to reach $300 million in 2009. The company anticipates costs to implement all restructuring initiatives under the program from inception to completion to be approximately $530 million. Avon continues to expect to achieve in excess of $200 million annual benefits each, beginning in 2010, from its PLS program and Strategic Sourcing Initiative for a total in excess of $400 million from these two programs and over $830 million annually from all initiatives when fully implemented. The fourth quarter's effective tax rate of 32.3% compared with 2007's rate of 34.2%. Net income in the fourth quarter 2008 was $232 million compared with $129 million in the year-ago quarter. The full-year 2008 tax rate was 29.3% versus 33.0% in 2007. The full-year 2008 rate benefited from a one-time adjustment primarily resulting from an audit settlement. Net income for 2008 was $875 million compared with $531 million in 2007. Avon finished 2008 with cash of $1.1 billion, up from $963 million at year-end 2007, and total debt was $2.5 billion and $2.1 billion at the respective dates. Cash flow from operations improved to $748 million in 2008 versus $590 million in 2007, primarily due to higher net income. Reflecting the company's financial position, Avon's Board of Directors this morning approved a 5% dividend increase for 2009, raising Avon's annual dividend to $.84 per share. 2009 marks the 19th consecutive year of a regular dividend increase. Shares repurchased in 2008 totaled $172 million, compared with $667 million in 2007. Outlook Andrea Jung, chairman and CEO, commented, "After nine months of strong sales performance, the significant negative impact of foreign exchange and the depressed economy hurt our fourth-quarter revenue performance. "It is prudent to assume these pressures will continue for the foreseeable future, and we therefore anticipate that 2009 will be a challenging year. While we cannot control movements in foreign currency, our focus, as always, will be on building and managing our business for the long term, and continuously driving our costs lower as part of our 'constant turnaround mentality.' "We believe our model is well suited to create income opportunities in these difficult economic times, as we have during past challenges. Our model also allows us to emphasize "smart value" products in the Avon brochure. Such products have always been a hallmark of our brand, and are even more attractive today given our improvements in product innovation and brand image. Throughout our history, these advantages have allowed Avon to emerge well positioned as economic conditions improve. "In terms of our cost structure, we intend to take significant additional steps to transform our value chain, as well as to aggressively reduce non-strategic spending in the current year. Our success with cost transformation as part of our turnaround has proven our ability to move swiftly and boldly to address key opportunities. "We are fortunate to be facing these challenging times from a position of financial strength. We have a solid balance sheet, an operating model that generates healthy cash flow and a continued commitment to our dividend. This strong foundation, coupled with the continuing execution of our turnaround strategies and the competitive advantages of our direct selling business model, gives us confidence to look past 2009's challenges and to continue our focus on long-term sustainable, profitable growth," concluded Jung. Regional Results Latin America's fourth-quarter revenue was 5% lower year over year as foreign exchange declines more than offset 11% local-currency revenue growth. On a local-currency basis, the region's growth was driven by a 15% increase in Brazil, a 29% increase in Venezuela and an 11% increase in Mexico, which, on a reported basis, were -9%, 29% and -8%, respectively. The region's Active Representatives grew 2%, and units sold were up 3%. Operating profit was 28% higher (54% higher in local currency) primarily due to the higher local-currency sales performance and lower inventory obsolescence expense. Latin America's fourth-quarter operating margin was 18.5%. For full-year 2008, revenue in the Latin America region grew 18% (14% in local currency); operating profit increased 43% (38% in local currency) and the operating margin was 17.8%. Reflecting the macro-economic environment of the region, fourth-quarter revenue in North America declined 11% (9% in local currency) and units were 6% lower versus the prior year's results. Active Representatives increased 1%. Operating profit decreased 14% (7% in local currency) versus the 2007 quarter, primarily due to lower revenue, and the region's operating margin was 6.6%. For full-year 2008, revenue in the North America region was 5% lower (5% lower in local currency); operating profit was flat (up 1% in local currency) and the operating margin was 8.6%. In Central & Eastern Europe, fourth-quarter revenue was 14% lower, primarily due to foreign exchange. On a local-currency basis, revenue decreased 3% for the region and 2% in Russia, which was -11% on a reported basis, as the company's previously successful strategy to feature mass-premium price point products during the holiday quarter was challenged by greater-than-anticipated consumer contraction in the region. Fourth-quarter Active Representatives grew 1%. Units sold decreased 7%. Operating profit decreased 2% versus the 2007 quarter as the impact of foreign exchange more than offset a 12% increase in local currency operating profit. The operating profit improvement on a local-currency basis was primarily due to lower inventory obsolescence expense. The region's operating margin was 21.2%. For full-year 2008, revenue in the Central & Eastern Europe region grew 9% (4% in local currency); operating profit increased 17% (11% in local currency) and the operating margin was 20.1%. Western Europe, Middle East & Africa's fourth-quarter revenue was 16% lower year over year as foreign-exchange declines more than offset 2% local-currency revenue growth, which was driven by growth in the U.K. and Turkey. The region's Active Representatives grew 3% year over year. Units sold decreased 9%. The region reported fourth-quarter 2008 operating profit of $41 million compared with an operating loss of $6 million in the fourth-quarter 2007. The improvement in operating profit was largely due to significantly lower costs to implement restructuring. Fourth-quarter 2008 operating margin was 11.4%. For full-year 2008, revenue in the Western Europe, Middle East & Africa region grew 3% (6% in local currency); operating profit increased to $121 million from $34 million and the operating margin was 8.9%. Asia-Pacific fourth-quarter revenue decreased 6% year over year due to foreign exchange and was flat with the prior year on a local-currency basis. On a local-currency basis, growth in the Philippines offset a similar decline in Japan. The region's Active Representatives were 6% higher. Units sold decreased 3% as compared with the prior year. Operating profit expanded 86% (129% in local currency) year over year, largely due to lower inventory obsolescence expense and an absence of costs to implement restructuring. Operating margin in the quarter was 12.3%. For full-year 2008, revenue in the Asia-Pacific region grew 5% (0% in local currency); operating profit increased 59% (54% in local currency) and the operating margin was 11.5%. Fourth-quarter revenue in China grew 27% (17% in local currency) year over year. Active Representatives rose 88% year over year. Units sold decreased 8%. As a result of its revenue growth, China's operating profit more than doubled to $19 million from $6 million in the prior-year quarter. The region's fourth-quarter operating margin was 17.6%. For full-year 2008, revenue in the China region grew 25% (14% in local currency); operating profit increased to $18 million from $2 million and the operating margin was 5.0%. Avon will conduct a conference call at 9:00 A.M. today to discuss the quarter's results. The dial-in number for the call is (800) 843-2086 in the U.S. or (706) 643-1815 from non-U.S. locations (conference ID number: 81147707). The call will be webcast live at http://www.avoninvestor.com/ and can be accessed or downloaded from that site for a period of two weeks. Avon, the company for women, is a leading global beauty company, with over $10 billion in annual revenue. As the world's largest direct seller, Avon markets to women in more than 100 countries through 5.8 million independent Avon Sales Representatives. Avon's product line includes beauty products, fashion jewelry and apparel, and features such well-recognized brand names as Avon Color, Anew, Skin-So-Soft, Advance Techniques, Avon Naturals, and Mark. Learn more about Avon and its products at http://www.avoncompany.com/. CAUTIONARY STATEMENT FOR PURPOSES OF THE "SAFE HARBOR" STATEMENT UNDER THE PRIVATE SECURITIES LITIGATION REFORM ACT OF 1995 Statements in this release that are not historical facts or information are forward-looking statements within the meaning of the Private Securities Litigation Reform Act of 1995. Words such as "estimate," "project," "forecast," "plan," "believe," "may," "expect," "anticipate," "intend," "planned," "potential," "can," "expectation" and similar expressions, or the negative of those expressions, may identify forward-looking statements. Such forward-looking statements are based on management's reasonable current assumptions and expectations. Such forward-looking statements involve risks, uncertainties and other factors, which may cause the actual results, levels of activity, performance or achievement of Avon to be materially different from any future results expressed or implied by such forward-looking statements, and there can be no assurance that actual results will not differ materially from management's expectations. Such factors include, among others, the following: -- our ability to implement the key initiatives of and realize the operating margins and projected benefits (in the amounts and time schedules we expect) from our global business strategy, including our multi-year restructuring initiatives, product mix and pricing strategies, enterprise resource planning, customer service initiatives, product line simplification program, sales and operation planning process, strategic sourcing initiative, outsourcing strategies, zero-overhead-growth philosophy, cash flow from operations and cash management, tax, foreign currency hedging and risk management strategies; -- our ability to realize the anticipated benefits (including any projections concerning future revenue and operating margin increases) from our multi-year restructuring initiatives or other strategic initiatives on the time schedules or in the amounts that we expect, and our plans to invest these anticipated benefits ahead of future growth; -- the possibility of business disruption in connection with our multi-year restructuring initiatives or other strategic initiatives; -- our ability to realize sustainable growth from our investments in our brand and the direct-selling channel; -- a general economic downturn, a recession globally or in one or more of our geographic regions, such as North America, or sudden disruption in business conditions, and the ability of our broad-based geographic portfolio to withstand such economic downturn, recession or conditions; -- the inventory obsolescence and other costs associated with our product line simplification program; -- our ability to effectively implement initiatives to reduce inventory levels in the time period and in the amounts we expect; -- our ability to achieve growth objectives or maintain rates of growth, particularly in our largest markets and developing and emerging markets; -- our ability to successfully identify new business opportunities and identify and analyze acquisition candidates, and our ability to negotiate and consummate acquisitions as well as to successfully integrate or manage any acquired business; -- the effect of political, legal and regulatory risks, as well as foreign exchange or other restrictions, imposed on us, our operations or our Representatives by governmental entities; -- our ability to successfully transition our business in China in connection with the resumption of direct selling in that market, our ability to operate using the direct-selling model permitted in that market and our ability to retain and increase the number of Active Representatives there over a sustained period of time; -- the effect of economic factors, including inflation and fluctuations in interest rates and currency exchange rates, and the potential effect of such fluctuations on our business, results of operations and financial condition; -- general economic and business conditions in our markets, including social, economic and political uncertainties in Latin America, China, Asia Pacific, Europe, the Middle East and Africa; -- any consequences of the internal investigation of our China operations; -- information technology systems outages, disruption in our supply chain or manufacturing and distribution operations, or other sudden disruption in business operations beyond our control as a result of events such as acts of terrorism or war, natural disasters, pandemic situations and large scale power outages; -- the risk of product or ingredient shortages resulting from our concentration of sourcing in fewer suppliers; -- the quality, safety and efficacy of our products; -- the success of our research and development activities; -- our ability to attract and retain key personnel and executives; -- competitive uncertainties in our markets, including competition from companies in the cosmetics, fragrances, skin care and toiletries industry, some of which are larger than we are and have greater resources; -- our ability to implement our Sales Leadership program globally, to generate Representative activity, to enhance the Representative experience and increase Representative productivity through investments in the direct-selling channel, and to compete with other direct-selling organizations to recruit, retain and service Representatives; -- the impact of the seasonal nature of our business, adverse effect of rising energy, commodity and raw material prices, changes in market trends, purchasing habits of our consumers and changes in consumer preferences, particularly given the global nature of our business and the conduct of our business in primarily one channel; -- our ability to protect our intellectual property rights; -- the risk of an adverse outcome in our material pending and future litigations; -- our ratings and our access to financing and ability to secure financing at attractive rates; and -- the impact of possible pension funding obligations, increased pension expense and any changes in pension regulations or interpretations thereof on our cash flow and results of operations. Additional information identifying such factors is contained in Item 1A of our Annual Report on Form 10-K for the year ended December 31, 2007, and our Quarterly Report on Form 10-Q for the quarter ended September 30, 2008, filed with the U.S. Securities and Exchange Commission. We undertake no obligation to update any such forward-looking statements. AVON PRODUCTS, INC. CONSOLIDATED STATEMENTS OF INCOME (Unaudited) (In millions, except per share data) Three months ended Percent Twelve months ended Percent December 31 Change December 31 Change ------------------ ------ ------------------- ------ 2008 2007 2008 2007 --------- -------- --------- -------- Net sales $2,781.3 $3,049.4 -9% $10,588.9 $9,845.2 8% Other revenue 26.3 26.1 101.2 93.5 -------- -------- --------- -------- Total revenue 2,807.6 3,075.5 -9% 10,690.1 9,938.7 8% Cost of sales 1,057.0 1,298.6 3,949.1 3,941.2 Selling, general and administrative expenses 1,378.5 1,552.4 5,401.7 5,124.8 -------- -------- --------- -------- Operating profit 372.1 224.5 66% 1,339.3 872.7 53% -------- -------- --------- -------- Interest expense 23.6 28.4 100.4 112.2 Interest income (9.2) (9.4) (37.1) (42.2) Other expense, net 21.6 8.0 37.7 6.6 -------- -------- --------- -------- Total other expenses 36.0 27.0 101.0 76.6 Income before taxes and minority interest 336.1 197.5 70% 1,238.3 796.1 56% Income taxes 108.4 67.6 362.7 262.8 -------- -------- --------- -------- Income before minority interest 227.7 129.9 875.6 533.3 Minority interest 4.7 (1.0) (0.3) (2.6) -------- -------- --------- -------- Net income $232.4 $128.9 80% $875.3 $530.7 65% ======== ======== ========= ======== Earnings per share: Basic $.55 $.30 83% $2.05 $1.22 68% ======== ======== ========= ======== Diluted $.54 $.30 80% $2.04 $1.21 69% ======== ======== ========= ======== Average shares outstanding: Basic 426.33 428.56 426.36 433.47 Diluted 427.70 432.47 429.53 436.89 AVON PRODUCTS, INC. CONSOLIDATED BALANCE SHEETS (Unaudited) (In millions) December 31 December 31 2008 2007 -------- -------- Assets Current Assets Cash and cash equivalents $1,104.7 $963.4 Accounts receivable, net 687.8 795.0 Inventories 1,007.9 1,041.8 Prepaid expenses and other 756.5 715.2 -------- -------- Total current assets 3,556.9 3,515.4 -------- -------- Property, plant and equipment, at cost 2,439.9 2,362.4 Less accumulated depreciation (1,096.0) (1,084.2) -------- -------- 1,343.9 1,278.2 Other assets 1,173.2 922.6 -------- -------- Total assets 6,074.0 5,716.2 ======== ======== Liabilities and Shareholders' Equity Current Liabilities Debt maturing within one year 1,031.4 929.5 Accounts payable 724.3 800.3 Accrued compensation 234.4 285.8 Other accrued liabilities 581.9 713.2 Sales and taxes other than income 212.2 222.3 Income taxes 128.0 102.3 -------- -------- Total current liabilities 2,912.2 3,053.4 -------- -------- Long-term debt 1,456.2 1,167.9 Employee benefit plans 665.4 388.7 Long-term income taxes 168.9 208.7 Other liabilities 196.4 185.9 -------- -------- Total liabilities 5,399.1 5,004.6 -------- -------- Shareholders' Equity Common stock 185.6 184.7 Additional paid-in-capital 1,874.1 1,724.6 Retained earnings 4,118.9 3,586.5 Accumulated other comprehensive loss (965.9) (417.0) Treasury stock, at cost (4,537.8) (4,367.2) -------- -------- Total shareholders' equity 674.9 711.6 -------- -------- Total liabilities and shareholders' equity $6,074.0 $5,716.2 ======== ======== AVON PRODUCTS, INC. CONSOLIDATED STATEMENTS OF CASH FLOWS (Unaudited) (In millions) Twelve Months Ended December 31 ---------------------- 2008 2007 ------ ------ Cash Flows from Operating Activities: Net income $875.3 $530.7 Adjustments to reconcile net income to net cash provided by operating activities: Depreciation 141.9 128.9 Amortization 45.3 43.2 Provision for doubtful accounts 195.5 164.1 Provision for obsolescence 80.8 280.6 Share-based compensation 54.8 61.6 Foreign exchange (gains) losses 18.7 (2.5) Deferred income taxes (62.4) (112.4) Asset write-off restructuring charges - 0.2 Other 48.3 41.9 Changes in assets and liabilities: Accounts receivable (174.6) (236.6) Inventories (174.3) (341.0) Prepaid expenses and other (153.3) (49.1) Accounts payable and accrued liabilities (148.9) 169.9 Income and other taxes 47.5 61.6 Noncurrent assets and liabilities (46.5) (151.3) ------ ------ Net cash provided by operating activities 748.1 589.8 ------ ------ Cash Flows from Investing Activities: Capital expenditures (380.5) (278.5) Disposal of assets 13.4 11.2 Acquisitions and other investing activities - (19.0) Purchases of investments (77.7) (47.0) Proceeds from sale of investments 41.4 46.1 ------ ------ Net cash used by investing activities (403.4) (287.2) ------ ------ Cash Flows from Financing Activities: Cash dividends (347.7) (325.7) Debt, net (maturities of three months or less) (216.9) 249.6 Proceeds from debt 572.6 58.7 Repayment of debt (73.9) (18.0) Proceeds from exercise of stock options 81.4 85.5 Excess tax benefit realized from share-based compensation 15.1 19.6 Repurchase of common stock (172.1) (666.8) ------ ------ Net cash used by financing activities (141.5) (597.1) ------ ------ Effect of exchange rate changes on cash and cash equivalents (61.9) 59.0 Net increase (decrease) in cash and cash equivalents 141.3 (235.5) Cash and equivalents at beginning of year 963.4 1,198.9 Cash and equivalents at end of year $1,104.7 $963.4 AVON PRODUCTS, INC. SUPPLEMENTAL SCHEDULE (Unaudited) (In millions) THREE MONTHS ENDED 12/31/08 =========================== REGIONAL RESULTS ================ Total Operating Revenue Profit $ in Total in Local Operating in Local Op. Active Millions Revenue US$ Currency Profit US$ Currency Margin Units Reps ----------- -------- ------------ -------- ------ ----- ---- % % % var. % var. % var. % var. var. var. vs vs vs vs 2008 vs vs 4Q07 4Q07 4Q07 4Q07 percent 4Q07 4Q07 ----------- -------- ------------ ------- ------- ----- ---- Latin America $944.3 -5% 11% $175.1 28% 54% 18.5% 3% 2% North America (1) 681.3 -11 -9 44.9 -14 -7 6.6 -6 1 Central & Eastern Europe 482.9 -14 -3 102.2 -2 12 21.2 -7 1 Western Europe, Middle East & Africa 364.3 -16 2 41.5 * * 11.4 -9 3 Asia Pacific 225.2 -6 0 27.6 86 129 12.3 -3 6 China 109.6 27 17 19.3 * * 17.6 -8 88 Total from Oper- ations 2,807.6 -9 2 410.6 33 59 14.6 -3 4 Global Expenses - - - (38.5) 54 54 - - - Consol- idated (1) $2,807.6 -9% 2% $372.1 66% 106% 13.3% -3% 4% CATEGORY SALES (US$) ==================== Consolidated --------------------- % var. vs 4Q07 --------------------- Beauty (cosmetics/fragrances/skin care/toiletries) $1,957.7 -7% Fashion (fashion jewelry/watches/ apparel/footwear/accessories) 489.5 -7 Home (gift & decorative products/ housewares/entertainment & leisure/ kids/nutrition) 334.1 -21 ---------- -------- Net Sales $2,781.3 -9% Other Revenue 26.3 1 ---------- -------- Total Revenue $2,807.6 -9% TWELVE MONTHS ENDED 12/31/08 ============================ REGIONAL RESULTS ================ Total Operating Revenue Profit $ in Total in Local Operating in Local Op. Active Millions Revenue US$ Currency Profit US$ Currency Margin Units Reps ------------- -------- ------------ -------- ------- ----- ---- % % % var. % var. % var. % var. var. var. vs vs vs vs 2008 vs vs FY07 FY07 FY07 FY07 percent FY07 FY07 ------------- -------- ------------ -------- ------- ----- ---- Latin America $3,884.1 18% 14% $690.3 43% 38% 17.8% 4% 6% North America (1) 2,492.7 -5 -5 213.9 0 1 8.6 -4 2 Central & Eastern Europe (2) 1,719.5 9 4 346.2 17 11 20.1 2 12 Western Europe, Middle East & Africa 1,351.7 3 6 121.0 * * 8.9 -3 4 Asia Pacific 891.2 5 0 102.4 59 54 11.5 0 4 China 350.9 25 14 17.7 * * 5.0 2 79 Total from Oper- ations 10,690.1 8 5 1,491.5 37 33 13.9 1 7 Global Expenses - - - (152.2) 31 31 - - - Consol- idated (1) (2) $10,690.1 8% 5% $1,339.3 53% 50% 12.5% 1% 7% CATEGORY SALES (US$) ==================== Consolidated ---------------------- % var. vs FY07 ---------------------- Beauty (cosmetics/fragrances/skin care/toiletries) $7,603.7 10% Fashion (fashion jewelry/watches/ apparel/footwear/accessories) 1,863.3 6 Home (gift & decorative products/ housewares/entertainment & leisure/ kids/nutrition) 1,121.9 -3 ----------- -------- Net Sales $10,588.9 8% Other Revenue 101.2 8 ----------- -------- Total Revenue $10,690.1 8% * Calculation not meaningful (1) North America Active Representative growth benefited from increased ordering opportunities in Canada as a result of a move from a three-week campaign cycle to a two-week campaign cycle beginning in the second quarter of 2008. (2) Central & Eastern Europe Active Representative growth during the first half of 2008 benefited from increased ordering opportunities as a result of a move from a four-week campaign cycle to a three-week campaign cycle in the second half of 2007. DATASOURCE: Avon Products, Inc. CONTACT: Media, Victor Beaudet, +1-212-282-5344, or Sharon Samuel, +1-212-282-5322, or Investors, Renee Johansen or Anita Bialkowska, +1-212-282-5320, all of Avon Products, Inc. Web Site: http://www.avoncompany.com/

Copyright

1 Year Avon Products Chart

1 Year Avon Products Chart

1 Month Avon Products Chart

1 Month Avon Products Chart

Your Recent History

Delayed Upgrade Clock