ADVFN Logo ADVFN

We could not find any results for:
Make sure your spelling is correct or try broadening your search.

Trending Now

Toplists

It looks like you aren't logged in.
Click the button below to log in and view your recent history.

Hot Features

Registration Strip Icon for charts Register for streaming realtime charts, analysis tools, and prices.

WINS Wins Financial Holdings Inc

14.21
0.00 (0.00%)
Pre Market
Last Updated: 01:00:00
Delayed by 15 minutes
Share Name Share Symbol Market Type
Wins Financial Holdings Inc NASDAQ:WINS NASDAQ Common Stock
  Price Change % Change Share Price Bid Price Offer Price High Price Low Price Open Price Shares Traded Last Trade
  0.00 0.00% 14.21 14.09 14.72 0 01:00:00

SM&A Reports Financial Results for Q1 2008

08/05/2008 9:05pm

Business Wire


Wins Financial (NASDAQ:WINS)
Historical Stock Chart


From Jul 2019 to Jul 2024
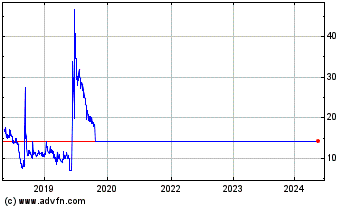
Click Here for more Wins Financial Charts.
SM&A (Nasdaq:WINS), the world's foremost management consulting firm providing solutions to PURSUE, WIN and profitably PERFORM on competitive procurements projects, today announced financial results for the first quarter ended March 31, 2008. Revenue for the first quarter of 2008 increased 7.6% to $25.4 million, a record for first quarter revenues, compared to $23.6 million in the first quarter of the previous year. Net income for the quarter was $0.5 million, or $0.03 per fully diluted share versus net income of $1.5 million, or $0.08 per fully diluted share in the comparable quarter of 2007. Financial results for the quarter were impacted by charges associated with a company-wide off-site training conference held every other year and the current on-going proxy contest totaling $1.2 million. Results for the quarter were also impacted by an $876,000 earn-out payment earned by the principal of an acquired business which the Company recognized as expense, under generally accepted accounting principals (GAAP). The contingent payment earned under the acquisition agreement. Excluding the aforementioned charges, net income on a tax-effected basis for the first quarter would have been $1.7 million, or $0.09 per fully diluted share compared with non-GAAP fully diluted EPS of $0.09 in the immediately preceding quarter and non-GAAP fully diluted EPS of $0.10 in the first quarter of 2007. During the quarter the Company made an initial investment of approximately $500,000 to establish its Strategic Advisors subsidiary. (See Exhibit A for additional information.) Competition Management: Competition Management revenue for the quarter was $13.3 million compared to $14.4 million in the first quarter of 2007. While the level of activity within Competition Management was solid in the first quarter, there were fewer large Federal procurement opportunities in the first quarter of 2008 as compared to the first quarter of 2007. Large Federal procurement opportunities have the tendency to drive higher revenue levels due to the larger and more complex proposals that are required. Large Federal procurement opportunities trends have been variable and have traditionally contributed to inconsistent Competition Management revenue within SM&A. Competition Management represented 52% of total quarterly revenue compared with 61% of total quarterly revenue last year. WIN incentives earned were $226,000 for the three months ended March 31, 2008; there were no WIN incentives earned in the same period of the prior year. “We are pleased with the results of the Competition Management segment during the quarter,” said Cathy McCarthy, president and chief executive officer of SM&A. “Competition Management revenues traditionally fluctuate on a quarterly basis based on the timing of project starts and completions and the number and size of projects within the quarter. The company continues to achieve its traditional 85% cumulative WIN rate. We believe that the Competition Management revenue achieved in the first quarter is in line with our expectation to meet our annual revenue growth objective.” Program Services: Program Services revenue for the quarter increased 31.5% to $12.1 million, the highest in the Company’s history, compared with $9.2 million for the same period of the prior year and $11.6 million in the immediately preceding quarter. This was the fifth (5th) consecutive quarter of revenue growth for the segment. Program Services accounted for 48% of total quarterly revenues, compared to 39% of total quarterly revenue in the first quarter of 2007. Program Services revenue has been positively impacted by the acquisitions of Project Planning, Inc. (PPI) and Performance Management Associates, Inc. (PMA) in 2007. Ms. McCarthy commented, “The Company’s strategic plan calls for the accelerated growth of the Program Services business while maintaining measured growth and the quality of the Company’s flagship Competition Management business. The 31.5% increase in Program Services revenue during the quarter is a strong testament to the benefit of diversification that will offset some of the uneven quarterly revenue results inherent in the Competition Management business. We believe that strong growth in Program Services will continue in the coming quarters and provide greater visibility and predictability of our revenues.” Strategic Advisors: The addition of Peter Pace, General USMC (ret.), to our company as president and CEO of our Strategic Advisors subsidiary, has provided the predictive results and opportunities we anticipated when he joined SM&A. General Pace has been well received by both our employees and our clients. He has already raised the Company’s profile in our customer community beyond what has been achievable in many years. He has provided numerous opportunities for introduction to potential customers in new markets at the CEO level that were previously unattainable to us. Although Pete has only been with SM&A for four months, his presence is already providing us with opportunities to develop strategic relationships with our key clients around strategy development and advisory services. SM&A Strategic Advisors has also provided a supportive organization for the development of our Strategic Business Intelligence initiative, which is part of our strategic plan. “We are particularly pleased,” continued Ms. McCarthy, “with the progress that General Pace has made in expanding the scope of future opportunities and in setting the stage for SM&A to be a vital component to the success of our clients in the winning of, and in the efficient execution of major contract procurements in the years ahead.” Revenue by Market Vertical: Revenue from aerospace and defense ("A&D") clients totaled $19.5 million for the first quarter of 2008, the third highest quarter in the Company’s history, compared to $19.9 million in the first quarter last year. Revenue from non-A&D clients was $5.9 million, compared to $3.7 million in the first quarter last year. Non-A&D business represented 23% of total first quarter revenue, compared with 16% a year ago. More importantly, the Company is building momentum in the Program Services business in the non-A&D market, as well as in its Competition Management business. The further diversification of revenues is attributable to the Company’s ongoing efforts to more fully implement its strategic business plan. SG&A Expenses: SG&A expenses were $9.0 million in the quarter. Included in the SG&A expense was $1.1 million related to a company-wide off-site training conference held every other year, $876,000 related to an earn-out payment by the principal of an acquired business and $60,000 associated with the current on-going proxy contest. Stock-based compensation expense totaled $421,000. Excluding the aforementioned expenses, operating SG&A expenses were $6.5 million, or 25.6% of first quarter 2008 revenue comparing favorably with 25.8% on an operating basis in the immediately preceding quarter and compared to 24.5% on an operating basis in the first quarter of 2007. During the quarter the Company made an initial investment of approximately $500,000 to establish its Strategic Advisors subsidiary. (See Exhibit B for additional information.) Ms. McCarthy, continued, “During the quarter we improved productivity on an Account Executive basis. Revenue per Account Executive (in the field for at least 9 months) increased significantly by 31.5%. We believe this enhanced level of productivity bodes well for the rest of the year. As we have previously disclosed, our expectation is that the second half of fiscal year 2008 should be stronger than the first half.” Jim Eckstaedt, executive vice president and chief financial officer of SM&A, said, “We are pleased that our focus on managing operational costs during the quarter we were able to hold our expense in check while making an investment in Strategic Advisors. With the events of recent quarters - specifically the management transition, the proxy contest, and their attendant costs - approaching resolution, going forward we believe we are better positioned to achieve more efficiencies as we continue the implementation of our strategic plan.” Stock Buyback: The Board of Directors is committed to effectively deploying cash and has reaffirmed its approval to repurchase shares of SM&A. During the quarter the Company purchased 241,200 shares of its stock in the open market at a total cost of $1.0 million, or an average price of $4.29 per share. The Company purchased close to the daily maximum volume limit under SEC rules during the quarter. The Company currently has approximately $4.8 million remaining in the share repurchase authorization. Cash and investments totaled $10.7 million at March 31, 2008. Acquisitions: “We are very pleased with the seamless integration into SM&A of our 2007 acquisitions, PPI and PMA; as well as the financial results that the integrated operations are currently exhibiting,” continued Mr. Eckstaedt. “PPI and PMA, contributed $3.8 million of total revenues in the first quarter, of which $2.0 million is considered non-organic, compared with $1.1 million during the comparable quarter a year ago from PPI alone from partial quarter operations. Amortization of intangibles associated with the two acquisitions was $111,000 in the quarter. Commencing with the next quarterly financial report, PPI will be considered fully integrated and will be categorized as part of organic operations. PMA will be considered organic with the announcement of the operational results for the upcoming fourth quarter. We are excited with the possibilities going forward.” Evolution of SM&A: We are in the process of transforming SM&A from a small proposal consulting firm into a winning “Project Lifecycle Consulting Company”. Within this transformation we have three overriding goals: First, to provide our clients products and services to enable their success in the pursuit, proposal, and performance phases. Second, we strive to create shareholder value by increasing revenue, earnings per share and free cash flow at a greater rate than revenue growth. Third, to establish a company environment that values and establishes SM&A as an employer of choice. As SM&A’s historical performance indicates, relying solely on traditional Competition Management and opportunistic/unstructured Program Services leads to a business with limited revenue predictability and growth. We seek to become, through Project Lifecycle Consulting, the company of choice to provide successful “Winning” projects. Our mission is to support our clients every step along the way as a value added partner. This would include the early identification of opportunities and the strategy to position our clients to take full advantage of those opportunities, the development and delivery of the proposal strategy and specific proposal documents, and to provide discreet capabilities designed to assist clients start-up and performance to contractual technical, cost, and schedule objectives. PURSUE – WIN – PERFORM. Within this transformation, the Competition Management element remains as the flagship offering of SM&A. Competition Management business continues to be a very strategic area within SM&A. Continued excellence within Competition Management will create the client relationships necessary for the anticipated growth within Program Services. We believe that Program Services represents a significantly larger addressable market than Competition Management. Our plan includes the development and acquisition of a comprehensive set of Program Services offerings that allows penetration into this considerably larger market and significantly improves our Competition Management offering due to the improved domain expertise. This is a transformation process that requires infrastructure and cultural changes. Without this transformation sustainable shareholder value cannot, and will not, be achieved. We are dedicated to becoming an industry leader by providing leading-edge services which are only offered in this comprehensive life cycle approach. “We have enormous confidence in the abilities of the employees of SM&A to implement the programs and initiatives we are putting in place”, Ms McCarthy said. “We are extremely optimistic about the future of our company. We believe its best years are yet ahead.” 2008 Guidance: The Company reiterates its expectation of revenue growth of approximately 10% in 2008 over the $98.3 million reported in 2007. The Company anticipates earnings per share for full year 2008 to be approximately $0.36 per share, including proxy costs. The increase in earnings guidance is attributable to an anticipated decrease in SG&A spending. Gross margin is expected to be between 39% and 40%. SG&A expenses including stock-based compensation and excluding the full effect for the additional earn-out expense related to the PPI acquisition is now estimated to be approximately 27% of revenue. The full year impact of the earn-out expense related to the PPI acquisition is estimated to be approximately $2.0 million or $0.06 per share. Cost associated with the proxy contest, which is included in the SG&A percentage above is estimated to be in the range of $450,000 to $500,000. Excluding the full effect for the additional earn-out expense, stock-based compensation and proxy contest costs, operating SG&A is estimated to be approximately 25% of revenue. The full year tax rate is estimated at 42%. Disclosure of Certain Financial Information In an effort to be transparent and to provide more meaningful comparative SG&A and diluted EPS, including the recurring stock-based compensation expense disclosure to our shareholders, we’ve provided a reconciliation of GAAP and non-GAAP information. Conference Call and Webcast: The Company will host a conference call at 1:30 p.m. Pacific Time on Thursday, May 8, to discuss the Company's first quarter 2008 financial results. The dial-in number for the conference call is 800-257-6566 for domestic participants and 303-262-2193, for international participants. The call will also be accessible via live webcast at the homepage of www.smawins.com by clicking on the Investor Relations tab and webcast link. A replay of the conference call will be available at www.smawins.com or by dialing 800-405-2236 or 303-590-3000, reference access code 11113199#. The call replay will be available for seven days. Note: A slide presentation providing selected financial data discussed during the conference call can be accessed at www.smawins.com by clicking on the Investor Relations tab. About SM&A: SM&A is the world's foremost management consulting firm providing leadership and mentoring solutions to PURSUE for business capture, WIN competitive procurements and profitably PERFORM on the projects and programs won. Our proven processes, people and tools have delivered significant top-line and bottom-line growth across markets, products and services. From the largest aerospace and defense contractors, through the major software providers, to healthcare and financial/audit service providers, SM&A is the partner many companies turn to WHEN THEY MUST WIN. ALL STOCKHOLDERS OF SM&A ARE ADVISED TO READ THE DEFINITIVE PROXY STATEMENT AND OTHER DOCUMENTS RELATED TO THE SOLICITATION OF PROXIES BY SM&A FOR USE AT THE 2008 ANNUAL MEETING OF STOCKHOLDERS OF SM&A. THEY CONTAIN IMPORTANT INFORMATION REGARDING THE ELECTION OF DIRECTORS AND OTHER MATTERS. THE DEFINITIVE PROXY STATEMENT AND FORM OF PROXY HAVE BEEN MAILED TO STOCKHOLDERS OF RECORD OF SM&A ALONG WITH OTHER RELEVANT DOCUMENTS. THEY ARE AVAILABLE AT NO CHARGE ON THE SEC’S WEBSITE AT HTTP://WWW.SEC.GOV IN ADDITION, SM&A WILL PROVIDE COPIES OF THE DEFINITIVE PROXY STATEMENT WITHOUT CHARGE UPON REQUEST. Some statements made in this news release refer to future actions, strategies, or results that involve a number of risks and uncertainties. Any number of factors could cause actual results to differ materially from expectations, including a shift in demand for SM&A's Competition Management and Program Services; fluctuations in the size, timing, and duration of client engagements; delays, cancellations, or shifts in emphasis for competitive procurement activities; declines in future defense, information technology, homeland security, new systems, and research and development expenditures aerospace and defense industries along with System Integration and Information Technology industries, and other risk factors listed in SM&A's SEC reports, including the report on Form 10-K for the year ended December 31, 2007. Actual results may differ materially from those expressed or implied. The company does not undertake any duty to update forward-looking statement. SM&A CONDENSED CONSOLIDATED BALANCE SHEETS (in thousands)     March 31,2008   December 31,2007 ASSETS (unaudited) Current assets: Cash and cash equivalents $ 3,251 $ 5,422 Investments 7,455 10,610 Accounts receivable, net 22,373 18,171 Prepaid expenses and other current assets   2,772     2,011   Total current assets 35,851 36,214 Fixed assets, net 3,306 3,399 Goodwill 8,374 8,278 Intangibles, net 1,781 1,892 Other assets   1,369     895   $ 50,681   $ 50,678   LIABILITIES AND STOCKHOLDERS’ EQUITY Current liabilities: Accounts payable $ 2,156 $ 1,925 Accrued compensation and related benefits 4,992 3,508 Accrued contingent consideration — 1,750 Other current liabilities   138     127   Total current liabilities 7,286 7,310 Other liabilities   748     785   Total liabilities 8,034 8,095   Commitments and contingencies   Stockholders’ equity: Preferred stock — — Common stock 2 2 Additional paid-in capital 46,048 45,450 Treasury stock (2,540 ) (1,506 ) Accumulated deficit   (863 )   (1,363 ) Total stockholders’ equity   42,647     42,583   $ 50,681   $ 50,678   SM&A CONDENSED CONSOLIDATED STATEMENTS OF INCOME (in thousands, except per share amounts) (UNAUDITED)     Three Months Ended March 31, 2008   2007   Revenue $ 25,423 $ 23,624 Cost of revenue   15,685   14,417 Gross margin 9,738 9,207   Selling, general and administrative expenses   8,957   6,894 Operating income 781 2,313   Interest income, net   95   143 Income before income taxes 876 2,456   Income tax expense   376   1,005   Net income $ 500 $ 1,451   Net income per share: Basic $ 0.03 $ 0.08 Diluted $ 0.03 $ 0.08   Shares used in calculating net income per share: Basic 18,990 18,609 Diluted 19,100 18,800 Exhibit A   SM&A DILUTED EPS NON-GAAP RECONCILIATION (in millions, except per share amounts) (UNAUDITED)     Three Months Ended March 31,2008   March 31,2007   December 31,2007   $   PerShare   $   PerShare   $   PerShare Diluted EPS (as reported)   $ 0.03   $ 0.08   $ 0.05   PPI earn-out $ 0.9 0.03 $ - - $ 1.0 0.03 Proxy contest cost 0.1 0.00 - - - - Company-wide offsite 1.1 0.03 - - - - Myers retirement - - 0.5 0.02 - - Myers legal fees - - 0.2 0.01 - - Management transition   -     -     -     -     0.4     0.01   Subtotal $ 2.1     0.06   $ 0.7     0.02   $ 1.4     0.04     Non-GAAP EPS (as adjusted) $ 0.09   $ 0.10   $ 0.09     Tax rate 42.9 % 40.9 % 45.5 % Shares used in calculating net income per diluted Share 19,100 18,800 19,113   Note: Sum of columns may not equal totals due to rounding. Per share data is shown net of tax. Exhibit B   SM&A SG&A NON-GAAP RECONCILIATION (in millions) (UNAUDITED)     Three Months Ended March 31,2008   March 31,2007   December 31,2007   $   %     $   %     $   %   Revenue $ 25.4   100 % $ 23.6   100 % $ 24.1   100 %                   SG&A (as reported)   9.0   35.2 %   6.9   29.2 %   8.0   33.2 %   Less: PPI Earn-Out   0.9   3.4 %   -   0.0 %   1.0   4.0 % SG&A less PPI earn-out   8.1   31.8 %   6.9   29.2 %   7.0   29.2 %   Less: Stock-based compensation 0.4 1.7 % 0.4 1.7 % 0.4 1.8 % Proxy contest cost 0.1 0.2 % - 0.0 % - 0.0 % Company-wide offsite 1.1 4.3 % - 0.0 % - 0.0 % Myers retirement - 0.0 % 0.5 2.1 % - 0.0 % Myers legal fees - 0.0 % 0.2 0.8 % - 0.0 % Management transition   -   0.0 %   -   0.0 %   0.4   1.6 % Subtotal $ 1.6 6.2 % $ 1.1 4.7 % $ 0.8 3.4 %                   Non-GAAP SG&A (as adjusted) $ 6.5   25.6 % $ 5.8   24.5 % $ 6.2   25.8 %

1 Year Wins Financial Chart

1 Year Wins Financial Chart

1 Month Wins Financial Chart

1 Month Wins Financial Chart

Your Recent History

Delayed Upgrade Clock